
Abstract
Dynamics of the terrestrial water surface impact hydrological connectivity. Compared with traditionally deployed water surface parameters, changes in the water-boundary more effectively account for the dynamics of water surface and depth resulting from hydrological variations. However, previous studies of hydrological connectivity generally applied only connectivity length or width parameters using the center line of the water body and therefore fail to fully capture the impact of water boundary dynamics. In this study, optimized water body extraction indices based on data obtained from remote sensing imagery are used to develop a novel metric that indicates water surface boundary dynamics and reveal surface hydrological connectivity changes in the Yangtze River Delta from 1990 to 2020. Detailed inter-annual and seasonal changes in the evolution of water body boundaries from a water surface perspective indicate an overall decline in hydrological connectivity against the background of climate change, increased urbanization, and dam construction. The declining trend in connectivity occurs in three phases, viz. from 1990 to 2003, a gradual decline is exhibited but with a very marked degree of inter-seasonal variability; between 2003 and 2012, connectivity remains relatively constant but with a reduced amplitude between seasons; further reductions in the magnitude of seasonal variations characterize the third phase, to 2020. Meanwhile, the stability of hydrological connectivity, indicated by the coefficient of variation, also exhibits marked spatial heterogeneity. Parts of the delta with more tributaries, including the Huaihe and southeastern basins, have lower stability (7.33 and 6.59, respectively) than the Yangtze basin (6.22). This study presents a novel metric to achieve greater precision in the monitoring of hydrological connectivity. Such information can be harnessed to improve regional ecological and water resource management.
Keywords
Introduction
Rivers form a central component of ecosystems and are essential to human survival. River flows maintain fluvial and terrestrial biodiversity, making essential contributions to large-scale biogeochemical cycles (Palmer and Ruhi, 2019). However, rivers are increasingly altered due to, inter alia, dam building, urbanization, and climate change, all of which change critical aspects of their hydrological connectivity (Li et al., 2021a; Nguyen et al., 2021). Changes in hydrological connectivity can further influence river–lake wetland system ecological processes, such as mass cycling (Palmer and Ruhi, 2019). Since hydrological connectivity is crucial to the function of a river and its ability to provide ecosystem services, connectivity changes can precipitate significant consequences.
Hydrological connectivity is broadly defined as the water-mediated transport of matter and energy through different components of the landscape (mainly rivers and lakes and their associated wetlands) (Bracken et al., 2013; Harvey et al., 2019; Saco et al., 2020; Li et al., 2021b). There has been increasing interest in hydrological connectivity (Czuba et al., 2019; Edward, 2020; Liu et al., 2020; Li et al., 2021b; Nguyen et al., 2021) with studies from such fields as landscape ecology (Jahanishakib et al., 2021), hydrology (Czuba et al., 2019), and geomorphology (Edward, 2020). However, the development of the connectivity concept is complicated by the connotational differences within and across specific fields (Nguyen et al., 2021). Different definitions of, and means of studying, hydrological connectivity in watersheds may result in inconsistent outcomes as research design varies (Bracken et al., 2013). For example, hydrological connectivity of surface water is primarily related to surface flow and the transfer of surface water across the Earth’s surface, such as rivers and lakes. Nevertheless, the hydrological connectivity of groundwater-surface water is the direction and magnitude of flow between water resources located above and below ground (Lamontagne et al., 2021). In this study, we focus on changes in hydrological connectivity caused by surface water dynamics in rivers and lakes.
Hydrological connectivity can be divided into structural connectivity and functional connectivity (Bracken and Croke, 2007). Structural connectivity includes lateral, vertical, and longitudinal connectivity, and studies of this type of connectivity have focused on examining its spatial patterns in three-dimensional natural ecosystems (Carrara et al., 2012; Merenlender and Matella, 2013). Research on functional connectivity is generally concerned with the interaction between spatial patterns of river networks and watershed or catchment processes leading to water transfers in a watershed (Turnbull et al., 2008; Shao et al., 2020). Based on the hypsographic curves (depth-area and depth-volume) (Olson, 1960), changes in the depth and area of the rivers and lakes caused by variations in water volume have the potential to alter the spatial patterns of hydrological connectivity in three-dimensional natural ecosystems. These changes can further facilitate the water-mediated transfers of energy, materials, and organisms. Consequently, both the structural and functional connectivity of the river–lake wetland system are affected when water volume changes in the system. On the other hand, although structural connectivity and functional connectivity co-exist and represent river network connectivity overall (Shao et al., 2020), both are closely related to flow, which is simply the continuous movement of water in runoff or open channels, often quantified as volume of water (Meals and Dressing, 2008). The change in water volume impacts the boundary of surface water and, therefore, the dynamic change in the surface water boundary can be used to examine the evolution of hydrological connectivity.
Various approaches have been proposed to monitor flow changes in different areas through field surveys or station observations (Brandis et al., 2018), hydrologic and hydraulic model simulations (Czuba et al., 2019; Li et al., 2021b), and remote sensing monitoring (Mateo et al., 2017). Data obtained from field surveys or measured at gauge stations have generally been used to monitor the flow and hydrological connectivity status of rivers and lakes (Lesack and Marsh, 2010; Epting et al., 2018). However, field-based observations may have shortcomings, such as the difficulty of constructing a monitoring network, and the fact that the expense and time-consuming nature of monitoring in remote watersheds results in their being under-represented in hydrological connectivity studies (Nguyen et al., 2021). Hydrologic and hydrodynamic models may be compromised due to input data availability and inaccuracy in investigating multi-scale hydrological connectivity. Given such considerations, remotely sensed data, especially given the increasing availability of cloud computing infrastructures, offer a potentially valuable means of analyzing time series of water surface change and hydrological connectivity at multiple scales, such as catchment and regional scales (Robinson et al., 2015; Mateo et al., 2017). However, water body extraction methods based on remote sensing data mostly use histogram threshold segmentation and water detection criteria (Deng et al., 2019; Sur et al., 2021), which leads to the inaccurate extraction of water bodies, especially in rivers with high turbidity. Accordingly, in this study, an integrated approach considering multiple methods and remote sensing products is used to achieve high-precision extraction of water body extent.
In terms of hydrological connectivity, metrics developed include integral connectivity scale lengths, relative surface connectivity functions, directional connectivity functions, geostatistical connectivity functions, and dynamic connectivity metrics (Nguyen et al., 2021). However, these metrics are mainly suitable for measuring small-scale floodplain hydrological connectivity and are less useful in characterizing large-scale regional and watershed hydrological connectivity. In addition, these metrics typically quantify the length of connectivity of the surface water body but fail to fully capture water boundary dynamics as a whole (Li et al., 2021b). Given that water boundary dynamics may impact habitat and biodiversity conservation—for example, amphibian species are especially sensitive to the stability of microhabitats along the river course (Moraes et al., 2016; Wu and Xu, 2023)—a more comprehensive and integrated metric for hydrological connectivity and stability suited to more precisely measuring the boundary of the water body is needed. Accordingly, in this study, the morphological distance transform is introduced into the measurement of hydrological connectivity (Yang et al., 2020), and a novel metric that indicates water surface boundary dynamics caused by water discharge changes is proposed to interpret the hydrological connectivity and applied to a highly altered river system, viz. the Yangtze River Delta (YRD).
As the most developed region in China, the YRD region is of paramount importance to economic growth and social modernization in China (Xu et al., 2021; Xiao et al., 2022). The region has experienced substantial growth in population and economic development during recent years, with increased numbers and sizes of urban areas. Human activities strongly impact the river-wetland system, for example, some tributaries are buried to reclaim the land for built-up development (Yang et al., 2016). Moreover, many rivers in the YRD region are impounded and regulated (Lu et al., 2020), while changes in rainfall due to global climate change may further affect hydrological connectivity which can, in turn, affect biodiversity and ecological functioning (e.g., fish and amphibian species diversity). For example, Liu and Wang (2010) recently observed that reduced hydrological connectivity in the Yangtze River resulted in a 38.1% reduction in fish diversity over the past three decades (Liu and Wang, 2010). Notably, amphibian diversity is particularly sensitive to changes in hydrological connectivity (Wright et al., 2020) and may seriously undermine ecological security. In addition, although the hydrology of the YRD has been well studied (e.g., Yu et al., 2022), it remains unclear how hydrological connectivity has evolved in response to the combined influences of dam construction, urbanization, and global climate change over the past 30 years.
Using water body information extracted from Landsat images, in this study we propose a novel metric that measures water surface boundary dynamics caused by water discharge changes to examine the evolution of hydrological connectivity of the complex river–lake wetland system of China’s YRD region over the past three decades. This study can provide theoretical and practical insights for aquatic habitat monitoring, biodiversity conservation, and sustainable development in the region. Specifically, the study aims to (1) present a novel metric that can be used to examine the multi-scale hydrological connectivity in a large river–lake wetland system; (2) analyze the dynamics of the regional hydrology connectivity considering global climate change, dam construction, and urban development; and (3) examine the spatial distribution of the regional hydrological stability.
Study area
The YRD is a highly developed region in eastern China and incorporates one direct-administrated municipality, viz. Shanghai, and three provinces, namely, Jiangsu, Anhui, and Zhejiang. The region spans three major watersheds, viz. the Yangtze River basin itself, as well as the Southeast basin, and the Huaihe River basin (Figure 1). The climate is subtropical monsoon with mean annual precipitation between 1000 and 1400 mm and mean annual temperature between 15 and 16°C (Xiao et al., 2022). The topography is mainly characterized by plains and relatively low elevation hills, with most of the area located at altitudes below 100 m. Along with the accelerating socio-economic development within recent years, there has been rapid population growth in the YRD region. According to China's National Bureau of Statistics, the total population of the region increased from 178 × 106 in 1990 to 235 × 106 in 2020, an increase of 32.02%. Moreover, the region has experienced rapid urbanization during the last three decades, with the built-up area increasing from 1.58 × 10⁴ km2 in 1990 to 4.29 × 10⁴ km2 in 2020. The rapid increase in both population and the built-up area has impacted ecosystems including rivers, lakes, and wetlands in the region (Yang et al., 2016). It is accepted that, for instance, observed declining hydrological connectivity has resulted from infilling or building over some tributaries (Gao et al., 2020). The YRD is therefore a highly suitable region to study the spatiotemporal dynamics of hydrological connectivity. Location of the study area.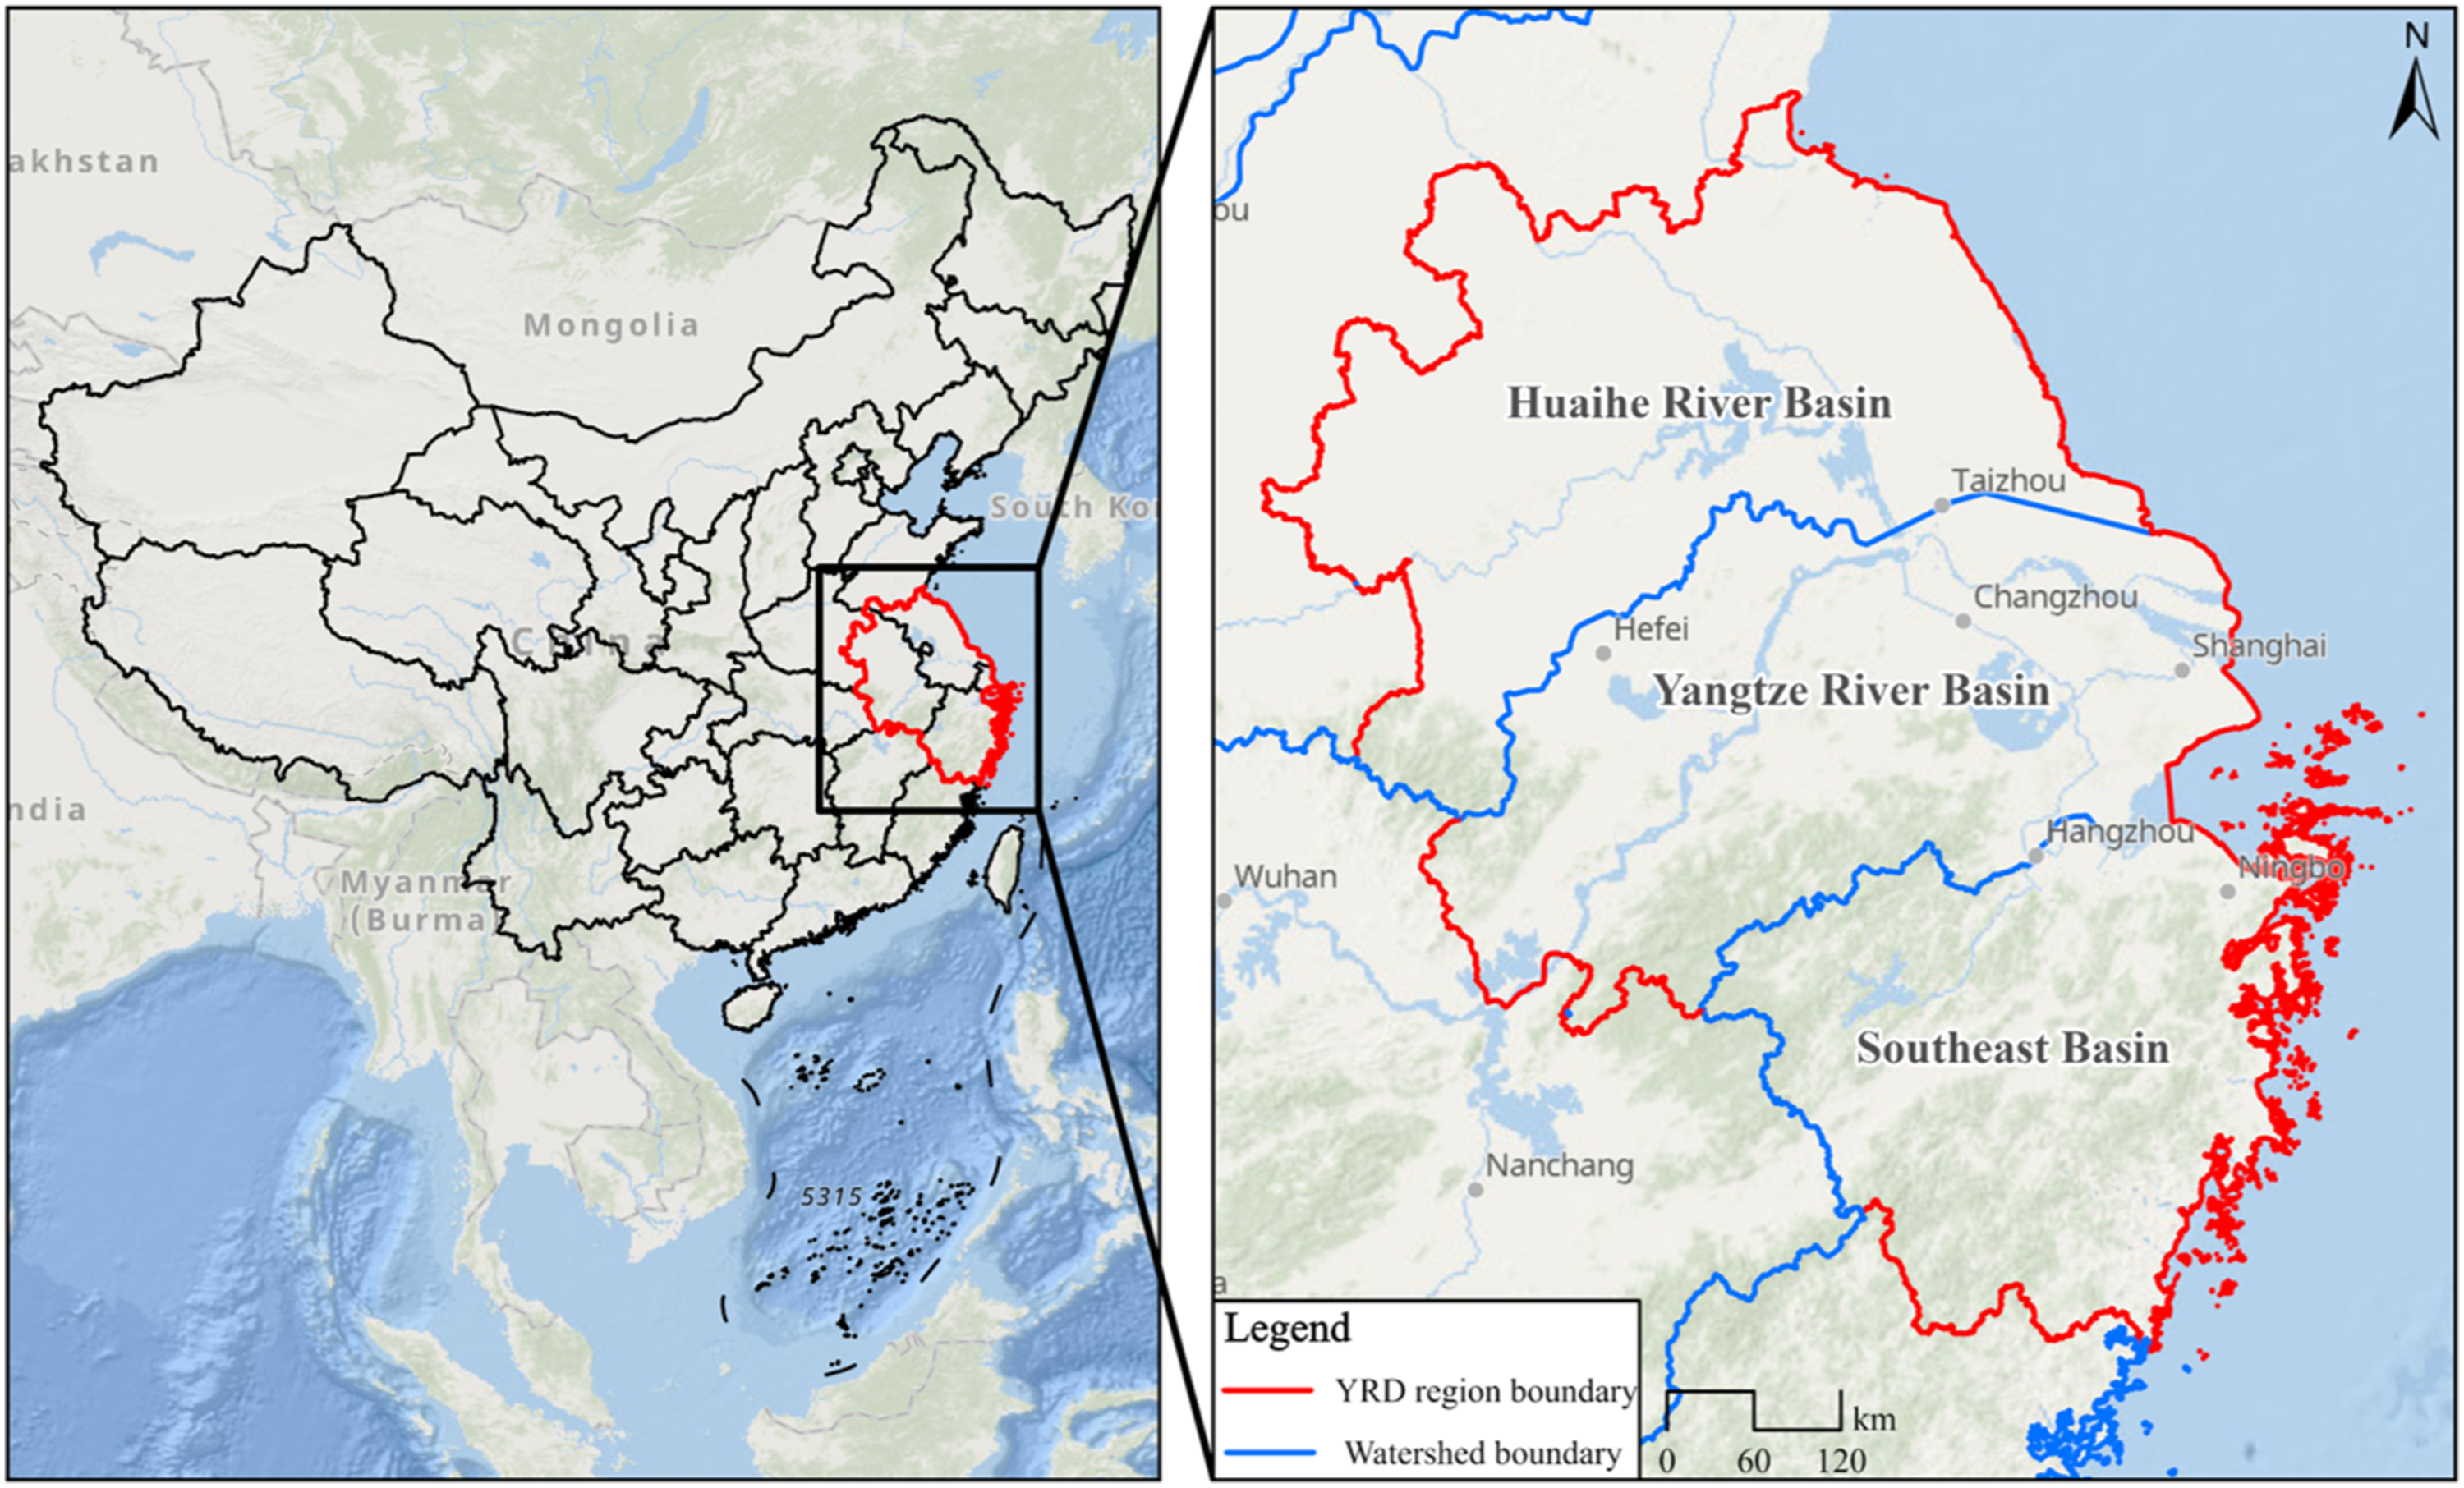
Methods
Data collection
Remote sensing imagery
This study utilized Landsat Thematic Mapper (TM), Enhanced Thematic Mapper (ETM+), and Operational Land Imager (OLI) surface reflectance and top of atmosphere (TOA) reflectance image collections available through the Google Earth Engine (GEE) for the study area from 1990 to 2020 (http://earthengine.google.org). These collections were originally acquired by the United States Geological Survey (http://landsat.usgs.gov/). The three visible bands with 30 m spatial resolution, along with the near-infrared band and two short-wave infrared bands, were employed here (Deng et al., 2019). In addition, the Shuttle Radar Topography Mission (SRTM) V3 product with a resolution of one arc-second (approximately 30 m), originally acquired by NASA (https://cmr.earthdata.nasa.gov/search/concepts/C1000000240LPDAAC_ECS.html), was assembled from the GEE. Finally, the Joint Research Centre of European Commission (JRC) Global Surface Water Monthly Water History V1.3 dataset, initially generated from four million Landsat images by the JRC, was obtained from the GEE (https://developers.google.cn/earthengine/datasets/catalog/JRC_GSW1_3_MonthlyHistory?hl=en).
Precipitation, land cover, and dam data
The precipitation data in 1990–2020 were assembled from the National Earth System Science Data Center of China (http://www.geodata.cn/). The 30 m annual land cover datasets in 1990–2020 were collected from Yang and Huang (2021) (https://zenodo.org/record/5210928#.Ys0lkWBBybg) followed by clipping of the precipitation and land cover data to the study area. Finally, the dam data for 1990–2020 were acquired from the China Water Statistical Yearbook of the National Bureau of Statistics of China (http://www.stats.gov.cn/).
Basic geographical data
The vector administrative boundary and watershed boundary datasets were acquired from Resource and Environment Science and Data Center of the Chinese Academy of Sciences (https://www.resdc.cn/).
Image preprocessing
When using remote sensor images to extract surface water bodies, the existence of shadows from terrain and cloud may result in the misclassification due to the spectral similarity (Feyisa et al., 2014). Therefore, we selected the images from 1990 to 2020 for spring (March to June), summer (June to September), autumn (September to December), and winter (December to March), according to the Landsat TM, ETM+, and OLI quality assessment (QA) bands, while masking for clouds in the GEE (Figure 2(a)) (Gorelick et al., 2017). Meanwhile, we applied multi-temporal regression and a regularization method to process the strip issue for Landsat ETM + images (Zeng et al., 2013). SRTM DEM data were used to minimize the influence of hill shadows, and shadow pixels were removed where slope was greater than 20° (Li and Sheng, 2012; Xu et al., 2021). Structure of the methodology employed and workflow for (a) remote sensor image processing; (b) surface water body extraction; and (c) hydrological connectivity calculations. (Note: SRTM is the shuttle radar topography mission; MNDWI is the modified normalized difference water index; NDVI is the normalized difference vegetation index; EVI is the enhanced vegetation index; JRC is the Joint Research Centre of European Commission).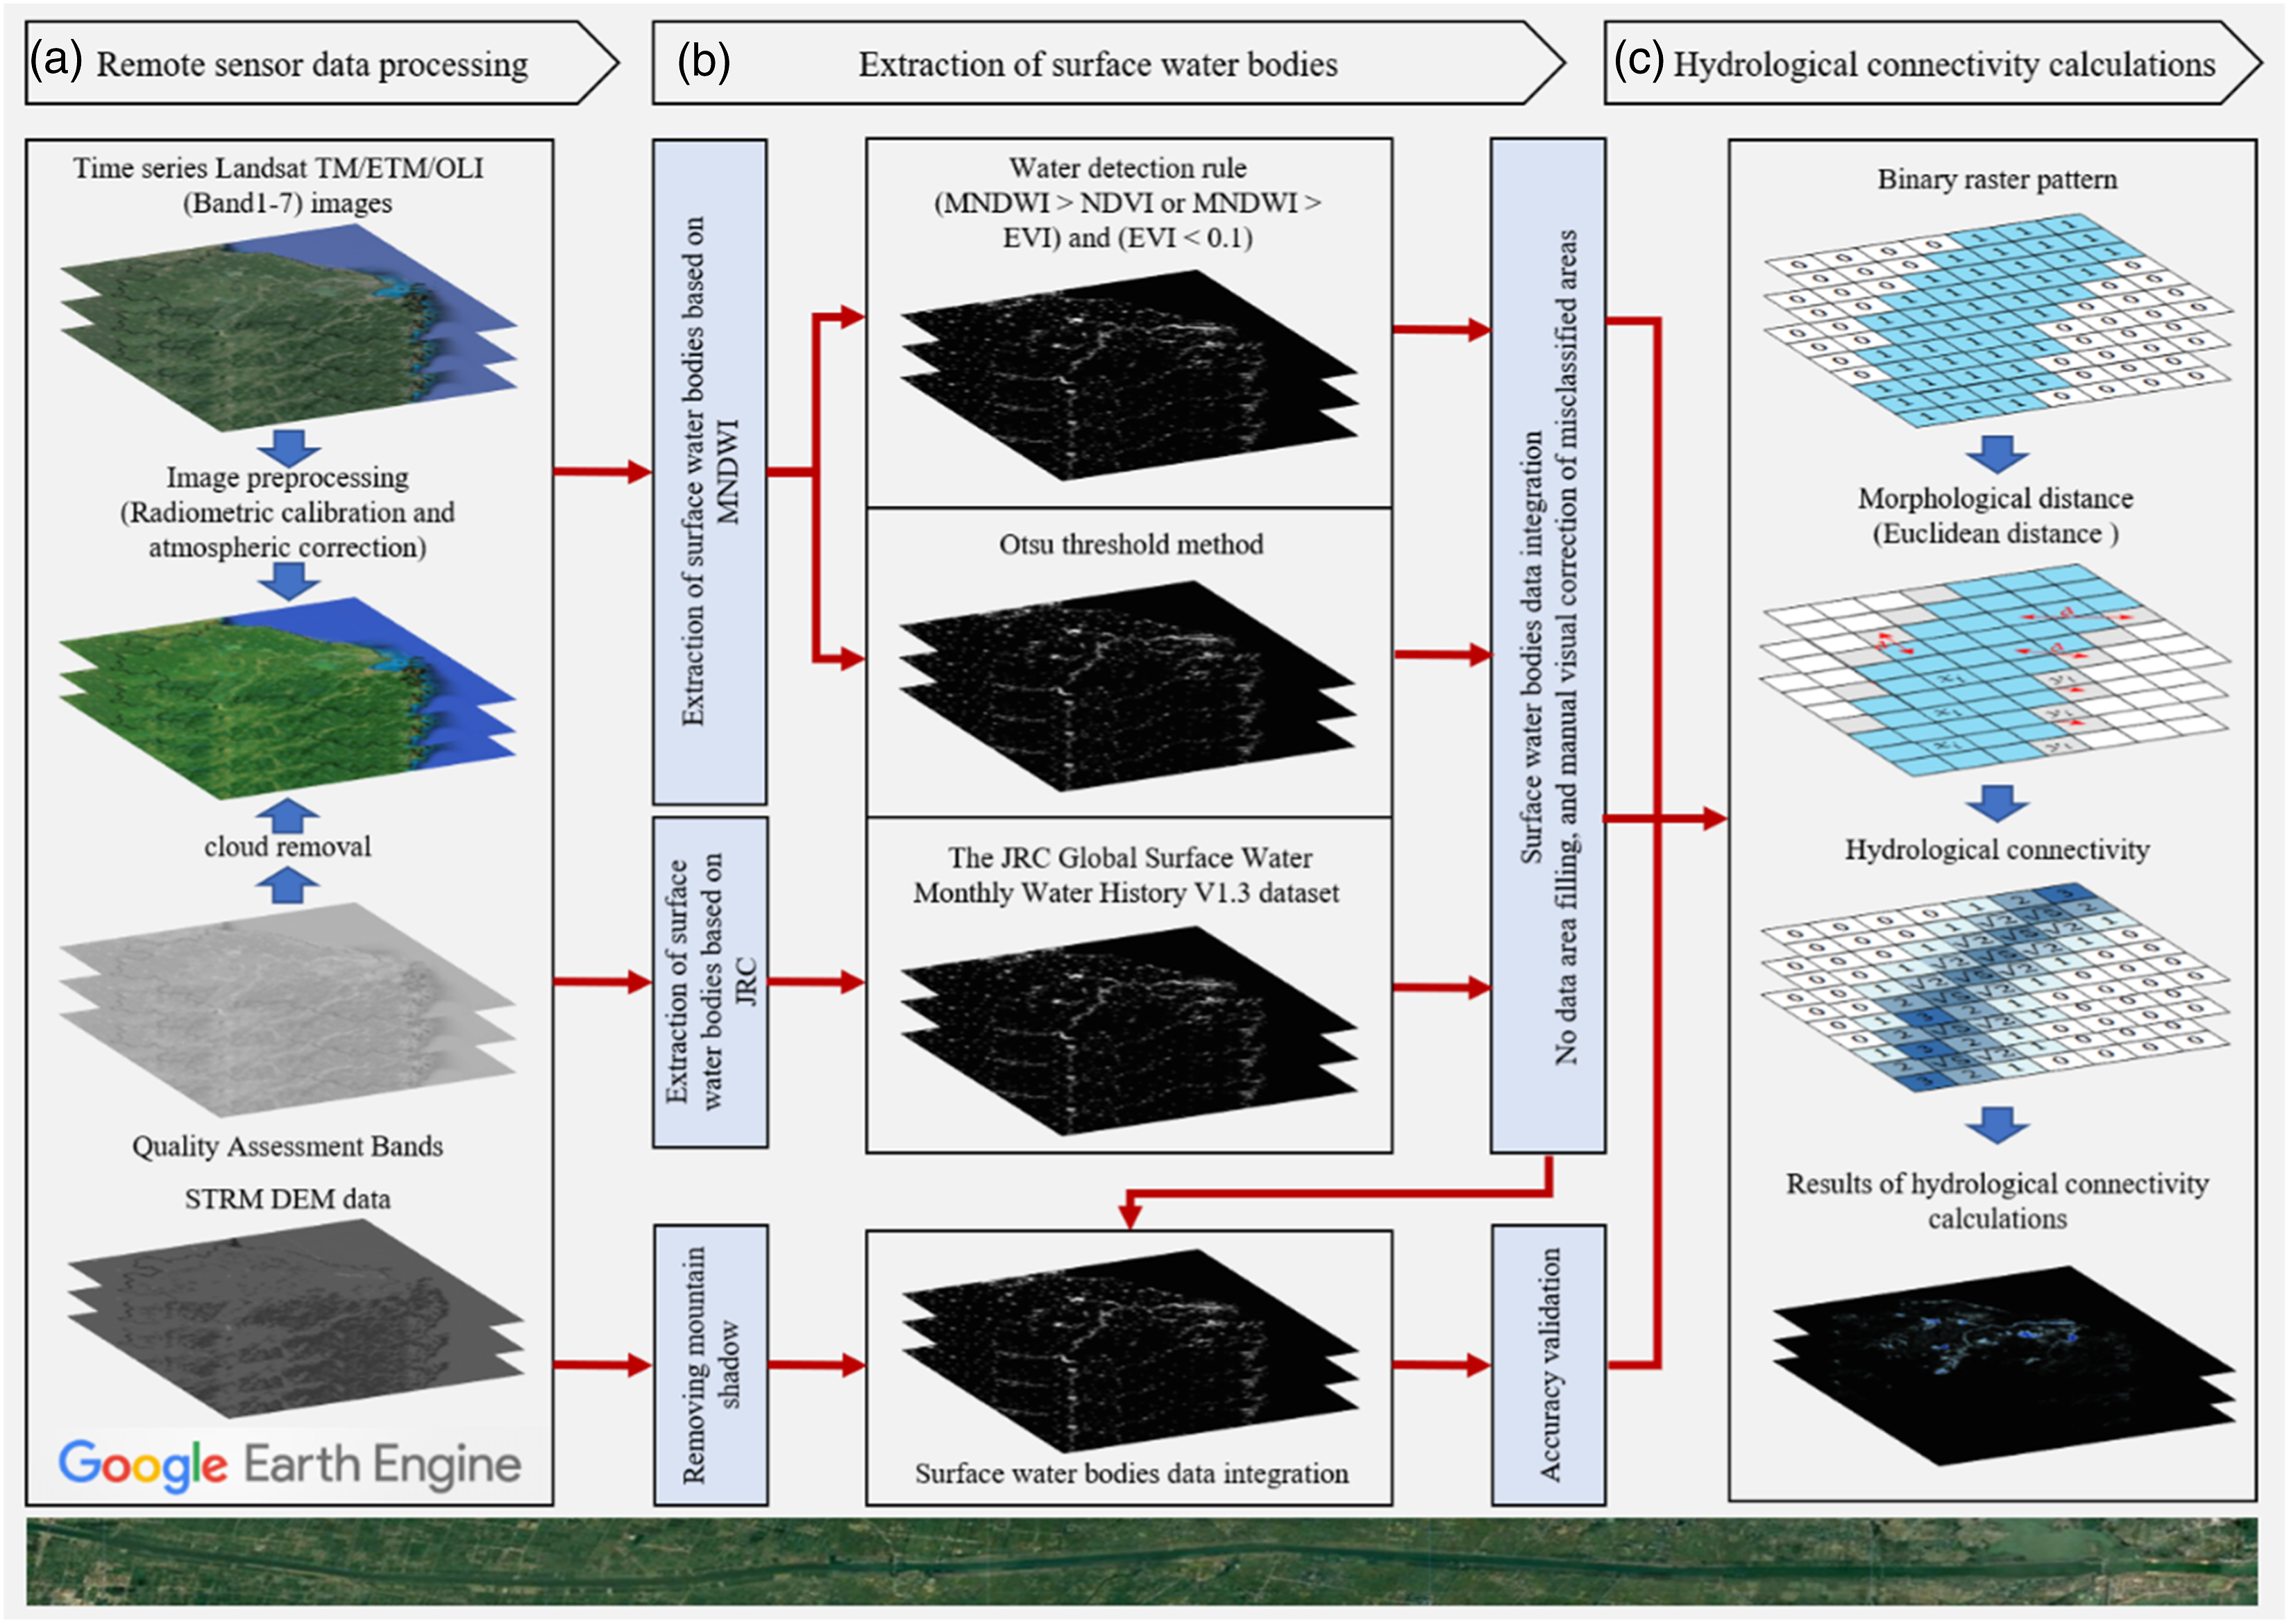
Seasonal surface water extraction
During the past few years, a variety of methods and algorithms based on remote sensor image processing have been developed for surface water extraction, such as water detection criteria and the Otsu threshold method (Deng et al., 2019; Sur et al., 2021; Zou et al., 2017). However, our initial experiments suggested that these methods may not be able to generate genuinely reliable outcomes yielding, in some cases, incomplete surface water extraction (and see Deng et al., 2019; Zhou et al., 2021). With regards to rivers, missing parts occurred, regardless of their width, at the same location during different seasons. And for lakes, in the transition zone where a river discharges into a lake with highly turbid water or into a deep, lowly turbid lake, the water body becomes difficult to detect (Zhou et al., 2021), a finding confirmed by other studies (e.g., Deng et al., 2019). To account for the above limitations, a novel surface water extraction approach is proposed for surface water products that combines two surface water extraction methods (i.e., water detection criteria and the Otsu threshold method) with JRC surface products (Figure 2(b)). We further used this new method to extract seasonal surface water bodies (spring, summer, autumn, and winter). Meanwhile, in order to minimize the mislabeling of non-water pixels as water pixels, we extracted water bodies based on the frequency of water body occurrences, that is, water bodies that exist for more than 1.5 months within the 3 months that constitute each of the four seasons (Bishop-Taylor et al., 2017). Figures 2(b) and 2(c) illustrate how the new surface water body extraction method and hydrological connectivity are calculated.
Calculating MNDWI
Based on the Modified Normalized Difference Water Index (NDWI), MacFeeters (1995) developed a method to extract surface water bodies that considers the difference between the water reflectivity in the green band and near-infrared band of Landsat imagery. However, Xu (2006) suggested that the NDWI can lead to misclassification due to the radiation from built-up surfaces and therefore proposed a modified method, MNDWI:

Water extraction with water detection criteria
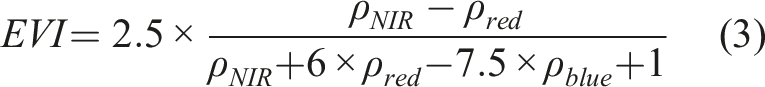
The equations for calculating the NDVI and Enhanced Vegetation Index (EVI) are as follows:

Calculating the Otsu threshold
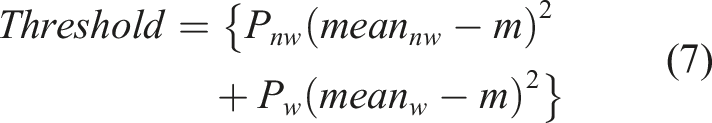
The Otsu approach is based on a histogram-based threshold aiming to find a critical value which divides the pixel distribution of an image into two classes (i.e., background and foreground) so as to minimize the between-class variance and maximize the difference between classes. This method has been widely applied for surface water extraction (Sur et al., 2021). Therefore, after computing MNDWI, the Otsu method was used to extract surface water. The equation for computing the optimal threshold for any MNDWI images is as follows (Sur et al., 2021):


Surface water extraction from the JRC dataset
We first selected the JRC historical surface water data from 1990 to 2020 (see Section Remote sensing imagery) and then extracted the seasonal water body product for the study area. Finally, we reclassified the “water” class to 1, and the “no-data” and “non-water” classes to 0, generating a dry–wet binary state raster dataset for further processing.
Generating synthetic surface water bodies
Firstly, the results of the water body extracted using the water detection criteria and Otsu method were reclassified by setting the “water” class to 1 and the “no-data” and “non-water” classes to 0. We used the maximum value composite method to combine the multiple water body data extracted by the authors (see Sections Water extraction with water detection criteria and Calculating the Otsu threshold) and the JRC surface water data product. The final water body extraction calculation equation is as follows:

The visual inspection method was used to evaluate the accuracy of the extracted surface water bodies by referring to the water information from the high-resolution Google Earth images (Deng et al., 2019). During this process, considering the strong dynamic changes in the extent of surface water bodies, the Google Earth images and Landsat images should be produced at the same date and have a consistent temporal resolution. We randomly generated 2000 test samples in the study area and then visually checked these samples.
Hydrological connectivity metrics
The water surface that can be easily monitored becomes a critical parameter for quantifying hydrological connectivity (Nguyen et al., 2021). However, compared with traditionally deployed water surface parameters (i.e., length and width of water surface), changes in the water-boundary more effectively account for the dynamics of water surface and depth caused by hydrological variations (as shown in Figure 3). Water boundaries may exhibit substantial variability in response periods of drought or higher rainfall. For example, in the dry season, as shown from Figure 3(a), (b), and (c), water depth and surface area decrease, with a corresponding change in the water boundary, while in the rainy season, both water surface area and depth increase, causing the river and lake boundaries to expand (Figure 3(d), (e), (f)). Therefore, we propose a new hydrological connectivity metric to quantify regional hydrological connectivity by converting connectivity distance to the Euclidean distance. A schematic illustration of the hydrological connectivity changes during dry (a–c) and rainy seasons (d–f).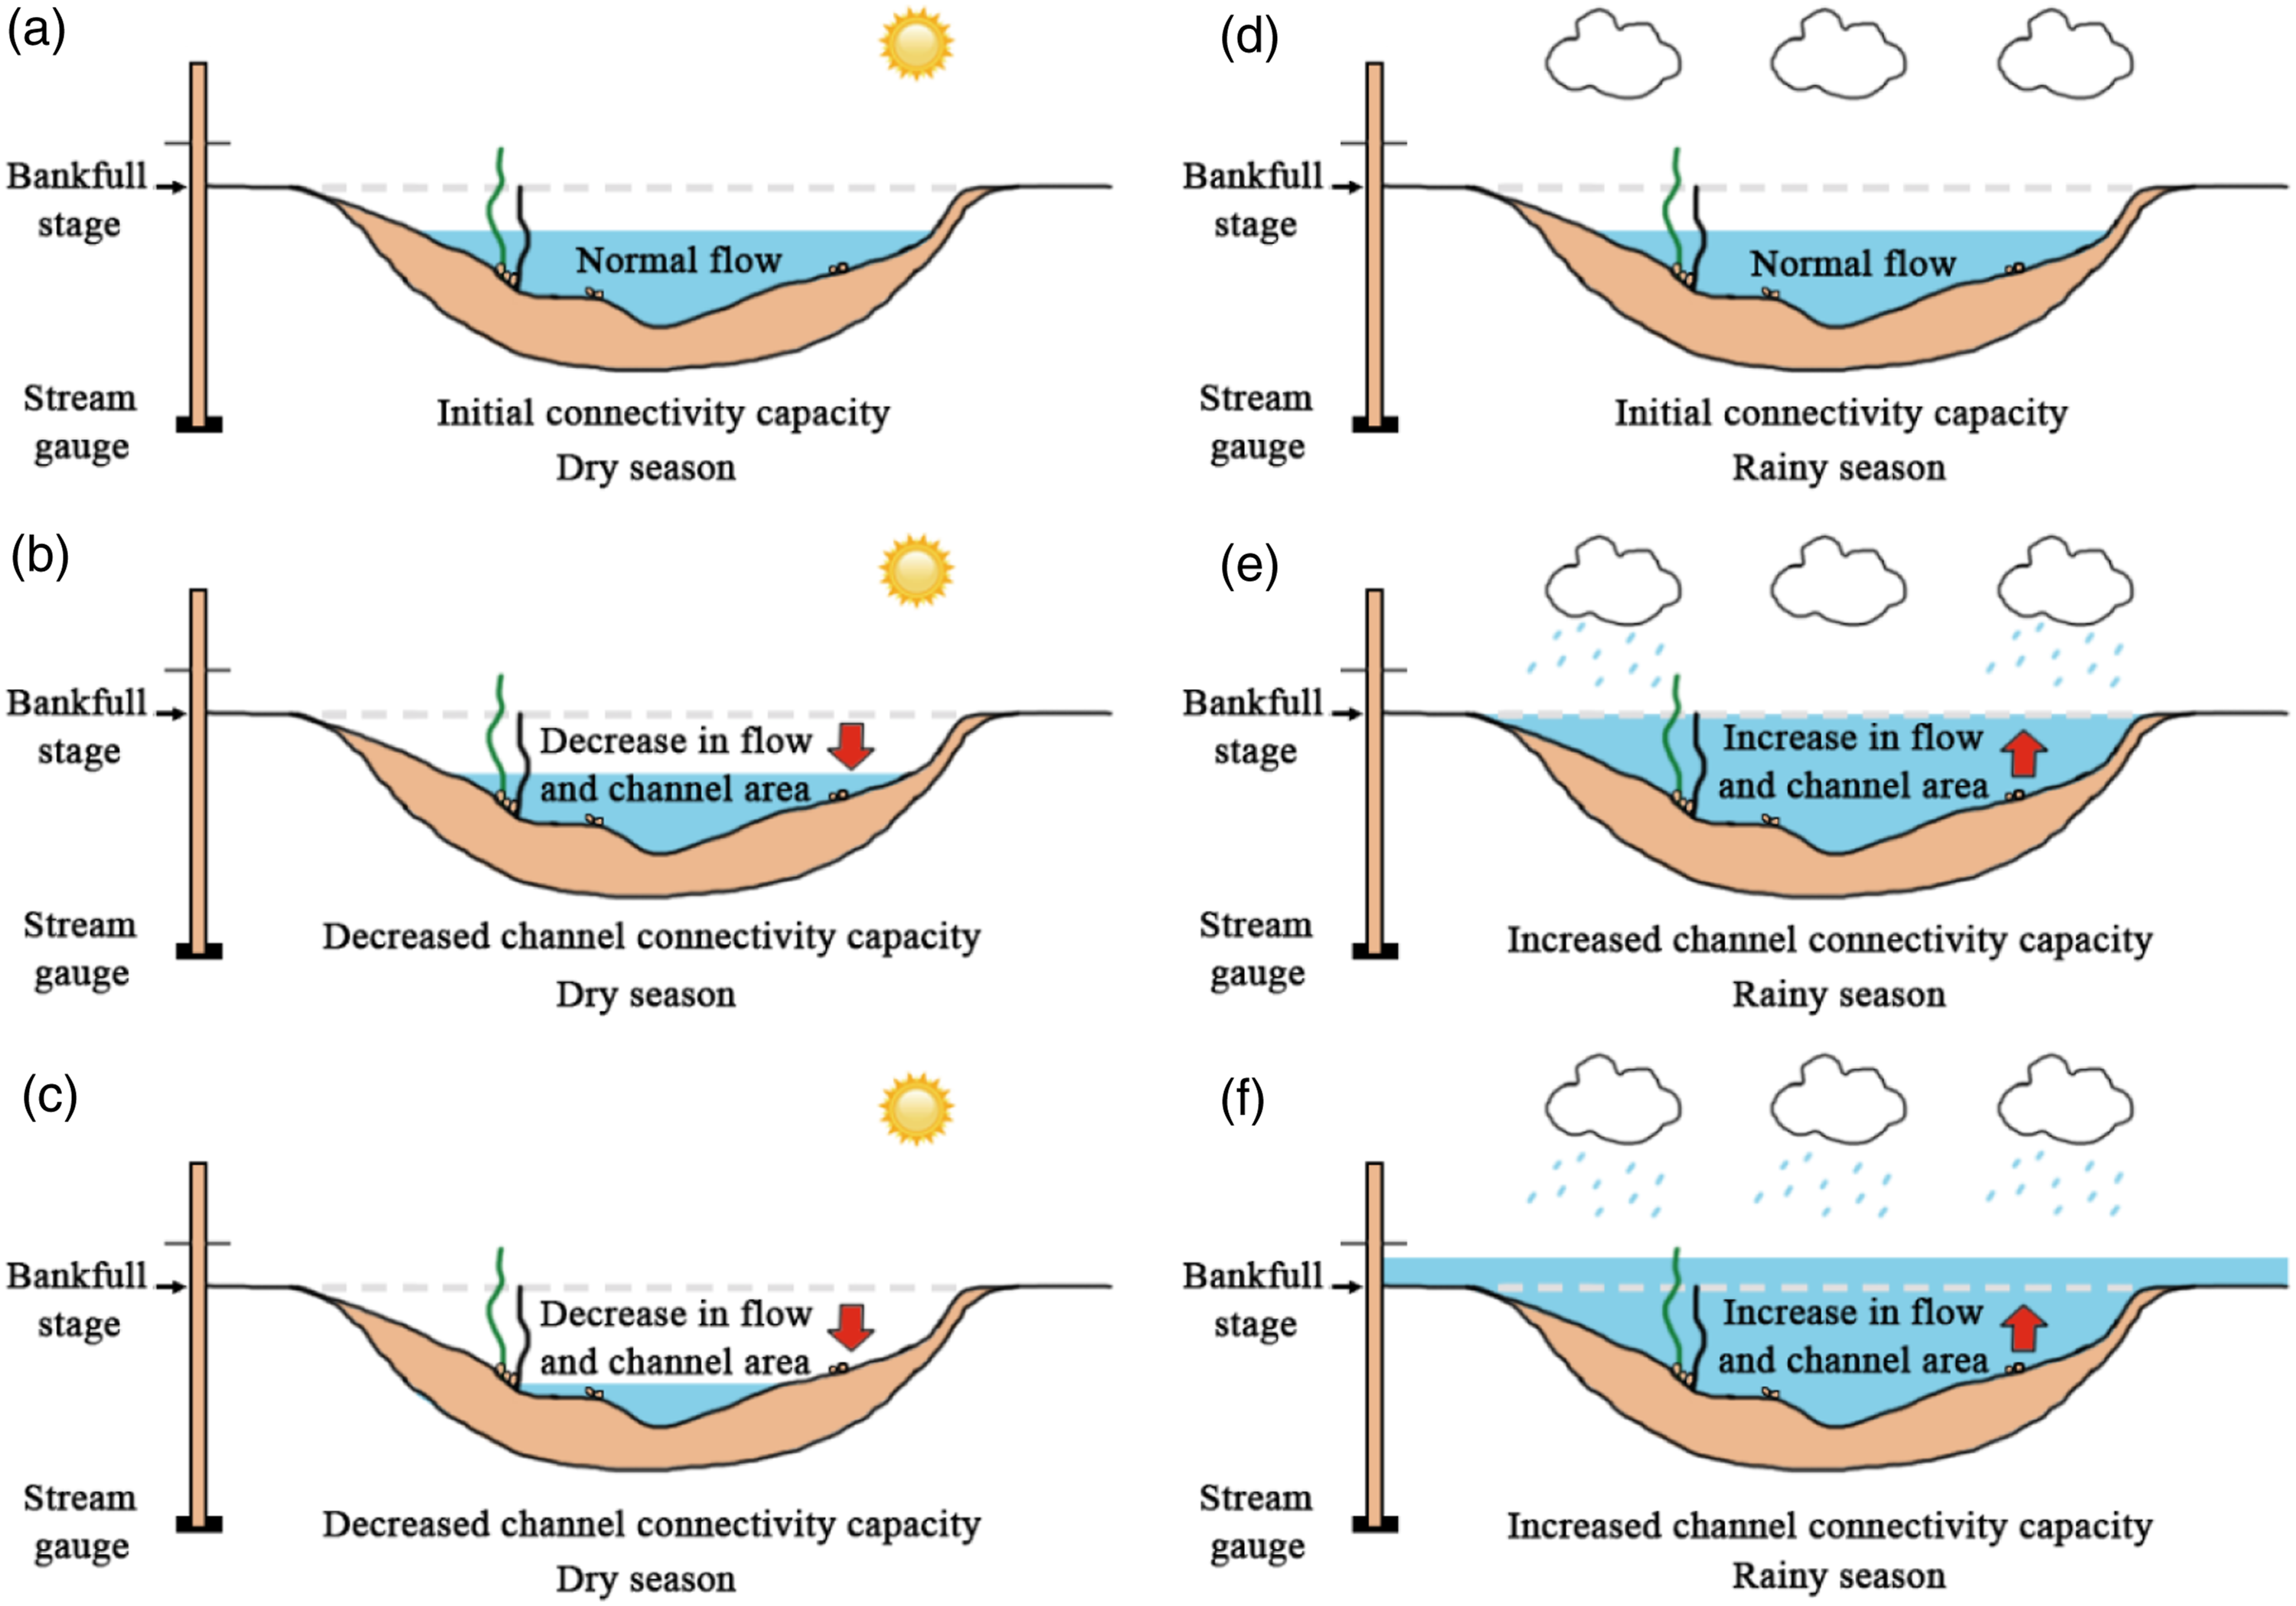
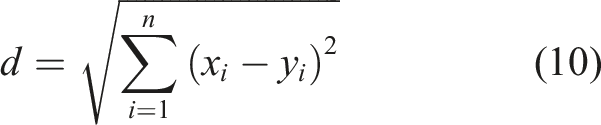
Specifically, let Z be the set of seasonal surface water (the surface of water bodies) pixels, which are the binary images consisting of 0 (non-water) and 1 (water) (Figure 4(a)). Let D be one of the images in the set of Z, x be a water pixel in the image, and y be a non-water pixel (Western et al., 2001). The surface hydrological connectivity HC(x) is then calculated using the Euclidean distance from each water pixel (x
i
) to its nearest non-water pixel (y
i
) in D (Yang et al., 2020). Here, the Euclidean distances were obtained by morphological distance transformation in MATLAB R2021b. The hydrological connectivity HC(x) is calculated as follows: A schematic illustration of the morphological distance transformation.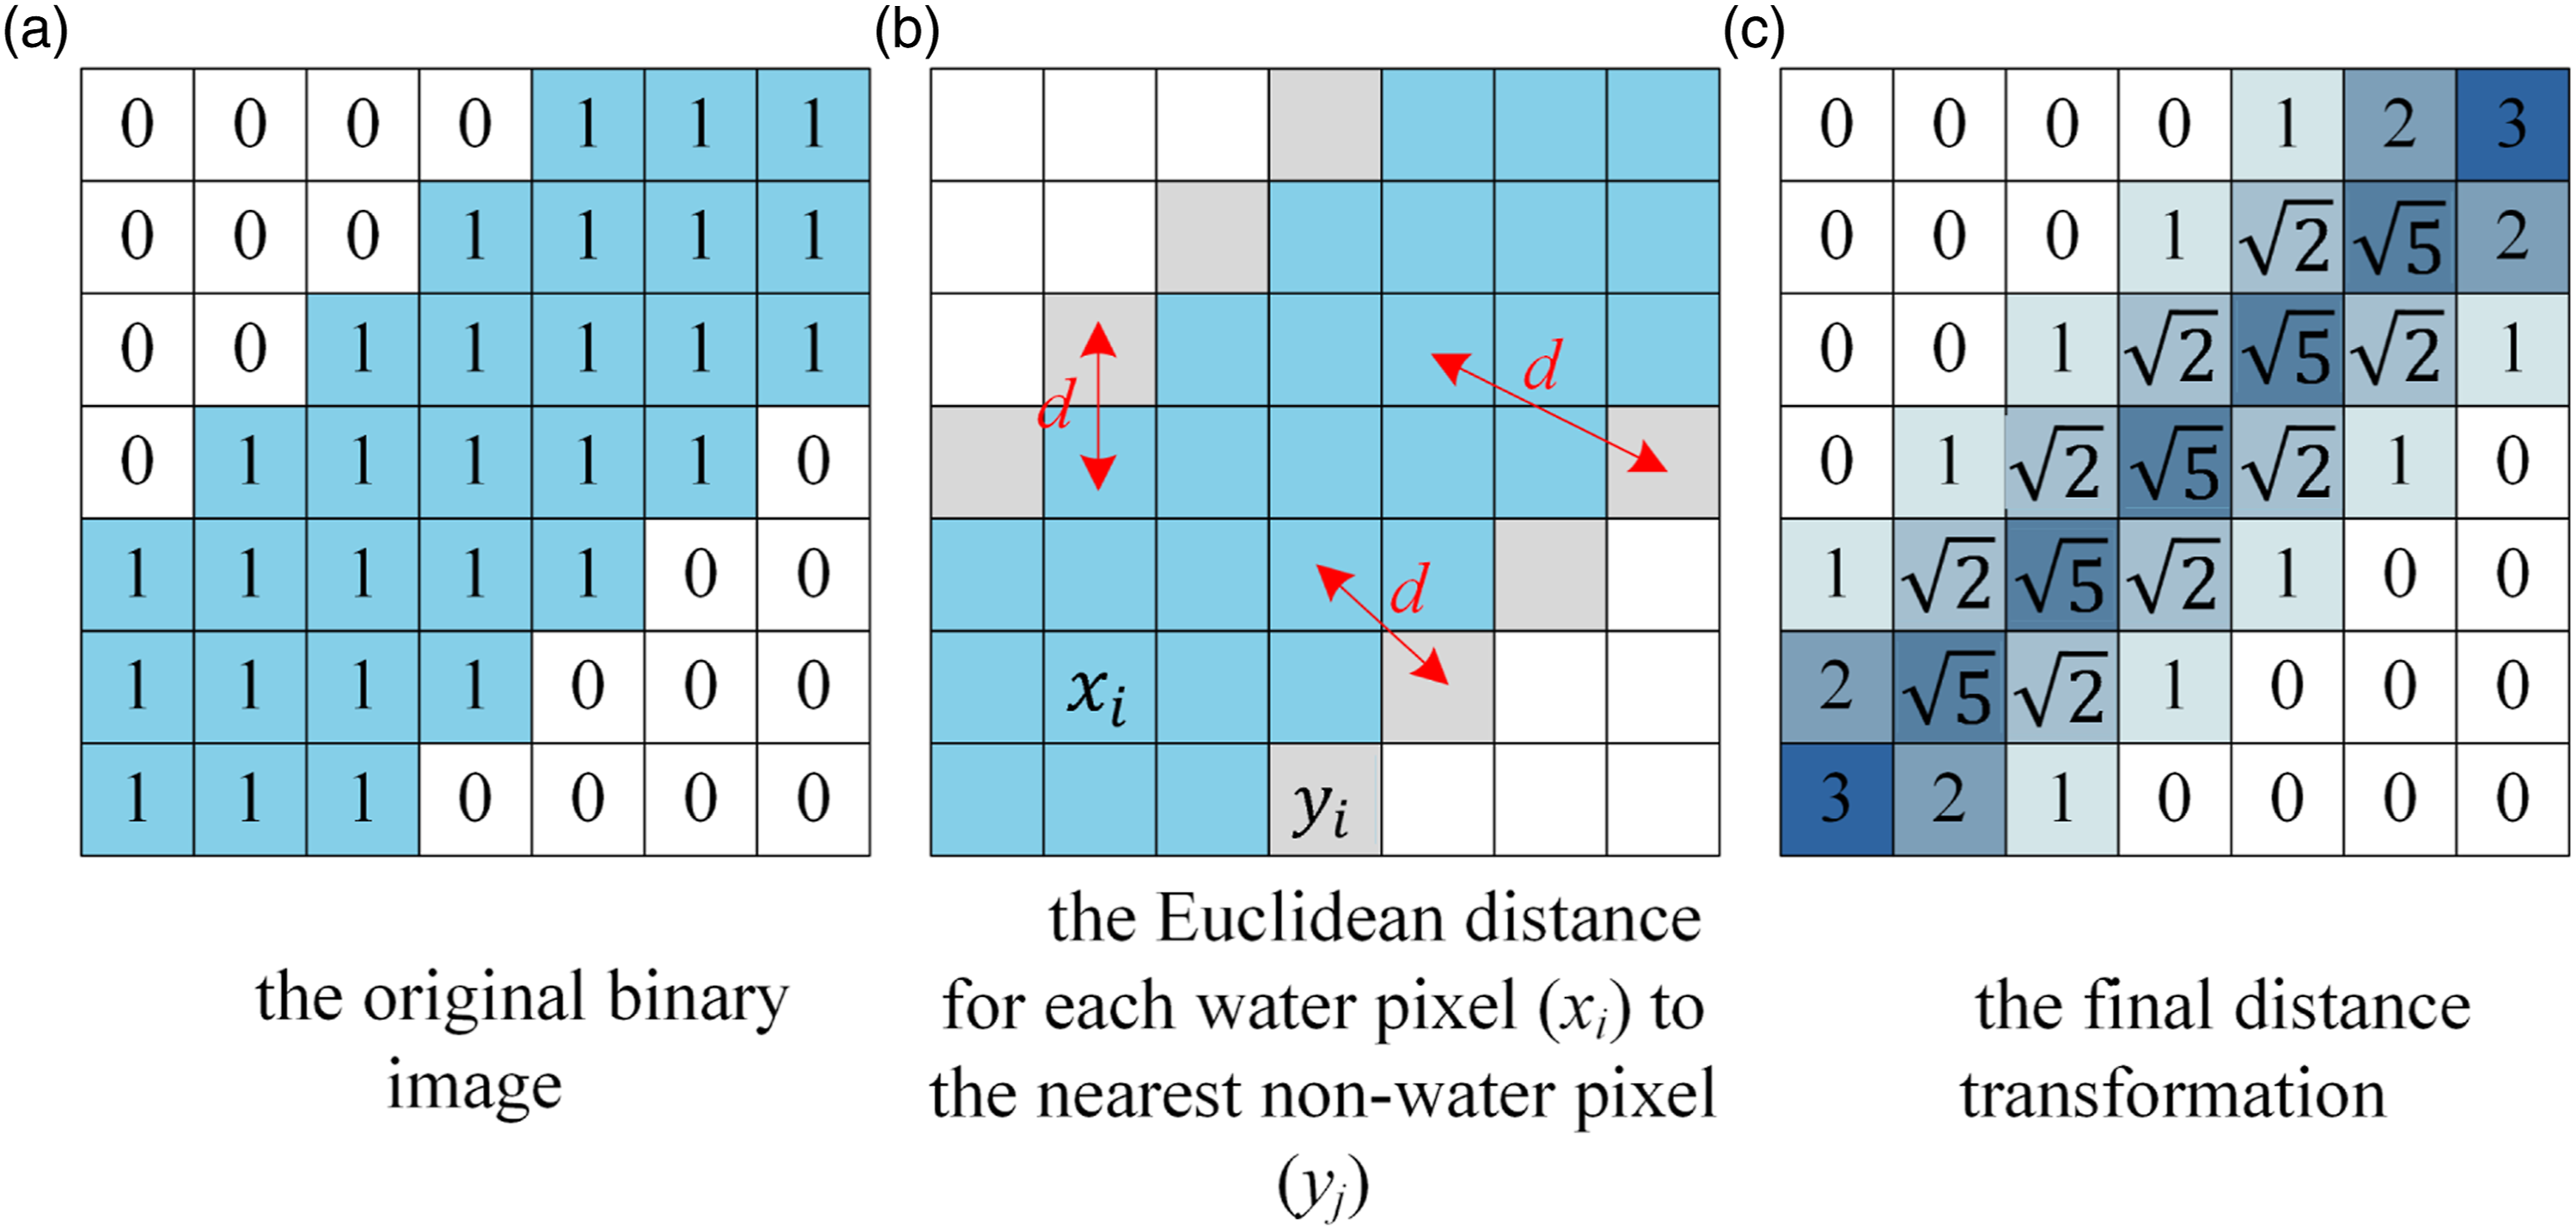

Hydrological connectivity stability
Stability is an important indicator of the changes in hydrological connectivity that captures routine temporal variations in flow. Understanding the spatiotemporal changes and driving mechanisms of hydrological connectivity is critical to the implementation of hydrological connectivity restoration efforts, and stability is widely evaluated using the variation coefficient method (Jiang et al., 2020; Carraro and Altermatt, 2022). Therefore, we used the coefficient of variation to quantify pixel-based stability of hydrological connectivity in the YRD region. The specific calculation method can be expressed as follows:

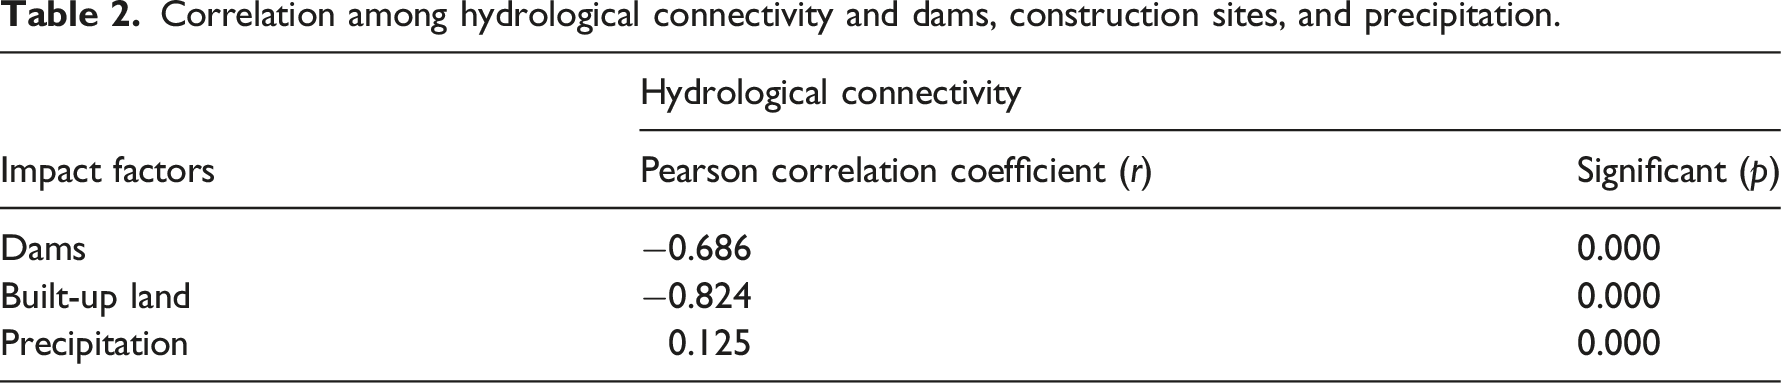
In addition, Pearson correlation analysis was used to explore the potential factors of influence on hydrological connectivity changes (Pearson, 1896). Variables including precipitation, built-up land area, and the number of dams, which may be attributed to changes in hydrological connectivity, were selected for this correlation analysis.
Results
Accuracy evaluation of surface water extraction
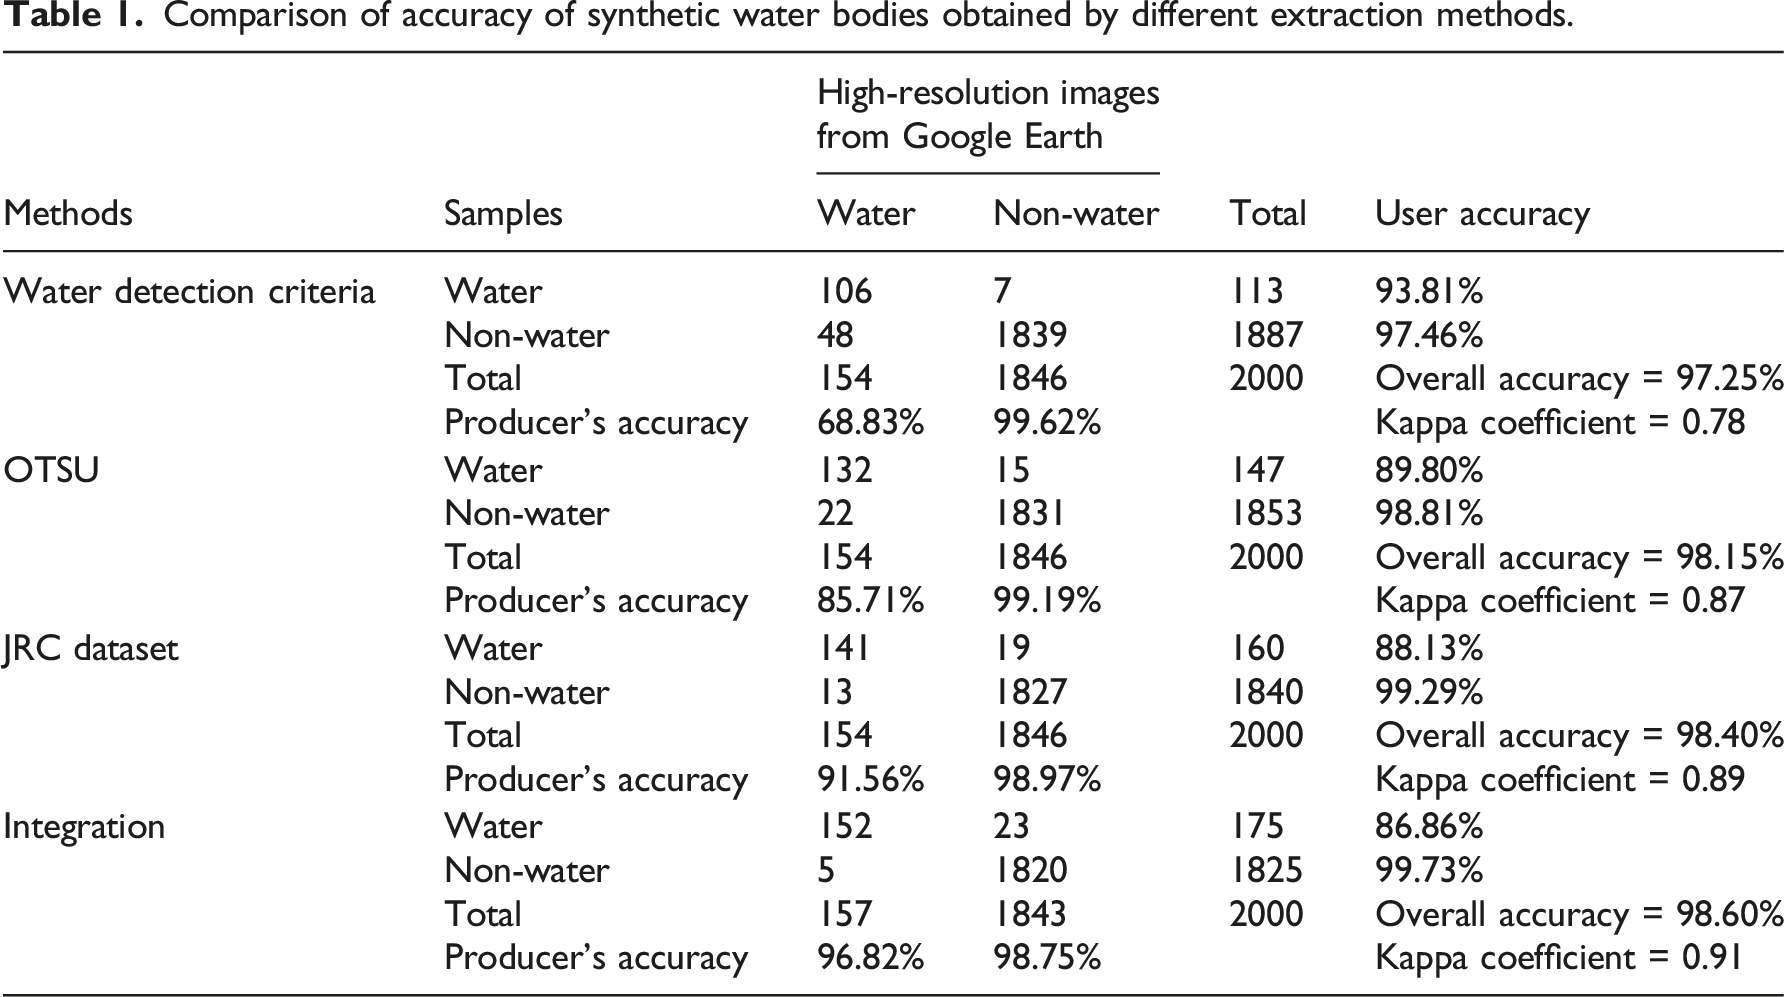
As reported elsewhere (e.g., Zhou et al., 2021), surface water extraction using a single water body method fails to produce consistent and reliable results in the study area (Figure 5). In order to accurately extract the surface water bodies, we propose a new surface water extraction method. The surface water bodies extracted using this newly proposed method appropriately connect the broken segments of water bodies (Figure 5). Meanwhile, the overall accuracy and the overall Kappa coefficient reached 98.60% and 0.908, respectively (Table 1), suggesting that the surface water body product generated using the novel method is of high accuracy. Comparison of the surface water bodies extracted using different approaches. (Note: JRC is the Joint Research Centre of European Commission; MNDWI is the modified normalized difference water index; NDVI is the normalized difference vegetation index; EVI is the enhanced vegetation index; OTSU is the Otsu threshold method). Comparison of accuracy of synthetic water bodies obtained by different extraction methods.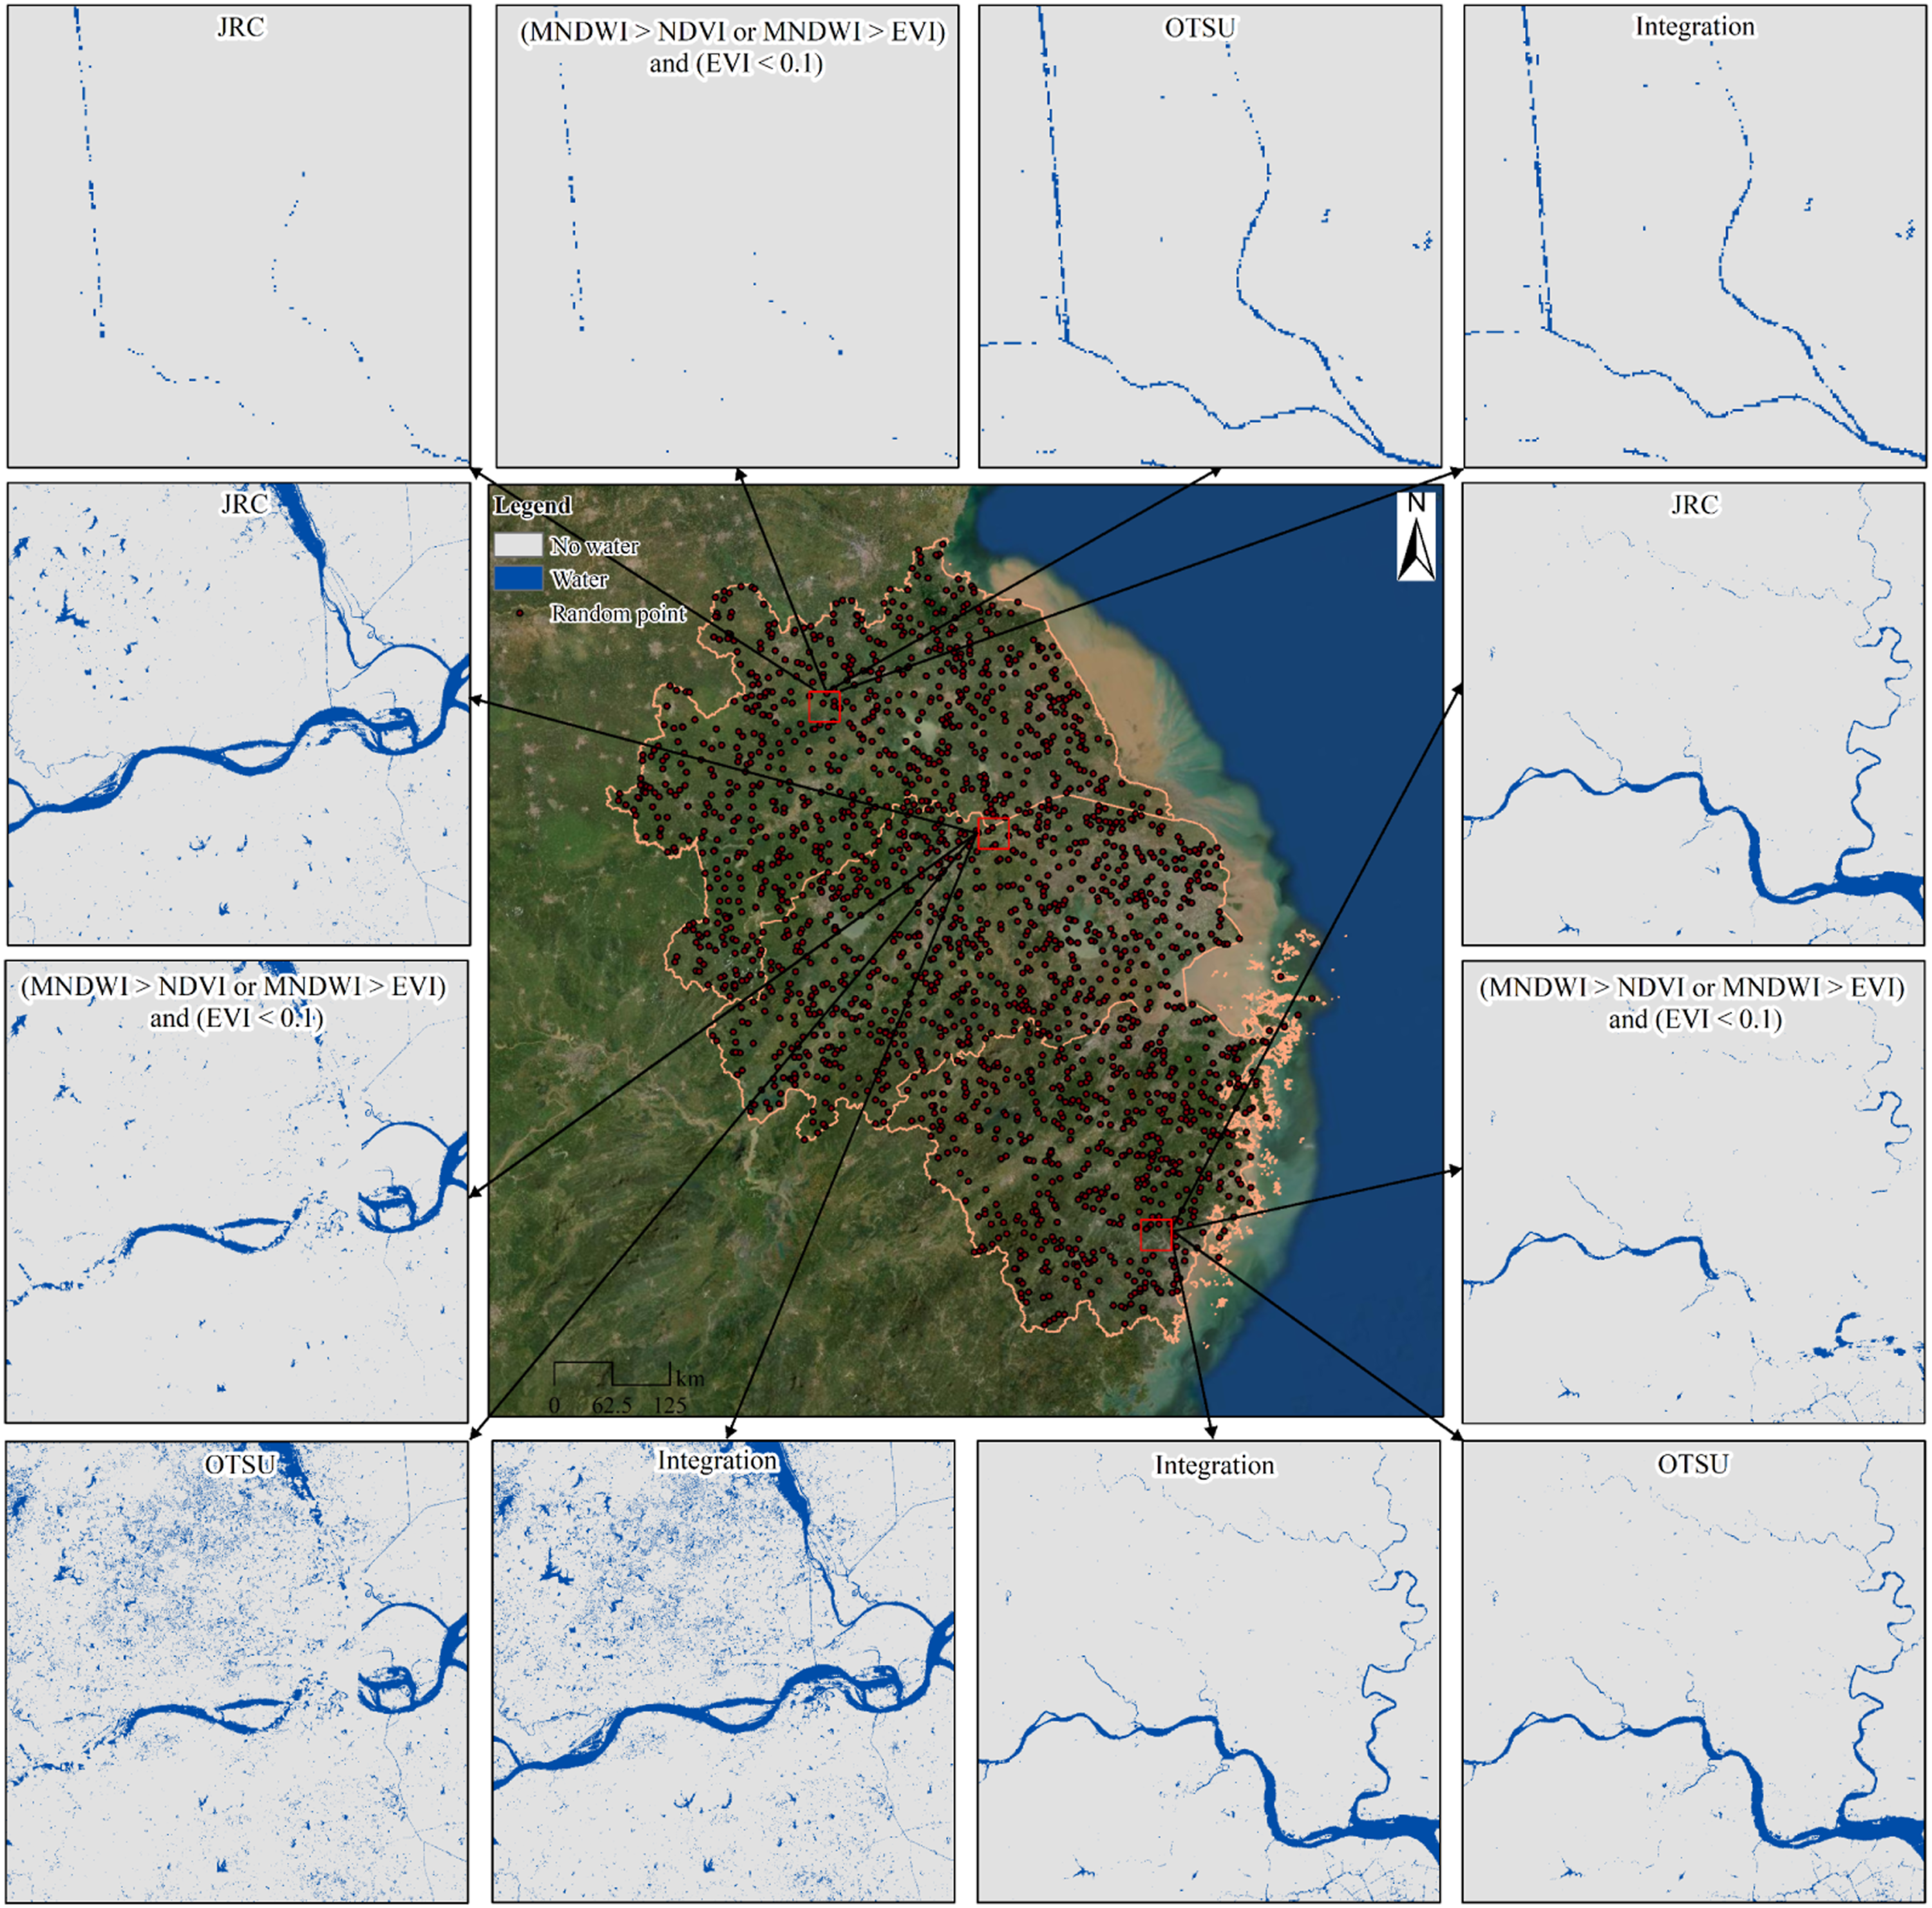
Spatiotemporal patterns of hydrological connectivity
Results show that, in the case of Spring, the boundary of the YRD hydrological connectivity has retreated by 9.83 m (Euclidean distance) over the past 30 years (Figure 6(a)), from 33.94 m in 1990 to 24.11 m in 2020. Meanwhile, the data indicate that seasonal variation amplitude has become substantially reduced (Figure 6(a)) over that period. Hydrological connectivity changes can be identified in three stages since 1990, with initially very marked fluctuations (1990–2003), followed by moderate fluctuations (2003–2012), and then more muted fluctuations (2012–2020). This trend is coincident with the timing of the construction and initiation of water storage (2003) in the Three Gorges Dam located upstream of the YRD (Li et al., 2021b) but also relates to the introduction of socio-economic development strategies after 2012, thereby also emphasizing the greater importance attached to eco-environmental conservation by the Chinese government. Spatiotemporal evolution patterns of hydrological connectivity in the YRD region: (a) the trend of hydrological connectivity during the period 1990 to 2020; (b) the trend of the hydrological connectivity changes during different seasons in the YRD region; (c) hydrological connectivity changes of three major areas within the YRD region (the red-dashed lines in Figure 6(c) are mean values across the period); (d) spatial patterns of the hydrological connectivity in different seasons for 2020.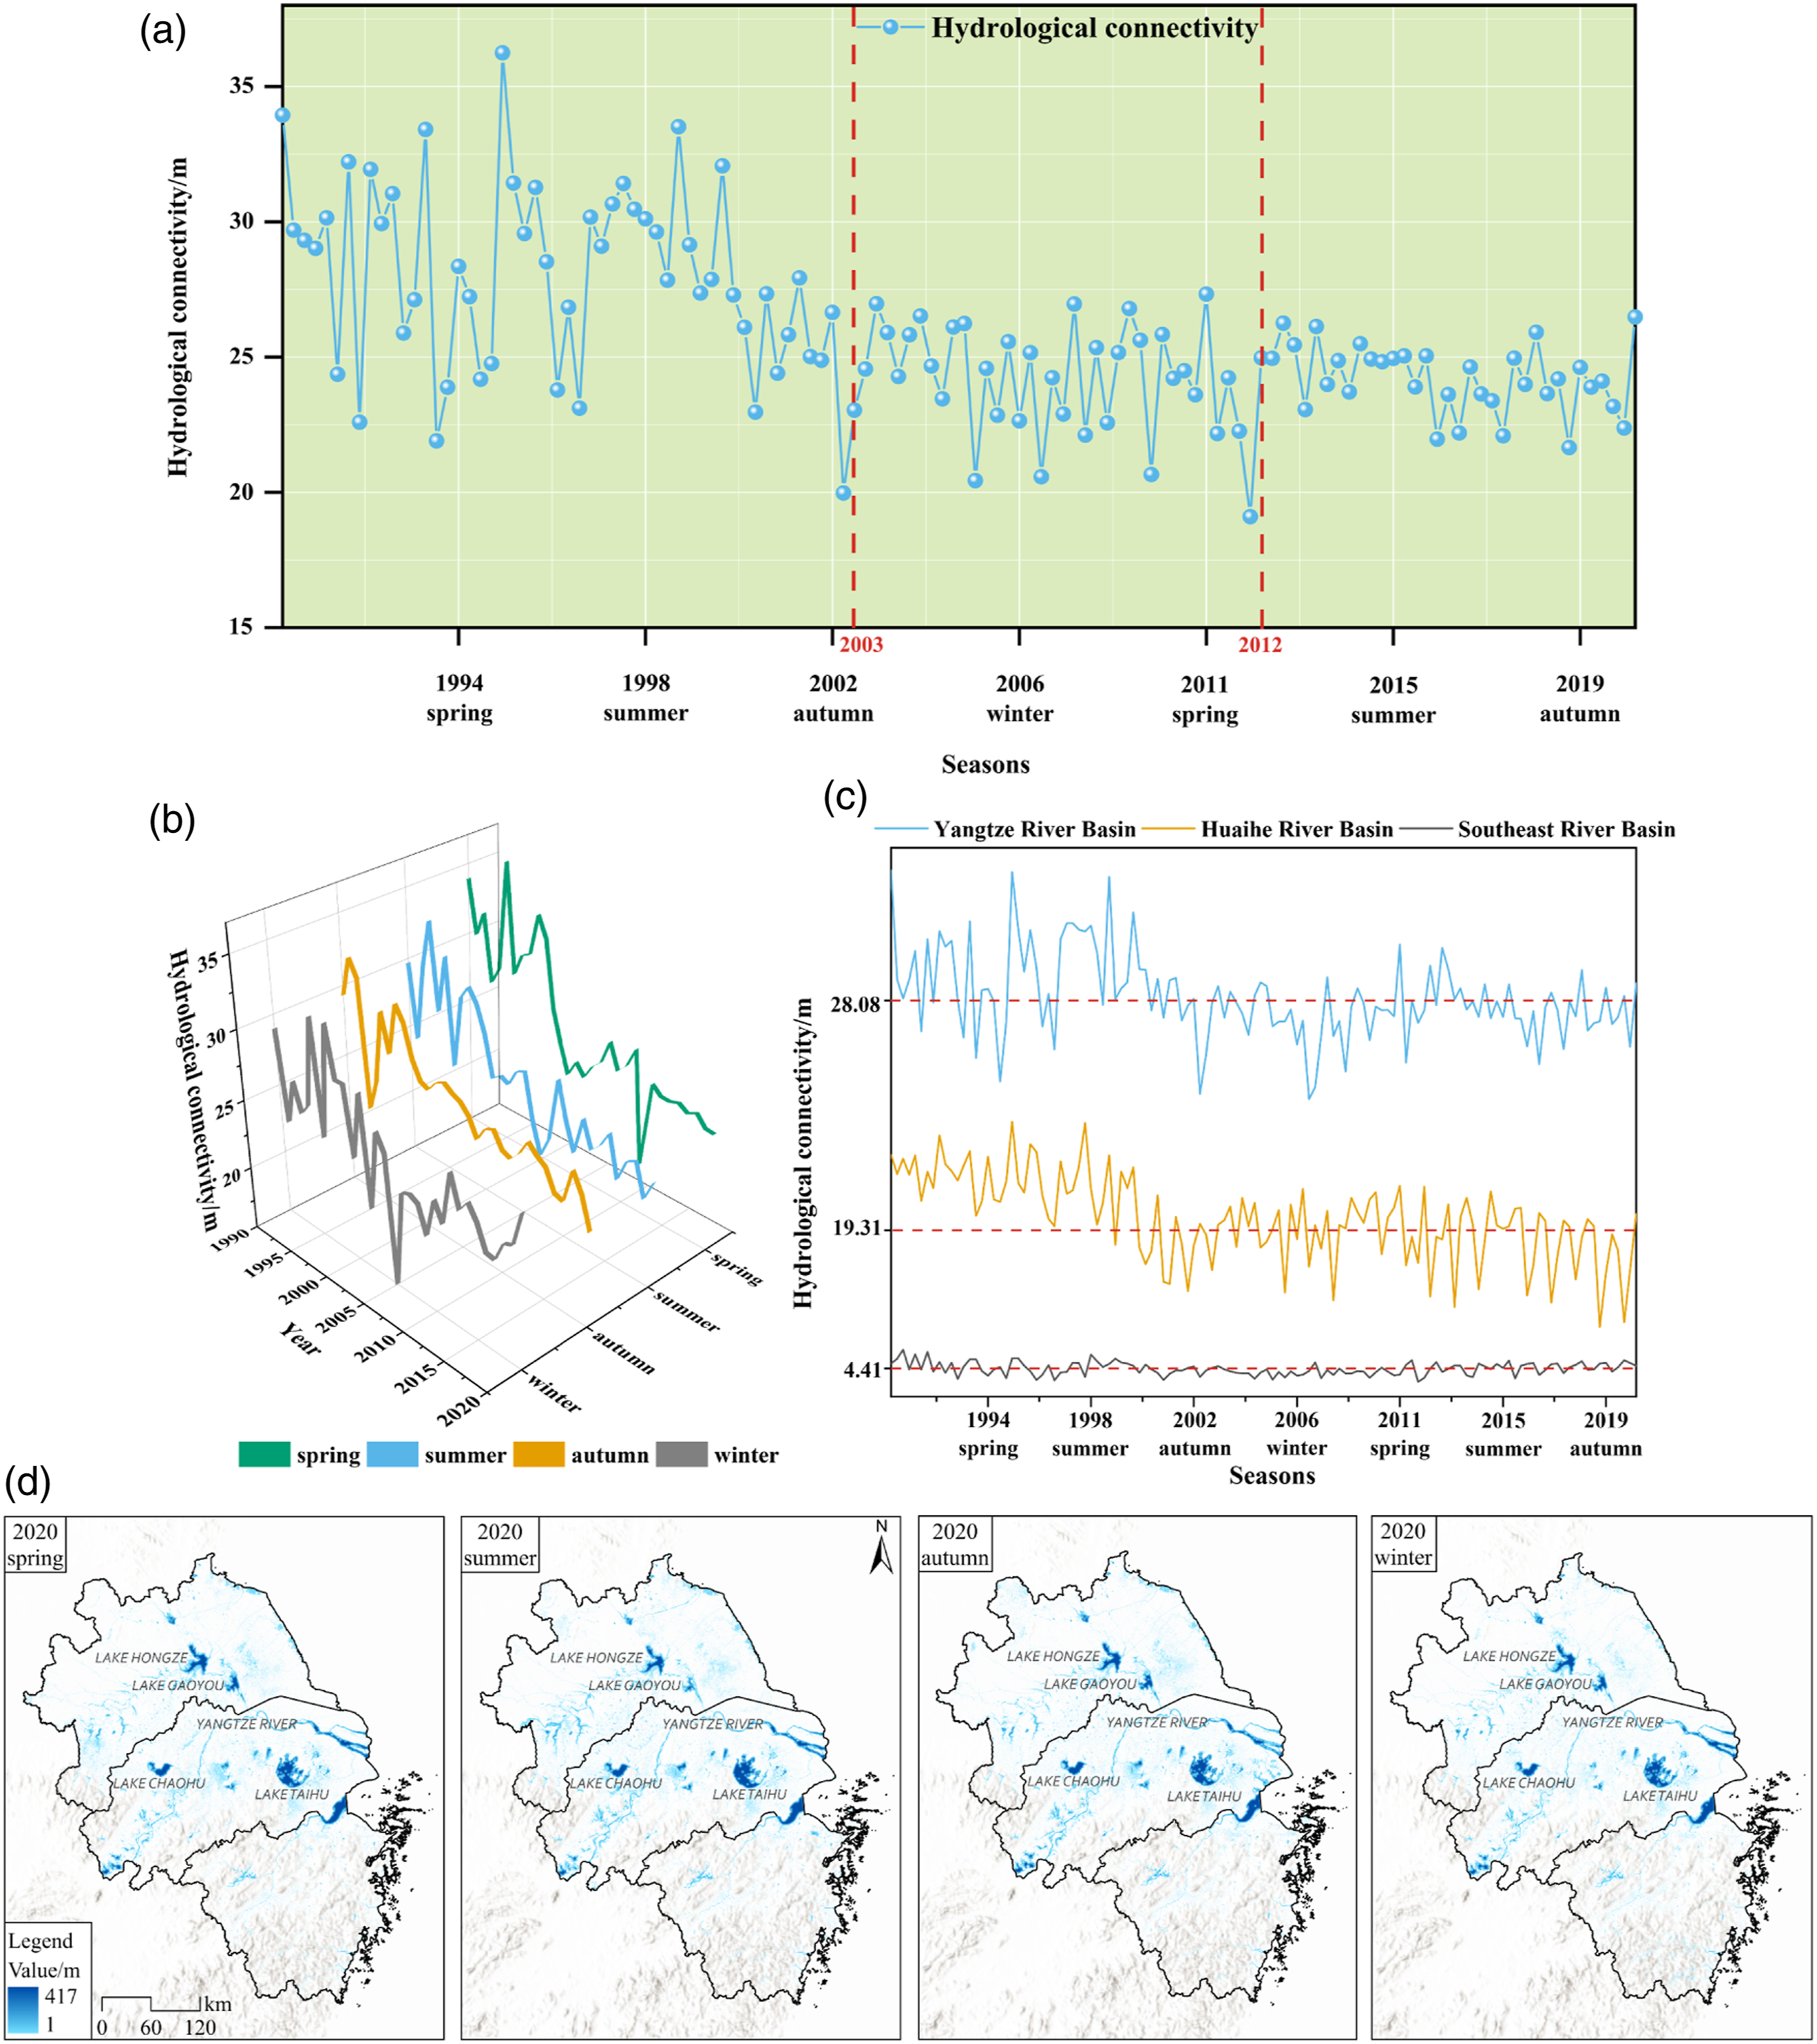
In terms of the seasonality of hydrological connectivity, the study area has witnessed an overall reduction across all four seasons during the past three decades (Figure 6(b)), although hydrological connectivity has increased in winter during the past 5 years, perhaps suggesting that a new hydrological connectivity pattern is emerging.
Hydrological connectivity is shown to be spatially heterogeneous across the study area (Figure 6(c)), with highest hydrological connectivity in the Yangtze River basin which has a mean value of 28.08 m, followed by the Huaihe River basin (19.31 m), and the Southeast River basin (4.41 m) (Figure 6(c)). Results for the most recent year (2020) show that, at the local scale, there is substantial hydrological connectivity heterogeneity within geographic regions of the YRD (Figure 6(d)). For example, within the Yangtze River basin, the hydrological connectivity of the Yangtze River, Lake Taihu, and Lake Chaohu areas is much greater than other parts of that basin, as is also the case for the Huaihe River basin, where the hydrological connectivity for Lake Hongze and Lake Gaoyou is somewhat greater. Moreover, hydrological connectivity quantified by the novel metrics indicates that changes in the seasonal hydrology of tributaries and small lakes have significant impacts on the spatial patterns of regional hydrological connectivity. Such heterogeneity, therefore, should be carefully considered in the conservation of water resources in tributaries and small lakes.
Hydrological connectivity stability
Hydrological connectivity in the study area is shown to be unstable (Figure 7), as indicated by its coefficient of variation (6.56). In terms of spatial variation, results indicate that observed hydrological connectivity was most unstable in the Huaihe River basin (coefficient of variation = 7.33), followed by the Southeastern River basin and Yangtze River basin, with coefficients of variation of 6.59 and 6.22, respectively. While hydrological connectivity stability shows a degree of spatial heterogeneity, this variation is not statistically significant, although connectivity for tributaries and small lakes is more variable (Figure 7(a), (b), (c), (d)). These tributaries and small lakes serve as important corridors in maintaining regional biodiversity and ecological function and are relatively vulnerable in the context of urbanization and climate change. Greater attention, therefore, needs to be paid to them, especially in the Huaihe River and Southeastern River basins which have numerous tributaries. Stability of the hydrological connectivity in the YRD region. The red boxes (a–d) are the sample regions.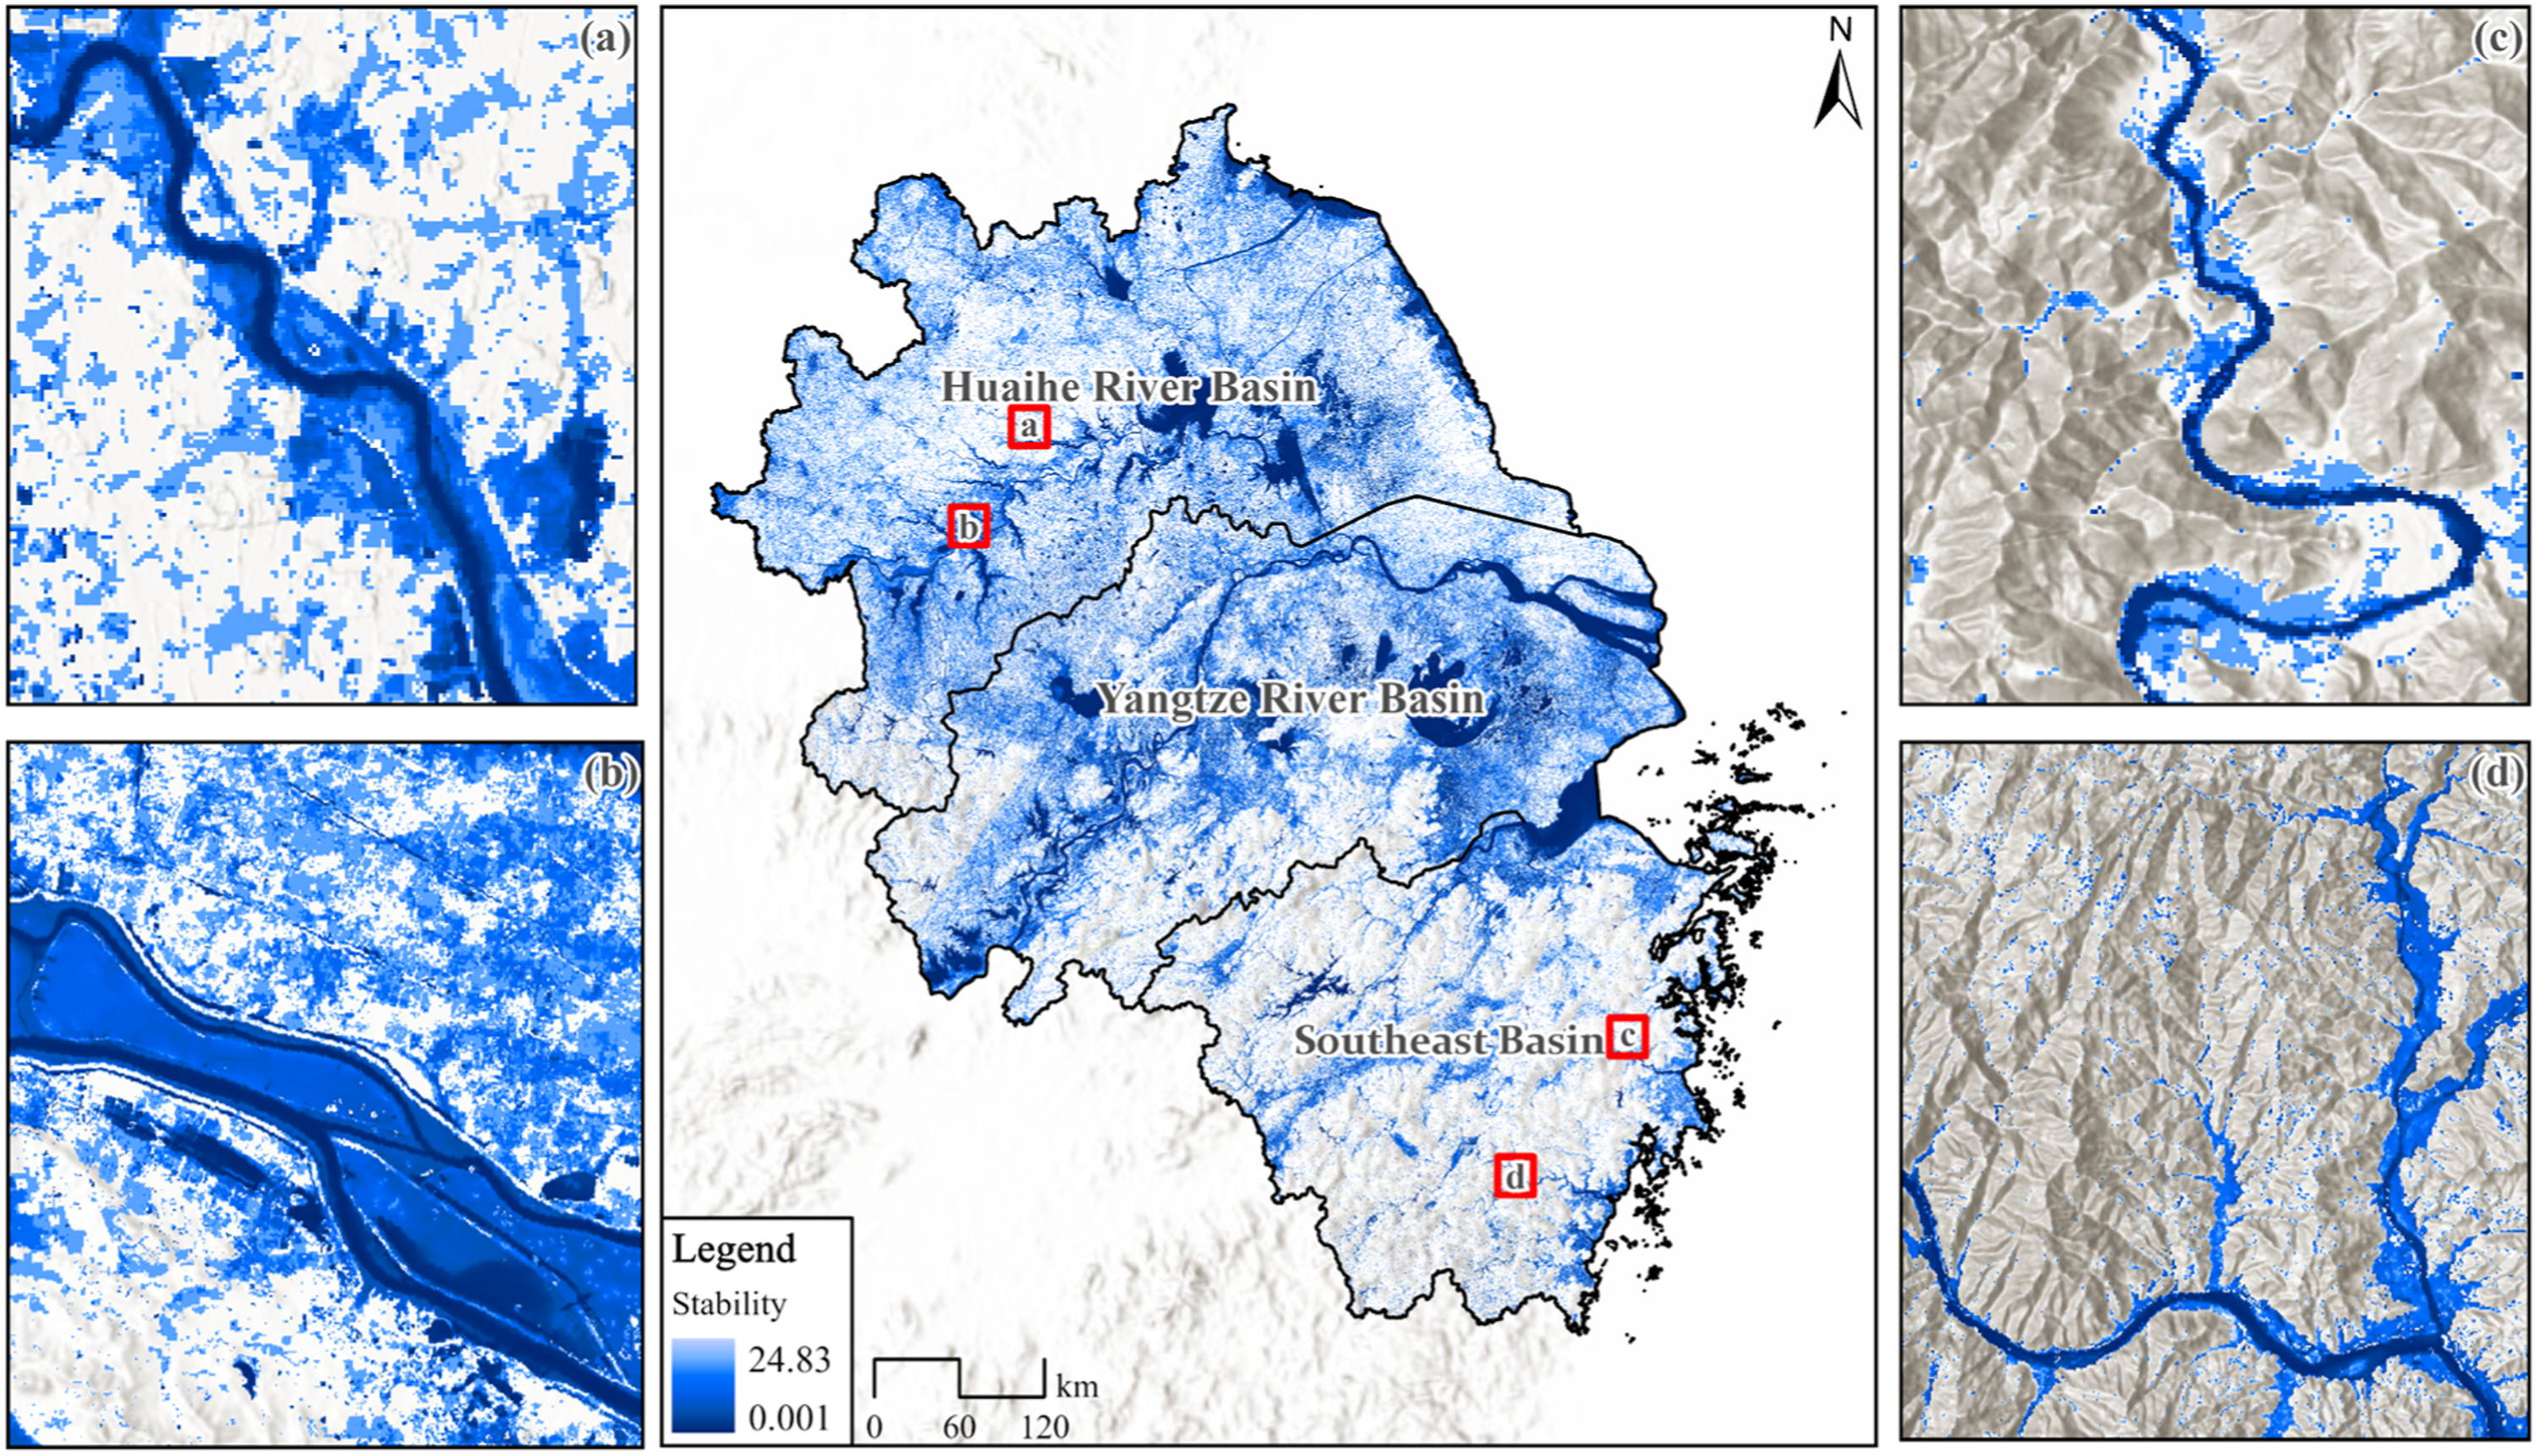
Drivers of hydrological connectivity dynamics
Correlation among hydrological connectivity and dams, construction sites, and precipitation.
Discussion
Optimization of the areas subject to hydrological connectivity losses
Restoring water flow in critical areas, which are sensitive to changes in water boundaries, and their connectivity to rivers is extremely important but can be especially challenging for small lakes and tributaries with degraded or disconnected flows. Flow in regulated rivers declines under the influence of various types of human activities and may further lead to a decline in both structural and functional hydrological connectivity. In urban areas, the hydrological connectivity of streams is unnatural and unstable because pipes and surface runoff transport water rapidly, further complicating the restoration of hydrological connectivity. Therefore, there is a need to develop a more comprehensive understanding of the streambed structure, surface landscape composition, and storage capacity of the catchment in relation to human activities and then identify novel approaches to restore hydrological connectivity (Palmer and Ruhi, 2019). Moreover, the necessity of rehabilitating landscape diversity, particularly where there are so-called “blue spaces” such as ponds and wetlands, is clear (Sayer, 2014). Meanwhile, restoring hydrological connectivity also requires consideration of the possible impact of such factors as groundwater and wastewater treatment return flows (Luthy et al., 2015).
The development of blue-green infrastructures (e.g., vegetation, ponds, or wetlands) along riverbanks constitutes a nature-based solution and is of potentially great value (Figure S2) as buffer zones mitigate hydrological connectivity instability caused by extreme precipitation and drought, effectively optimizing runoff source and sink conditions that deteriorate due to inadequate infiltration and groundwater recharge (Golden and Hoghooghi, 2018). In addition, although blue-green infrastructure was originally proposed to promote sustainable stormwater management, climate change adaptation, and improve urban livability, it also offers benefits for biodiversity (Donati et al., 2022) and can be practically applied to riparian areas in cities (Figure S2). Finally, the key to tackling problems associated with hydrological connectivity is firstly to obtain robust and reliable measures so that the underlying causes of flow change can be addressed. An optimization approach can help mitigate the ecological impacts due to the quantity and quality changes in river flow, including water quality and other hydrological factors (Palmer and Ruhi, 2019).
Possible limitations
To minimize the misclassification between non-water and water pixels in water extraction, we used the frequency of water body occurrences, that is, water bodies occurring for not less than 1.5 months within the 3 months per season (Bishop-Taylor et al., 2017). Because of the limited temporal resolution of remote sensor images, we largely ignored the changes in hydrological connectivity caused by daily-scale extreme weather. Additionally, we focused on fluvial surface connectivity when calculating hydrological connectivity based on hypsographic curves (depth-area and depth-volume), without considering the effects of river depth on hydrological connectivity. In the future, use of high-resolution LiDAR and other observed water depth and velocity data may help further improve the characterization of hydrological connectivity in the YRD region. Furthermore, it should be acknowledged that the drivers of the hydrological connectivity dynamics in this study may still have certain limitations in terms of comprehensiveness. Given the intricacies of hydrological connectivity and the mutual influence and interaction of various influencing factors, addressing this issue requires an interdisciplinary approach that integrates diverse perspectives from fields such as ecology, hydrology, geomorphology, and social sciences. Detailed exploration and resolution of these issues will require a careful and gradual approach in future studies.
Conclusions
In this study, an integrated metric for measuring the hydrological connectivity in the river–lake wetland systems is proposed and applied to the case study of the YRD of China. Compared with existing connectivity metrics, this novel metric has outstanding advantages in monitoring changes in water boundaries caused by water surface changes in rivers and lakes. In particular, the metric can sensitively monitor the hydrological connectivity dynamics in tributaries and small lakes. The results reveal the evolution of hydrological connectivity in the YRD over the past 30 years under the influence of various anthropogenic factors.
The results indicate that regional hydrological connectivity is under great pressure in the context of dam construction, urbanization, and climate change, especially in the case of tributaries and small lakes in the Huaihe and Southeastern River basins. Instability is shown to be a consequence of the increased vulnerability of tributaries and small lakes to both natural and anthropogenic external factors such as extreme weather and expansion of built-up land. The findings of this study can be used to inform the conservation and restoration of hydrological connectivity in vulnerable areas of the YRD and other regions, while also providing a reference benchmark for regional ecological security, biodiversity conservation, and river–lake wetland management.
Supplemental Material
Supplemental Material - Considering the dynamics of water surface boundaries to measure the evolution of hydrological connectivity in the Yangtze River Delta, China
Supplemental Material for Transitioning from pediatric to adult healthcare: Considering the dynamics of water surface boundaries to measure the evolution of hydrological connectivity in the Yangtze River Delta, China, by Zhenya Li, Fanhua Kong, Haiwei Yin, Michael Edward Meadows, Xiaojun Yang, Kejing Zhou, and Jie Su in Progress in Physical Geography: Earth and Environment.
Footnotes
Declaration of conflicting interests
The author(s) declared no potential conflicts of interest with respect to the research, authorship, and/or publication of this article.
Funding
The author(s) disclosed receipt of the following financial support for the research, authorship, and/or publication of this article: This research was supported by the National Key R&D Program of China (No. 2022YFF1303102), the National Natural Science Foundation of China (No. 32171571), and the Global Engagement for Strategic Partnership project of Nanjing University.
Supplemental Material
Supplemental material for this article is available online.
References
Supplementary Material
Please find the following supplemental material available below.
For Open Access articles published under a Creative Commons License, all supplemental material carries the same license as the article it is associated with.
For non-Open Access articles published, all supplemental material carries a non-exclusive license, and permission requests for re-use of supplemental material or any part of supplemental material shall be sent directly to the copyright owner as specified in the copyright notice associated with the article.