
Abstract
Sandy coasts are dynamic landscapes due to long-term processes and short-term events leading to changes at various temporal and spatial scales. Coastal dune environments are well studied at a ‘micro’ scale, both temporal and spatial, using detailed and costly in-situ surveys. However, understanding their dynamics at medium and large spatial scales is fundamental for coastal management and conservation. This review gathers recent progress on the use of satellite remote sensing to study coastal dune environments at medium and large spatial scales (from beach scale to coastal landscape scale). It is motivated by the increasing availability of satellite data at resolutions which, coupled with other coastal monitoring systems, can be applied to understanding coastal processes at medium and large spatial scales and by the need to investigate the most suitable satellite sensors and remote sensing methods for coastal studies, with a focus on dune detection, characterisation and monitoring. The reader will obtain a range of useful information from practical knowledge on landscape scale sandy coast mapping to discussions on linking plot and landform observations to landscape scale. The outcomes of this review show an increasing availability of suitable satellite data and methods that facilitate the exploration of coastal dune change at spatial and temporal resolutions that were not possible until recently. Some of the benefits and challenges of using a range of satellite products to map coastal dune landscape elements (e.g., vegetation cover, topography), and how this information can be used in coastal management in general, are discussed.
Introduction
Background
Coastal dunes form under various geological and climatic conditions (Farrell et al., 2024; Hesp and Walker, 2013). They are strongly controlled by sediment availability and vegetation (Martínez et al., 2013; Maun, 2009). Dunes reduce storm impact. They can be eroded by large waves and storm surges, and then recover by effective aeolian transport (Delgado-Fernandez and Davidson-Arnott, 2011). These sediment exchanges form the basis of our current understanding of short term beach-dune interaction and eco-morphodynamic adjustments of sandy shorelines to coastal processes (Hesp and Martínez, 2007; Jackson and Short, 2020; Sherman and Bauer, 1993). In the medium-long term, sandy beaches adapt to changes in sediment budgets and mean sea-level. Changes to the amount of sediment available to littoral processes affects the amount of sediment delivered, leading to different dune morphologies and dynamics (Bauer and Sherman, 1999; Psuty, 1988). The response of dunes on sandy beaches to rising sea levels is complex because of feedback mechanisms, sediment transport pathways, and interactions between hydro and aerodynamic processes and the ecosystem (Davidson-Arnott and Bauer, 2021). Given space landward, beaches and dunes can migrate with rising sea levels, although the rate and the mechanisms regulating this are still under investigation (Davidson-Arnott, 2005).
Climate change, sea-level rise, and the adaptation of coastal communities are global concerns. In Europe, up to 41% of people live in coastal regions (Collet and Engelbert, 2013), with coastal populations growing fast (European Environment Agency, 2006). Increasing human pressure has led to a loss of coastal environments (Williams et al., 2022). Coastal dunes are distributed along sandy shorelines (Doody, 2001) and they sustain important coastal habitats (Martínez and Psuty, 2004). Adequate monitoring of coastal dunes is key for management in the context of climate change and human impacts (Cooper et al., 2009; McLean et al., 2001). This requires the capacity to understand how coasts evolve at various interconnected temporal and spatial scales (Farrell et al., 2024; Sherman, 1995), including large, regional scales.
Scope and outline of this review
Coasts are dynamic and have been traditionally monitored using field methods, which are costly and spatially limited. Satellite remote sensing can complement these and monitor beaches at various spatiotemporal scales to understand coastal dynamics (Austrich et al., 2021; Castelle et al., 2021; Cenci et al., 2021; Munasinghe and Warnasuriya, 2023). Linking remote sensing and field information bridges process-response dynamics concepts and long-term, large-scale processes influencing landform evolution in sand dune systems (Walker et al., 2017; Zheng et al., 2022). It is also useful for coastal management and planning by providing large-scale, spatially explicit information (Al Ruheili and Boluwade, 2021; Vallarino Castillo et al., 2022).
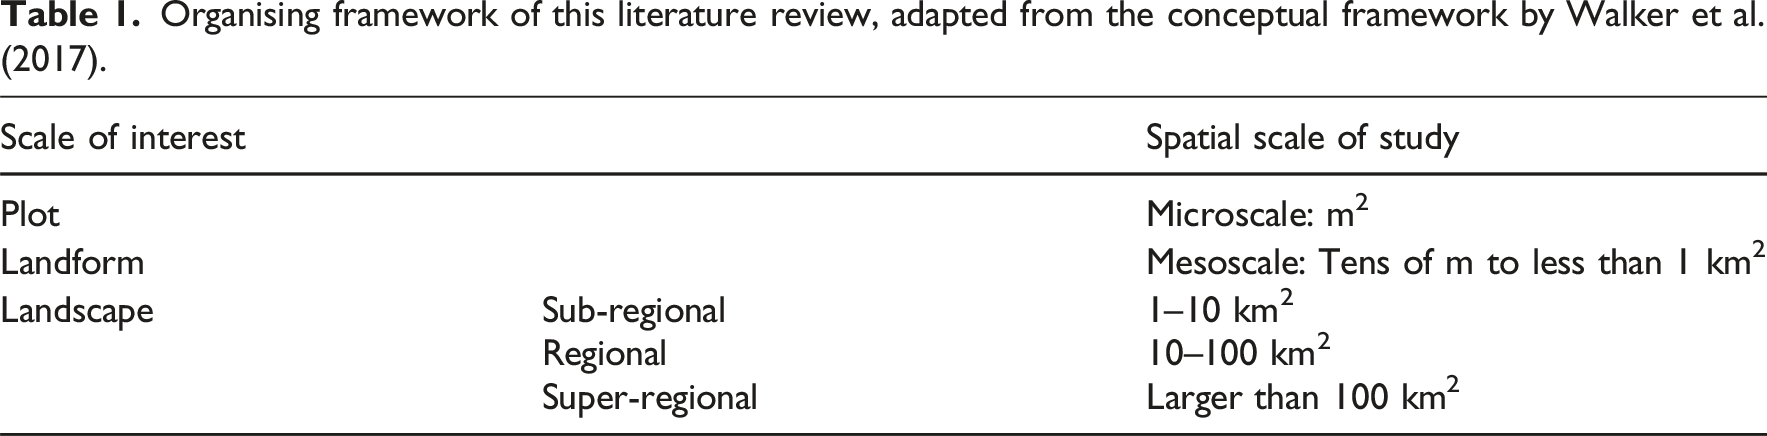
Walker et al. (2017) proposed a ‘scale aware’ conceptual framework to structure beach dune dynamics research, identifying three scales of interest: (1) the ‘plot’ scale, at a scale of metres and over seconds to days, focused on sediment transport and erosion/deposition patterns at discrete locations; (2) the ‘landform’ scale, at a scale of hundreds of metres and over months to years, focusing on shoreline erosion/progradation, biogeography, foredune size and geometry, beach width and slope, surface characteristics, wind characteristics, human influence, sediment transport rate, and erosion/deposition patterns; and (3) the ‘landscape’ scale, across a kilometre scale and over decades to centuries, focusing on shoreline erosion/progradation, biogeography, foredune size and geometry, and beach width and slope.
The landform scale acts as a link between the plot and the landscape, requiring studies covering various years (Walker et al., 2017). Remote sensing is ideal for this purpose. This, together with the increasing availability of remote sensing data sources and constant development in computer science and image analysis (Zheng et al., 2022) has motivated this review. The main aim is to inform about the progress made in remote sensing for coastal dune environments over the last 15 years, assess the effectiveness of remote sensing methods and datasets for coastal dune research, and provide scientific guidelines regarding the use of these technologies. A similar approach has been followed for terrestrial inland dunefields by (Zheng et al., 2022), but beach-dune environments are fundamentally different from inland surfaces due to the nuances of sand transport in the presence of water, which creates heterogeneous conditions over the spatial extent of the beach (Walker et al., 2017).
Organising framework of this literature review, adapted from the conceptual framework by Walker et al. (2017).
Literature selection
Peer-reviewed journal articles and reviews published between 2009 and 2024 were considered. A title and abstract search using two keyword sets (Figure 1) was performed in Scopus. The first search returned 466 publications, which were reduced to 250 after reading their title, abstract and keywords. This first filter excluded articles that were not sufficiently related to coastal science or satellite remote sensing, or that were not peer-reviewed. The following criteria were applied to rule out 36% of the remaining publications after reading the full text: (1) focus was a social science problem; (2) about inland environments; (3) about rocky or gravel coasts; (4) satellite remote sensing was only ancillary; (5) not written in English or Spanish. Of the 160 articles remaining, 3 were literature reviews and 157 were experimental studies. Keyword combinations used for the literature search.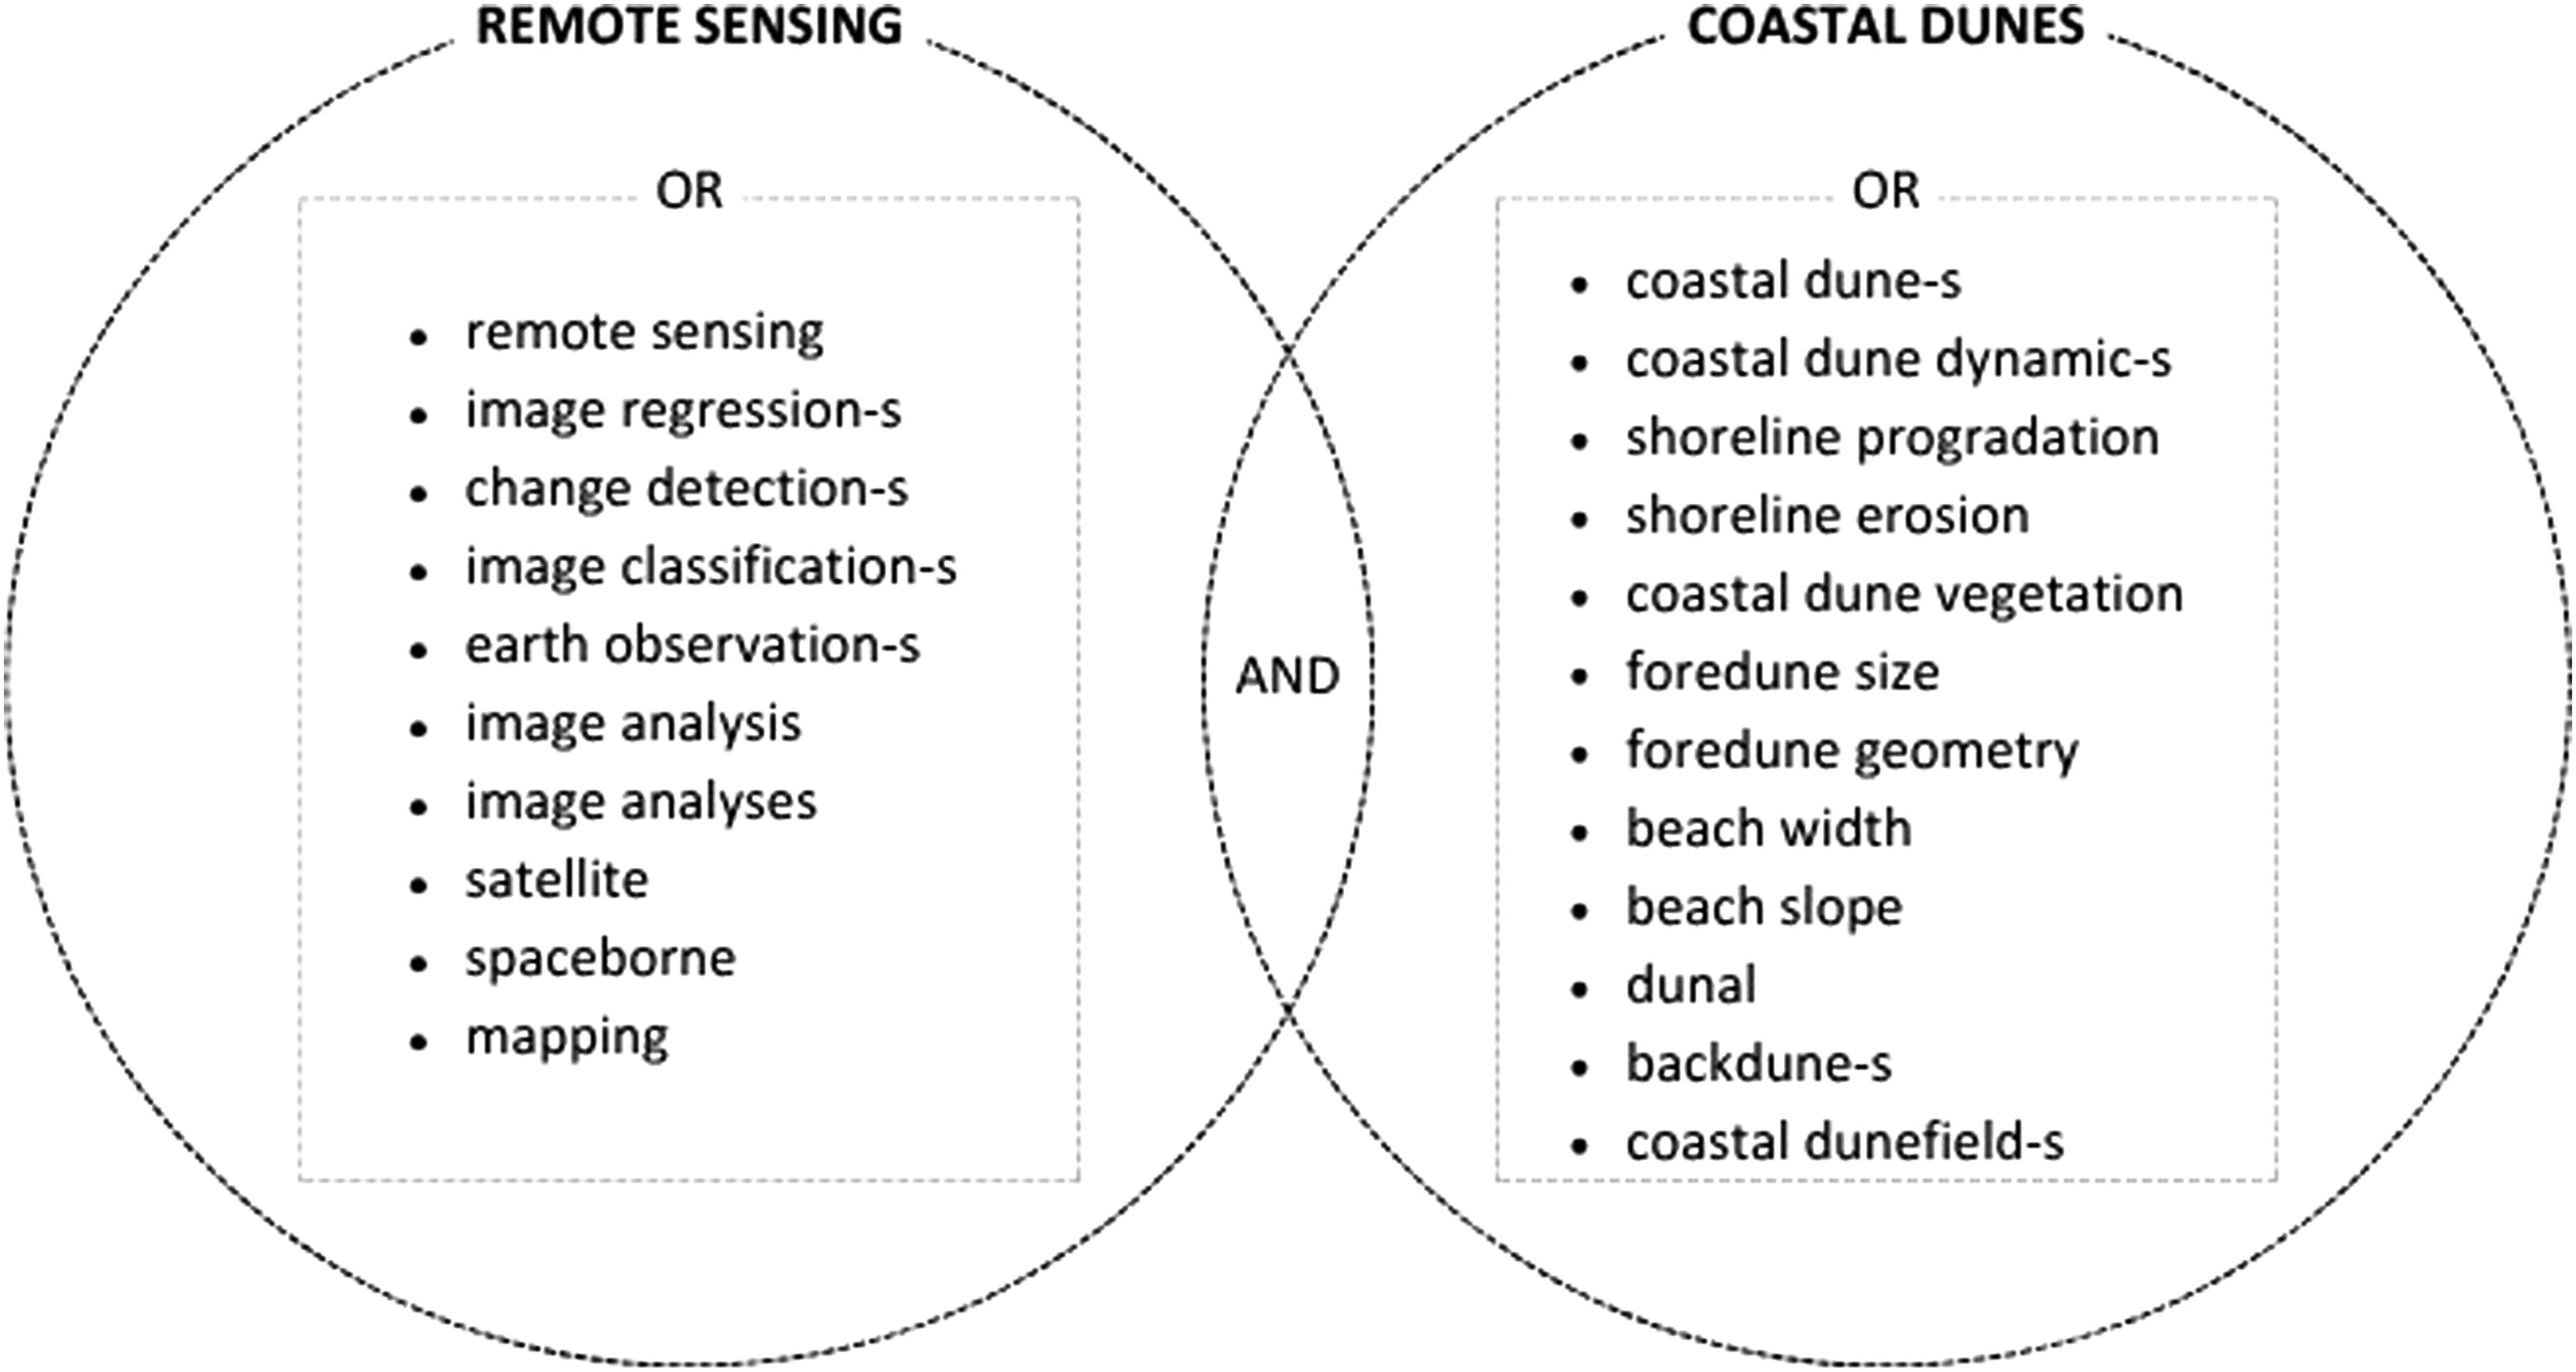
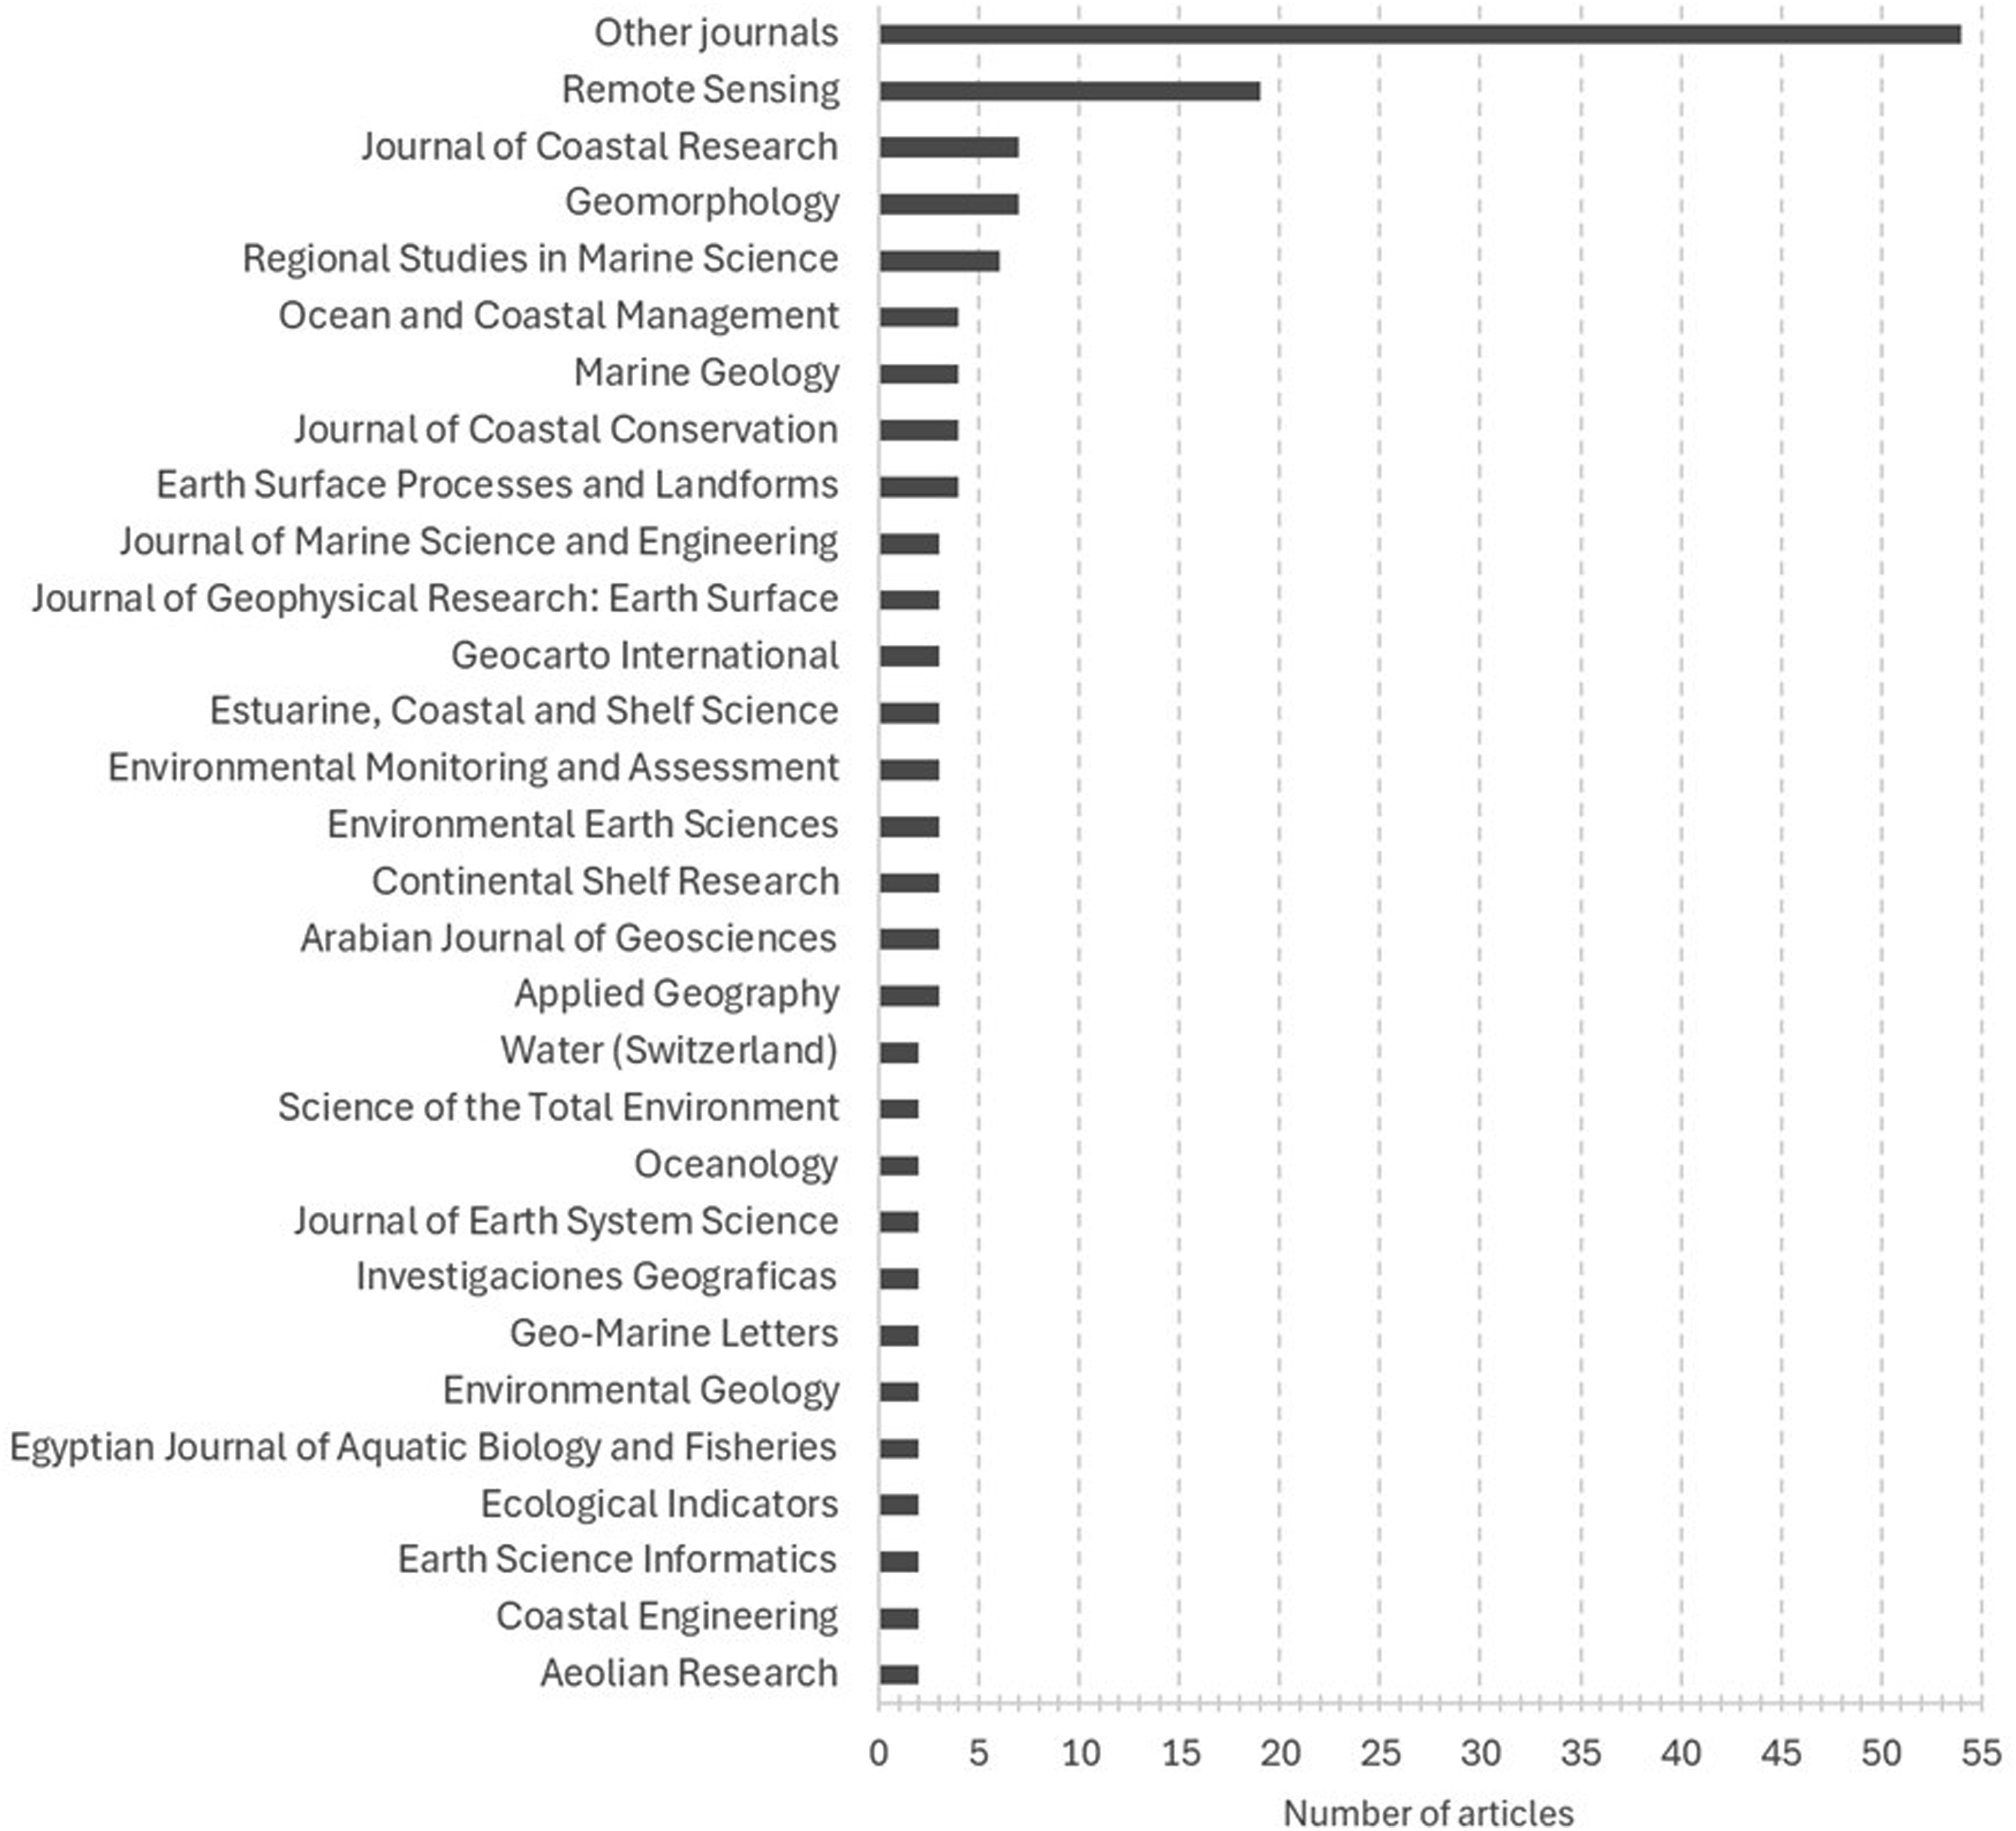
The increasing number of publications over the last 15 years (Figure 2) shows a growing interest in satellite remote sensing of coastal dune environments. Most publications were from journals on coastal and marine sciences, including relevant journals for coastal dune studies such as Aeolian Research (Figure 3). Journals on remote sensing and applied informatics and statistics, and on Earth system science, physical geography and geomorphology were also present. A few more publications are cited than those screened in the review, as they helped setting up the context or explain basic tools and data sources. Number of publications by year. Number of articles reviewed by journal.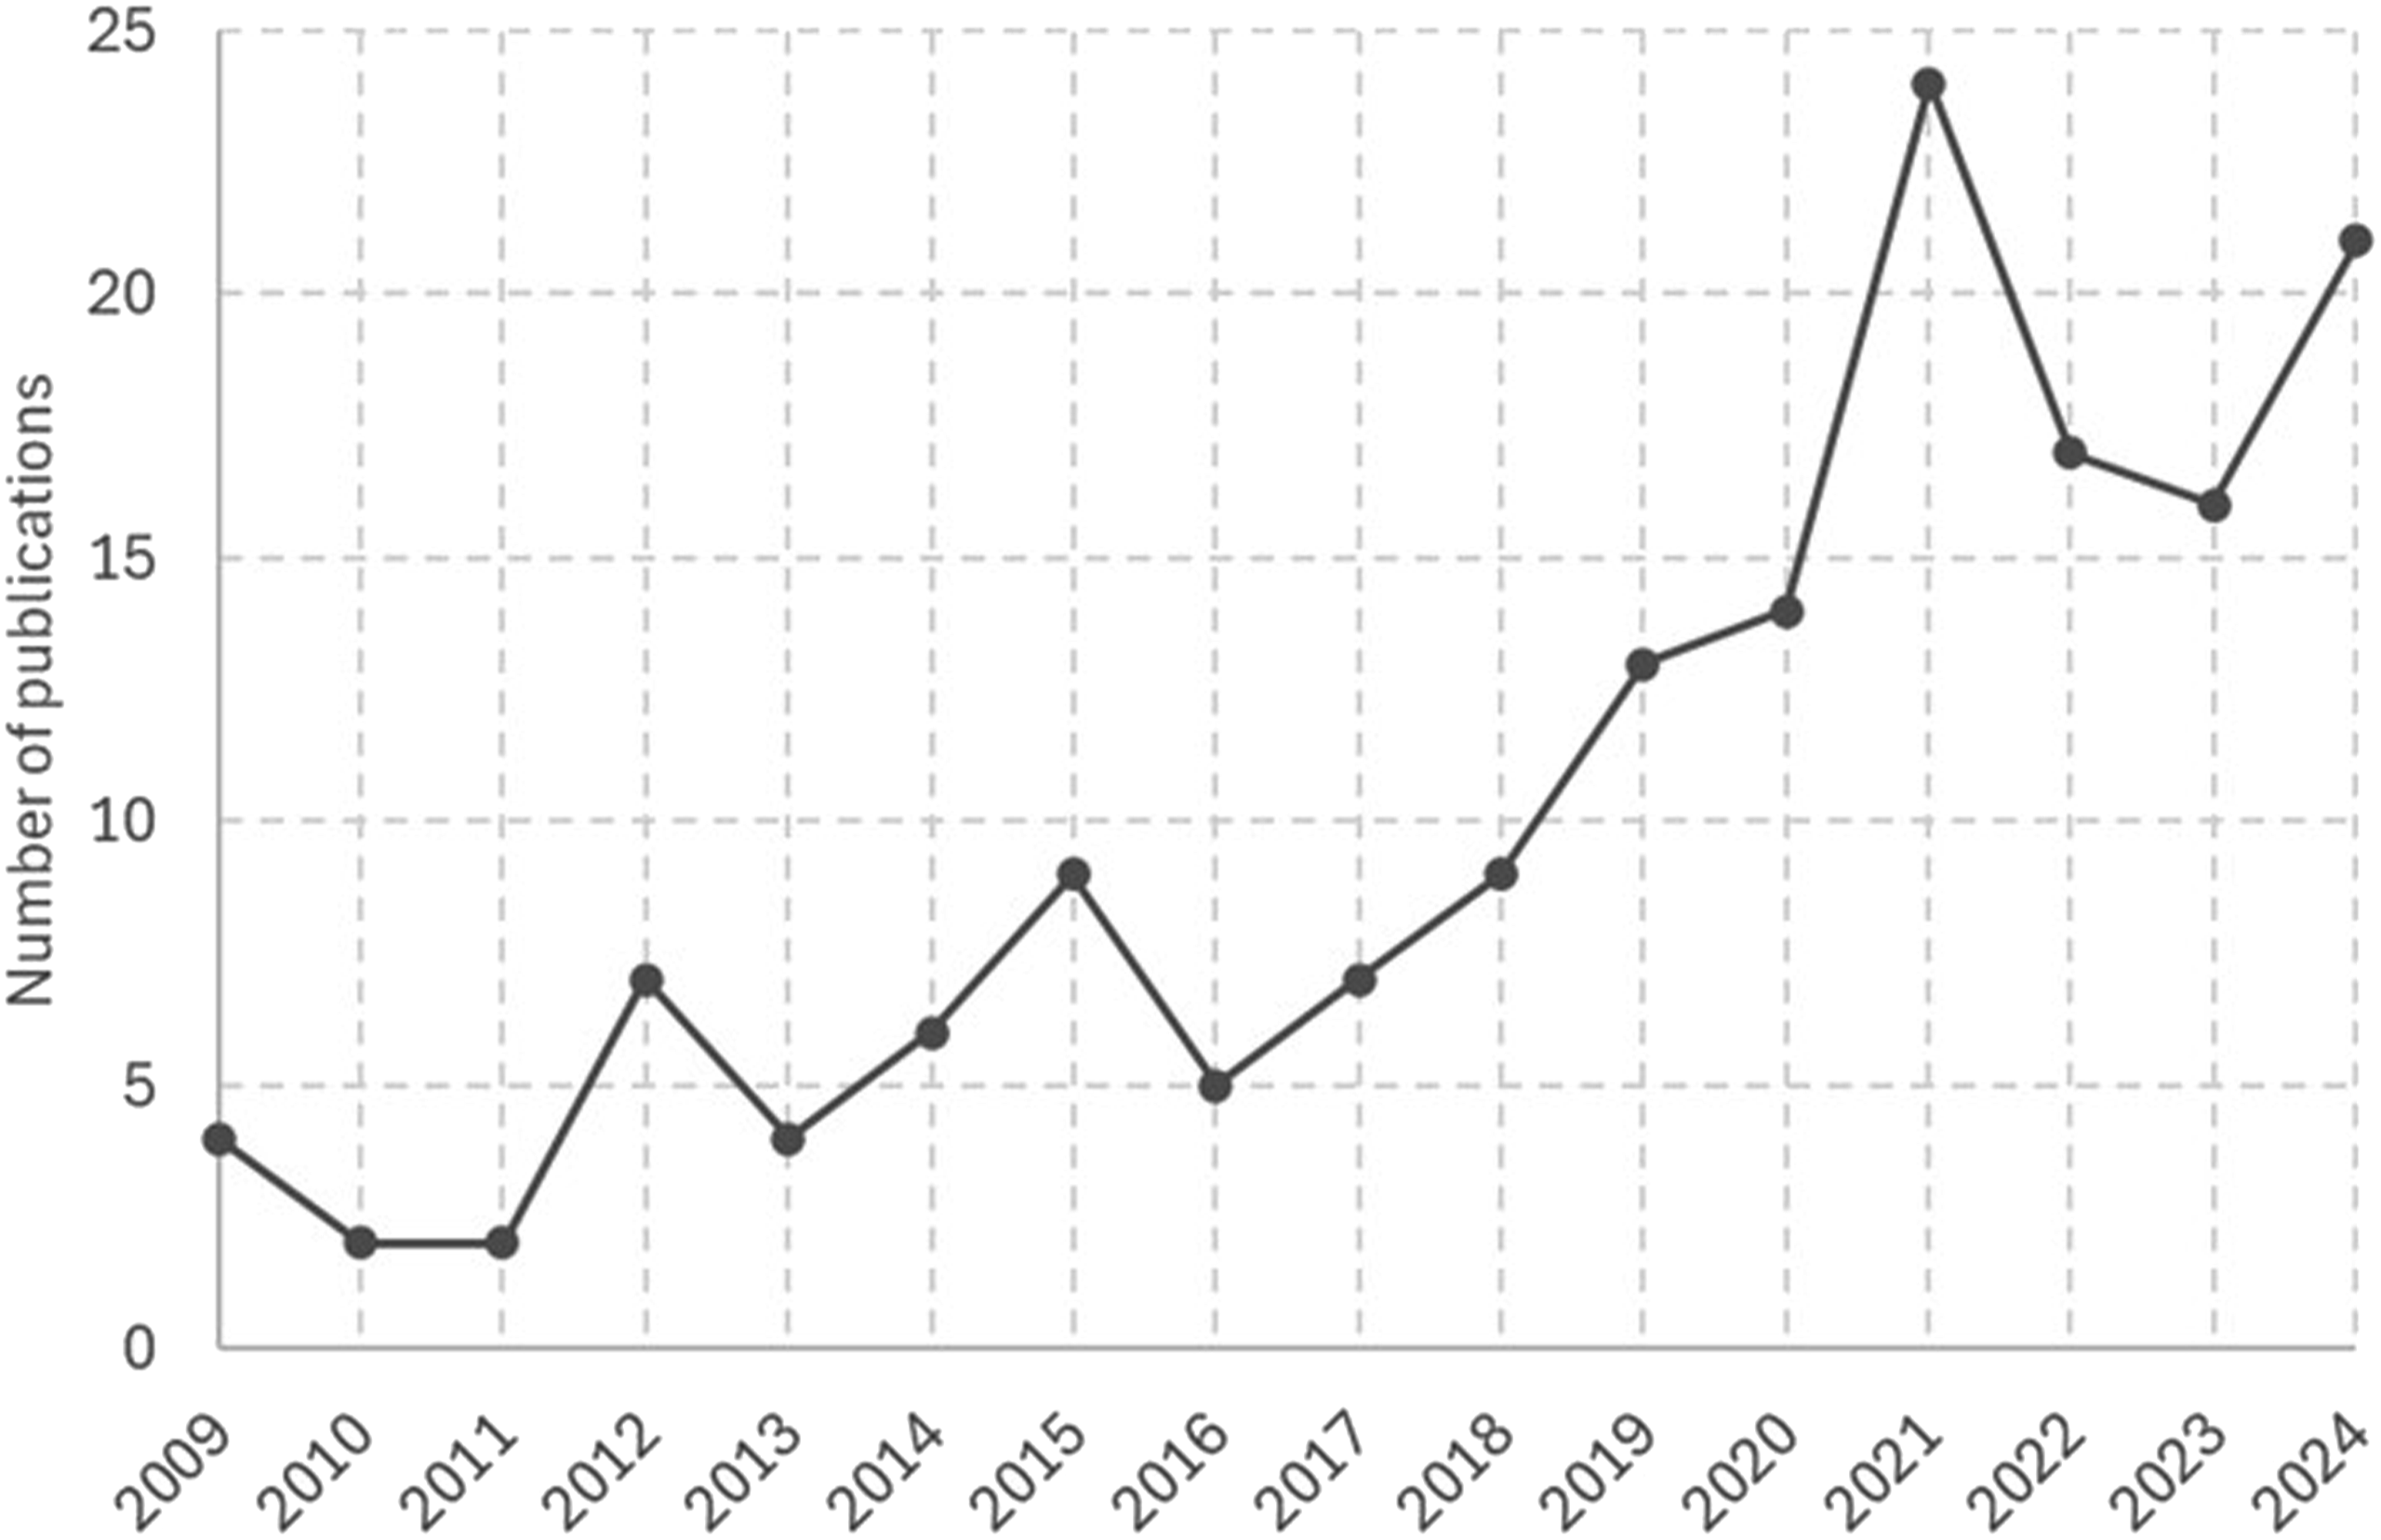
Satellite data sources for coastal dune environments
Landsat missions and Sentinel-2 were the most widely used data sources. These are freely available, medium resolution optical data. Very high resolution (VHR) imagery from online globes such as Google Earth is the third most used source. Its limited spectral information is compensated by its ease of use. Optical VHR data from satellite platforms such as QuickBird, Pléiades or RapidEye are also present. VHR data’s high spatial resolution allows the detection of fine scale processes in coastal environments. Despite its advantages such as high atmospheric penetration (even through cloud) or ability to measure topographic changes (through interferometry), active synthetic aperture radar sensors (Radarsat, ALOS-PALSAR, Sentinel-1, TerraSAR-X) scarcely appear. A summary of all satellite data sources present in the review is in the supplementary material (Table A) (Alaska Satellite Facility, 2024; EO Portal, 2012; EO Portal, 2023; EO Portal, 2024a; EO Portal, 2024b; ESA, 2024a; ESA, 2024b; ESA, 2024c; ESA, 2024d; ESA, 2024e; ESA, 2024f; ESA, 2024g; ESA, 2024h; ESA, 2024i; ESA, 2024j; ESA, 2024k; ESA, 2024l; ESA, 2024m; ESA, 2024n; ESA, 2024o; ESA, 2024p; ESA, 2024q; ESA, 2024r; JPL, 2024; NASA, 2024; NIK, 2024; Satellite Imaging Corporation, 2022a; Satellite Imaging Corporation, 2022b; Satellite Imaging Corporation, 2022c; Satellite Imaging Corporation, 2022d; Krebs, 2023; Thome, 2024).
Remote sensing methods for coastal dune environments
Beach-dune variables
Since shoreline progradation/erosion is the dominant beach-dune variable in this review (Figure 4), most methods were related to the retrieval of shoreline positions. The most widely used tool is the Digital Shoreline Analysis System (DSAS) (Abd-Elhamid et al., 2023; Al Ruheili and Boluwade, 2021; Baral et al., 2018; Cenci et al., 2021; Cohn et al., 2022; Dada et al., 2016; Dhanalakshmi et al., 2019; Duarte et al., 2018; Elfadaly et al., 2023; ElKotby et al., 2023; El-Zeiny et al., 2022; Emam et al., 2019; Flores et al., 2020; Gómez et al., 2017; Hoque et al., 2019; Hossain and Saha, 2024; Jolivet et al., 2019; Kaliraj et al., 2014; Liu et al., 2020; Mann and Westphal, 2014; Markose et al., 2016; Mbezi et al., 2024; Mishra et al., 2021; Misra and Balaji, 2015; Misra and Ramakrishnan, 2020; Mondal et al., 2020; Munasinghe and Warnasuriya, 2023; Nandi et al., 2016; Natarajan et al., 2021; Natesan et al., 2015; Osanyintuyi et al., 2022; Padma et al., 2024; Pardo-Pascual et al., 2014; Shanmuga Priyaa and Jena, 2021; Silva et al., 2021; Siyal et al., 2022; Sundar et al., 2021; Trinida et al., 2024; Valderrama-Landeros et al., 2022; Vallarino Castillo et al., 2022; Xu et al., 2024; Zhang et al., 2024; Zhou et al., 2024). DSAS calculates rate-of-change statistics and uncertainty metrics from historical shoreline positions. It has been widely used due to its user-friendly interface (Himmelstoss et al., 2024). The input shoreline positions are commonly generated by visual photointerpretation of the satellite imagery and manual digitisation of the shoreline. Number of reviewed publications by beach-dune variable and proportion of use of each satellite sensor type.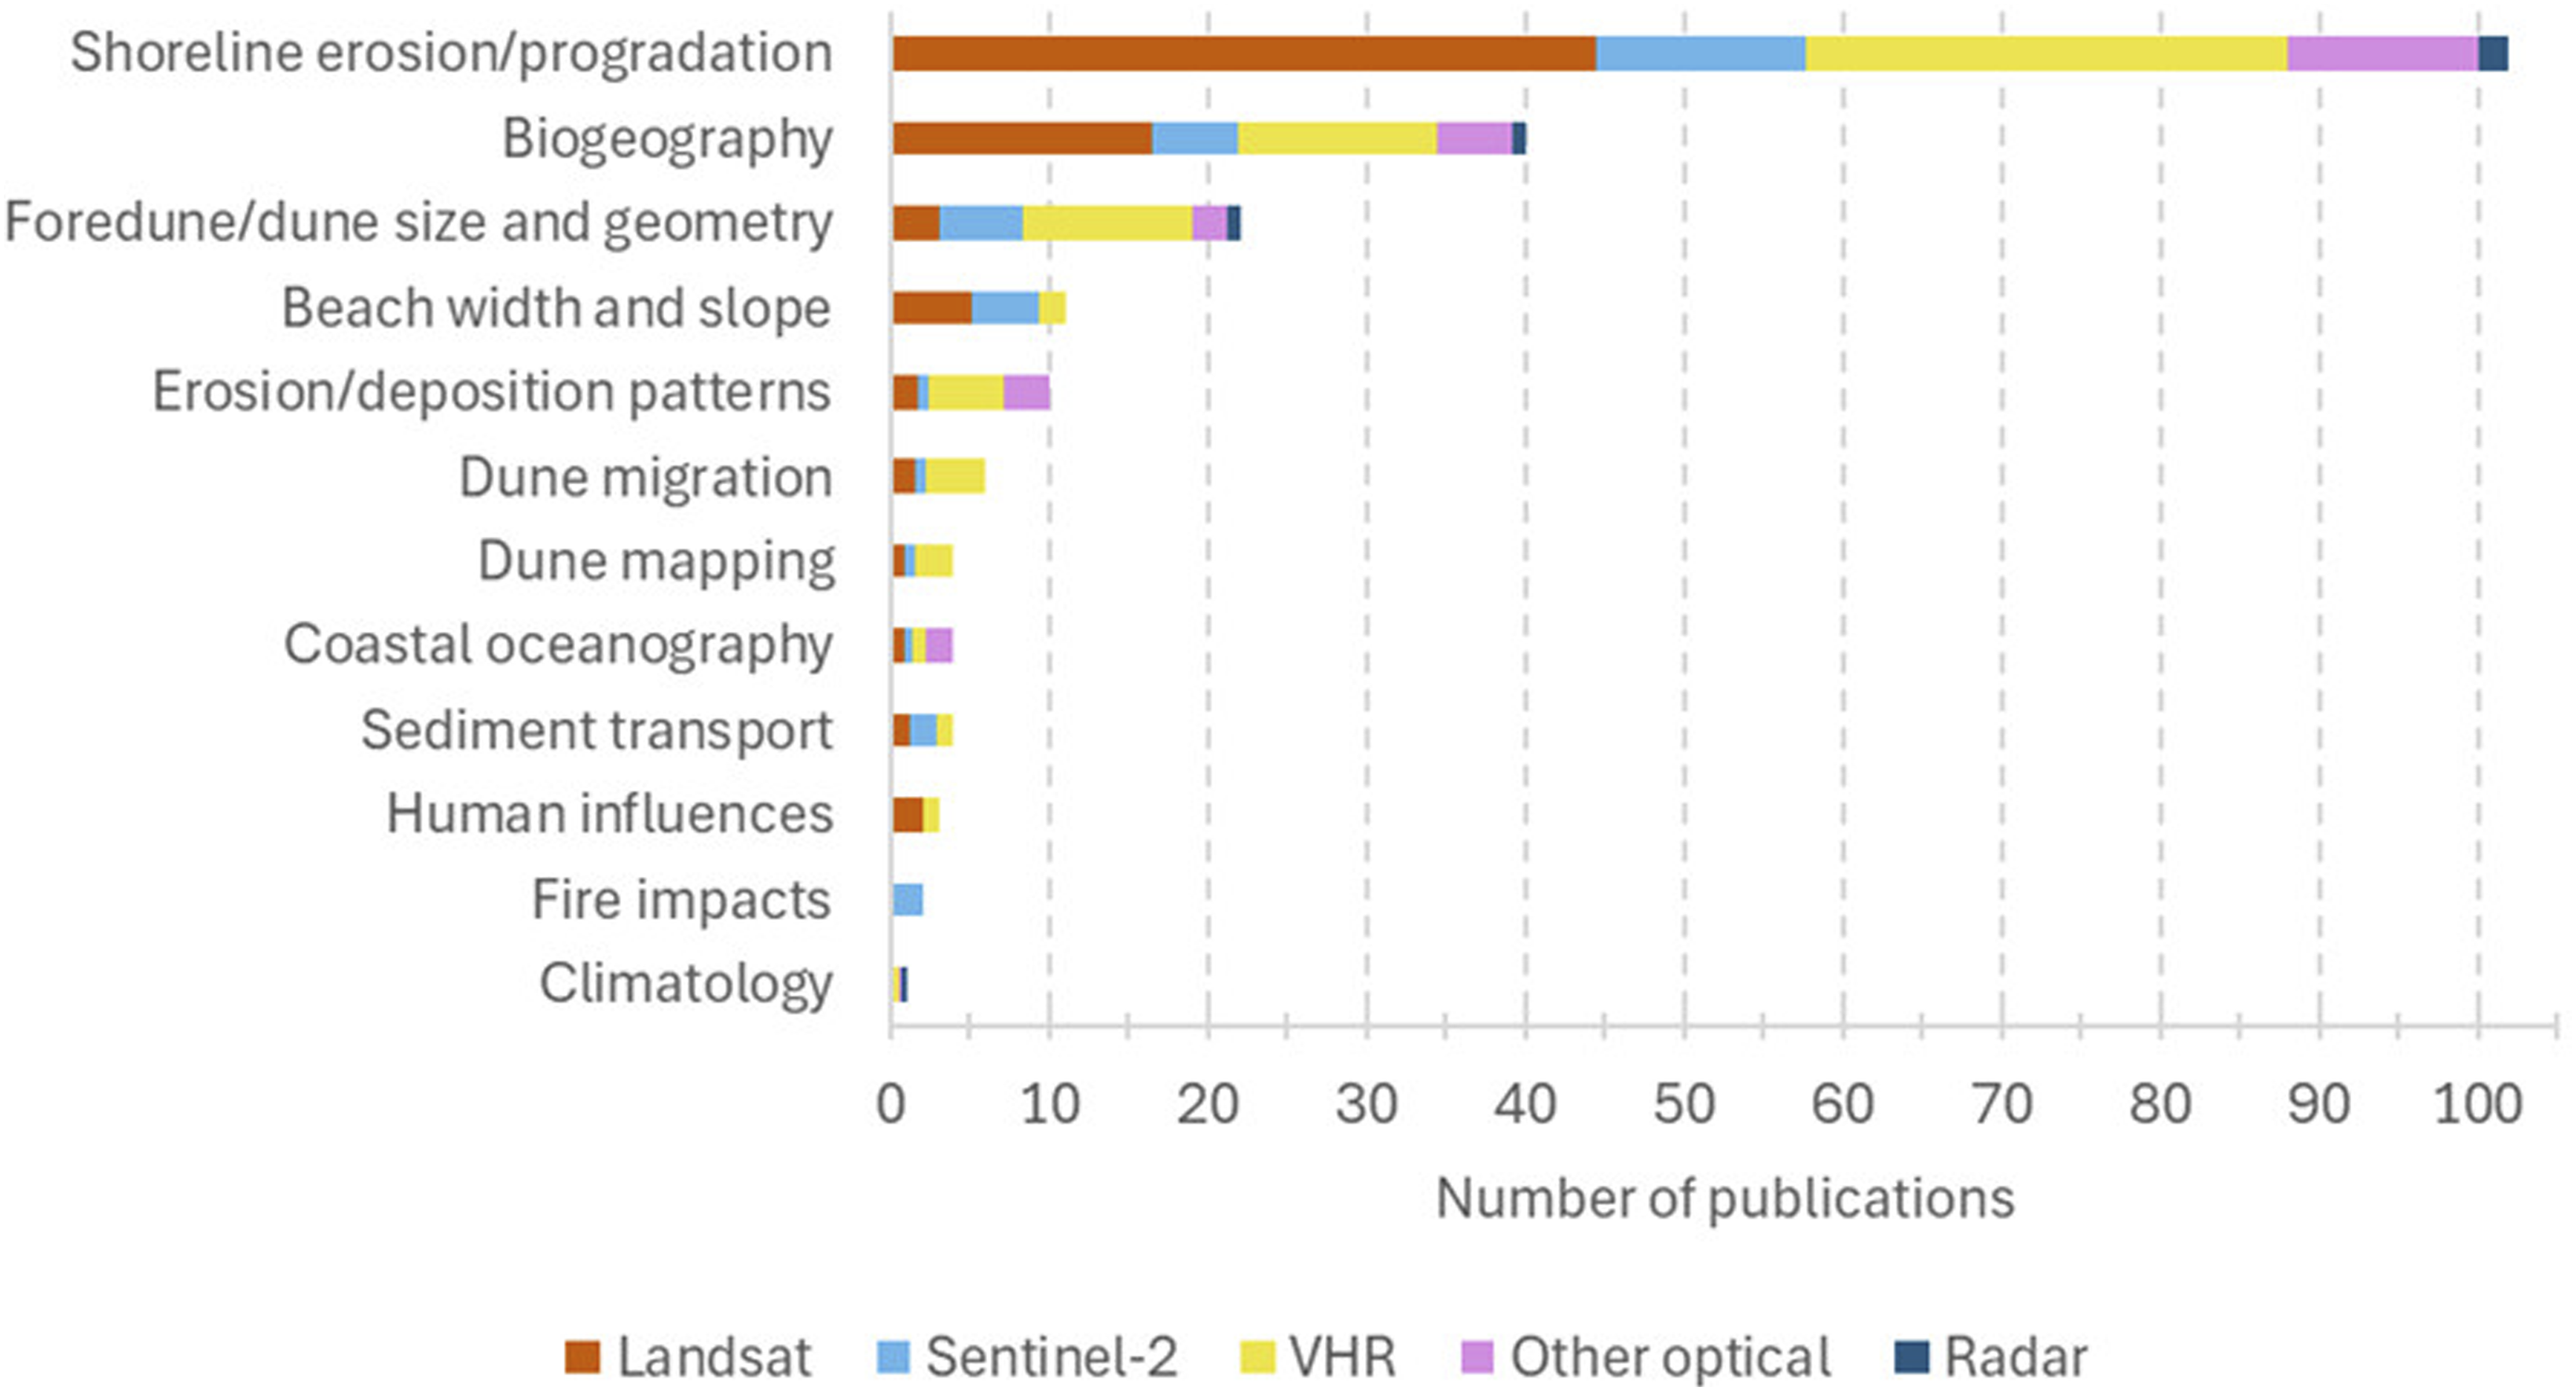
CoastSat, which is also commonly used, automatises the process of shoreline delineation (Adebisi et al., 2021; Angelini et al., 2024; Billet et al., 2023; 2024; Castelle et al., 2021; Maneja et al., 2021; McGill et al., 2022; Mu et al., 2024; Valderrama-Landeros et al., 2022; Vos et al., 2020; 2023a). CoastSat uses Google Earth Engine (GEE), image classification and sub-pixel border segmentation to extract satellite derived shoreline (SDS) positions at sandy coasts using Landsat or Sentinel-2 data (Vos et al., 2019). The method combines a Neural Network supervised classification and a sub-pixel resolution border segmentation using a Modified Normalized Difference Water Index (MNDWI). SHOREX is another automatic SDS detection tool which has been used in two studies (Briceño de Urbaneja et al., 2024; Cabezas-Rabadán et al., 2019a; 2019b). It uses Landsat or Sentinel-2 satellite data and an approximate pixel level shoreline and then kernel analysis to extract a sub-pixel shoreline position (Pardo-Pascual et al., 2012; Sánchez-García et al., 2020). The global shoreline dataset ShorelineMonitor was used in one article (Konlechner et al., 2020). ShorelineMonitor consists in a global assessment of the presence of sandy beaches and their rate of shoreline change since 1984 (Luijendijk et al., 2018). The assessment is based on a supervised classification of Landsat and Sentinel-2 imagery. Aside from these tools, there is an increasing number of SDS extraction algorithms, but no algorithm outperforms the others in all cases (Vos et al., 2023b). High-energy meso or macrotidal beaches are particularly challenging (Vos et al., 2023b). Active sensors, precisely interferometric SAR (InSAR), were used to assess shoreline change in Aly et al. (2012) and to map storm surges in Terenzi et al. (2014) in study sites in Egypt and Alaska, respectively.
Biogeography was the second most frequent variable (Figure 4). The assessment usually involved land cover mapping using classification methods (Austrich et al., 2021; Block et al., 2016; Cao et al., 2022; Gürkan and Kayikçi, 2017; Kozhoridze et al., 2022; Mahbub et al., 2020; Nuyts et al., 2020; Ponnambalam et al., 2012; Sambah et al., 2022; Timm and McGarigal, 2012; Touhami et al., 2022; Zhou et al., 2024) or visual photointerpretation and manual digitisation (Cohen et al., 2021; Gómez et al., 2017; Gorczynski et al., 2024; Hamylton and East, 2012; Mendes and Giannini, 2015; Misra and Balaji, 2015; Moulton et al., 2019; Samanta and Paul, 2016; Thomas et al., 2018; Toffani et al., 2024; Veettil et al., 2024). The use of spectral indices such as the normalised difference vegetation index (NDVI) was widespread (DaSilva et al., 2021; 2023; Debaine and Robin, 2012; Gorczynski et al., 2024; Marzialetti et al., 2019; 2022; Medina Machín et al., 2019; Petrova et al., 2023; Scardino et al., 2023; Shumack et al., 2017; Taminskas et al., 2020; Todaro et al., 2024; Veettil et al., 2020; 2024; Zhou et al., 2024). Sometimes, advanced biogeographic characterisation using landscape metrics or habitat suitability models was used (Block et al., 2016; Sambah et al., 2022; Todaro et al., 2024). Franklin et al. (2024) used random forest and decision trees to model shrub presence in relation to geomorphological variables in a barrier island site in USA. Delbosc et al. (2021) highlighted the lack of data to assess the conservation status of coastal habitats under the European Union Habitats directive. A remote sensing approach could help to homogenise conservation status assessments.
Other frequently assessed variables were foredune and dune size and geometry, beach width and slope, and erosion and deposition patterns (Figure 4). Dune morphology was mostly assessed visually (Cabral and Castro, 2022; Havivi et al., 2018; Hesp et al., 2022; Levin et al., 2009; Manzolli et al., 2023; Nuyts et al., 2020; Patton et al., 2019; Portz et al., 2021; Repkina and Yakovleva, 2023; Rodríguez Paneque, 2024; Toffani, 2020; Toffani et al., 2024; Özcan et al., 2010). Beach width and slope was usually analysed together with shoreline erosion and progradation (Cabezas-Rabadán et al., 2019a; 2019b; Munasinghe and Warnasuriya, 2023; Schellekens and Amani, 2022; Siyal et al., 2022; Vos et al., 2020; Xu et al., 2024). Dune dynamics were measured by Havivi et al. (2018) using InSAR coherence, and by Sam et al. (2015) using satellite stereopairs taken 1 year apart.
Erosion and deposition patterns were often visually assessed (Levin et al., 2009; Nuyts et al., 2020; Repkina and Yakovleva, 2023; Talavera et al., 2024), sometimes aided by other methods such as band combinations (Duarte et al., 2018) or edge enhancement techniques (Baral et al., 2018). Albuquerque et al. (2025) used the Normalized Dune Difference Index (NDDI) to map dunefield extent in a coastal zone of Rio Grande do Sul (Brazil). NDDI is a spectral index specifically designed to highlight the spectral characteristics of sand dunes that uses a SWIR band and the coastal aerosol band available in Landsat data. Román-Rivera and Ellis (2019) highlighted the potential of spatially explicit predictive modelling using satellite data to supply morphodynamic information.
Spatial scales
Most of the publications belonged to the landscape scales (Figure 5). This is not surprising, since the most used satellites were Landsat and Sentinel-2, which have moderate spatial resolution (Table A, Supplemental material). The amount of plot level studies is limited due to the spatial resolution of satellite data, which only reaches 20–30 cm pixel size for the highest resolution sensors (WorldView-3). The following sections describe only the most relevant or innovative studies at each scale. Number of reviewed publications by scale of interest.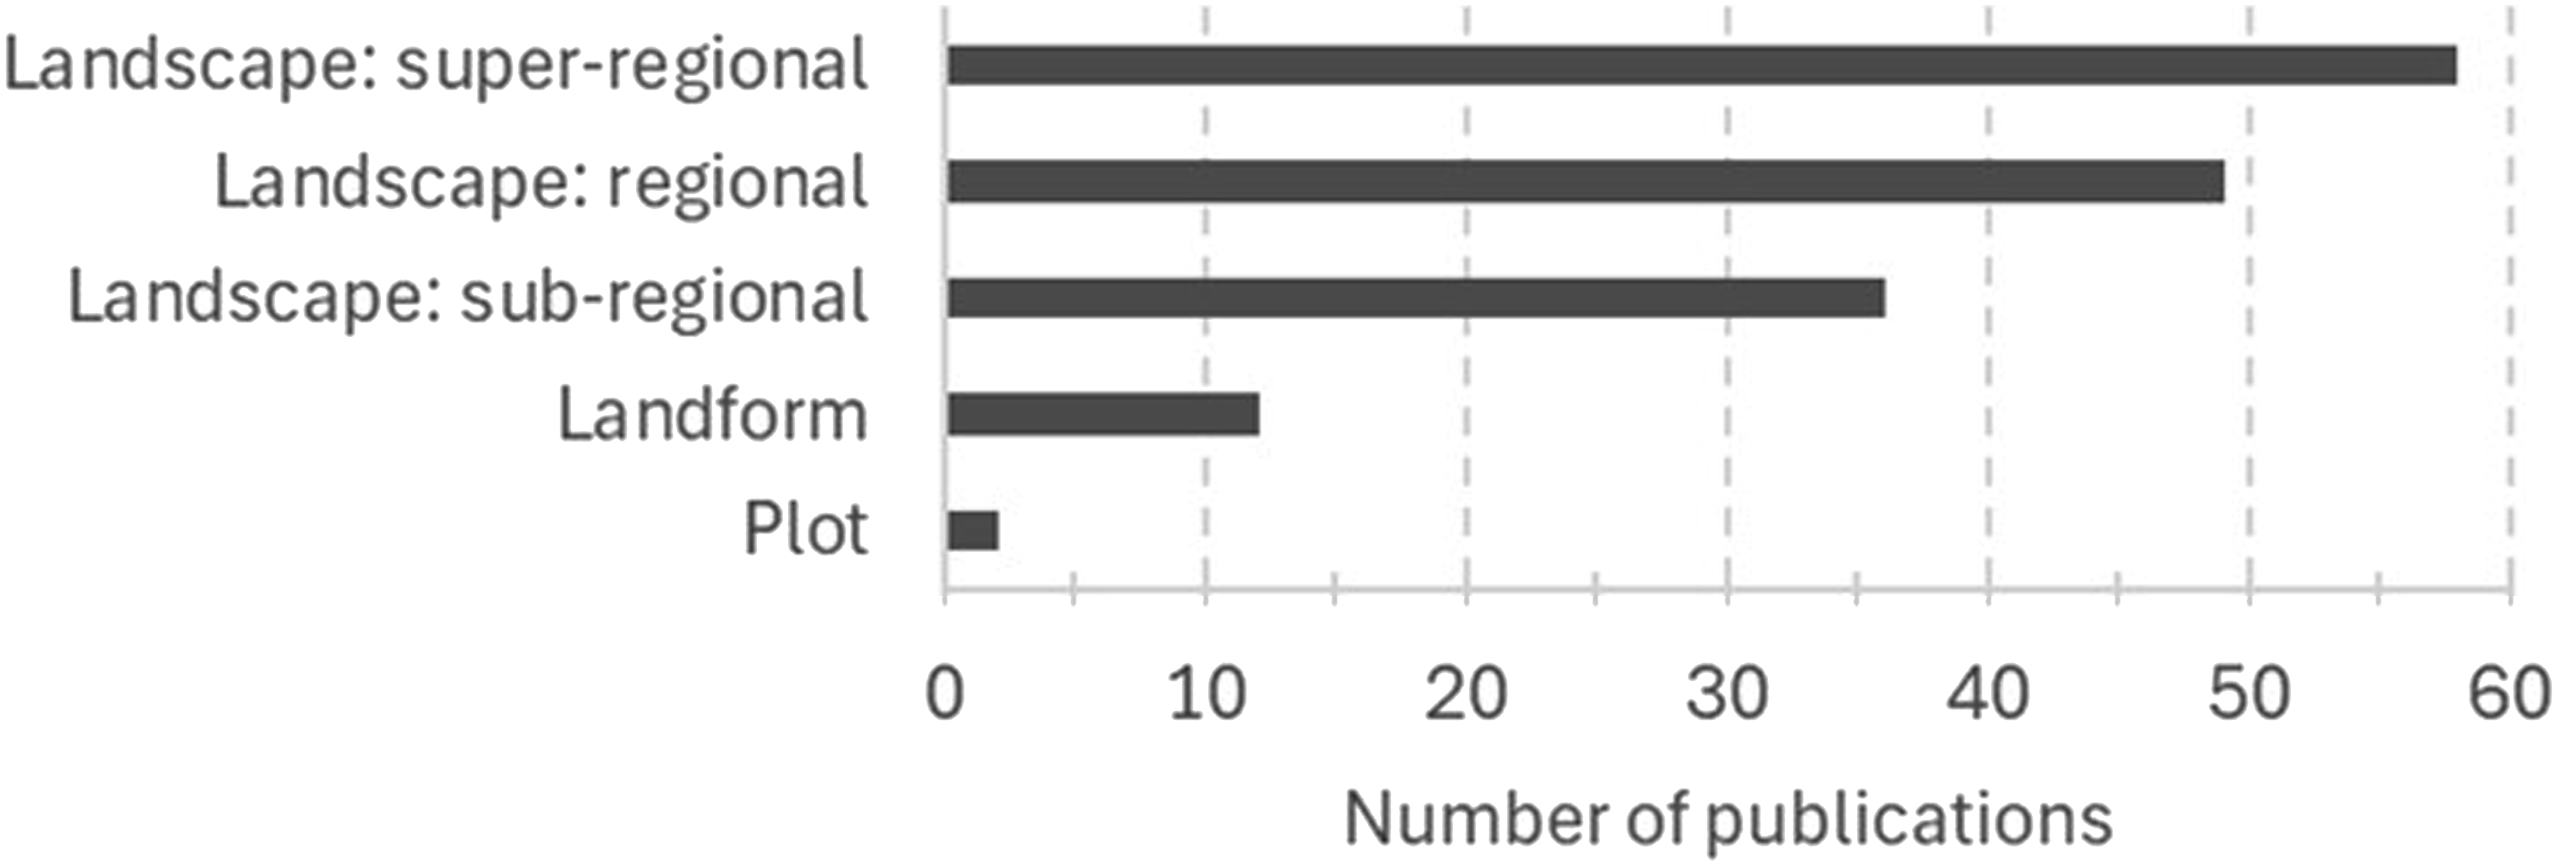
Plot scale
Two studies assessed variables at this scale. Repkina and Yakovleva (2023) classified and analysed Holocene aeolian deposits. Through visual photointerpretation of images extracted from online globes (Google Earth and SAS Planet), they assessed the morphology and distribution of the dunes and the erosion and deposition patterns in a site in the White Sea coast (Russia). Scardino et al. (2023) used Landsat 8/9 and Sentinel-2 to monitor vegetation heath and water stress on coastal dunes in a study area in the Chiatona coast (Italy) using spectral indices. This vegetation assessment was then linked to erosion and accretion processes using in-situ surveys.
Landform scale
Castelle et al. (2021); McGill et al. (2022); Maneja et al. (2021) and Silva et al. (2021) assessed shoreline erosion and progradation or beach widths. Three of these studies used CoastSat.
The study by Castelle et al. (2021) is especially interesting, as they compared SDS extracted using CoastSat over a 35 year-long period with field data spanning over 10 years in Truc Vert beach (France). Both Landsat and Sentinel-2 datasets were used. They found that SDS using CoastSat can be improved in high-energy meso-macrotidal beaches such as Truc Vert by taking wave runup into account, choosing a different shoreline proxy, or training CoastSat’s Neural Network classifier to the site-specific characteristics.
Bentze et al. (2023); DaSilva et al. (2023); Marzialetti et al. (2022); Mendes and Giannini (2015) and Timm and McGarigal (2012) studied biogeographical characteristics of coastal areas.
Marzialetti et al. (2022) used Sentinel-2 and VHR PlanetScope data to upscale drone surveys of the invasive tree Acacia saligna in a coastal environment in Italy. They calculated 18 spectral indices as remote sensing variables to build an A. saligna invasion model. They modelled A. saligna occurrence using a Random Forests machine learning algorithm (Breiman, 2001). Timm and McGarigal (2012) also used Random Forests, but for classification instead of regression. They created detailed maps of coastal dune and salt marsh ecosystems in Cape Cod National Seashore (USA) using VHR QuickBird imagery combined with orthophotography and a digital elevation model (DEM). They used a supervised approach, designing a classification scheme, building a set of 34 predictor variables (including spectral indices and topographic variables) and collecting training samples.
Dune morphology was assessed by Hesp et al. (2022) in Australia and Levin et al. (2009) in Brazil. They both used VHR satellite imagery (RapidEye and QuickBird, respectively), visual photointerpretation and manual delineation to identify aeolian landforms.
Landscape scale
Sub-regional
Shoreline erosion and progradation or beach width were analysed by Amaro et al. (2015); Baral et al. (2018); Billet et al. (2024); Chang et al. (2015); Cohn et al. (2022); Duarte et al. (2018); Fairley et al. (2020); García-Rubio et al. (2015); Mahbub et al. (2020); Mu et al. (2024); Munasinghe and Warnasuriya (2023); Rajagopalan (2011); Repkina et al. (2024); Samanta and Paul (2016); Smith et al. (2021); Sundar et al. (2021); Trinida et al. (2024); Vallarino Castillo et al. (2022) and Xu et al. (2024). Most relied on manual digitisation of shorelines, sometimes aided by spectral indices or visual image enhancement techniques such as band combinations, followed by further analysis of shoreline trends using DSAS. CoastSat was sometimes used.
Fairley et al. (2020) used Sentinel-2 data to assess intertidal bar shape and migration and relate it to coastal dune behaviour in Crymlyn Burrows (United Kingdom). Although this is not the main intended use for CoastSat, these authors adapted the workflow by extracting the pre-processed images before shoreline detection. These were then transformed to grayscale and the sandbars were extracted using histogram thresholding, manually finding a threshold value which separates land and water properly.
Biogeography was assessed by Bonte et al. (2021); Cohen et al. (2021); Ettritch et al. (2018); Mahbub et al. (2020); Marzialetti et al. (2019); Medina Machín et al. (2019); Samanta and Paul (2016); Sambah et al. (2022); Taminskas et al. (2020); Thomas et al. (2018) and Touhami et al. (2022); Cohen et al. (2021); Samanta and Paul (2016) and Thomas et al. (2018) mainly relied on visual photointerpretation and manual digitisation. The NDVI index was a key part of the methods by Marzialetti et al. (2019) and Taminskas et al. (2020).
Ettritch et al. (2018) used linear spectral unmixing (LSU) on a time series of Landsat imagery to quantify bare soil over time in a stabilised dune system in the Kenfig Burrows National Nature Reserve (United Kingdom). LSU is a technique to analyse the spectral mixture within pixels. It infers sub-pixel pure spectral signatures (endmembers) weighted by their abundances (Garg, 2020) within each pixel.
Bonte et al. (2021); Mahbub et al. (2020); Marzialetti et al. (2019); Medina Machín et al. (2019); Touhami et al. (2022) and Sambah et al. (2022) used land cover classification methods based on random forests, decision tree, support vector machines (SVM) or maximum likelihood algorithms in study sites in France, Belgium, Netherlands, United Kingdom, Bangladesh, Italy and Spain.
Dune and foredune morphology and patterns were assessed by Baral et al. (2018); Bonte et al. (2021); Cabral and Castro (2022); Duarte et al. (2018); Knight and Burningham (2021); Manzolli et al. (2023); Özcan et al. (2010); Patton et al. (2019); Portz et al. (2021); Povilanskas et al. (2009) and Van Kuik et al. (2022). The remote sensing methods used tended to be based on visual photointerpretation or very simplistic.
Knight and Burningham (2021) and Portz et al. (2021) measured transverse dunes migration. Knight and Burningham (2021) used Sentinel-2 data and GEE in South Africa. They extracted the reflectance along a shore-parallel, dune-crossing transect. The inflection points in reflectance between the illuminated and shaded sides of the dunes allowed the identification of dune crests. Portz et al. (2021) used visual photointerpretation on VHR imagery in Lagoa Do Peixe National Park (Brazil).
Van Kuik et al. (2022) quantified surface-area development of foredune trough blowouts and their associated parabolic dunes. They used GEE to automatically assess blowout surface area and shape using Landsat and Sentinel-2 imagery. They applied it to blowout systems in the Netherlands, Denmark and United States. First, a normalized difference water index (NDWI) and the Otsu thresholding algorithm were used to separate land and water. They minimised classification errors using morphological dilation and erosion. Then, a Canny edge detection algorithm was used on the land pixels to identify the transitions between sand and vegetation pixels. These edges were then buffered to determine an area where an Otsu thresholding of NDVI values would be applied to separate sand from vegetation pixels within the blowouts. Since the land cover mosaic in coastal areas is often fine grained causing a medium resolution pixel to contain more than one land cover type, LSU was used then to determine the proportion of each land cover type within a pixel. Land pixels with less than 50% vegetation cover were assigned to blowout.
Regional
Shorelines and beach width at the regional scale were studied by Aadland and Helland-Hansen (2019); Alves and Rossetti (2017); Angelini et al. (2024); Bergsma et al. (2020); Billet et al. (2023); Briceño de Urbaneja et al. (2024); Cabezas-Rabadán et al. (2019a, 2019b); Cenci et al. (2021); Demir et al. (2019); Dhanalakshmi et al. (2019); Duvat et al. (2017); ElKotby et al. (2023); Flores et al. (2020); Foti et al. (2023); Gzam et al. (2013); Hagenaars et al. (2018); Jolivet et al. (2019); Kazhukalo et al. (2023); Kefi et al. (2024); Liu et al. (2020); Mann and Westphal (2014); Markose et al. (2016); Mondal et al. (2020); Nandi et al. (2016); Natarajan et al. (2021); Natesan et al. (2014; 2015); Tappin et al. (2012); Valderrama-Landeros et al. (2022); Veettil et al. (2020); Webb and Kench (2010); Zhang et al. (2024, 2021). Again, most relied on visual photointerpretation and manual digitisation of shorelines. CoastSat was used by Billet et al. (2023) in a coastal area near Buenos Aires (Argentina). SHOREX was used by Cabezas-Rabadán et al. (2019a, 2019b) in Spain. Hagenaars et al. (2018) automatically generated SDS from Landsat and Sentinel-2 imagery with a method similar to the already mentioned by Van Kuik et al. (2022). They applied it to the case study of the Sand Motor mega-scale nourishment project in the Netherlands.
Zhang et al. (2021) propose a NDWI based method to assess shoreline evolution from Landsat imagery using CASPRS (Computer-aided shoreline position recognition software), which uses beach transects and sub-pixel recognition. CASPRS interpolates a point every 1 m of each transect, using bilinear interpolation to calculate the value of each point as a function of the four adjacent pixels. Subsequently, they used the interpolated transects to generate a NDWI index. The point with the sharpest change in NDWI indicates the waterline within each transect. They applied it to Haiyang beach (China).
Demir et al. (2019) use radar together with optical data. They present a nonparametric fuzzy shoreline extraction method based on Sentinel-1 and RASAT data and use it in two coastal sites in Turkey. They start with a binary classification of the optical RASAT imagery. Then, a fuzzy clustering algorithm is applied to the radar Sentinel-1 data. The fuzzy membership parameters were calculated based on the statistics of all pixels belonging to each of the classes (land and water).
Biogeographical variables were assessed by Block et al. (2016); Franklin et al. (2024); Gürkan and Kayikçi (2017); Marzialetti et al. (2021); Moulton et al. (2019); Nuyts et al. (2020); Timm et al. (2014); Todaro et al. (2024) and Veettil et al. (2020).
(Franklin et al., 2024) modelled shrub presence in relation to geomorphological variables using machine learning algorithms in a barrier island environment in Virginia (United States). Shrub presence was identified on Landsat imagery, and the geomorphological variables were derived from Landsat and LiDAR data.
Marzialetti et al. (2021) explored vegetation biodiversity in relation to remotely sensed spectral heterogeneity in a coastal dune environment in the Tyrrhenian coast (Italy) using VHR PlanetScope imagery. They used linear regressions to investigate the relationship between field alpha biodiversity and spectral variability in the remote sensing data. Beta biodiversity was also assessed through a distance decay model relating field indices and spectral measurements. For the spectral diversity analysis, a dataset of pixels with the same location and date of acquisition as the field data was collected. Spectral heterogeneity was found to be correlated with species diversity. More similar plots were also spectrally closer.
Dune and foredune morphology and erosion and deposition patterns were assessed in the studies by da Motta et al. (2015); Durai et al. (2021a, 2021b); (Franklin et al., 2024); Havivi et al. (2018); Marzialetti et al. (2020); Nuyts et al. (2020) and Toffani et al. (2024).
Marzialetti et al. (2020) used monthly Sentinel-2 imagery to map coastal dunes in a coastal environment in central Italy. They used a supervised iterative approach based on hierarchical clustering and Random forests. The input variables for classification were the per-pixel yearly diversity represented by the Rao’s Q index, and three spectral indices representing land cover temporal variability, vegetation biomass, and presence of water and bare surfaces.
Havivi et al. (2018) used InSAR coherence to map dune dynamics in a coastal site in Israel. The data used was TerraSAR-X. InSAR coherence is a method based on the phase difference between two InSAR datasets acquired at a different time. A high coherence between the two datasets indicates high similarity and thus, lack of change. In aeolian environments, InSAR decorrelation occurs rapidly because of erosional and depositional processes. The authors were able to characterise the stability of different dune features (crests, different orientation slopes).
Super-regional
Shoreline erosion/progradation was studied by Anwar and Rahman (2021); Besset et al. (2017); Chu et al. (2013); Dada et al. (2016); Danchenkov et al. (2023); Di Stefano et al. (2013); El Banna and Frihy (2009); Elewa and El Nahry (2009); Elfadaly et al. (2023); El-Zeiny et al. (2022); Emam et al. (2019); Feng et al. (2015); Gómez et al. (2017); Gorczynski et al. (2024); Hamylton and East (2012); Haque et al. (2024); Herlekar et al. (2023); Hoque et al. (2019); Hossain and Saha (2024); Kaliraj et al. (2014); Konlechner et al. (2020); Levin et al. (2017); Liu et al. (2013); Mao et al. (2021); Mbezi et al. (2024); Mishra et al. (2021); Misra and Balaji (2015); Mohd et al. (2018); Osanyintuyi et al. (2022); Padma et al. (2024); Pardo-Pascual et al. (2014); Pourkerman et al. (2018); Schellekens and Amani (2022); Septiangga and Mutaqin (2021); Shanmuga Priyaa and Jena (2021); Siyal et al. (2022); Sylaios et al. (2012); Veettil et al. (2024); Vos et al. (2023a); Zhang et al. (2018); Zhou et al. (2024). Again, most of these relied on visual assessment, spectral index calculation or already mentioned approaches like various supervised land cover classification algorithms, histogram thresholding, or tools such as CoastSat or ShorelineMonitor.
Mao et al. (2021) measured very large-scale shoreline change in Australia employing Landsat data and GEE. They began by building a yearly composite of Landsat data. This was used to calculate the automatic water extraction index (AWEI), which was segmented into water and land using histogram thresholding. This, together with a DEM, were used to create a mask of land area at high tide, which was overlapped with a vector file of shoreline buffers created previously from ancillary data. With this information, the authors calculate the average shoreline position and the land pixel count within each buffer.
Aly et al. (2012) and Al Fugura et al. (2011) used SAR (ERS-1 and 2 and RADARSAT-1, respectively). Al Fugura et al. (2011) worked in Malaysia and used edge detection methods, followed by a median filter on a moving window to smooth the image. Thresholding was used for the final segmentation. More effective is the method by Aly et al. (2012), which used InSAR coherence in Egypt to quantify erosion/accretion.
Biogeographic variables were assessed by Austrich et al. (2021); Cao et al. (2022); Debaine and Robin (2012); Gómez et al. (2017); Gorczynski et al. (2024); Hamylton and East (2012); Kozhoridze et al. (2022); Petrova et al. (2023); Ponnambalam et al. (2012); Misra and Balaji (2015); Shumack et al. (2017); Veettil et al. (2024) and Zhou et al. (2024). Most of them used methods very similar to the ones already mentioned or relied heavily on simplistic approaches such as manual digitisation.
The most interesting assessment was the one by Austrich et al. (2021). They studied landscape change and habitat fragmentation in dune barriers of the Buenos Aires province (Argentina). They used Landsat imagery and a maximum likelihood supervised classification to identify coastal dune habitat classes based on vegetation cover. Then, they analysed landscape change and structure using landscape metrics in R.
Dune morphological characteristics were assessed by Danchenkov et al. (2023); Levin et al. (2017); Rodríguez Paneque (2024); Sam et al. (2015) and Toffani (2020); Levin et al. (2017) studied coastal dune activity and foredune formation on Moreton Island (Australia) between the years 1944 and 2015 using a wide range of remote sensing data sources, including aerial photographs, LiDAR datasets, and satellite imagery (Corona and Ziyuan-3), together with wind information. They used a minimum distance supervised classification to detect bare sand surfaces in each of the satellite and aerial images. Then, post-classification change detection was performed. This method enables the quantification of area of bare sand, dune movement rate, number and length of foredunes, and coastline position changes. Sam et al. (2015) extracted 3-dimensional information from Cartosat-1 stereopairs of a site in Rajasthan.
Concluding remarks
Satellite remote sensing has a transformative role in monitoring coastal dune environments, offering scalable and repeatable methods. The integration of remote sensing with field methods enhances the understanding of dune dynamics across spatial and temporal scales. The increasing availability of satellite data, and the advances in machine learning and cloud-based platforms have expanded the analytical capabilities.
However, the review underscores research gaps, particularly in leveraging SAR data and automatically addressing high-energy coasts. Future studies should focus on refining existing workflows and incorporating artificial intelligence for automated feature detection. Strengthening interdisciplinary approaches and validating with field observations remain essential for robust coastal research.
Coastal areas are dynamic, requiring effective monitoring methods. This review discusses the integration of remote sensing with traditional field methods, the suitability of various scales of analysis, the growing availability of satellite data, and advancements in computational tools. Our approach emphasizes the importance of a scale-aware framework, as proposed by Walker et al. (2017), which divides research into plot, landform, and landscape scales. As expected, the review points to limited studies at the plot scale and the predominance of studies at the landscape scales (sub-regional, regional and super-regional). Very large-scale, global studies remain scarce due to data limitations.
In this paper, we have identified widely used satellite datasets such as Landsat missions and Copernicus Sentinel-2, which are favoured for their medium resolution, global coverage, and free availability. VHR data from sources like QuickBird and Pléiades are employed for finer spatial analyses, although their application is often constrained by cost and accessibility. SAR data, despite its advantages in atmospheric penetration and its sensibility to land deformation, appears underutilized compared to optical imagery.
The review points to main trends in terms of tools and research applications. Remote sensing methods and tools predominantly focus on shoreline detection and vegetation mapping. DSAS and CoastSat tools are prominent for shoreline monitoring, and spectral indices and land cover classification algorithms lead vegetation cover analyses. Visual photointerpretation and manual digitisation are still common.
Crucial limitations remain for the application of remote sensing tools to the study of coastal dunes, such as the need to identify methodologies to extract topographic data in this highly dynamic environment (Binetti et al., 2024). However, the increasing availability of satellite images, coupled with improvements in temporal and spatial resolutions, could lead to improved monitoring of coastal dunes, which in turn could enhance our understanding of coastal dune adaptations to sea-level rise and climate change.
Supplemental Material
Supplemental Material - The application of satellite remote sensing to coastal dune environments: A systematic review
Supplemental Material for The application of satellite remote sensing to coastal dune environments: A systematic review by Pilar Martín-Gallego, Irene Delgado-Fernandez, Christopher Marston in Physical Geography: Earth and Environment
Footnotes
Funding
The author(s) disclosed receipt of the following financial support for the research, authorship, and/or publication of this article: Funded by ProyExcel_00995 - Morfodinámica de dunas litorales: implicaciones para sistemas arenosos costeros (MODUL). Call: PAIDI2020, Junta de Andalucía (Spain).
Declaration of conflicting interests
The authors declared no potential conflicts of interest with respect to the research, authorship, and/or publication of this article.
Supplemental Material
Supplemental material for this article is available online.
References
Supplementary Material
Please find the following supplemental material available below.
For Open Access articles published under a Creative Commons License, all supplemental material carries the same license as the article it is associated with.
For non-Open Access articles published, all supplemental material carries a non-exclusive license, and permission requests for re-use of supplemental material or any part of supplemental material shall be sent directly to the copyright owner as specified in the copyright notice associated with the article.