
Abstract
Housing has emerged as a primary concern across a wide range of countries. Moving beyond the dominant focus on affordability and tenure outcomes, this paper builds on an emerging literature to develop a measure of cumulative housing disadvantage, focusing on dimensions of affordability, security, quality, suitability and neighbourhood satisfaction. Through an empirical study of the Netherlands for the 2009–2021 period, this paper charts exposures to both single and cumulative housing disadvantage. It finds overall increasing exposures and social inequalities, underpinned by complex temporal dynamics. Trends furthermore point towards shifting intra- and inter-tenurial inequalities, as shaped by policies of homeownership polarization, social-rental residualization and private-rental liberalization. The paper’s findings trigger discussions about (i) the values and limits of composite measures of housing disadvantage, (ii) dynamics tenure relations rather than static binaries and (iii) the role of housing policy and institutions in structuring unequal exposures to housing disadvantage.
Introduction
Across countries, growing numbers of people find themselves struggling on the housing market. This has spurred public and political discourses around housing crises that urgently need addressing (e.g. Heslop and Ormerod, 2020; Madden and Marcuse, 2016; Wetzstein, 2017). These adverse housing trends do not exist in isolation, but go hand in hand with deepening inequalities in terms of both income (Chancel and Piketty, 2021) and wealth (Pfeffer and Waitkus, 2021; Zucman, 2019) which structure uneven housing opportunities. In assessing or problematizing housing problems, the development of house prices is routinely taken as the most important indicator, particularly in public debate. Beyond suggesting declining housing affordability, high and increasing house prices are taken to represent a crucial barrier that excludes housing-market outsiders such as young adults and lower-income households from achieving homeownership.
Such a focus is too narrow for various interconnected reasons. First, it assumes a rigid tenure binary between owners and renters. While tenurial inequalities are certainly real and important, this is a very static approach that risks ignoring inter-tenurial dynamics as well as intra-tenurial inequalities. The former recognizes that inequalities between tenures are liable to change, while the latter stresses the importance of inequalities within tenures. Second, and building on the previous point, in order to paint a better picture of the housing crisis, other dimensions of what constitutes ‘adequate’ or ‘good’ housing beyond affordability need to be incorporated. Third, the housing crisis may be particularly impactful in those cases where multiple dimensions of housing disadvantage intersect. In other words, in order to understand social inequalities in housing it is urgent to chart the prevalence of multidimensional and potentially cumulative housing disadvantage across populations.
This paper seeks to address these points through two interconnected contributions. First, conceptually, this paper forwards a political-economic framework that focuses on dynamic tenurial relations, shaped by a politics of housing restructuring, to understand degrees of housing disadvantage and social inequalities therein. It does so by focusing on three central forms of housing restructuring: (1) homeownership polarization, (2) social-rental residualization and (3) private-rental liberalization. Second, empirically, this paper draws on the concept of cumulative housing disadvantage as a lens to empirically gauge social inequalities in housing and their development over time. The measure combines different dimensions of housing disadvantage, specifically pertaining to affordability, security, quality, suitability and location.
The paper presents an analysis of the Netherlands over the period 2009–2021, drawing on detailed triennial survey data. The Dutch housing system can be conceived of having a rather unique ‘starting point’ but being on a ‘similar trajectory’ to the housing systems of many other higher-income countries (see Aalbers, 2022). The former is reflected, inter alia, by a still comparatively large social-rental sector and strong tenant protections, while the latter pertains to similar policies of housing liberalization.
Empirical findings reveal an overall increase in cumulative housing disadvantage and an increase in social inequalities therein. Yet, this seemingly straightforward message is underpinned by more complicated dynamics. A first period (2009–2015) is marked by overall increasing cumulative housing disadvantage as well as increasing social inequalities along some axes (e.g. income, age). This is followed by a period (2015–2021) of overall stabilization but a further polarization. Furthermore, despite increases in cumulative housing disadvantage, what may be called ‘single’ housing disadvantage – that is, the experience of one type of housing disadvantage – remains substantially more common across populations and housing situations. These findings trigger a wider conceptual discussion about the uses and limits of a concept like cumulative housing disadvantage and similar composite measures.
These findings have relevance beyond the realm of housing. Sociologists have recently started to problematize the hidden or marginalized position of housing in the study of social inequality and poverty specifically (e.g. DeLuca and Rosen, 2022; Desmond, 2018), while urban scholars have problematized the spatial polarization of housing markets (Arundel et al., 2024; Hochstenbach and Arundel, 2020). In political science, too, housing has been put back on the agenda as ‘both a proxy for and a cause of growing social cleavages that shape how citizens view political issues’ (Ansell, 2019: 165) while health research has established housing as an important domain to achieve health equity (Marmot et al., 2008). The present paper informs such debates by focusing on different forms of housing disadvantage.
Literature
Cumulative housing disadvantage
An emergent body of work critiques the dominant focus on affordability and tenure in understanding levels of housing inequality. DeLuca and Rosen (2022: 358), for example, conceive of housing insecurity ‘as a dynamic process’ that is embedded ‘within a set of social relations that extend beyond mere affordability’. They subsequently conceptualize housing insecurity as comprised of ‘having difficulty acquiring housing, having minimal control over one’s housing, being at risk of losing housing, being uncertain about tenure, or living in housing that does not meet basic household needs’ (DeLuca and Rosen, 2022: 346). In a similar vein, Clair et al. (2019) adapted a focus on housing precariousness to refer to a ‘state of uncertainty which increases a person’s real or perceived likelihood of experiencing an adverse event, caused (at least in part) by their relationship with their housing provider, the physical qualities, affordability, security of their home, and access to essential services’ (Clair et al., 2019: 16). Clair and colleagues subsequently construct a cross-European precariousness measure compiling affordability, security, quality and access to services into a single score.
Beyond acknowledging the multidimensional character of housing disadvantage, it is important to study the potentially cumulative character of housing disadvantage, characterized by ‘overlaps and interactions’ between dimensions (Clair et al., 2019: 26). Baker et al. (2017: 2) for example argue that individual housing dimensions such as affordability, security or quality are typically considered in isolation but should rather be conceived of as components that ‘work together as housing bundles’. Not doing so runs the risk of ‘under-estimating the scale of the overall impact of poor housing’ as well as ‘ignoring important interactions between parts of housing bundles’ (Baker et al., 2017: 2). Individual housing components may, for example, only have a minor impact on outcomes such as health but taken together represent a key social determinant (Swope and Hernández, 2019). Baker et al. (2017) therefore construct an ‘Index of Housing Insults’ to show that the simultaneous, or bundled, occurrence of housing disadvantages may structure particularly adverse health outcomes (also Hewton et al., 2025). Park and Seo (2023) similarly measure the association between the number of housing problems experienced by populations and psychological health. Waldron (2023), finally, develops a Housing Precarity Index, arguing that it is important to distinguish between households experiencing some precarity, and those experiencing ‘severe precarity’.
The present paper builds on, and adds to these literatures by introducing the concept of cumulative housing disadvantage. Despite similarities, my approach is distinct from these studies in several ways. First, conceptually, various studies understand the experience of housing problems, such as those pertaining to affordability or quality, as one of insecurity, instability or, more broadly, precariousness. Central, here, is that these concepts assume a state of ‘uncertainty’, as shaped by a lack of stability and continuity (e.g. Clair et al., 2019: 16). This is certainly a very important and common aspect of the experience. It is, however, not the only one. Housing problems may also be experienced in otherwise very stable and predictable housing situations, where residential continuity is not threatened. To be sure, this is mostly a matter of conceptual framing, rather than operationalization. Second, empirically, this paper measures cumulative housing disadvantage alongside the prevalence of what may be termed single housing disadvantage. This may appear mundane, but is an important point. For one, it is possible that single and cumulative housing disadvantages affect different populations, or may alternatively overlap. Also, trends in exposures may differ, or even move in opposite directions. For example, exposures to cumulative housing disadvantage may increase, while exposures to single instances may decrease. Third, the present paper brings cumulative housing disadvantage more explicitly in conversation with a political-economic analysis of housing restructuring. That is, cumulative housing disadvantage is not simply ‘out there’ but is actively produced, reproduced or mitigated through housing institutions and policies. These extend beyond individual housing policies but rather pertain to deeply rooted ideologies, socio-political arrangements and state-market relations (Madden and Marcuse, 2016).
Housing ideology as a basis for housing restructuring
Housing restructuring is not a neutral process. It represents dominant housing ideologies, that is, the ‘norms, values, goals, and categories used to generate knowledge about housing’ and the differential valorization of different types and categories of housing (White and Madden, 2024: 1371). The dominant housing ideology of recent decades has been that of homeownership (Kohl, 2020; Ronald, 2008), which entails the ‘idealization, lubrication and subsidization’ of the tenure (Christophers, 2021: 574). It idealizes and normalizes owner-occupancy assuming that it creates affluent, independent, proud and responsible citizens. It has legitimized and naturalized massive support and subsidization of the tenure (Desmond, 2023), intergenerational transfers (Moor and Friedman, 2021) and a deregulation and subsequent explosion of mortgage lending (Aalbers, 2016; Kohl, 2021). Such housing ideology does not exist in isolation but reflects and reproduces societal norms, values and goals that extend far beyond housing. More specifically, authors have noted how the ideology of homeownership reflects and performs the ideology of capital (Aalbers and Christophers, 2014: 384), for example, through an emphasis on private property rights and private accumulation as a basis for future asset-based welfare (Doling and Ronald, 2010; Watson, 2010), as well as individualizing responsibility and therefore playing into meritocratic notions of individualized success and failure (Mijs, 2021; Sandel, 2020) which also shifts political preferences away from collective provisions such as welfare safety nets (Ansell, 2019).
The superiorization of homeownership, at the same time, cannot exist without its counterpart: the inferiorization of rental housing – particularly social rental – and its tenants, especially those that are dependent on social rental or otherwise state supported forms of rental housing for longer stretches of time. This delegitimization has pushed policies reducing social-rental shares, slashing funding for new constructions, maintenance and affordability, while reforming the tenure from a broadly accessible merit good to a last resort ‘ambulance service’ for marginalized populations (Byrne and Norris, 2022; Christophers, 2013; Kholodilin et al., 2024; Van Gent and Hochstenbach, 2020).
In the post-GFC era, the promises of homeownership ideology have increasingly proven false (Arundel and Ronald, 2021) with particularly outsiders, lower-income populations and younger generations finding themselves unable to buy and thus excluded from homeownership advantages (Dewilde and Flynn, 2021; McKee, 2012) while also confronted with a lack of adequate rental options (Howard et al., 2024). These trends have given rise to policies promoting private renting as a solution for populations excluded from both owner-occupancy and social rental, in turn legitimizing policies weakening rent regulations and tenant protections to boost private-rental investment (Aalbers et al., 2021).
On the one hand, the turn towards private renting extends homeownership ideology. While the latter propagates private accumulation through single owner-occupancy, the former encourages accumulation through multiple property ownership. Private rental is furthermore promoted as a flexible tenure en route to homeownership, merely postponing the promise of homeownership. On the other hand, the two are by definition contradictory. The advance of landlordism, in particular through the purchase of what used to be owner-occupied stock (buy-to-let), undermines owner-occupancy for those that would previously been able to buy.
The centrality of tenure in analyses of housing inequality
The discussion above points to the relevance of housing as either a basis for class formation – as the concept of ‘housing classes’ suggests (Dunleavy, 1979; Rex and Moore, 1967; Saunders, 1984) – or at least an important driver of social inequalities (Hochstenbach et al., 2025). Recent studies have argued the stratifying role of housing has become more important, as unprecedented house price inflation has substantially boosted the economic position of property owners (Adkins et al., 2021; Forrest and Hirayama, 2018; Pfeffer and Waitkus, 2021; Ryan-Collins and Murray, 2023) while increased housing cost burdens among tenants amount to a structural condition of poverty and social exclusion (Desmond, 2018; Dewilde, 2018). These divergent trends lead some to conclude that the ownership of housing as a wealth generating asset is increasingly a prerequisite to be able to pursue comfortable middle-class life course and housing trajectories (Adkins et al., 2021).
These discussions, to a large degree, revolve around tenure, not in the least due to aforementioned housing ideologies promoting property ownership and pushing for ‘tenure-divided societies’ (Christophers, 2021; Smith, 2015: 62). A focus on cumulative housing disadvantage deepens such analyses in several ways. First, it complements the typical focus on economic disparities and the wealth-accumulation potentials generated by homeownership, by drawing attention to other dimensions such as security or quality. In doing so, it highlights various intra-tenurial inequalities. Second, it complicates static understandings of tenure by illuminating how inter-tenurial inequalities are not stable over time but constantly in flux and subject to shifting political arrangements.
Data, variables and methods
This paper draws on the Netherlands’ Housing Survey (Woon Onderzoek Nederland, or WoON), a cross-sectional triennial survey conducted by Statistics Netherlands (CBS) focusing on housing and living conditions and subjective experiences. Statistics Netherlands enriches the survey data with register data on selected population and housing characteristics. 1 For reasons of data consistency, this paper focuses on the 2009–2021 period. Respondents with missing information on housing tenure, housing costs and indicators such as income were excluded from the analyses. Households with an annual gross income below 3000 euros (in 2021, corrected for inflation across waves) were also removed as these represent unrealistically low incomes. After data cleaning and selection, the survey waves contained 67,063 respondents (in 2009), 58,267 (in 2012), 53,195 (in 2015), 56,542 (in 2018) and 38,974 (in 2021). The surveys provide pre-constructed household weights to correct for the over and underrepresentation of groups, taking into account respondent sex, age, migration background and place of residence. All analyses are run using these weights.
The next section, ‘Housing restructuring across tenure,’ first charts key trends pertaining to homeownership polarization, social-rental residualization and private-rental liberalization. These trends are derived from, and substantiated by, literatures discussing key political and socio-economical shifts shaping the Dutch housing system. They are further illustrated drawing on the WoON surveys.
The ‘Cumulative housing disadvantage’ section empirically unravels the degree to which different populations are exposed to both single and cumulative housing disadvantage, and changes therein. It defines and operationalizes five binary dimensions (explained in more detail in Table A1):
(1) Unaffordability (households spending 30% or more of their disposable income on basic housing costs) 2 ;
(2) Insecurity (households in a temporary or unstable housing situation);
(3) Low quality (self-rated measure of living in poorly maintained housing);
(4) Unsuitability (total number of rooms is lower than number of household members);
(5) Neighbourhood dissatisfaction (self-rated measure of disliking neighbourhood of residence).
The selection of these particular dimensions is based on previous studies similarly seeking to chart multiple dimensions of housing disadvantage (e.g. Baker et al., 2017; Clair et al., 2019; Debrunner et al., 2024; Park and Seo, 2023; Waldron, 2023). Their operationalization is shaped by data availability across survey waves: in terms of quality, more recent survey waves provide more detailed variables such as poor energy labels, single-glazed windows or the presence of mould, but these are not available for previous waves. The insecurity dimension includes variables on temporary rental contracts, expecting a forced move (within 2 years), needing to move due to relationship dissolution, or wanting to move to independent housing. These latter two indicators have been included as they undermine the stability and continuity of the home. However, employing a more narrow operationalization of insecurity (only focusing on short-term contracts and forced moves) yields very similar distributions and modelled outcomes. In terms of unsuitable housing, this paper has to rely on the relatively crude measure of number of rooms in relation to household size. A more precise measure would require number of bedrooms, but this indicator is unavailable. The current operationalization represents a relatively strict definition of unsuitability, contributing to relatively low exposures.
The next question is whether it makes sense to combine these dimensions into a composite measure. Following Baker et al. (2017: 6, italics in original), it is important to stress here that the measure ‘captures the trade-off and bundling of housing attributes: it therefore includes indicator variables that are not highly correlated – a bundle of similar attributes will not necessarily be highly correlated with an alternative trade-off bundle of attributes’. Precisely because these dimensions represent important trade-offs, their combination into a single measure should be theoretically guided, rather than based on a factor analysis or principal component analysis. The cumulative housing disadvantage measure is a count of the number of housing problems experienced (thus, ranging from 0 to 5). All dimensions are ascribed the same importance, lacking a substantive basis for applying weights. Alternative weighting would have also been an option, as one may consider some dimensions more important than others. I mitigate this issue by also presenting exposures to separate dimensions, giving crucial insights into how underlying indicators feed into cumulative scores.
The paper descriptively charts mean exposures, individual dimensions of housing disadvantage and the prevalence of single and cumulative housing disadvantage. This gives a nuanced overview of the extent and depth of exposures. It does so across survey waves (2009–2021) and stratified across population categories across six key dimensions (further elaborated in Table A1): housing tenure (outright owner-occupation, mortgaged owner-occupation, social rental, private rental), urbanity of place of residence (high, medium, low), having recently moved (over the last 2 years), income (equal tertiles of disposable household income), age (17–34, 35–44, 45–65, 65+) and migration background (native Dutch, non-western and western 3 ). The latter two dimensions are based on household main earner.
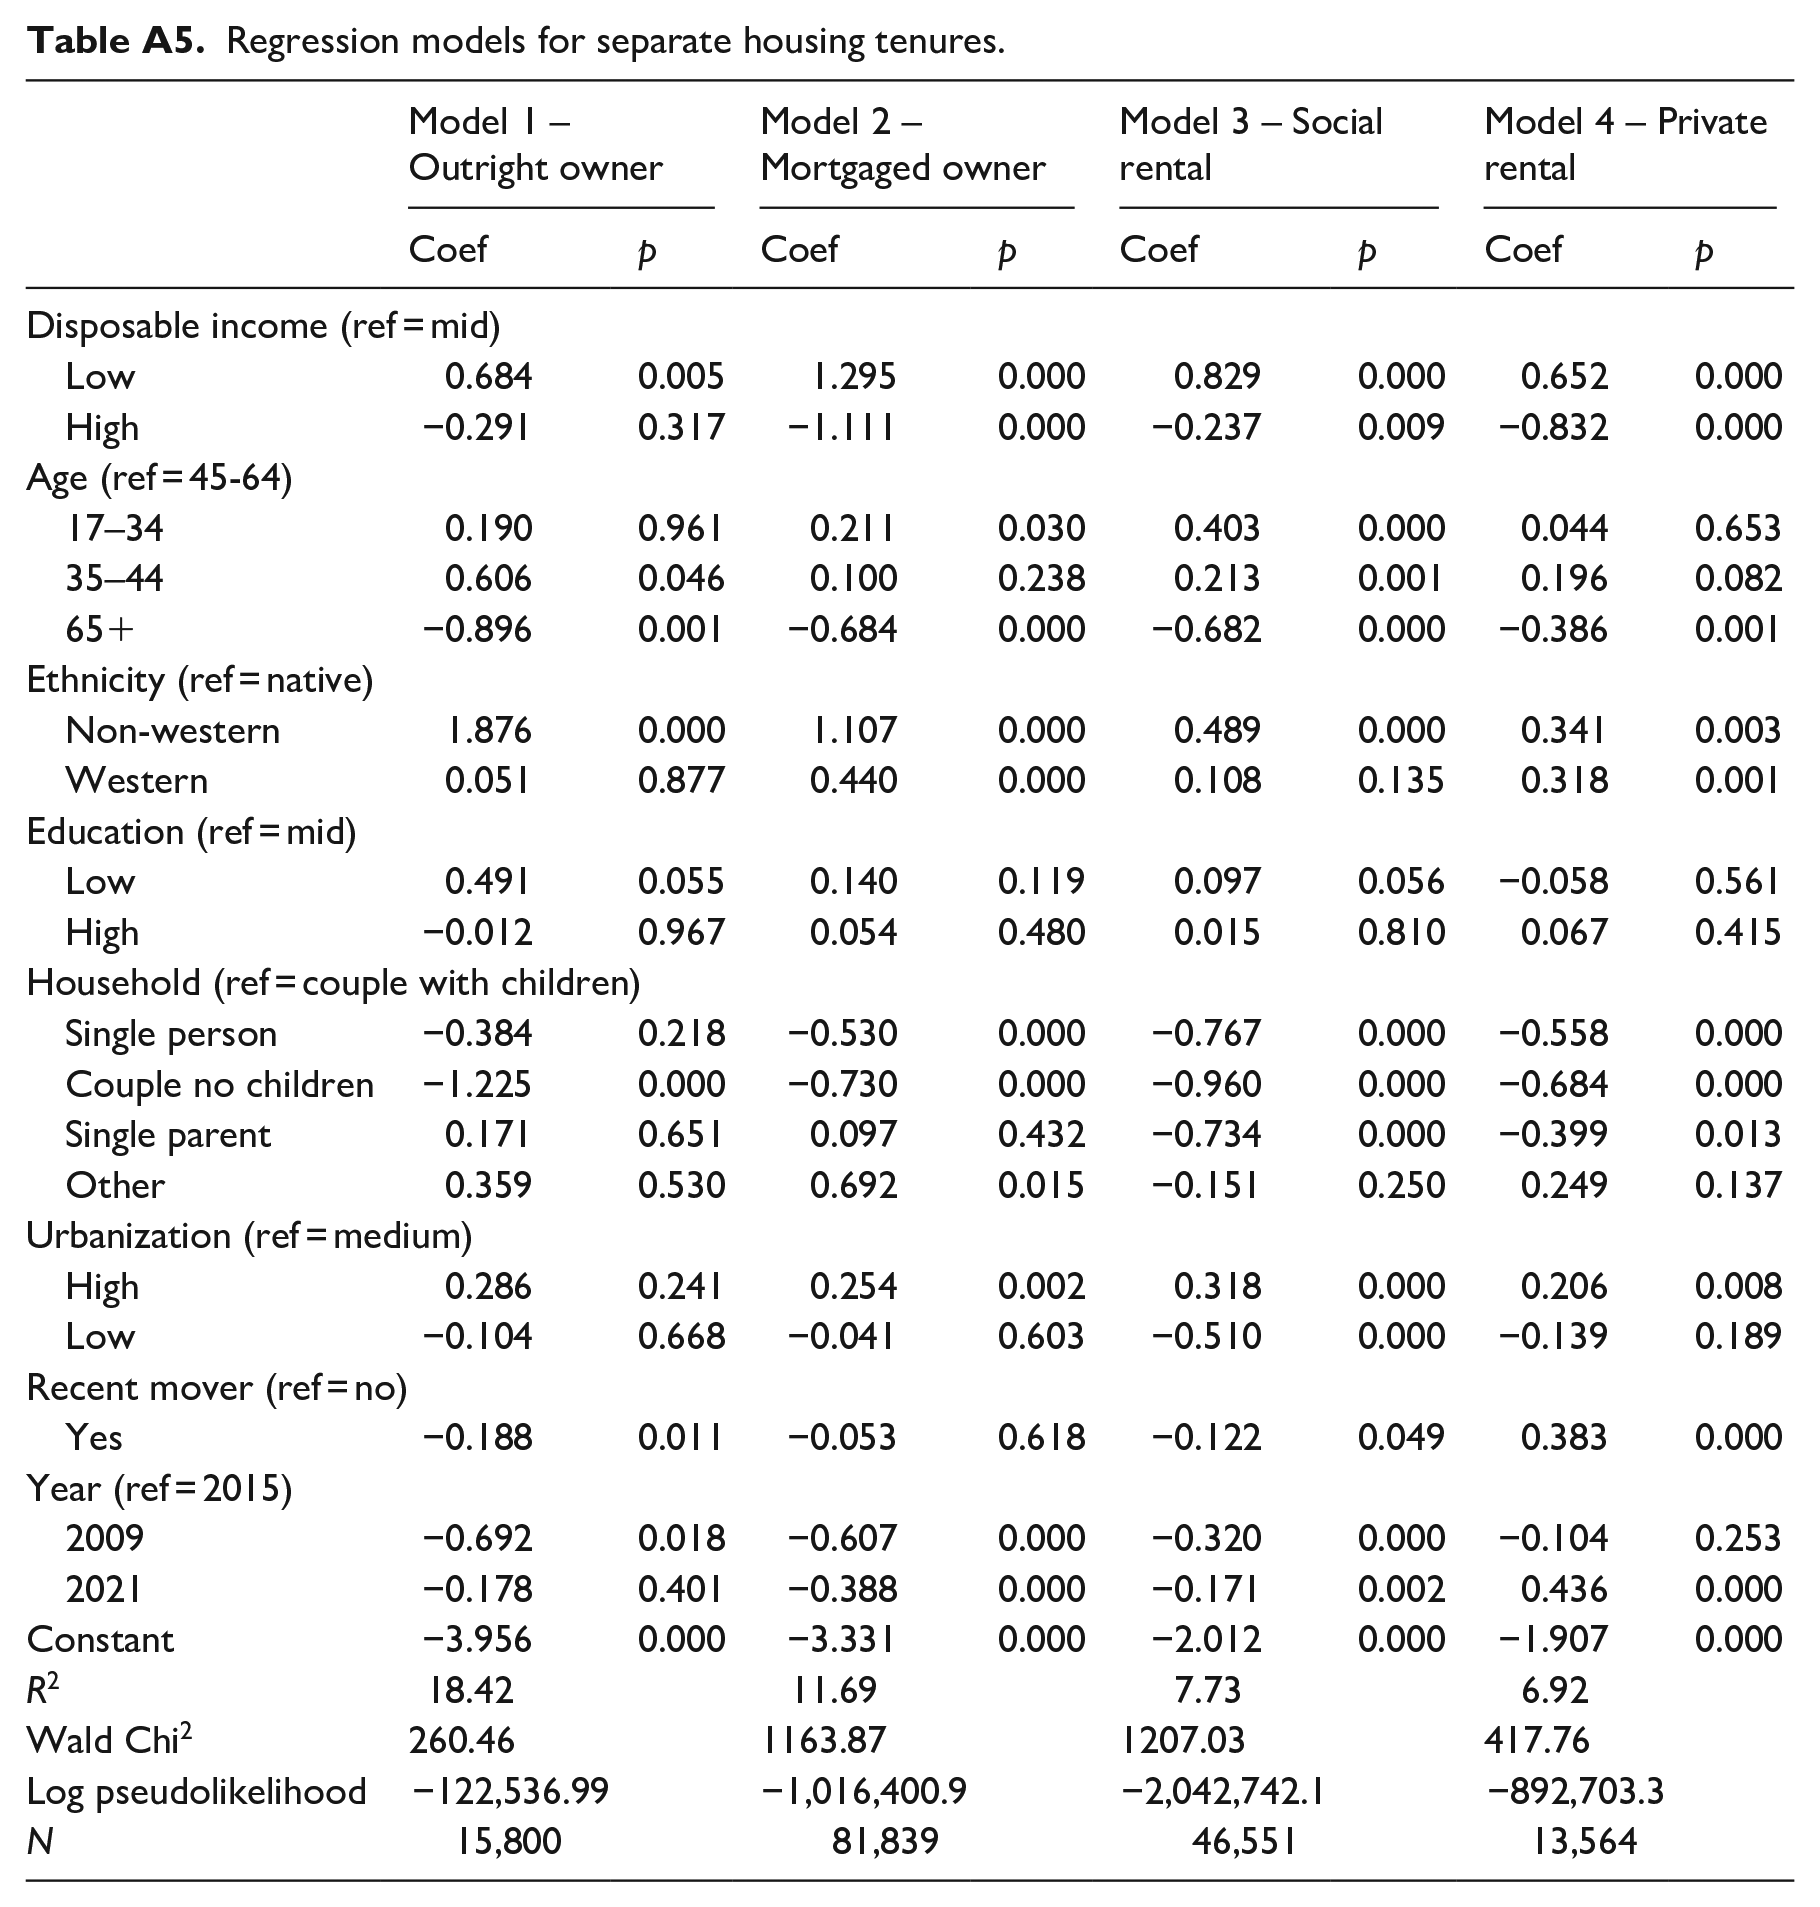
Finally, the 2009, 2015 and 2021 survey waves are pooled in a logit model with a cumulative housing disadvantage dummy as dependent variable, focusing on exposure to two or more disadvantages. In lieu of clear theoretical reasons to focus on the experience of even more disadvantages, this threshold was chosen for the practical reason that three or more simultaneous occurrences are rare in the data (Table 1), which in itself reflects the trade-offs involved across these housing dimensions. The indicators described above are included as independent variables, plus household composition and main earner education level. All indicators are interacted with a survey year-variable to not only control for survey wave but also acknowledge that associations with cumulative housing disadvantage may change over time. The results section below presents predictive margins of these interactions (descriptive statistics and full model can be found in Tables A2 and A3, respectively). As a robustness check, separate regression models for each of the three wave-years (Table A4) as well as per housing tenure (Table A5) were estimated.
Share of the population exposed to N dimensions of housing disadvantages by wave-year.
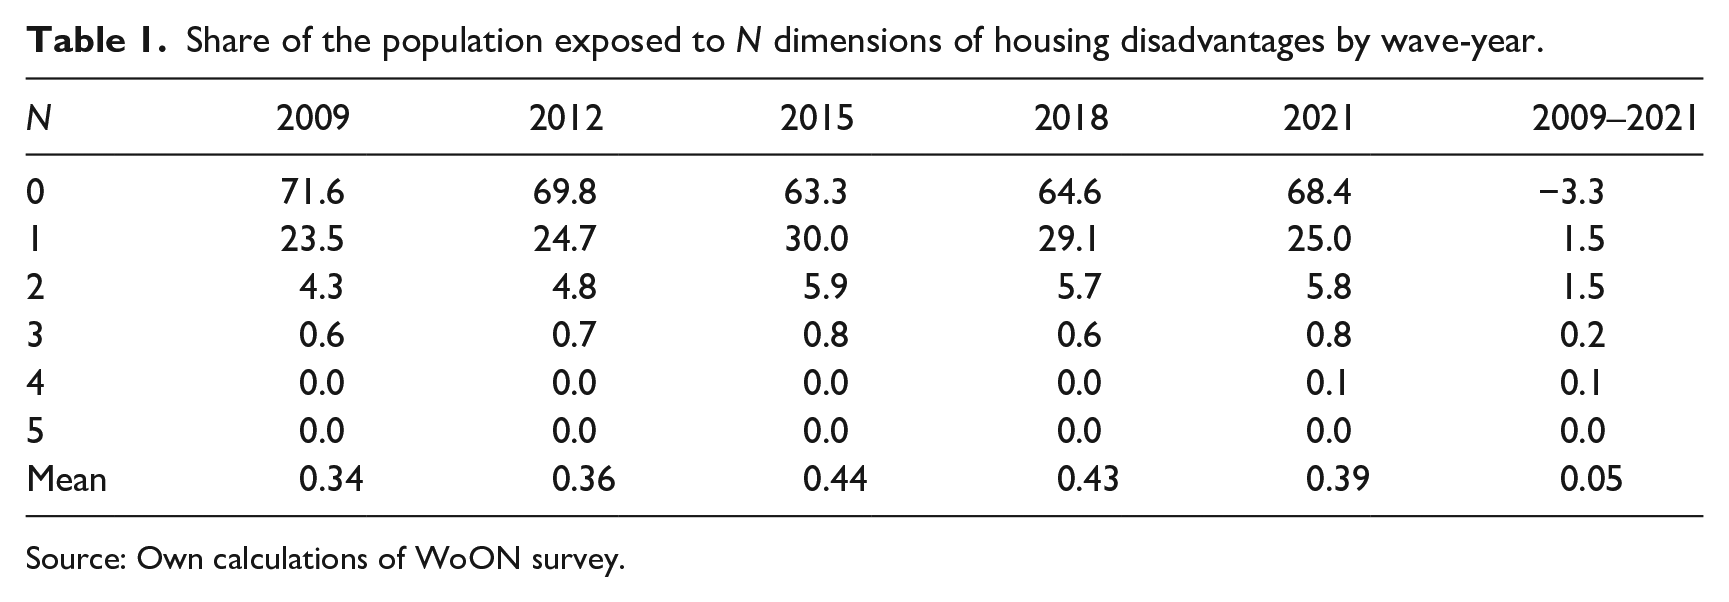
Source: Own calculations of WoON survey.
Housing restructuring across tenure
This section outlines three key dimensions of recent housing restructuring in the Netherlands: homeownership polarization, social-rental residualization, private-rental liberalization. The discussion here pertains specifically to the Dutch housing system, although the trends discussed have a wider applicability. These rounds of housing restructuring are important in understanding how exposures to cumulative housing disadvantage and inequalities therein are produced over time. First, they structure the sorting of populations into different tenures, for example by closing off or opening housing opportunities to specific populations. This subsequently influences exposure to or protection from housing disadvantages. Second, they directly influence the degree to which each tenure is associated with housing disadvantage, for example, through uneven patterns of investment. Housing restructuring as discussed here is the product of intricate housing politics and struggles. Due to limitations of space, focus here is primarily on how this restructuring materialized.
Homeownership polarization
Homeownership rates in the Netherlands, like in many other countries, saw a long-term increase enabled by supportive government policies, subsidization and mortgage-credit expansion, as part of a broader ideological idealization of private ownership (Ronald, 2008). Rates went up from 35% in 1970, to 56% in 2010 (Musterd, 2014). Where other countries like the UK and US subsequently saw sharp decreases in owner-occupancy in the years preceding and following the GFC (Ronald and Kadi, 2018; Ryan-Collins, 2018), Dutch ownership rates stagnated at around 58%. However, homeownership attainment did polarize along the lines of age and income (Figure 1). Ownership rates among young adults (aged 17–34) and low-income households (poorest tertile) were already relatively low at 49% and 29% in 2009, respectively, and have since declined to 42% and 22% in 2021. Conversely, ownership rates further increased among the old and rich.
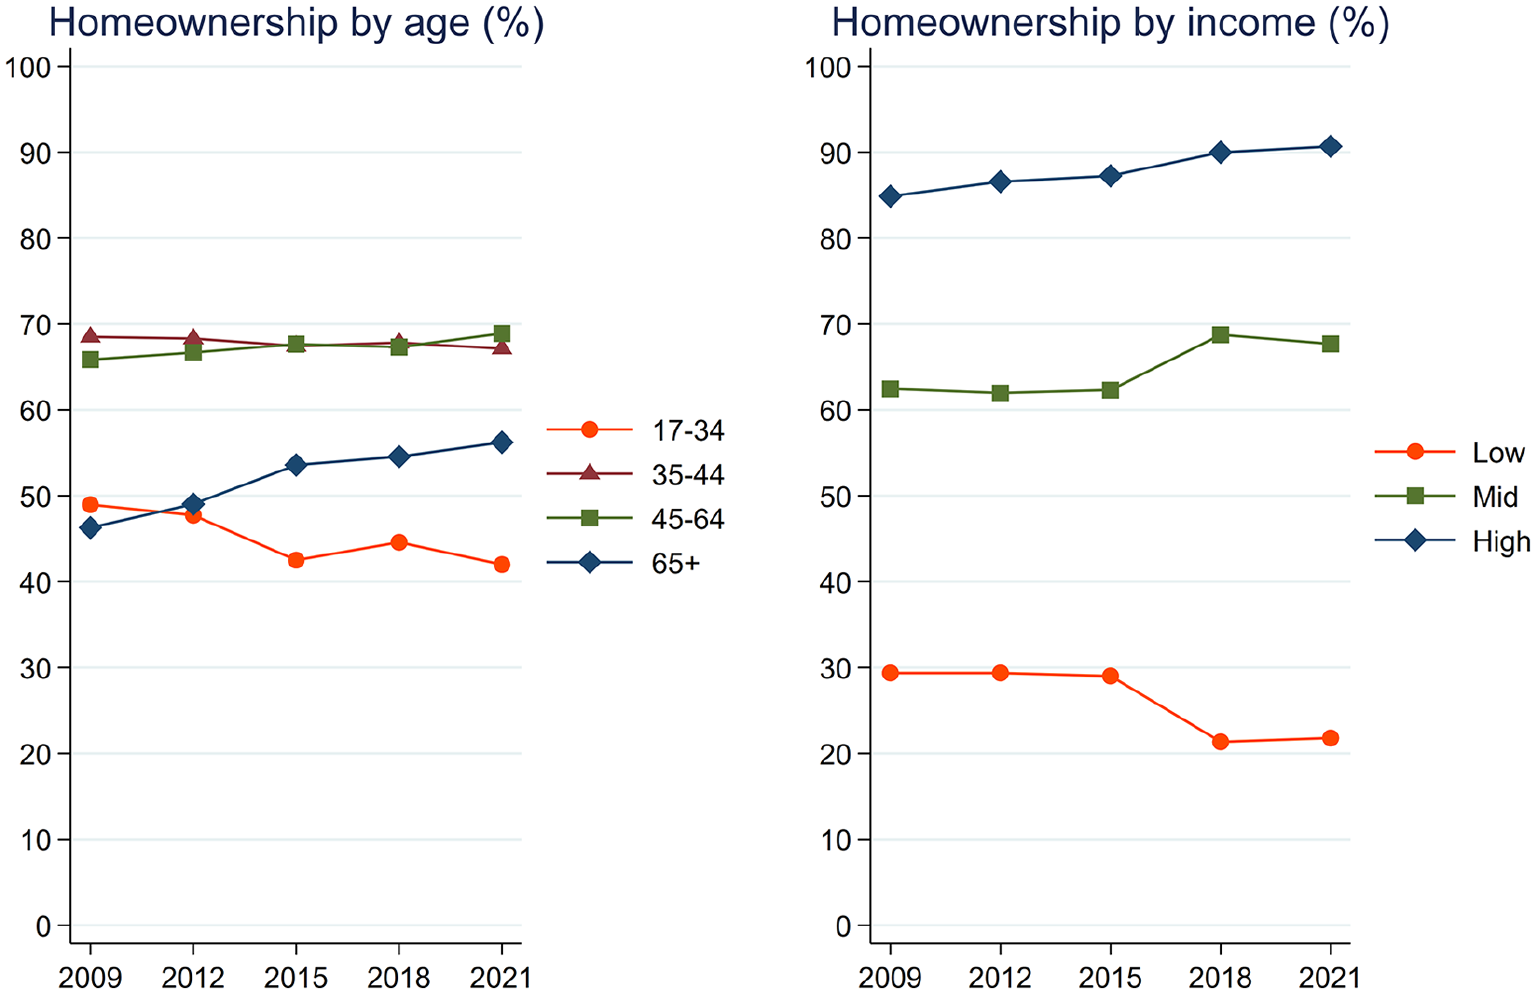
Homeownership rates by age groups (left panel) and income tertiles (right panel), 2009–2021.
Homeownership polarization needs to be considered an outcome of the interaction between policy reforms and economic developments. Following the GFC and the systemic risks it exposed, national government imposed tighter mortgage lending criteria. Ownership markets have, subsequently, become more geared towards ‘prime’ households (Forrest and Hirayama, 2015), that is, those with a good income, stable employment and, crucially, assets at their disposal. Hochstenbach and Aalbers (2024: 644, italics in original) describe this as part of an intensified dynamic ‘of the investment of private wealth in the housing market, supplementing rather than replacing mortgage debt’, entrenching inequalities between groups that do have assets at their disposal and those that don’t. This creates a self-reinforcing feedback cycle, as ownership itself has become more crucial as a source of wealth accumulation (Pfeffer and Waitkus, 2021) contributing to stark wealth inequalities between owners and renters.
As ownership is typically associated with various aspects of housing advantage – itself a consequence of homeownership ideology that has stimulated and subsidized ownership – it is to be expected that the trend of homeownership polarization will result in steeper inequalities in (cumulative) housing disadvantage.
Social-rental residualization
The second key trend pertains to social-rental residualization. Narrowly defined, residualization refers to the process where social housing is increasingly reserved for the poorest or most marginalized members of society. Yet, it is frequently taken to also include a shrinking social-rental stock, a withdrawal of investments and a further symbolic denigration of the tenure. In the Netherlands, the share of social rent, while still relatively large, declined from 34% of all housing in 2009 to 27% in 2021 (Figure 2). This decline was politically induced, under efforts to prioritize homeownership and market allocation, recasting social rent as a last resort tenure. Following the GFC, national government introduced austerity measures and imposed extra taxation slashing housing associations’ financial capacity (Boelhouwer and Priemus, 2014). Furthermore, around the GFC, various housing associations were involved in large scandals, the most consequential of them involving housing association Vestia losing billions of euros through derivatives speculation (Aalbers et al., 2017). This had financial repercussions but also, and perhaps more importantly, turned public sentiment against the social-rental sector, legitimizing punitive measures as well as juridically curtailing housing associations in their activities.
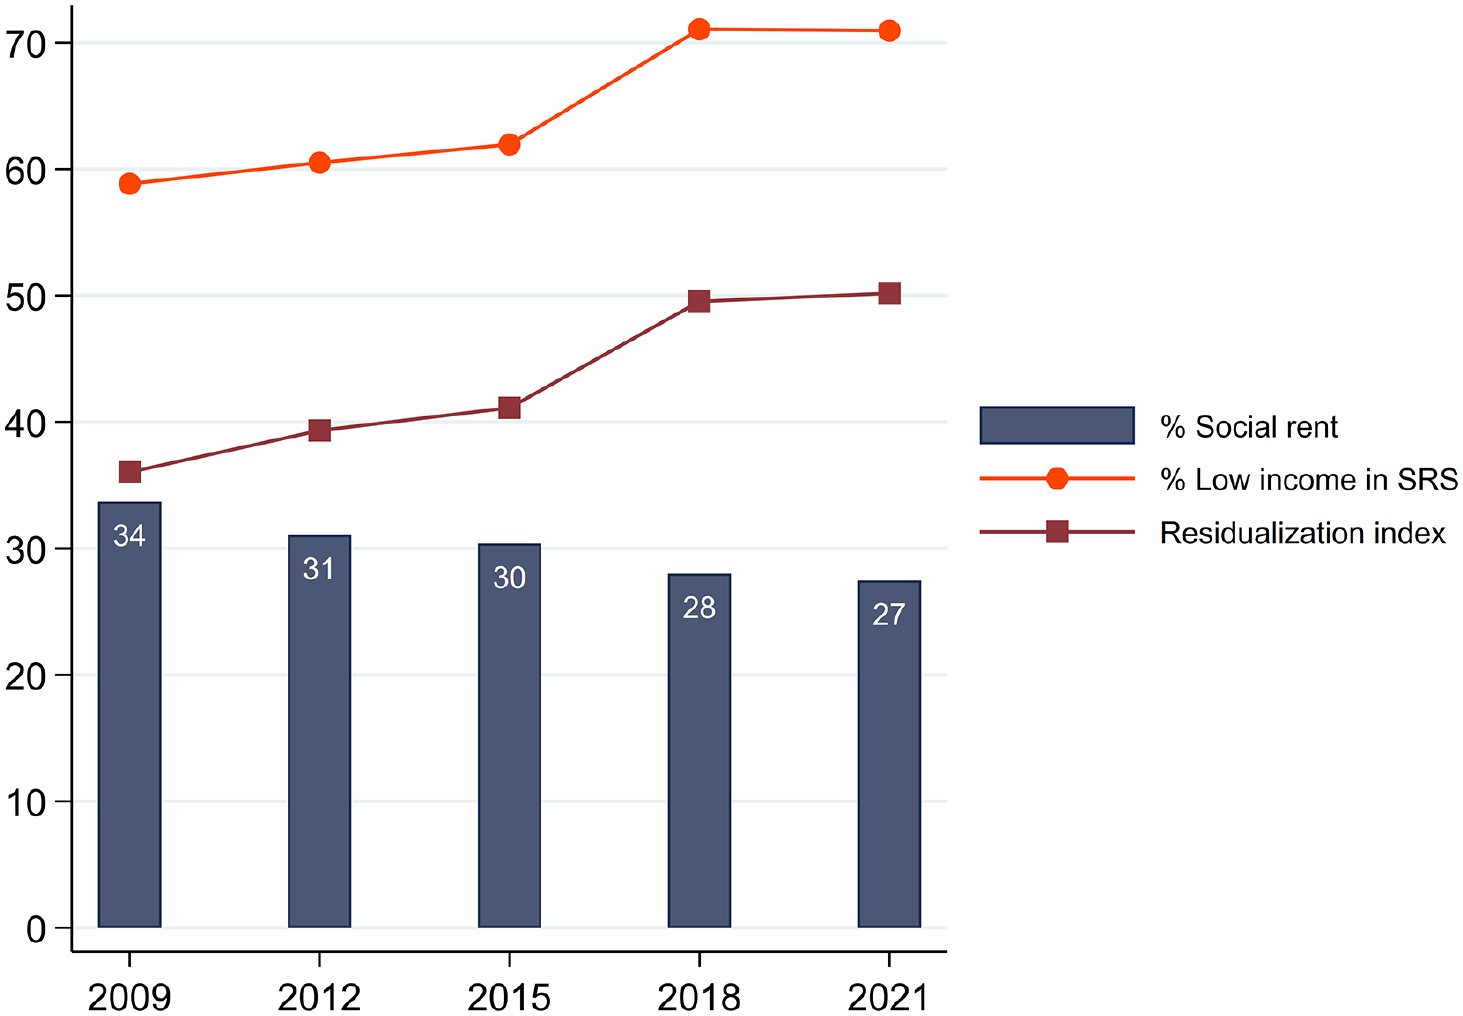
Indicators of social-rental residualization 2009–2021.
Tenant composition shows a clear residualization trend. In 2009, some 59% of all social renters belonged to the poorest income tertile, by 2021 this had increased to 71% (Figure 2), a trend that is underscored by an increase of the more refined residualization index from 36 to 50. Residualization has become strongly institutionalized in the period under study. In 2011, the Dutch state implemented strict eligibility criteria for social rent, effectively limiting access to low-income households. While this decision was taken to comply with EU-requirements, it certainly also fitted political ambitions of consecutive centre-right governments prioritizing market-based provision. The 2015 Housing Act further formalized allocation criteria, for example, stipulating allocation of the cheapest units to the poorest groups (Van Gent and Hochstenbach, 2020).
It is to be expected that residualization increases exposure to housing disadvantage, although two alternative scenarios can be formulated regarding the populations that will be impacted. A first scenario would be that marginalization and austerity measures are offloaded to social renters, for example, in the form of extra rent increases and/or disinvestment. This would increase exposures among social renters, ultimately deepening social inequalities. A second scenario suggests the social-rental sector may continue to protect its renters, but particularly expose those now excluded and pushed to other tenures, many of them middle-income households, complicating inequalities. In this case, cumulative housing disadvantages within social-rental sector would not (significantly) increase, shifting them to other housing segments instead.
Private-rental liberalization
Following the GFC, the Dutch private-rental sector returned to growth after decades-long decline: from some 9% in 2009 to 14% in 2021 (Figure 3), accounting for around 40% of absolute housing-stock growth over this period (Hochstenbach, 2023). While this reversal of trends has various interconnected drivers, an important one results from both homeownership polarization and social-rental residualization which have left a growing number of households excluded from both tenures. Policy and market actors have subsequently embraced private renting as the solution to accommodate this ‘squeezed middle’, disproportionally consisting of middle-income and young households. Dutch national government implemented policies seeking to entice private housing investors to boost supply (Aalbers et al., 2021). It enabled many landlords to increase rents between tenancies by shifting property from the rent-regulated to the rent-liberalized sector, enhancing profitability. Maximum rents in the regulated segment are based on an elaborate ‘point system’ including many indicators pertaining to dwelling quality, size and location. The maximum regulated rent was 752 euros in 2021 (subject to annual change). If a dwelling scores more points, the property can be rented out in the liberalized segments where starting rents can be freely determined. Changes to the calculation system, particularly the introduction of assessed house values to the system, have smoothed liberalization, particularly in popular locations like the larger cities.
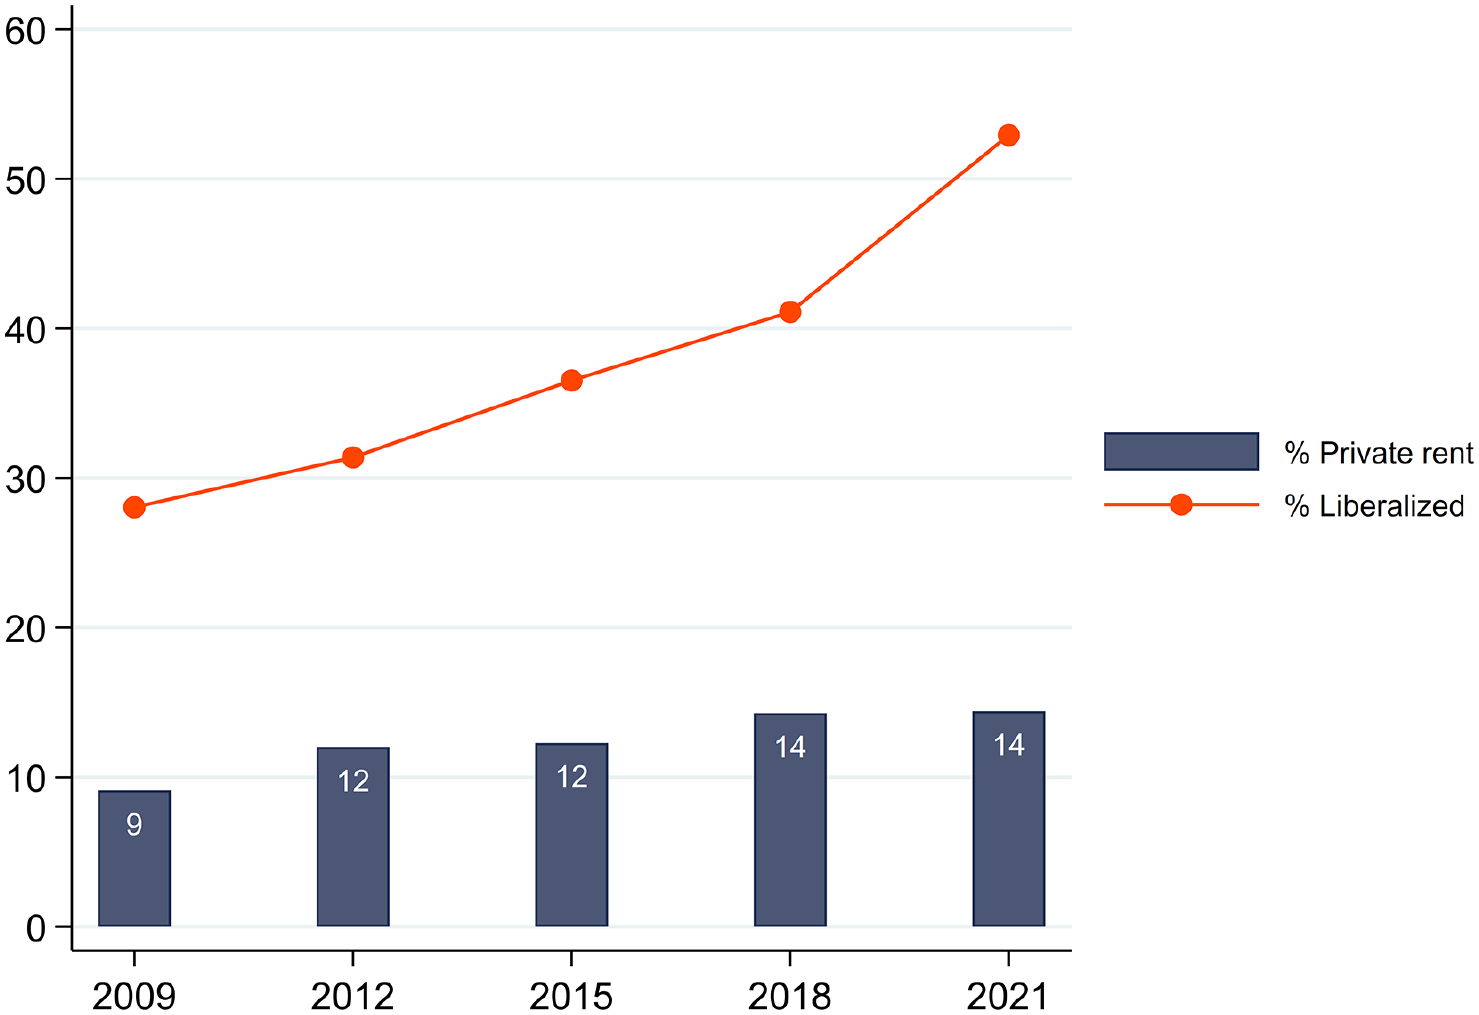
Private-rental housing (as % of the total housing stock), and share of private-rental units that are rent liberalized.
Figure 3 shows that in 2009, 28% of private-rental units were liberalized, which subsequently jumped to 53% in 2021. Among recent movers, this share stands substantially higher at around two-thirds. Additionally, in 2016, national government introduced short one-year tenancies on a large scale, where indefinite tenancies used to be standard across all rental (Huisman, 2020). Such measures not only made the private-rental sector more expensive, but also strengthened landlord power while amplifying tenant insecurity. However, post-2020, and therefore falling outside the empirical scope of this paper, national government has implemented various measures to disincentivize buy-to-let landlordism and increase tenant security again (see Hochstenbach (2023) for detailed explanation).
It may be expected that private-rental liberalization has broadly exacerbated exposure to cumulative housing disadvantage, as it has undermined renters’ protections vis-à-vis landlords. In terms of inequalities in exposure, the discussion above suggests middle-income and young populations to be most exposed, while more marginalized groups may altogether be excluded from the increasingly costly tenure.
Cumulative housing disadvantage
The previous section outlined how housing restructuring has played out in the Netherlands. Subsequently, the question is how different types of housing disadvantage have materialized across the Dutch housing system, shaping exposures across populations. Before moving to stratified analyses, Table 1 first reports overall exposure to (cumulative) housing disadvantage over time. In 2021, 25% of the total population experienced a single form of disadvantage, whether this be unaffordability, insecurity, low quality, unsuitability or neighbourhood dissatisfaction, and around 7% of the population experienced two or more forms. A majority of residents, some 68%, is not exposed to any of the housing disadvantages operationalized here. Exposures to both single and cumulative housing disadvantage have increased since 2009 (Table 1). This has not been a linear trend, though, with exposures increasing between 2009 and 2015 and subsequently flattening off (cumulative exposures) or decreasing again (single exposures).
Social inequalities across dimensions of housing disadvantage
Figure 4 shows exposures to individual dimensions of housing disadvantage across population categories. To aid interpretation: the top left graph shows the share of populations experiencing housing unaffordability, here operationalized as spending at least 30% of income on basic housing costs. The top row shows that this was the case for 13% of the total population in 2009, increasing to 17% in 2021. Some general observations can be distilled from analyzing these individual dimensions. First, while affordability is the most common form of housing disadvantage, the other dimensions are certainly also relevant – especially for specific sub groups. For example, while in 2021 only 3% of households experienced insecurity, this figure stood around 14% for private renters, 11% for recent movers and 9% for young adults (17–34). Second, particularly exposures to housing unaffordability and insecurity have increased over the study period. The combination of unaffordability and insecurity was also an increasingly prominent form of cumulative housing disadvantage over the study period, particularly among younger private tenants. Third, these increases are highly unequally distributed across populations. These differentiated trends have entrenched existing inequalities, with sharp increases in unaffordability and insecurity particularly among private renters, those in highly urbanized locations, recent movers, low-income and young-adult households. Conversely, exposures have barely increased and remained consistently low among typically more advantaged groups such as owner-occupiers, high-income and older households. Fourth, low dwelling quality and neighbourhood dissatisfaction remained roughly stable over time but do impact a substantial share of the population as well as entrenching social inequalities. Unsuitable housing, that is, having less rooms available than household members, only affects a small segment of the population (around 2%) and has remained constant over time. Beyond this study’s relatively strict operationalization, it reflects that the Netherlands has some of the lowest overcrowding rates across Europe (Sunega and Lux, 2016).
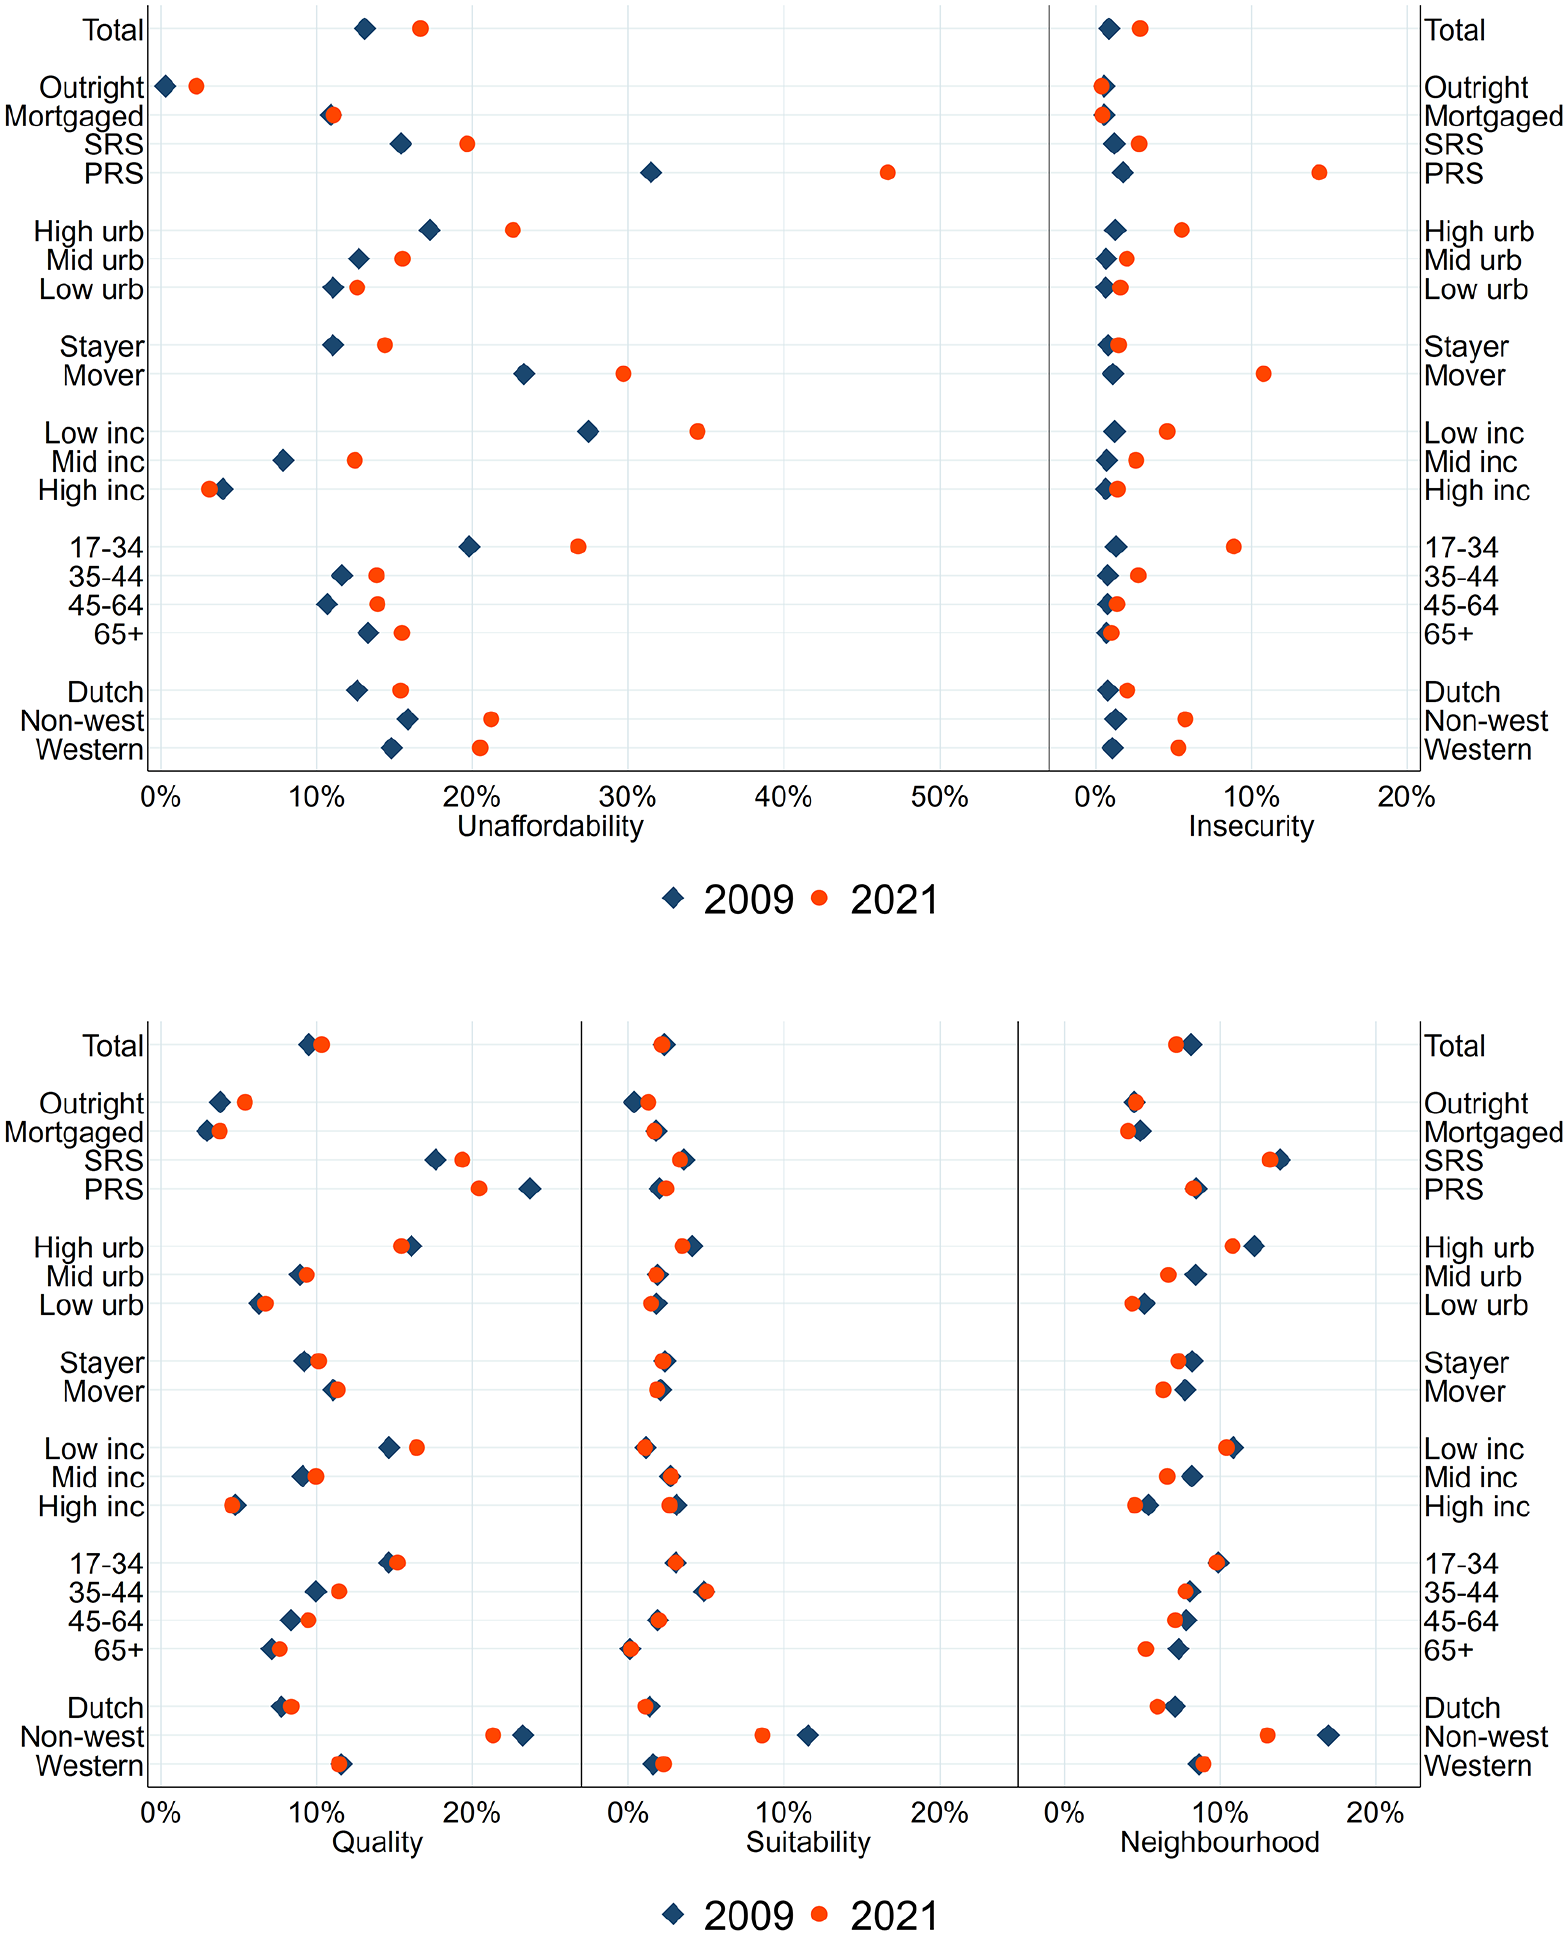
Share of households exposed to individual dimensions of housing disadvantage in 2009 and 2021.
Social inequalities in cumulative housing disadvantage
Moving beyond separate dimensions, the left panel of Figure 5 first charts mean exposure to housing disadvantage across population categories in 2009, and the subsequent 2009–2021 development. It shows that across all categories exposures increased, apart from mortgaged owners and high-income households. The strongest increase was recorded among private renters, for whom mean exposure increased from 0.67 to 0.92. Relatively strong increases were also recorded among the young and those with a low income. These trends paint a first, rough, picture of increasing inequalities in housing disadvantage along the lines of tenure, as well as social, economic and demographic indicators. The right panel of Figure 5 zooms in on the cumulative share of households experiencing one or more form of disadvantage in 2021. It shows that 32% of all households were exposed to at least one disadvantage, a figure ranging from 12% for outright owners to 68% for private renters.
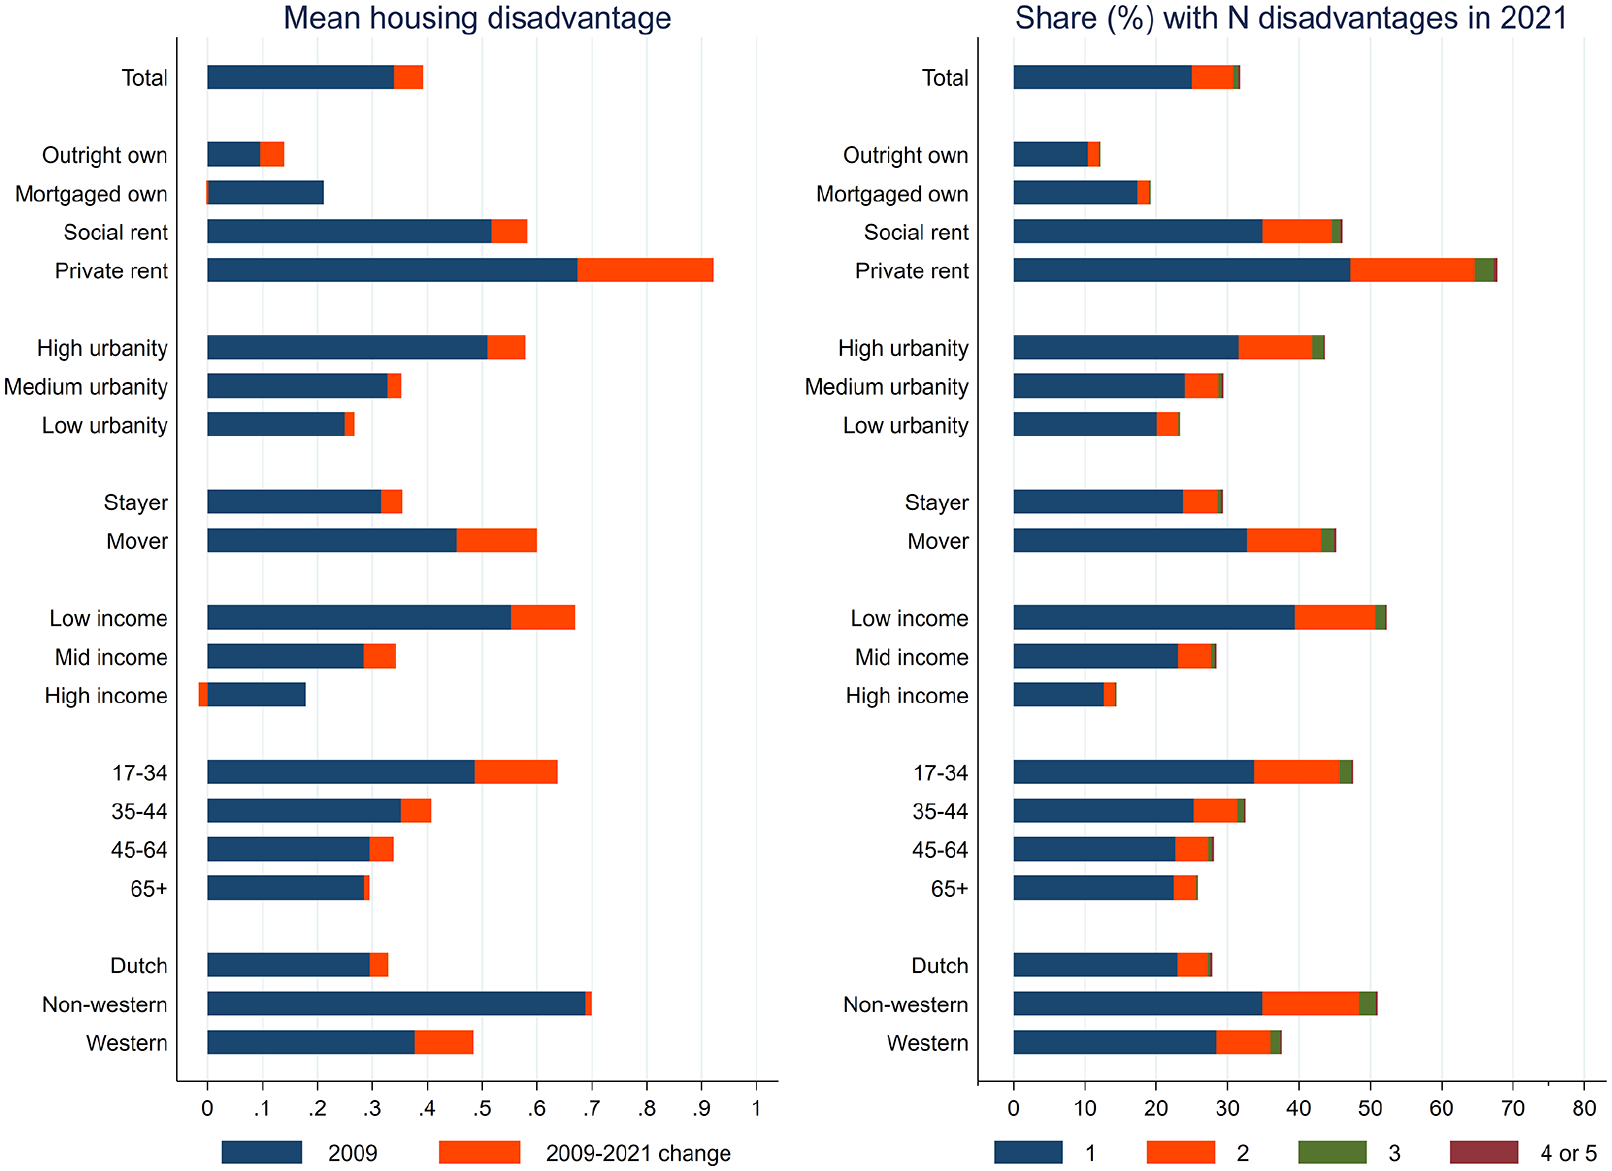
The mean housing disadvantage experienced by households in 2009 and percentage point change 2009–2021 (left panel), and the share of households experiencing N disadvantages in 2021 (right panel).
Figure 6 unpacks these trends and distributions. It descriptively charts household exposed to either one, two, or three or more housing disadvantages. While this table presents a lot of information, it is possible to discern some important common trends as well as some results running counter to expectations. I discuss four points here; the first and second pertain to overarching trends, while the third and fourth zoom in on specific dimensions. First, the share of households experiencing one form of housing disadvantage shows a clear trend across most indicators and categories. The 2009–2015 period, one marked by crisis and austerity, saw increases in ‘single’ housing disadvantage across the board as well as widening social inequalities. Conversely, the 2015–2021 period was marked, bar some exceptions, by decreasing exposures. A case in point is exposure among low-income households (left panel of the income window), which stood at 36% in 2009 (roughly 827,000 households) but climbed to 49% in 2015 (1.2 million households), before dropping to 39% in 2021 (1 million households).
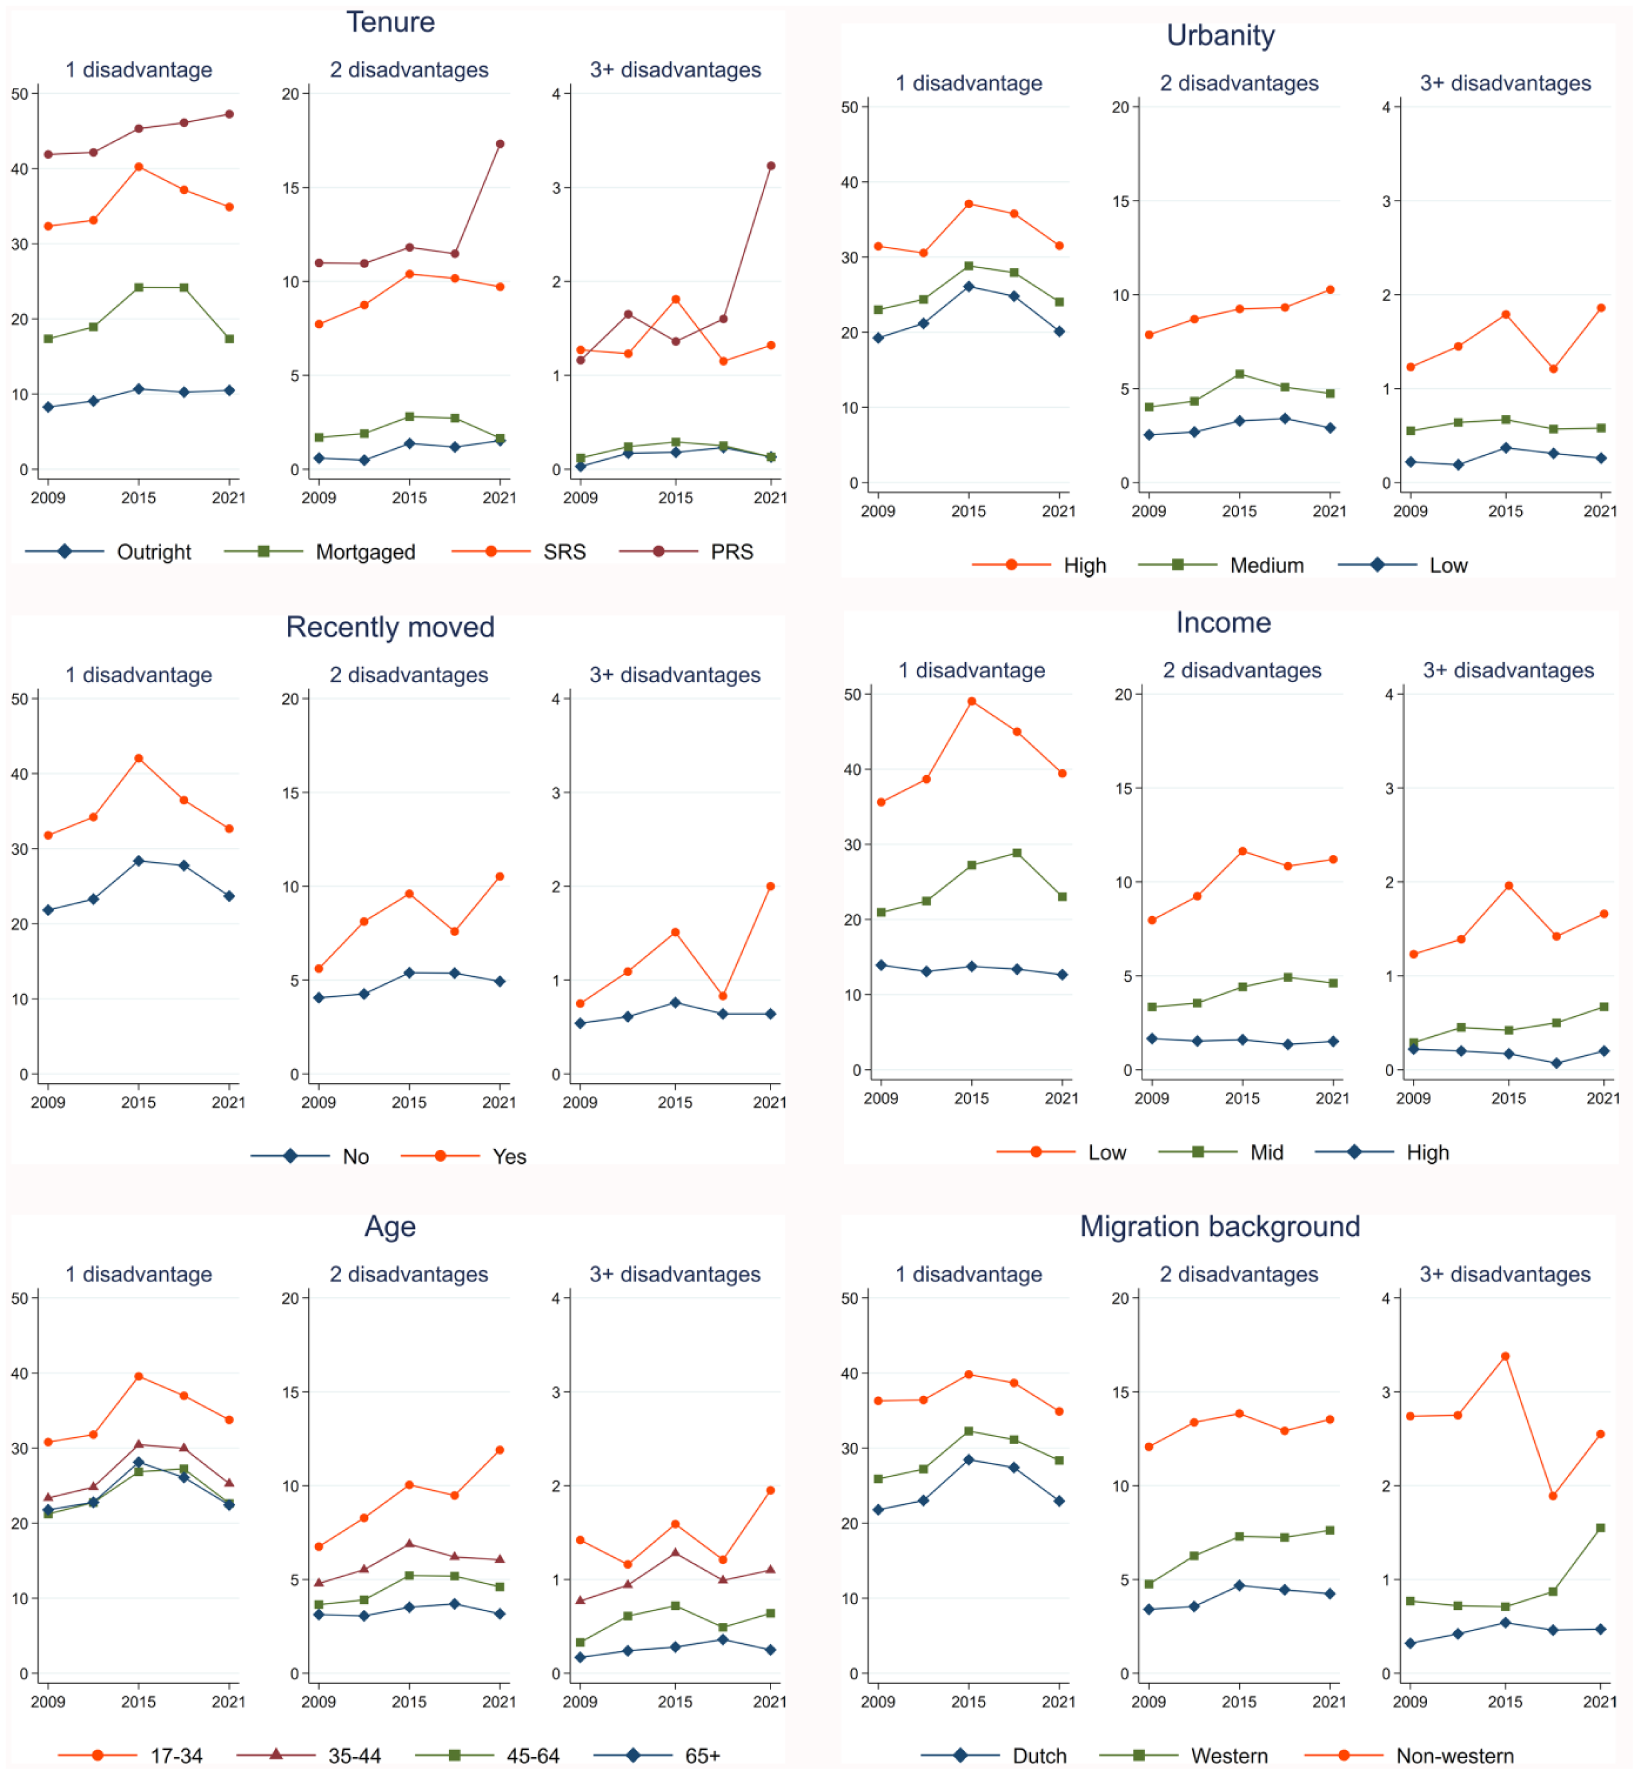
The share of households exposed to 1, 2 or 3+ housing disadvantages, 2009–2021.
Second, however, this trend differs for households exposed to two, or three or more forms of disadvantage (middle and right panels of each window). Here we see a trend of exposures that first increase and subsequently flatten off. The overall share of households exposed to two disadvantages moved from 4.3% in 2009 (around 300,000 households), to 5.9% in 2015 (426,000 households) and 5.8% in 2021 (441,000 households). Thus, strikingly, exposures to single and cumulative housing disadvantage did not necessarily move in tandem. They both increased between 2009 and 2015, but while single disadvantage subsequently dropped, it flattened for cumulative disadvantage (2015–2021). Furthermore, the latter period was one of increasing inequalities in cumulative housing disadvantage (further discussed below). This suggests that while housing disadvantage first became more widespread, it subsequently contracted and became more concentrated.
Third, it is instructive to zoom in on tenurial inequalities. As expected, outright owners are least exposed to housing disadvantages, closely followed by mortgaged owners. Here it should be emphasized that the vast majority of homeowners in the Netherlands are mortgaged, a product of its reliance on lenient mortgage conditions and the subsidization of mortgaged homeownership. A focus on rental tenures reveals some interesting, and perhaps surprising, developments. Between 2009 and 2015 exposures to both single and cumulative housing disadvantage particularly increased for social renters (+8%-points for single disadvantage, +3.2%-points for two or more disadvantages). One key explanation, detailed in the section on social-rental residualization, is that during these years national government implemented a string of policies disciplining and taxing housing associations, which forced them to sell of part of their stock, impose extra rent increases and reduced expenditure, for example, by cutting back on maintenance and construction. These burdens were at least partly offloaded from housing associations to their tenants. However, post-2015 exposures in the social-rental decreased (single disadvantage) or stabilized (cumulative disadvantage). Policy transformations, again, are important here: several policies were implemented after 2015 to dampen rent increases in the social sector and to better allocate the cheapest units to the lowest income groups (Van Gent and Hochstenbach, 2020). This has directly improved affordability, though further restricting access and deepening residualization.
A different trend comes to the fore for the private-rental sector, where exposures somewhat increased during the 2009–2015 period, but have particularly increased since. Between 2015 and 2021, single exposures in the private-rental sector increased by 1.9%-points and cumulative exposures by 7.4%-points. In absolute numbers, this represents an increase in roughly 116,000 and 99,000 privately-renting households, respectively. The result is a double trend: the private-rental sector is both the fastest growing in size, and has been the site of the strongest increases in housing disadvantages, both single and cumulative. Both aspects are – at least in part – driven by the string of policies discussed in section ‘Private-rental liberalization,’ which enabled stronger rent increases and introduced short-term insecure tenancies.
Fourth, housing disadvantages have become more unequally distributed across socio-economic groups, as the income window of Figure 7 underscores. Exposures have not increased at all among high-income households, somewhat among middle-income households, but most prominently among low-income households. This is particularly so in case of cumulative exposures which, from 2009 to 2021, increased from 8% to 11.2% (two exposures), and 1.2% to 1.7% (three plus exposures), whereas single exposures among low-income households follows the trend of first increasing (2009–2015) and subsequently decreasing (2015–2021) exposures. These developments point to increasing social inequalities in cumulative housing disadvantage, as also evident when zooming in on age groups (increases concentrate among the young) while painting a more complicated picture when zooming in on migration background (strongest increases among those with a ‘western’ background). These descriptive trends thus suggest persistent and partially widening social inequalities in housing situations.
The share of households exposed to cumulative housing disadvantage (exposed to two or more dimensions simultaneously), 2009–2021. (a) Housing tenure, (b) Urbanity, (c) Recently moved, (d) Income tertiles, (e) Age and (f) Migration background.
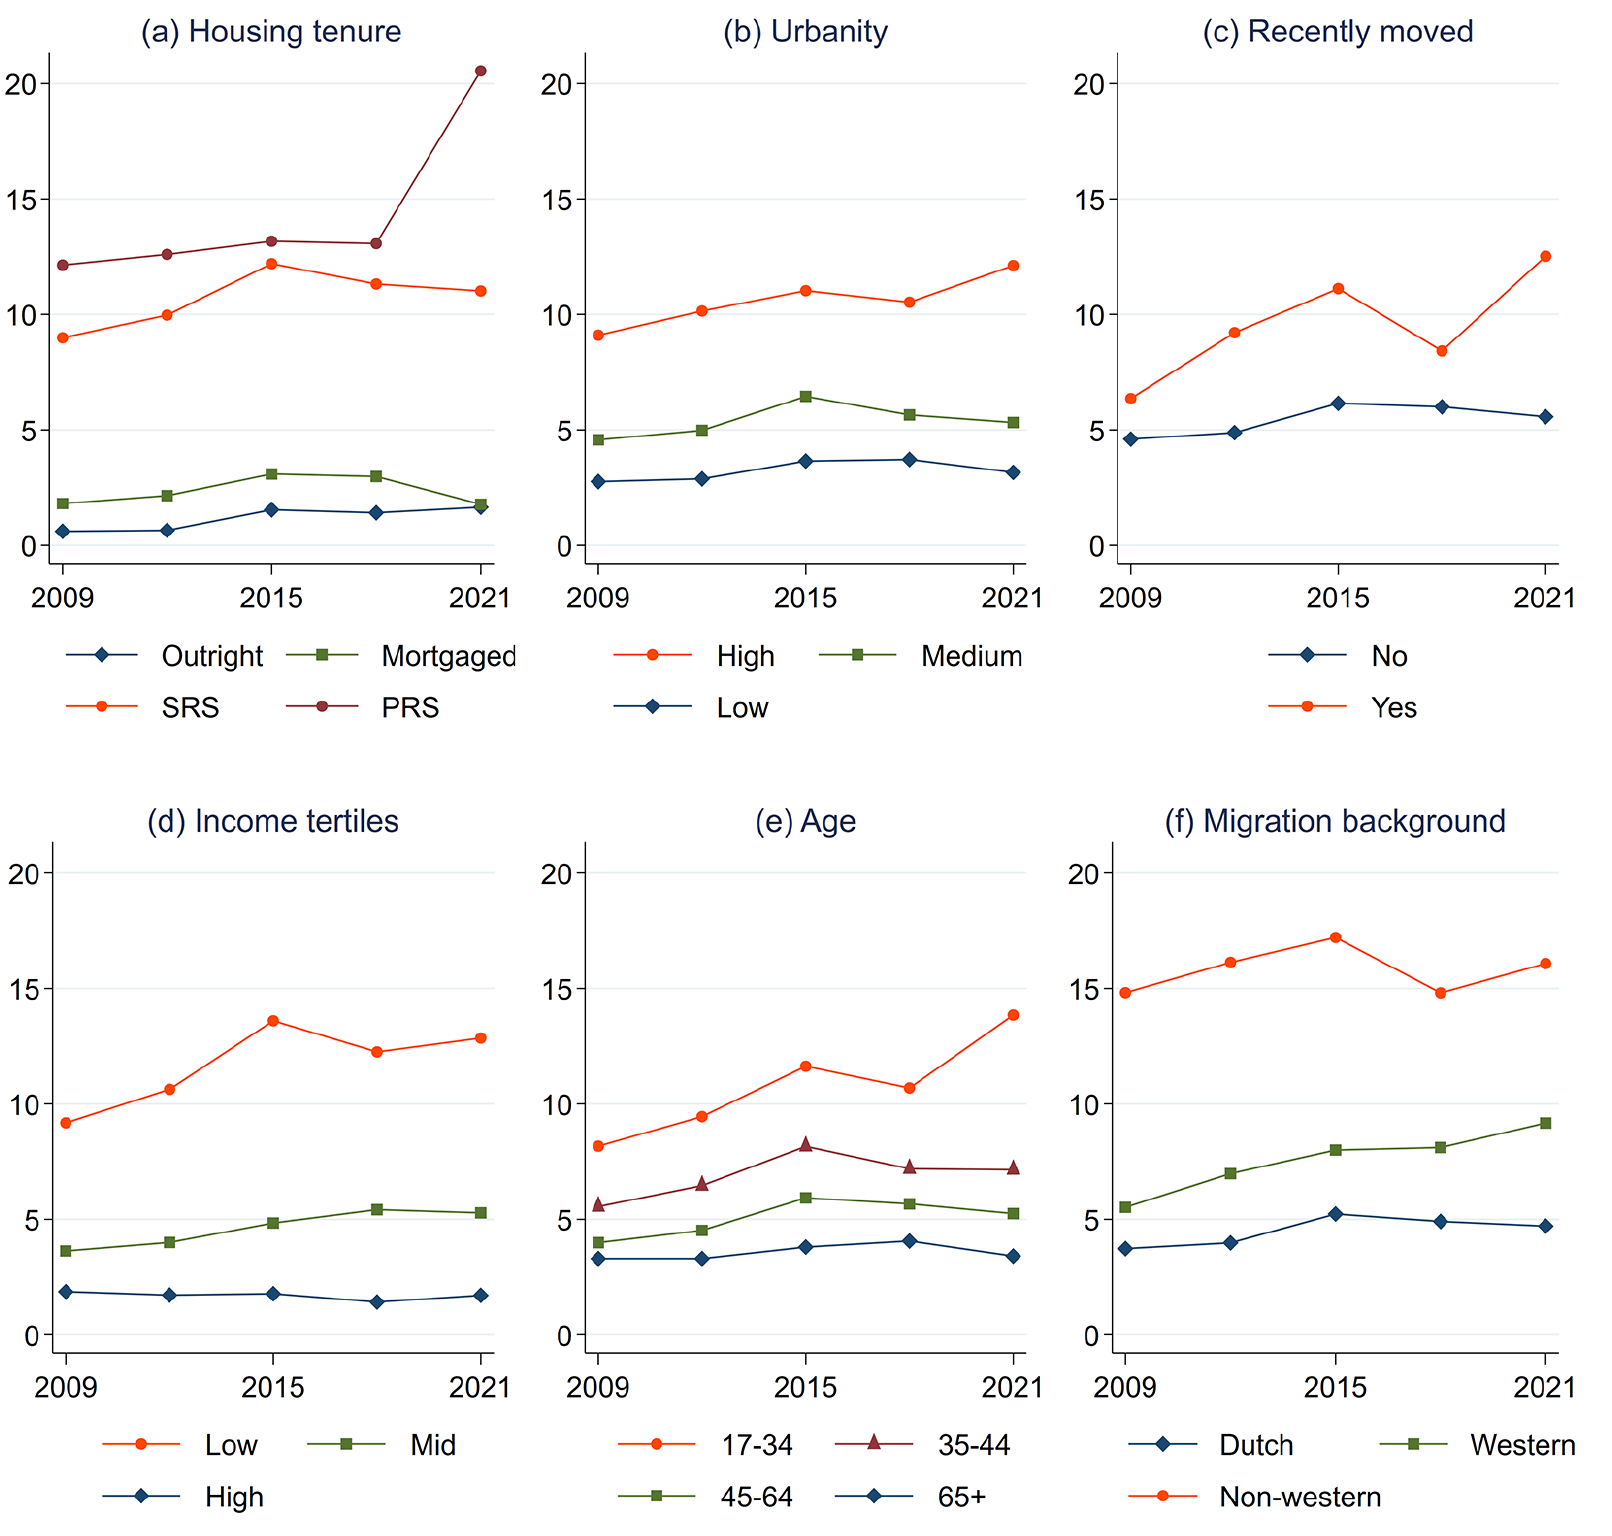
Multivariate modelling further unravels the exposure to cumulative housing disadvantage of different populations over time. Logit models taking a binary variable of being exposed to cumulative housing disadvantage (exposed to two or more disadvantages) or not as the dependent variable are used, pooling the cross-sectional survey waves of 2009, 2015 and 2021 in a single model. All household-level predictors are subsequently interacted with a year-variable, with the resulting margins of these interaction terms plotted in Figure 8 (full model available in the Appendix). The margins can be read as the predicted share of population category to find themselves in a situation of cumulative housing disadvantage in a given year, controlling for other variables. The Appendix report models for separate wave years (Table A4) and separate housing tenures (Table A5). Overall, these reproduce and confirm most findings discussed here.
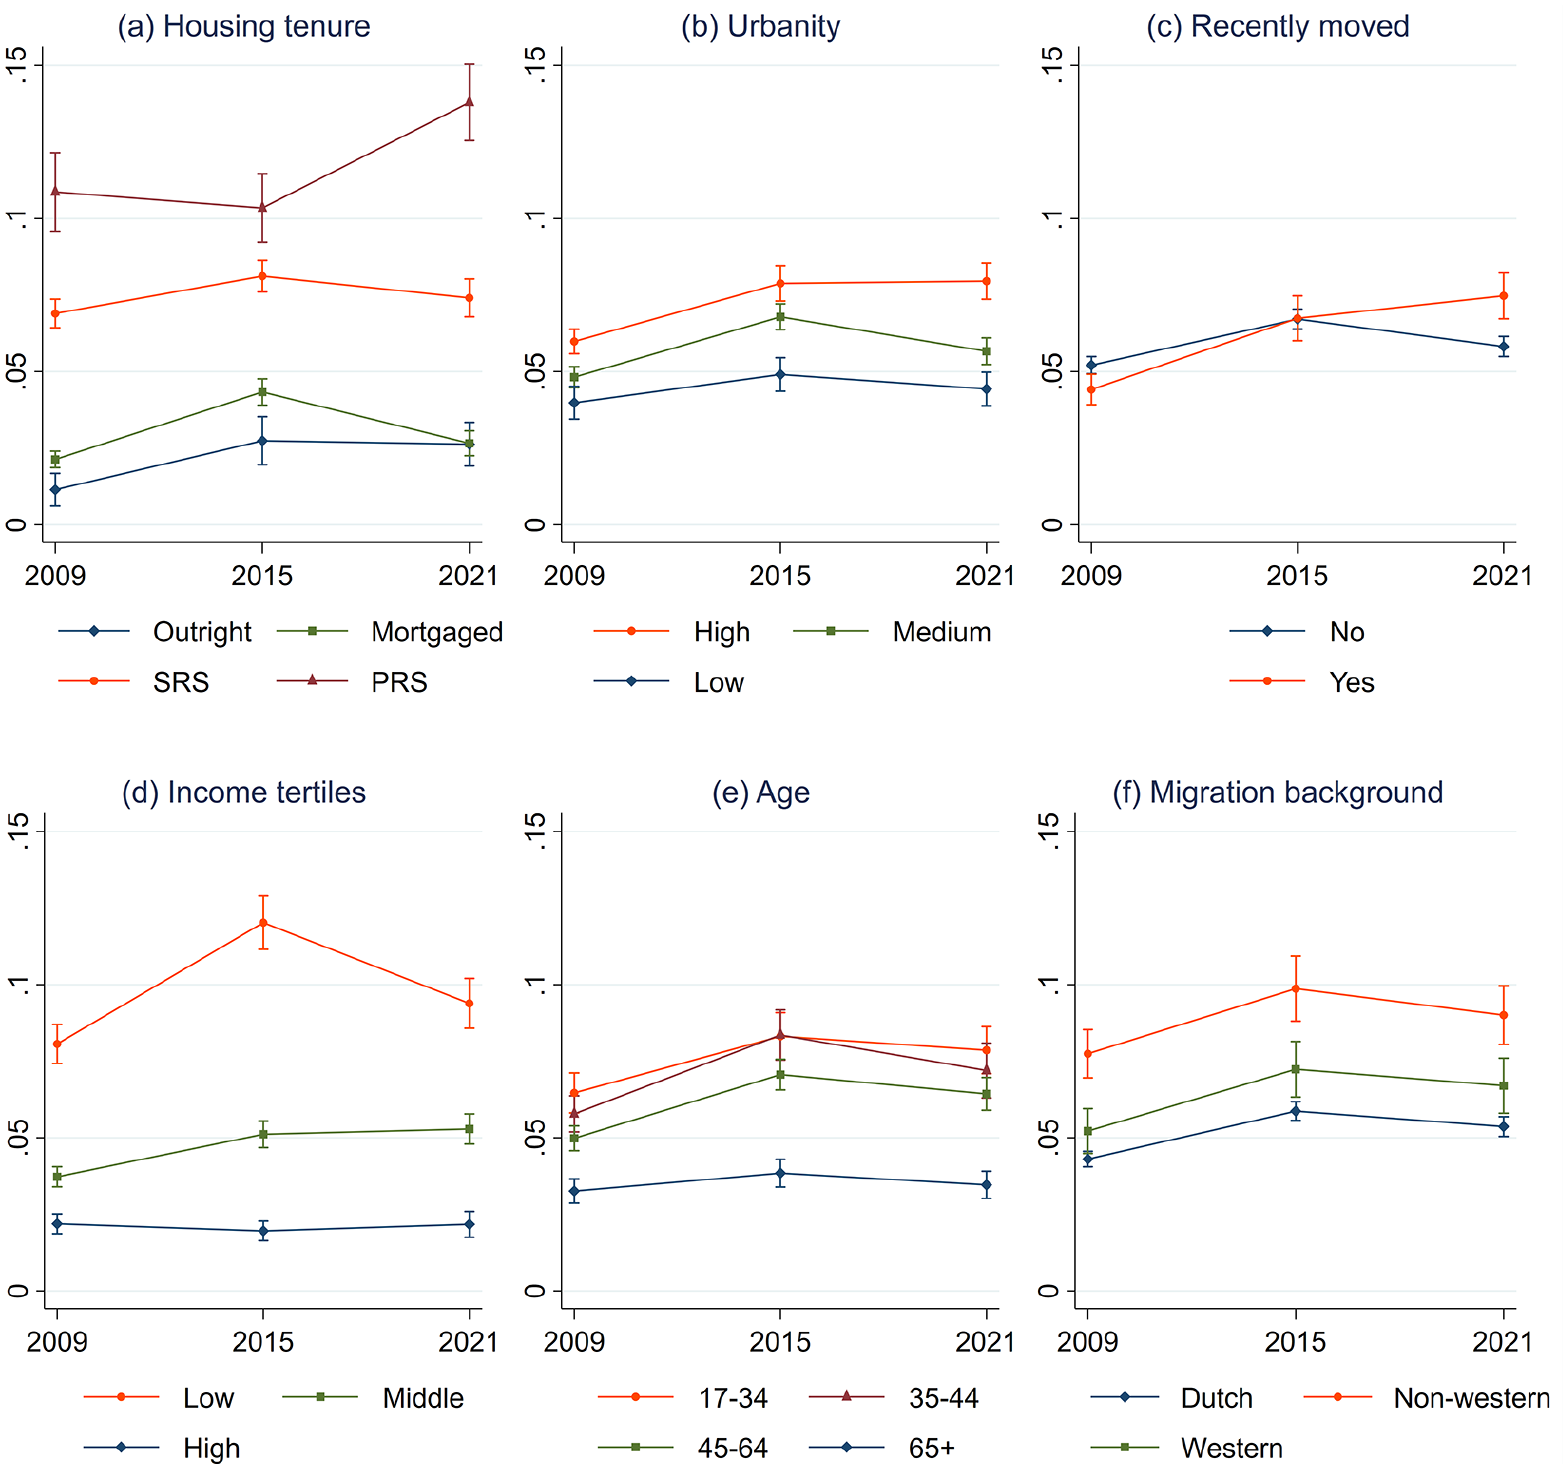
Predictive margins of the interaction between selected household variables and year, dependent variable: exposure to cumulative housing disadvantage. (a) Housing tenure, (b) Urbanity, (c) Recently moved, (d) Income tertiles, (e) Age and (f) Migration background.
The model underscores most of the descriptive patterns and trends described above, such as statistically significant (p < 0.05) inequalities in exposures between population categories. Focusing on temporal trends, the model confirms a statistically significant and particularly substantial increase in exposure among private renters post-2015. Similarly, exposures significantly increased between 2009 and 2015 among households living in highly urban locations and among recent movers, before subsequently stabilizing. The model also reflects the descriptive trends in terms of income, showing a significant increase in exposure among low-income households between 2009 and 2015, and a significant decrease in the following period. Similarly reflecting descriptive trends, it shows an increase (2009–2015) and subsequent stabilization (2015–2021) in exposure among middle-income groups.
The most notable difference pertains to age. Descriptive findings show young adults to be substantially more exposed than other age groups, and the strongest increases are also recorded among young adults. When controlling for other indicators, though, this age effect largely disappears (although the old remain significantly less exposed). These differences suggest that young adults’ housing disadvantages are primarily structured by them sorting into private-rental units and urban areas, while also being more frequent movers.
Conclusions
Housing has emerged as a primary concern across a wide range of countries. Moving beyond the dominant focus on affordability and tenure outcomes, this paper builds on an emerging literature (e.g. Baker et al., 2017; Clair et al., 2019; Debrunner et al., 2024; Waldron, 2023) to deploy a measure of cumulative housing disadvantage. This measure captures the potentially multidimensional and compounded nature of housing problems, focusing on dimensions of affordability, security, quality, suitability and neighbourhood satisfaction.
While the findings show that, in the Netherlands, single housing disadvantage is much more commonly experienced than cumulative housing disadvantage, particularly the latter has increased over the study period. Here we see some important temporal variations. From 2009 to 2015, a period of crisis and austerity, both single and cumulative exposures rapidly increased: housing disadvantages became more widespread. The 2015–2021 period, however, saw contrasting developments. Exposures to single housing disadvantage decreased again, but cumulative housing disadvantage broadly stabilized while increasing among particular sub groups such as private renters, the young and the urban. During this period, housing disadvantages concentrated, deepening for specific subpopulations and entrenching social inequalities. From these context- and time-specific findings, it is possible to draw some wider conclusions.
First, the present study gives insights into both the values and limits of composite measures capturing cumulative housing disadvantage. While it is certainly true that some aspects of housing disadvantage (such as affordability) are more common than other aspects (such as suitability), composite measures nevertheless substantially broaden our understanding of the extent to which housing disadvantages, in different forms, are experienced. For example, in 2021, 46% of private renters experienced housing unaffordability, but 68% experienced one or more forms of disadvantage. In other words, composite measures of cumulative housing disadvantage help us appreciate both the diversity and the extent of housing problems in different guises. Furthermore, cumulative housing disadvantage may itself be part of a wider set of disadvantages across various life domains. Housing exclusion often goes hand in hand with economic exclusion, with there being a bi-directional causal relation between the two (Arundel and Lennartz, 2020; Dotti Sani and Acciai, 2018; Lersch and Dewilde, 2015). Furthermore, experiences of cumulative housing disadvantage may interact with, and exacerbate health problems (Baker et al., 2017; Park and Seo, 2023). This study shows that a focus on cumulative housing disadvantage should not divert attention away from households exposed to single disadvantages, though, since the latter remains much more prevalent, may be experienced by different populations, and may exhibit different trends. These findings may be relevant beyond housing in understanding exposures to disadvantages more broadly.
Second, in assessing exposures to single and cumulative housing disadvantage, these results underscore the importance of moving beyond static tenure binaries to instead consider dynamic tenure relations. Rather than equating ownership with advantage and renting with absence in ‘tenure-divided societies’, it is important to unpack these housing- and tenure-based inequalities (Christophers, 2021; Smith, 2015). A focus on cumulative housing disadvantage certainly confirms stark inter-tenurial inequalities but also reveals important intra-tenurial inequalities. Moreover, the temporal analysis underscores the shifting meanings of tenure: particularly the private-rental sector is increasingly associated with escalating (cumulative) disadvantages. At the same time, these trends do not apply to the social-rental sector, which is all the more surprising because it increasingly caters to the most marginalized in society. It shows that rental policies and their implementation substantially shape tenants’ housing situations. Over the study period, policy has loosened rent regulations and tenant protections. Private landlords and investors subsequently jumped on the opportunity to raise rents and introduce short-term contracts. In the social-rental sector, not-for-profit housing associations have done so much less. Furthermore, after 2015, these housing associations have been subjected to policies aiming to improve housing affordability among (particularly the poorest) tenants.
Third, and building on the previous point, the story of selectively increasing cumulative housing disadvantages among certain housing tenures and populations, is a story of policy and state-market relations more broadly. This paper specifically highlighted policies driving homeownership polarization, private-rental liberalization and social-rental residualization. These three tightly interwoven trends, applicable to contexts beyond the Netherlands as well, have reshaped exposures to housing disadvantages in direct and indirect ways. The first has consolidated homeowner advantages, while exposing other tenures to more housing disadvantages, underscoring that housing segments are communicating vessels (Aalbers et al., 2021). The second, private-rental liberalization, fuels a key double trend: (i) the private-rental sector is rapidly growing in size; and (ii) increasingly exposes its tenants to single and, particularly, cumulative housing disadvantage. Across countries, including the Netherlands, the increasing dependence on private renting among the middle classes has sparked debate and set in motion policies to more strictly regulate the tenure again (e.g. Kadi et al., 2021). Whether such measures will be successful in dampening cumulative housing disadvantages is too early to call. Finally, social-rental residualization has led social renters to be increasingly selected from marginalized positions. In recent years, however, ongoing residualization has been combined with policies seeking to improve the residential situation of those in the tenure, for example, in terms of affordability. These policies protect insiders while erecting barriers and excluding others, pushing them into other housing segments, ranging from liberalized rental housing to informal and illegal arrangements, ultimately contributing to increased experiences of cumulative housing disadvantage elsewhere. In sum, these processes illuminate how housing restructuring shapes individuals’ exposure to housing disadvantages, both directly and indirectly.
Footnotes
Appendix
Regression models for separate housing tenures.
| Model 1 – Outright owner | Model 2 – Mortgaged owner | Model 3 – Social rental | Model 4 – Private rental | |||||
|---|---|---|---|---|---|---|---|---|
| Coef | p | Coef | p | Coef | p | Coef | p | |
| Disposable income (ref = mid) | ||||||||
| Low | 0.684 | 0.005 | 1.295 | 0.000 | 0.829 | 0.000 | 0.652 | 0.000 |
| High | −0.291 | 0.317 | −1.111 | 0.000 | −0.237 | 0.009 | −0.832 | 0.000 |
| Age (ref = 45-64) | ||||||||
| 17–34 | 0.190 | 0.961 | 0.211 | 0.030 | 0.403 | 0.000 | 0.044 | 0.653 |
| 35–44 | 0.606 | 0.046 | 0.100 | 0.238 | 0.213 | 0.001 | 0.196 | 0.082 |
| 65+ | −0.896 | 0.001 | −0.684 | 0.000 | −0.682 | 0.000 | −0.386 | 0.001 |
| Ethnicity (ref = native) | ||||||||
| Non-western | 1.876 | 0.000 | 1.107 | 0.000 | 0.489 | 0.000 | 0.341 | 0.003 |
| Western | 0.051 | 0.877 | 0.440 | 0.000 | 0.108 | 0.135 | 0.318 | 0.001 |
| Education (ref = mid) | ||||||||
| Low | 0.491 | 0.055 | 0.140 | 0.119 | 0.097 | 0.056 | −0.058 | 0.561 |
| High | −0.012 | 0.967 | 0.054 | 0.480 | 0.015 | 0.810 | 0.067 | 0.415 |
| Household (ref = couple with children) | ||||||||
| Single person | −0.384 | 0.218 | −0.530 | 0.000 | −0.767 | 0.000 | −0.558 | 0.000 |
| Couple no children | −1.225 | 0.000 | −0.730 | 0.000 | −0.960 | 0.000 | −0.684 | 0.000 |
| Single parent | 0.171 | 0.651 | 0.097 | 0.432 | −0.734 | 0.000 | −0.399 | 0.013 |
| Other | 0.359 | 0.530 | 0.692 | 0.015 | −0.151 | 0.250 | 0.249 | 0.137 |
| Urbanization (ref = medium) | ||||||||
| High | 0.286 | 0.241 | 0.254 | 0.002 | 0.318 | 0.000 | 0.206 | 0.008 |
| Low | −0.104 | 0.668 | −0.041 | 0.603 | −0.510 | 0.000 | −0.139 | 0.189 |
| Recent mover (ref = no) | ||||||||
| Yes | −0.188 | 0.011 | −0.053 | 0.618 | −0.122 | 0.049 | 0.383 | 0.000 |
| Year (ref = 2015) | ||||||||
| 2009 | −0.692 | 0.018 | −0.607 | 0.000 | −0.320 | 0.000 | −0.104 | 0.253 |
| 2021 | −0.178 | 0.401 | −0.388 | 0.000 | −0.171 | 0.002 | 0.436 | 0.000 |
| Constant | −3.956 | 0.000 | −3.331 | 0.000 | −2.012 | 0.000 | −1.907 | 0.000 |
| R 2 | 18.42 | 11.69 | 7.73 | 6.92 | ||||
| Wald Chi2 | 260.46 | 1163.87 | 1207.03 | 417.76 | ||||
| Log pseudolikelihood | −122,536.99 | −1,016,400.9 | −2,042,742.1 | −892,703.3 | ||||
| N | 15,800 | 81,839 | 46,551 | 13,564 | ||||
Acknowledgements
The author thanks three anonymous reviewers and the editors of EPA for their useful suggestions.
Declaration of conflicting interests
The author declared no potential conflicts of interest with respect to the research, authorship, and/or publication of this article.
Funding
The author disclosed receipt of the following financial support for the research, authorship, and/or publication of this article: The author acknowledges financial support from an Open Call grant (‘Housing deprivation beyond affordability’, 406.XS.01.084) from NWO, the Dutch Research Council.