
Abstract
This study aims to enhance our understanding of convergence patterns within the European Union by analyzing labour market efficiency (LME) indicators across 258 NUTS2 level regions from 25 EU countries. Utilizing advanced statistical methods based on decision trees, we investigate whether the data reveal groups of NUTS2 regions that exhibit shared patterns of convergence, divergence or structural similarities. Our methodological innovation lies in the application of a decision tree model to create detailed maps of European regions. This innovative approach allows us to assess the performance of regions based on multiple labour market indicators, identifying nodes that we translate into regional clusters. This novel method provides a more salient and empirically driven evaluation of convergence patterns in European labour markets and enables us to assess changes in these patterns over time. Our findings highlight the persistence of certain labour market characteristics and uncover regions that deviate from expected trends, revealing a heterogeneous and dynamic labour market landscape across Europe. These findings have the potential to inform more nuanced and region-specific economic policies that cater to the distinct labour market conditions across Europe, fostering more tailored approaches to regional development and convergence.
Keywords
Introduction
The economic integration of Central and Eastern European countries into the European Union (EU) following the fall of the Iron Curtain has led to significant shifts in labour markets across the continent. The EU enlargement waves of 2004, 2007 and 2013 brought post-socialist economies into the EU’s single market, reshaping economic ties and institutional frameworks. 1
Economic theory, based on the Solow-Swan model (Solow, 1956; Swan, 1956), suggests that such integration should drive (conditional) convergence in economic performance, with lower-income regions catching up to more developed areas. However, empirical evidence indicates that convergence processes are highly heterogeneous and influenced by structural barriers, institutional differences and historical path dependencies (Maddison, 2007; Milanovic, 2012). 2
Labour market efficiency has emerged as an important driver of regional economic convergence, yet it remains insufficiently explored in current scholarship. While significant attention has been devoted to indicators such as GDP per capita and productivity growth, LME metrics, such as those encompassing employment rates, long-term unemployment, gender employment and unemployment gaps, offer critical insights into regions’ capacity to foster inclusive economic growth.
Persistent labour market disparities across the European Union, particularly between Western and post-socialist regions, raise compelling questions about the role of institutional and policy differences, as well as historical legacies, in shaping regional developmental trajectories. Understanding why certain regions achieve greater competitiveness, while others appear locked into decline, remains a central concern in regional studies (e.g. Borsekova et al., 2021; Hassink, 2010; Martin and Sunley, 2006; Martin et al., 2016).
Drawing on theories of regional development, scholars argue that geographical location, historical and cultural contexts, labour force composition and quality and overall economic competitiveness each play decisive roles in determining a region’s path (e.g. Capello and Nijkamp, 2020; Sassen, 2006). Moreover, regional competitiveness itself reflects the capacity to outperform rival territories in securing foreign investment, creating high-quality jobs, attracting skilled labour and upgrading critical infrastructure (European Commission, 1999, 2010).
A growing body of evidence underscores the importance of efficient and flexible labour markets for sustained regional competitiveness (e.g. Borsekova and Korony, 2023; Clark and Bailey, 2018; Dijkstra et al., 2011), primarily because they enable fluid resource allocation (Schwab and Porter, 2007) and facilitate wage adjustments without exacerbating social disruption (Schwab, 2010).
This paper investigates whether labour markets in post-socialist EU regions exhibit distinct convergence patterns compared to their Western counterparts. Specifically, we explore the role of structural and institutional factors in shaping LME trends and examine whether capital city regions follow unique convergence trajectories compared to non-capital regions. By integrating multiple LME indicators, this study offers a more nuanced view of regional labour market dynamics and their implications for broader economic convergence.
The key contributions of this study are threefold. First, we move beyond conventional measures of economic convergence by incorporating multiple LME indicators simultaneously, providing a more comprehensive assessment of regional disparities. Second, we assess whether the convergence patterns of post-socialist regions differ from Western capitalist regions due to historical and institutional legacies. Third, we analyze the role of capital cities in shaping labour market convergence, as these regions often function as economic hubs that influence national and regional trajectories.
Methodologically, we employ decision tree modelling and geographical visualization techniques to identify and classify regional clusters based on LME indicators. This approach allows us to capture complex, non-linear convergence patterns that may not be evident in traditional econometric analyses. By doing so, we provide a more granular understanding of how historical legacies, policy frameworks and institutional structures influence labour market convergence across the EU.
The remainder of the paper is structured as follows. Section ‘Convergence and labour markets’ reviews the theoretical and empirical underpinnings of economic convergence and labour market efficiency. Section ‘Data, methods and empirical strategy’ outlines the data, methods and empirical strategy. Section ‘Results’ presents the empirical results, while Section ‘Discussion’ discusses these findings in the context of current literature. Finally, Section ‘Conclusions’ concludes by summarizing the key insights and outlining their policy implications.
Convergence and labour markets
We ground our analysis of regional economic convergence in theoretical foundations that draw from growth theory, labour market dynamics and institutional economics. This section outlines the key theoretical and empirical perspectives that inform our analysis of how and why European Union’s regions converge, or fail to do so, over time.
Convergence and its models
Neoclassical growth models posit that capital accumulation in low-income regions, combined with diminishing returns to capital, should lead to convergence. The augmented Solow-Swan model (Mankiw et al., 1992) and the Nelson-Phelps framework (Nelson and Phelps, 1966) highlight the role of human capital and technology diffusion in this process. However, multiple equilibria models suggest that some regions may become trapped in low-income steady states due to weak institutions, technological stagnation or structural constraints (Azariadis, 1996; Galor, 1996; Rodrik, 2011).
Empirical evidence confirms that convergence is conditional, shaped by institutional quality, governance and policy frameworks (Acemoglu et al., 2001; Barro and Sala-i-Martin, 2004). In addition to the market forces driving the various models of economic convergence, fiscal policies may play an important role for the economic standing of countries and regions. EU’s cohesion policy instruments have invested significant resources to support the convergence of lagging regions (McCann and Ortega-Argilés, 2021; Pina and Sicari, 2021). A number of studies, including Crescenzi and Giua (2020) and Bachtrögler et al. (2020), document varied effects of EU’s cohesion policies on regional convergence in the EU. Fiscal redistribution within countries affects interregional disparities and risk sharing (Hepp and Von Hagen, 2013; Mélitz and Zumer, 2002; Von Hagen, 2000).
Stratification models suggest that regions may converge in distinct clusters rather than towards a single steady state (Azariadis and Stachurski, 2005; Quah, 1996, 1997). Empirical studies indicate that some regions, despite overall economic growth, remain structurally disadvantaged due to their limited integration into global or national supply chains, inefficient use of EU structural funds or demographic crises (Cutrini and Mendez, 2023; Iammarino et al., 2019; Rosés and Wolf, 2021). This highlights the importance of identifying region-specific barriers to convergence.
Labour market convergence and its factors
Labour market convergence is not a uniform process but is influenced by factors such as economic geography, policy interventions and resilience to shocks (Bristow and Healy, 2015; Krugman, 1991). Empirical research on post-socialist economies highlights the importance of institutional quality, human capital accumulation and sectoral transformation in shaping their labour market trajectories (Barro and Sala-i-Martin, 1992; Baumol, 1986). Recent studies (Fagerberg, 2000, Fagerberg et al., 2018) emphasize technological diffusion and innovation adoption as key determinants of labour market alignment between transitioning and advanced economies. Meanwhile, Campos and Coricelli (2002, 2019) argue that socialist-era labour market institutions, combined with demographic shifts, continue to affect regional convergence patterns.
Institutions and policy frameworks play a crucial role in shaping regional convergence trajectories. EU cohesion policies aim to reduce regional disparities through structural funds, investment in human capital and employment initiatives. However, research suggests that the effectiveness of these policies varies depending on regional governance quality, absorptive capacity and the extent to which local labour markets integrate into broader economic networks (Crescenzi and Giua, 2020; McCann and Ortega-Argilés, 2021). Moreover, the persistence of informal labour markets and regulatory inefficiencies in some post-socialist regions continues to hinder convergence (Campos and Coricelli, 2019).
Research on regional resilience highlights the role of innovation, institutional structures and economic complexity in shaping responses to economic shocks (Bristow and Healy, 2015; Martin, 2012; Martin et al., 2016). This aligns with findings on development traps (Collier, 2007; Eichengreen et al., 2014), which demonstrate that structural constraints can hinder upward mobility for lagging regions. EU cohesion policy instruments aim to address these disparities, yet studies show mixed results regarding their effectiveness in fostering convergence (Crescenzi and Giua, 2020; Crescenzi et al., 2020; McCann and Ortega-Argilés, 2021; Pina and Sicari, 2021).
Labour market efficiency, regional competitiveness and convergence in the EU
Recent research highlights the role of labour market efficiency in shaping regional competitiveness (Borsekova et al., 2024), with labour productivity remaining the most critical factor (Krugman, 1994; McCann, 2020). However, productivity growth often follows distinctive national and sectoral trajectories, complicating the convergence landscape (Cavallaro and Villani, 2021). Some regions remain caught in developmental traps (Diemer et al., 2022; Iammarino et al., 2019, 2020), characterized by stagnant employment levels and productivity gains, frequently reflected in declining or stagnant employment-to-population ratios, a comprehensive indicator capturing both labour supply and demand dynamics. These challenges are especially acute in regions confronting structural economic transformations and shifts in workforce participation. Regional development trajectories in Europe continue to be profoundly influenced by historical legacies, geographic factors and socio-economic structures, reinforcing entrenched regional inequalities (Capello and Nijkamp, 2020; Pike et al., 2007, 2016; Sassen, 2006; Stark and Bruszt, 1998). Despite considerable EU integration and targeted cohesion initiatives, structural disparities persist, particularly affecting post-socialist regions still navigating the complex aftermath of transitions from centrally planned economies to market-driven systems (Heidenreich, 2003; Herrschel, 2006). The collapse of communist regimes in Central and Eastern Europe set in motion extensive political, social and economic transformations, significantly shaping the contemporary challenges faced by these regions (Borsekova et al., 2021; Malý et al., 2020; Soulsby and Clark, 2007).
Long-term historical path dependencies and persistent institutional legacies continue to influence these transitions, reinforcing enduring socio-economic vulnerabilities (Sassen, 2006). Existing literature highlights that transitions in post-socialist regions remain incomplete, particularly among regions lacking the economic and institutional advantages conferred by national capital status, positioning them among the most economically vulnerable within the EU (Borsekova and Korony, 2023; Borsekova et al., 2021, 2025). Such uneven development underscores the enduring relevance of historical context and institutional resilience in shaping regional economic outcomes across Europe (Hirt, 2013; Sassen, 2006).
This study builds on the above literature by applying decision tree modelling to examine whether European regions exhibit shared convergence patterns. By integrating multiple LME indicators, we aim to provide a more comprehensive analysis of labour market convergence trends across EU regions.
Data, methods and empirical strategy
Data and the Regional Competitiveness Index
In response to the increasing prioritization of regional competitiveness as a policy objective, a multitude of indices and rankings have been developed to measure and monitor competitiveness (Annoni et al., 2017; Berger, 2011; Boschma, 2004; Bristow, 2010). Among the tools available to study regional dynamics, the EU’s Regional Competitiveness Index (RCI), introduced in 2010 and published every 3 years, has emerged as a cornerstone of regional policy analysis. Based on the methodology of the Global Competitiveness Index (Schwab and Porter, 2007), the RCI evaluates the strengths and weaknesses of European regions across 11 pillars and dozens of indicators. The RCI for 2010 and 2019 provides data for our analysis. The RCI measures regional performance across 11 pillars: Institutions, Macroeconomic stability, Infrastructures, Health, Basic education, Higher education, training and lifelong learning, Labour-market efficiency (LME), Market size, Technological readiness, Business sophistication and Innovation. It assesses and compares the economic performance and attractiveness of regions, guiding regional policy-making and investment decisions. The RCI helps policymakers identify regional strengths and weaknesses, fostering targeted interventions to improve competitiveness and quality of life. It aids in the effective allocation of structural funds, promoting cohesion and convergence within the EU (Aiginger and Firgo, 2017; Dijkstra et al., 2023). For this study, we focused on the LME pillar, using seven common LME indicators from the RCI (Annoni and Dijkstra, 2019; Annoni and Kozovska, 2010): Employment rate, Long-term unemployment, Unemployment rate, Labour productivity, Gender balance unemployment, Gender balance employment and Female unemployment. 3 The first analyzed period is 2010, while the second is 2019. Due to differing reference years in data collection for the periods studied, using all available data could lead to confusion. Hence, we will specifically use the RCI reference year’s corresponding to the RCI volumes, which enhances clarity and ensures comparability, facilitating the use of the entire RCI dataset for policy analysis. The LME indicators used in our data sample, including their attributes, are presented in Annex 1.
Our data sample includes 258 regions at NUTS2 level from 25 EU countries. The EU NUTS classification provides a harmonized hierarchy of regions, and the NUTS 2 level identifies the target regions for the implementation of EU’s regional policies. We implemented the necessary adjustments of the data (aggregations and exclusions) to ensure consistency of the definitions of regions in those cases where regional borders changed between the initial period and the final period (for more information about see Annoni and Dijkstra, 2019; Annoni and Kozovska, 2010). Annex 1 offers an overview of the regions included in our data sample and their partition into the four categories defined by the fixed categorical variables. The details on data structure and necessary adjustments are given in Annex 1. To quantify the changes in the respective indicators between the two periods, we calculated the differences in indicator values by subtracting the 2010 values from those of 2019. This yielded three potential outcomes: a decrease (indicated by a negative difference), stagnation (zero difference) or increase (positive difference) in the indicator.
Methods and empirical strategy
Adopting a comparative analytical framework, this study moves beyond conventional approaches that rely on linear relationships or static regional classifications by integrating historical and structural factors shaping regional development across the EU. It incorporates variables such as development phase (post-socialist vs capitalist) and capital city status, accounting for the economic, political and social processes that distinguish regions. Enabled by decision-tree-based methods, this framework extends the literature on the shift from state socialism to market capitalism, combining these factors to provide a more nuanced understanding of regional structural disparities and convergence patterns in Europe.
We introduce two categorical variables for the classification of EU regions: the development phase variable and the national capital city variable. The development phase variable distinguishes between post-socialist and Western capitalist regions of the EU, while the capital city identifier differentiates regions with and without the national capital. Combining these factors, we created a new categorical variable ‘Development Phase and Capital city variable’, which includes four categories: post-socialist region with capital, other post-socialist region, capitalist region with capital and other capitalist region.
Incorporating categorical variables like development phase and capital city status allows for a detailed analysis that reflects each region’s unique historical and economic context. This methodological approach reveals deeper insights into structural similarities and differences among regions, enabling more targeted policy responses to foster regional convergence. Regions were categorized based on two fixed categorical variables rooted in path dependencies. According to Smith (1996), the shift from state socialism to market capitalism has profoundly restructured the space-economies of Central and Eastern Europe. This transition has led to new forms of regional uneven development, driven by the collapse of national economies, globalization, marketization and the interplay between local economic structures and strategies. Regions were categorized based on two fixed categorical variables rooted in path dependencies. The first factor distinguishes between regions with histories of Western capitalism or post-socialism, reflecting debates on convergence between these systems and their implications for market mechanisms, labour markets and state systems (Coufalová and Žídek, 2019). Western capitalism typically refers to countries that developed their economic structures based on capitalist principles from the early modern period onward. These countries emphasize private property, capital accumulation and competitive markets. 4 Post-socialist regions refer to those from countries that transitioned from state socialism, which was characterized by state control of the economy. 5 Further details on data are given in Annex 1. Transition dynamics at the regional level were closely linked to socio-economic shifts (Borsekova and Korony, 2023; Malý et al., 2020; Soulsby and Clark, 2007), contributing to growing regional inequalities (McCann, 2020; Rodríguez-Pose, 2018; Tomaney et al., 2010). The selection of capitalist and post-socialist regions aligns with the path dependence argument, recognizing the persistence of previous regime elements (Borsekova et al., 2021; Martin and Sunley, 2006; Sassen, 2006). The second factor divides EU regions into those with capital cities and those without, drawing from evidence indicating faster growth and greater competitiveness in regions with capital cities (Annoni and Dijkstra, 2019; Cuaresma et al., 2014), except in select cases (The Netherlands, Italy and Germany). Capital regions are affecting economic growth in many Eastern countries (e.g. Slovakia, Bulgaria, Romania), widening gaps with lagging regions. The dominance of capital regions and major agglomerations, combined with limited convergence elsewhere, fuels internal divergence, exacerbating labour market pressures and underutilized economic potential. This spatial polarization risks undermining national competitiveness and the long-term sustainability of growth (Laguna, 2024). Given these structural differences between post-socialist and capitalist labour markets and those with and without capital cities, this approach incorporates key economic, institutional and demographic indicators, following the insights of Barro and Sala-i-Martin (1992), Fagerberg et al. (2018), Bristow and Healy (2015) and the other literature reviewed above, to better capture the complexity of convergence patterns.
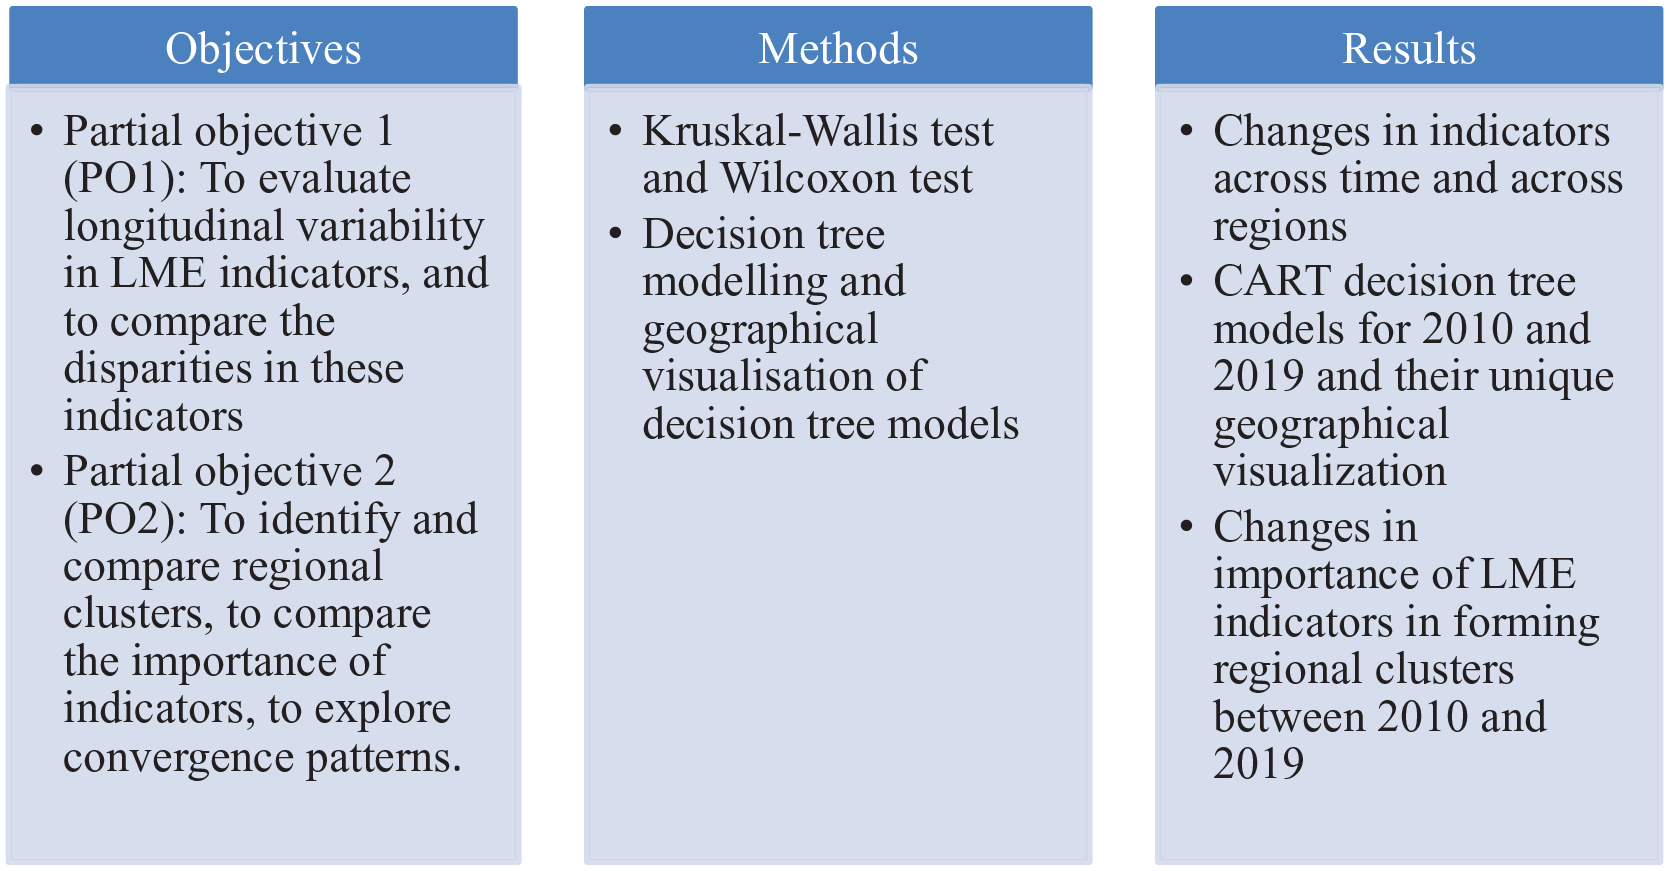
Figure 1 presents a short overview of our empirical strategy. Our research is structured around two main partial objectives: The first partial objective (PO1) is to systematically categorize EU regions into four distinct groups based on fixed categorical variables stemming from path dependencies, to evaluate longitudinal variability in LME indicators, and to compare the disparities in these indicators between 2010 and 2019 following their path dependencies. For this purpose, we employed the nonparametric tests – the Wilcoxon two-sample test and the Kruskal-Wallis test. For k independent samples from a continuous field, this tests: H0: Location parameters (e.g. medians or arithmetic means) of the k samples are the same, H1: At least one sample is different (tends to yield larger or smaller values than the others). In our case we have got four groups, so k = 4. For two distributions (k = 2) nonparametric Wilcoxon two-sample test is suitable. To assess changes in indicators between the periods 2010 and 2019, we applied classical one-sample tests: the paired t-test and the Wilcoxon signed-ranks test. These tests serve as equivalents to the one-sample test for a mean of 0 (paired t-test) and for a median of 0 (Wilcoxon signed-ranks test), with corresponding results mainly processed in Section ‘Comparative and longitudinal analysis of LME indicators’.
Empirical strategy.
The first partial objective focuses on an indicator-oriented analysis within the four groups of regions, while the second objective extends the analysis to the regional level. The visualization of the decision tree further enables an in-depth examination at the level of individual regions, allowing for a more granular exploration of regional disparities and convergence patterns.
The second partial objective (PO2) is to identify regional clusters according to performance in LME indicators, to compare regional clusters and the importance of labour market indicators between 2010 and 2019, and to explore whether European regions exhibit shared convergence patterns. The Measure of Importance MI(x) of a predictor variable x in relation to the final tree is defined as the sum across all splits in the tree of the improvements that x has, when it is used as a primary splitter. The Variable Importance VI(x) of x is expressed in terms of a normalized quantity relative to the variable having the largest measure of importance. It ranges from 0 to 100, with the variable having the largest measure of importance scored as 100.
The main analytical instrument is decision tree modelling based on the CART (Classification and Regression Trees) algorithm (Breiman et al., 1984), with results mainly processed in Section ‘Decision tree modelling and assessment of regional clusters’. Unlike conventional statistical methods that rely on linear assumptions (see, e.g. Borsekova et al., 2025), decision tree models are particularly effective in capturing non-linear relationships and complex interactions between variables. By generating intuitive ‘if-then’ rules (Chou, 1991; Han and Kamber, 2006), these models enhance analytical clarity and provide actionable insights, making them well-suited for exploratory and descriptive analyses in regional studies. In this study, the region’s development phase, categorized as capitalist or post-socialist, serves as the dependent variable, while all LME indicators (see Annex 1) act as the independent variables guiding the CART decision tree modelling to fulfil PO2. By splitting data into more homogeneous subgroups, CART yields terminal nodes that represent the purest classifications; these final groupings can then be mapped (Figures 3 and 5). We apply this modelling approach to 2010 and 2019 labour market indicators, focusing on the number of nodes, terminal nodes and tree depth to capture the complexity and granularity of regional dynamics.
Leveraging this methodology, we propose an innovative analytical strategy that, to our knowledge, has not been previously employed. By assessing multiple labour market indicators, the decision tree produces terminal nodes that are then translated into regional clusters, offering a clearer view of convergence patterns in European labour markets. The tree’s structure supports a multi-tiered examination: starting with the most influential indicators, it progressively refines classifications to form distinct labour market profiles, which are then visualized on maps. We further compare the importance of different LME indicators across two time periods to illuminate evolving labour market conditions, providing an analytical depth that can inform more precise and region-specific economic policies.
Under the CART methodology, each decision node reflects a point where the algorithm selects the optimal splitting variable to maximize subgroup purity. For instance, if labour productivity is the most significant discriminator between capitalist and post-socialist regions, it becomes the primary splitting variable at that node. Because decision trees permit variables to reappear at multiple levels, the same indicator may guide splits in different branches, underscoring its role in refining classifications. This recursive partitioning continues until one of the following occurs: subgroups reach a predetermined level of homogeneity; the number of observations in a subgroup falls below a minimum threshold; additional splits no longer improve classification accuracy. When any of these conditions is met, nodes become terminal nodes, representing final classifications that summarize how the input variables collectively influence regional development.
Decision trees offer notable advantages over traditional econometric tools (e.g. regression analysis). First, they are non-parametric, removing the need to assume a specific data distribution. Second, they handle multidimensional and interdependent variables, reflecting the complexity of regional economies. Third, they yield interpretable ‘if-then’ rules and terminal node summaries, making results more accessible to policymakers and stakeholders. By employing this modelling approach, we address a gap in the literature related to labour market indicators, producing classifications that deepen our understanding of regional competitiveness and provide practical insights for policy design. Furthermore, we are able to compare the importance of LME indicators across two periods and to shed more light on labour market patterns. This approach reflects an analytical depth capable of informing more precise and differentiated economic policymaking, recognizing the unique challenges and strengths of each region. Another crucial methodological innovation introduced in this paper lies in the novel visualization of decision trees, which enables the precise visual representation of regional differentiation. This approach facilitates a more granular analysis, extending down to the level of individual regions, thereby enhancing the depth and clarity of spatial analysis.
Results
Comparative and longitudinal analysis of LME indicators
To evaluate longitudinal variability in LME indicators and to compare the disparities in these indicators between 2010 and 2019 following their path dependencies (PO1), we systematically compare EU regions according to their distinction into four groups: post-socialist with the capital; post-socialist other; capitalist with the capital; capitalist other. Table 1 shows the initial and final states of LME indicators across the four groups of regions following the analytical framework described in Section ‘Data, methods and empirical strategy’.
LME indicators by region.
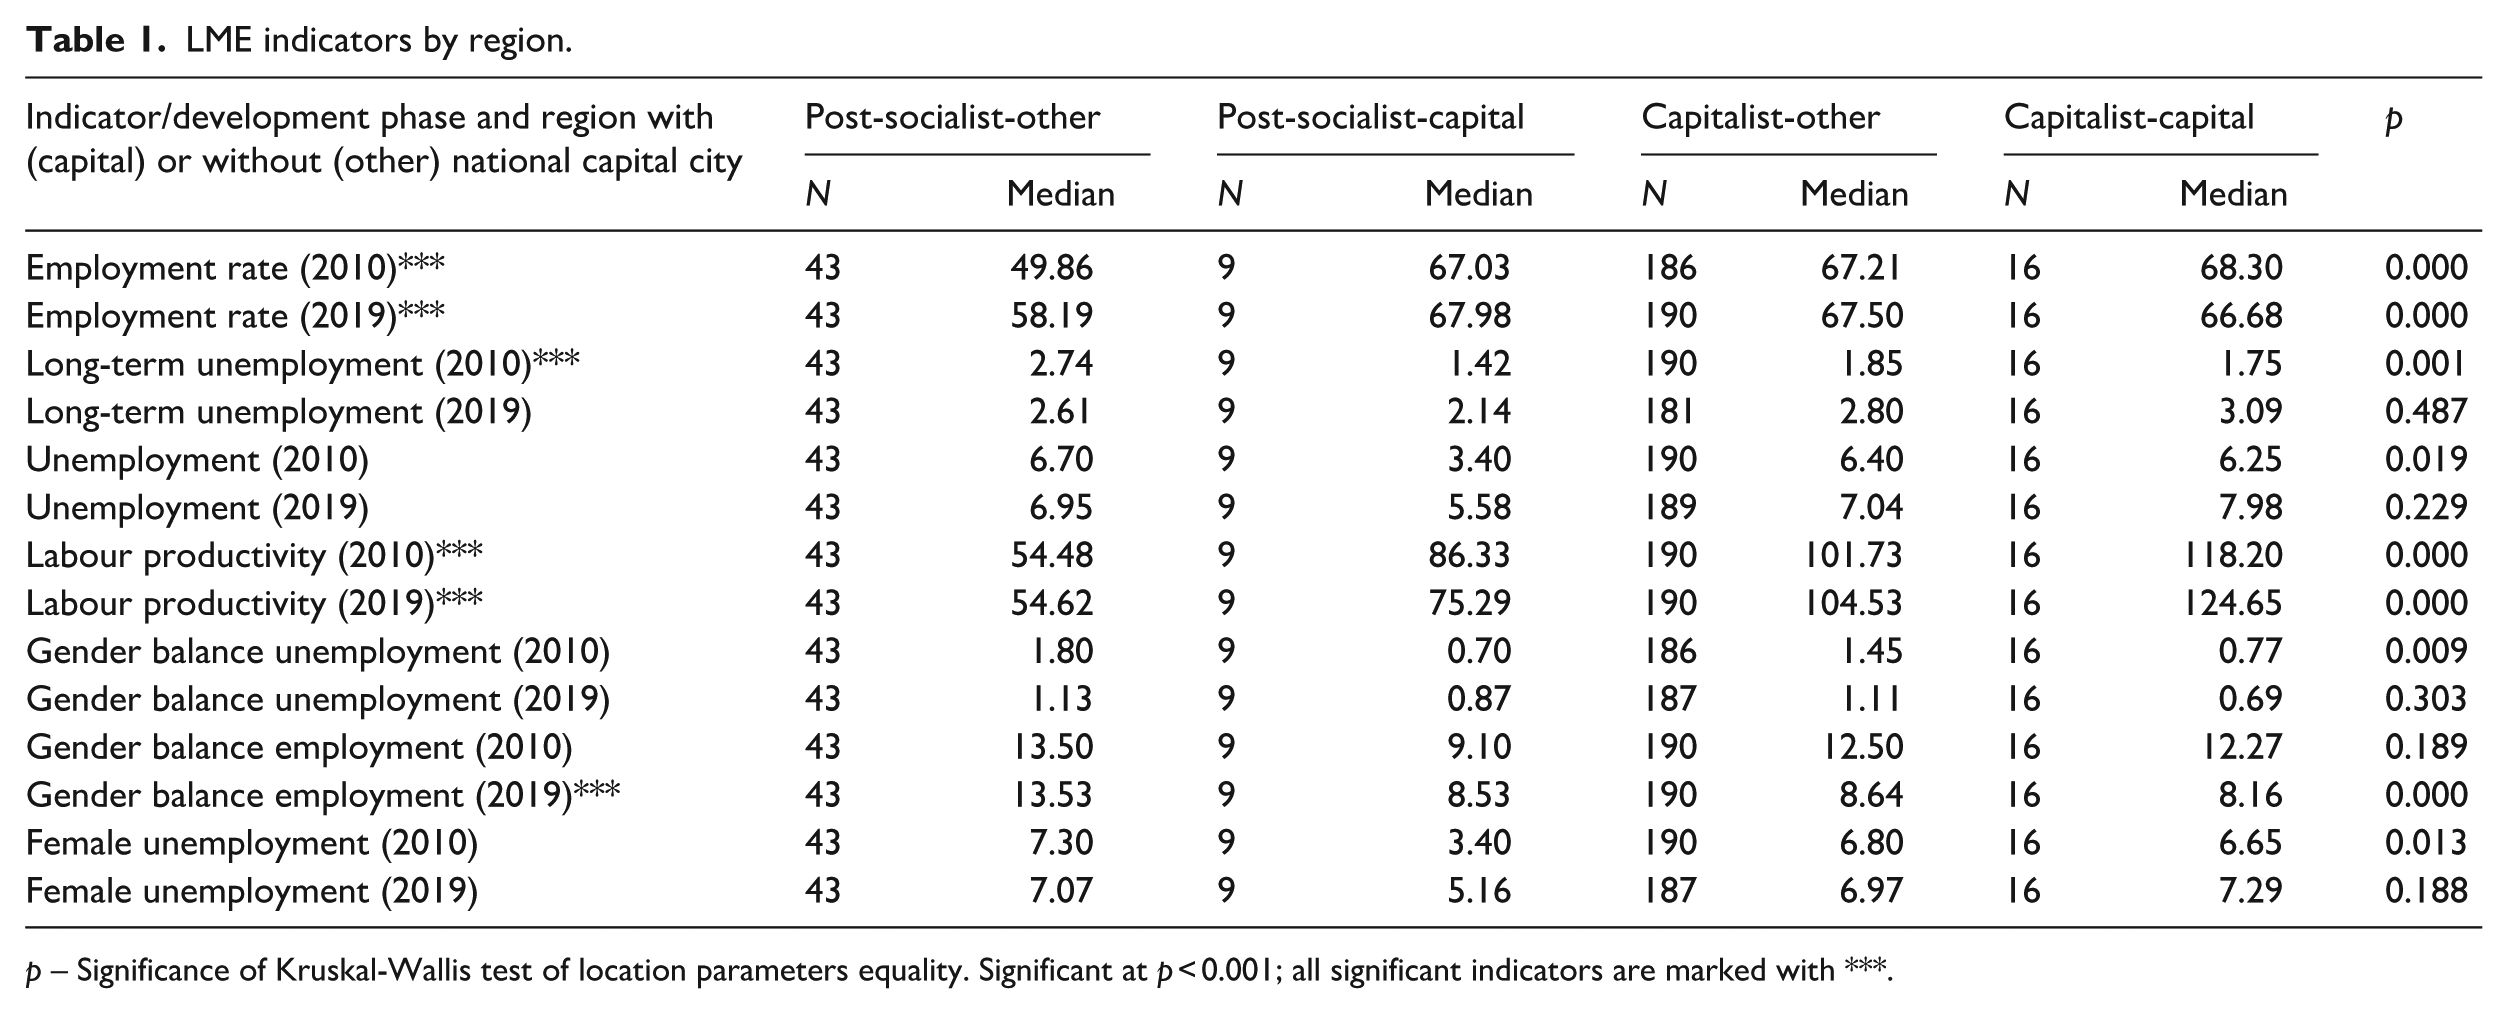
p – Significance of Kruskal-Wallis test of location parameters equality. Significant at p < 0.001; all significant indicators are marked with ***.
Table 1 reveals significant disparities in labour market efficiency indicators across the four regional groups. In 2010, post-socialist regions without capitals exhibited notably lower employment rates and higher long-term unemployment, while post-socialist capital regions showed more favourable outcomes. By 2019, differences in long-term and general unemployment rates diminished, suggesting convergence. Labour productivity, however, continued to display significant disparities, with modest improvements in non-capital post-socialist regions and declines in capital ones, while capitalist regions saw gains. Gender balance in unemployment initially varied, favouring capital regions, but this difference disappeared by 2019. In contrast, gender balance in employment showed emerging disparities, particularly among non-capital post-socialist regions.
Table 2 presents changes in indicators between 2010 and 2019. Stagnation was observed for employment rates and labour productivity, while long-term unemployment, general unemployment and female unemployment significantly worsened. Gender balance indicators generally improved, providing a nuanced view of labour market dynamics across European regions.
Change in LME indicators 2019–2010, all regions.
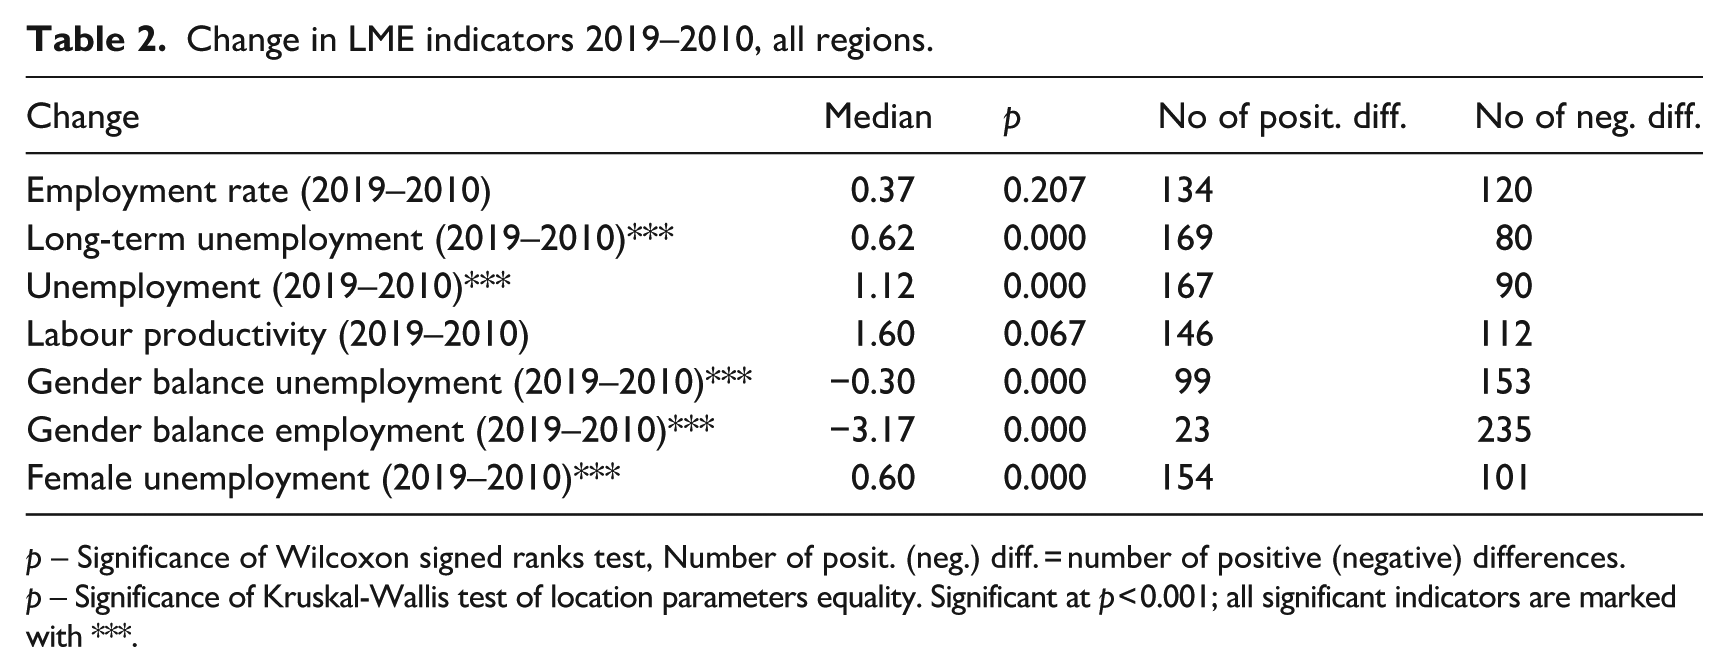
p – Significance of Wilcoxon signed ranks test, Number of posit. (neg.) diff. = number of positive (negative) differences.
p – Significance of Kruskal-Wallis test of location parameters equality. Significant at p < 0.001; all significant indicators are marked with ***.
The test of change for LME indicators for four groups of regions is detailed in Table 3. We note that in post-socialist – other regions the employment rate, and gender balance in unemployment improved, whereas the other changes remained insignificant. In the post-socialist regions with national capitals, both measures of unemployment worsened, whereas female unemployment and the respective gender gap increased. Capitalist regions – with or without the national capital – witnessed deteriorating measures of employment and unemployment.
Change in LME indicators 2019–2010, by region.
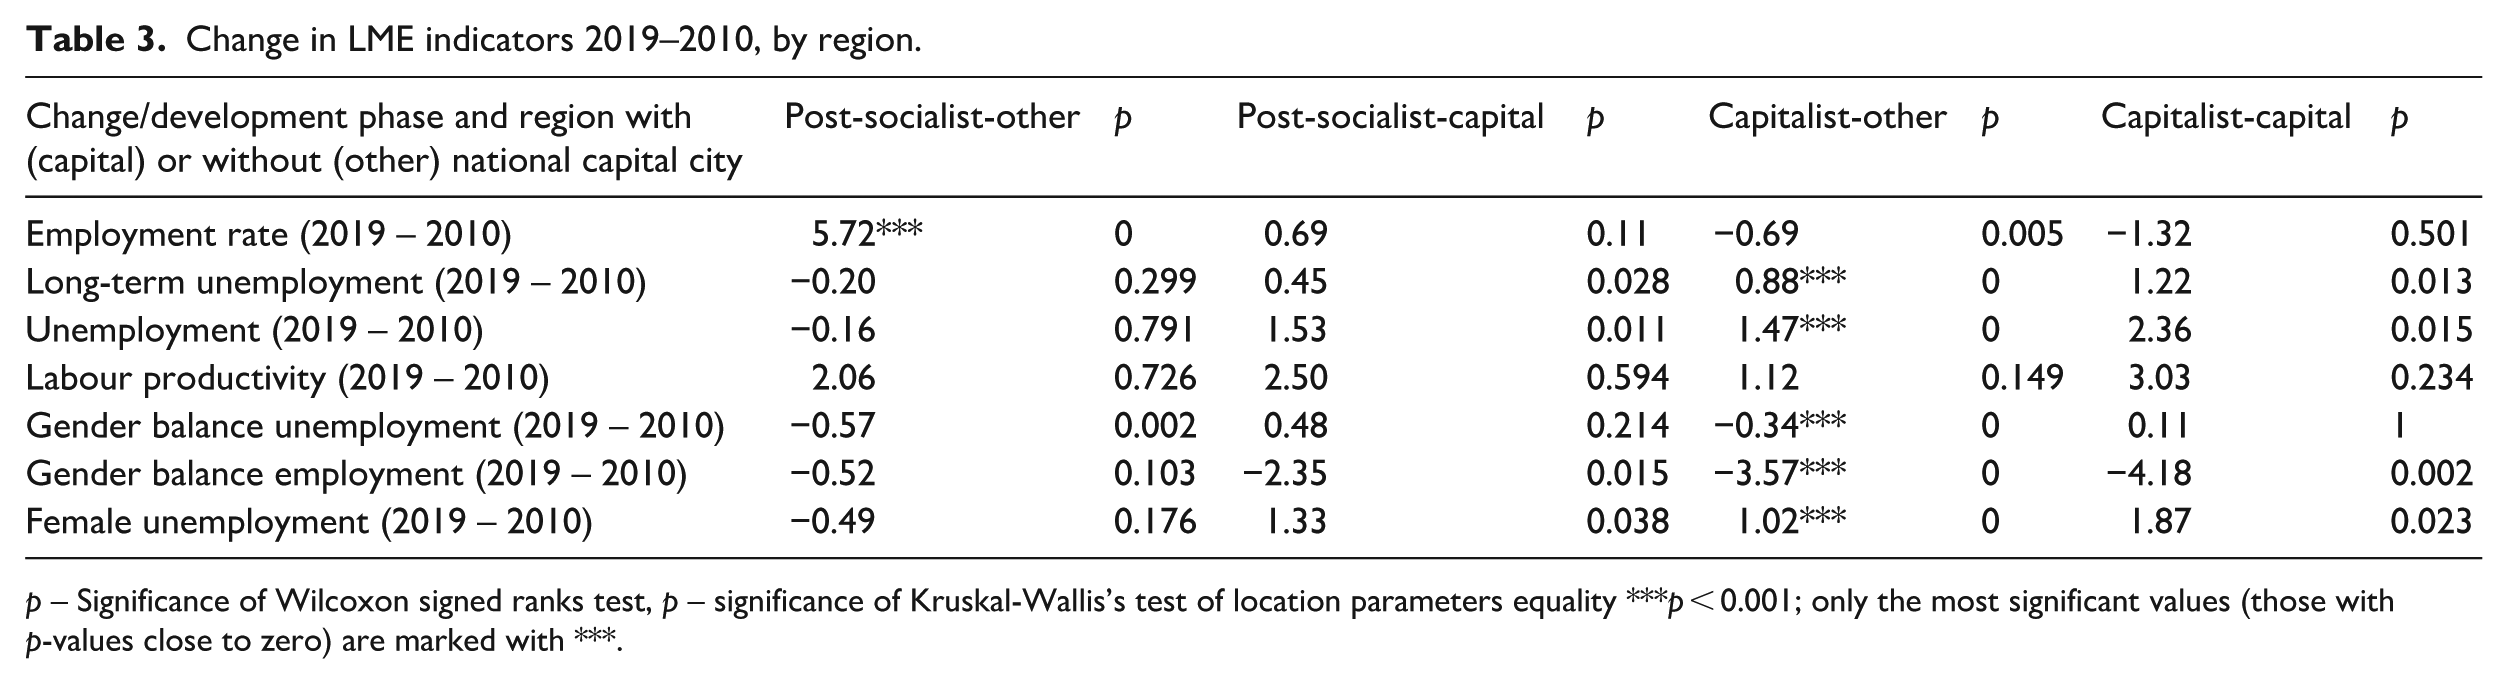
p – Significance of Wilcoxon signed ranks test, p – significance of Kruskal-Wallis’s test of location parameters equality ***p < 0.001; only the most significant values (those with p-values close to zero) are marked with ***.
This analysis highlights how developmental history and geographic-political features impact regional LMEs. The interplay between development phases and the presence of a capital city shapes unique labour market outcomes, indicating a complex set of influences beyond simple economic metrics. NUTS 2 regions in Europe show consistent labour productivity and gender-balanced unemployment, indicating broad uniformity. However, post-socialist regions without capitals saw a rise in employment and a decrease in gender-balanced unemployment, while those with capitals experienced increased long-term and female unemployment. Capitalist regions, regardless of a national capital, showed declining employment rates and gender-balanced employment without capitals, and increased unemployment with capitals. These patterns illustrate significant variations in labour market indicators across regions and over time. Another way to visualize the underlying dynamics is through a scatterplot of β-convergence trends across the four regional clusters for the two time points (see Annex 2 for an example using female unemployment). While useful for illustrating basic patterns, this approach is limited to capturing linear relationships. To account for more complex, non-linear interactions, the following section employs CART decision tree modelling, as described in Section ‘Data, methods and empirical strategy’. The next section focuses on regional clusters and the importance of LME indicators in this context.
Decision tree modelling and assessment of regional clusters
In this section we report the results of the analysis based on decision trees to identify and compare regional clusters according to performance in LME indicators between 2010 and 2019. Specifically, decision trees identify shared convergence patterns across Europe. For the proper use of the decision tree technique, we will use only the dependent variable which, in our case, has two values – capitalist and post-socialist. We will not use ‘capital region’ as another dependent variable because these two groups of regions differ significantly in the number of values (25 capital regions vs 233 other regions). Additionally, as we introduce geographical visualization, capital regions are visible on the maps (see Figures 3 and 5) and thus it is not necessary to use the second categorical variable as dependent.
The decision tree visualized in Figure 2 outlines the classification of regions based on their distinction between post-socialist/capitalist regions (dependent variable), according to LME indicators (independent variables) from the year 2010. It consists of 15 nodes, where each node represents a branching point based on a specific economic variable. Out of these, there are eight terminal nodes, which are the endpoints of the tree where the final regional classifications are determined, indicating distinct economic clusters. The tree reaches a depth of four levels, allowing for a thorough but concise categorization across various indicators, ultimately presenting a clear and manageable overview of the regional economic landscape for that period, its classification is shown in Table 4.
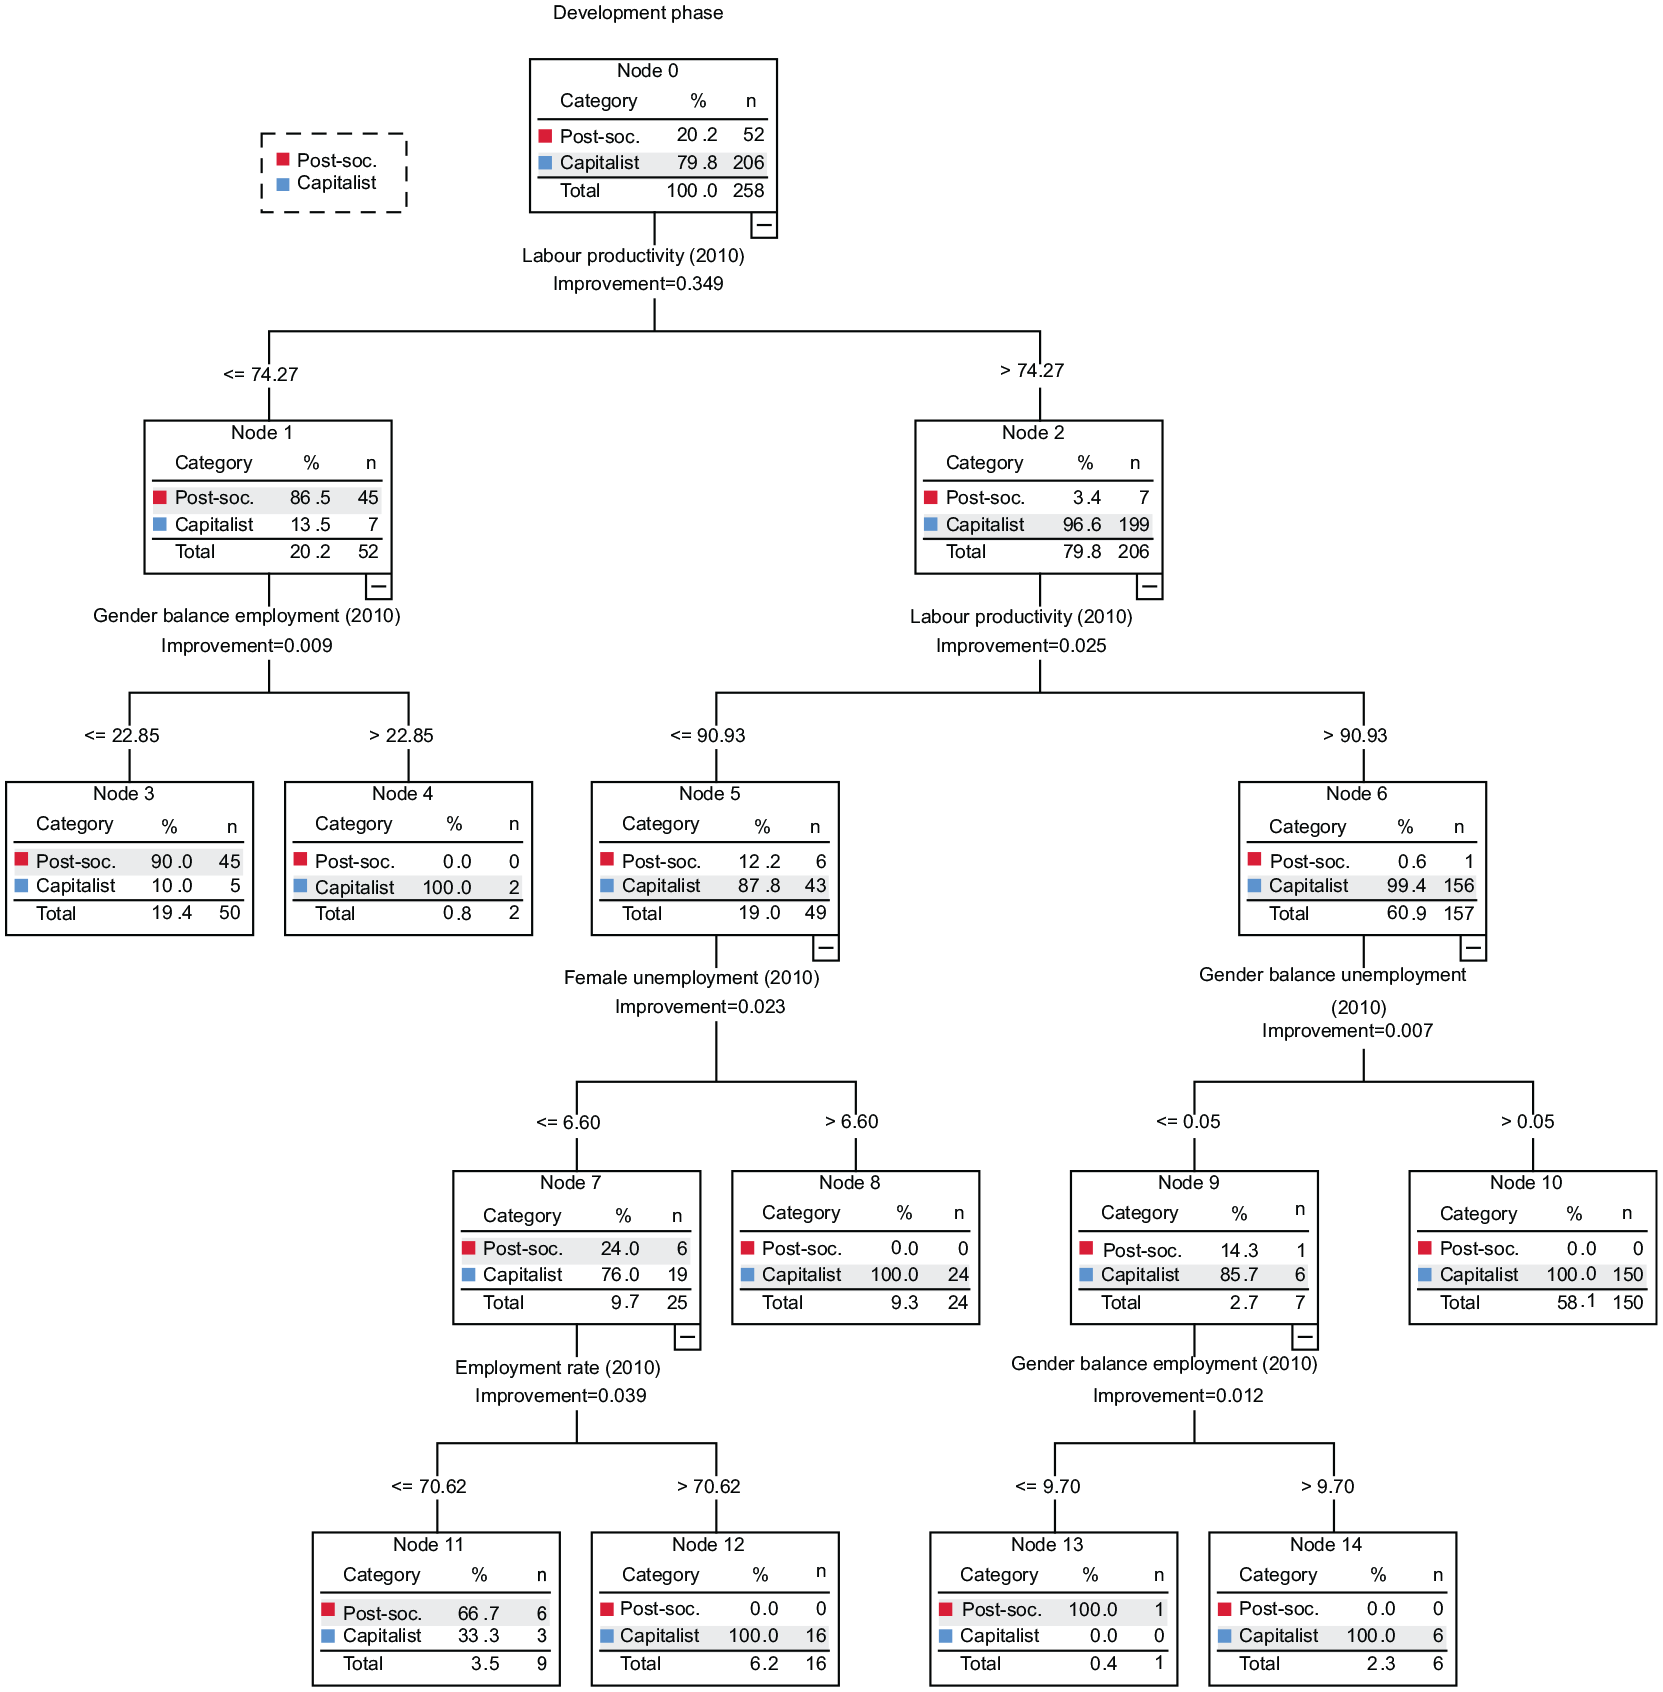
CART decision tree in space of original LME indicators in 2010 by development phase.
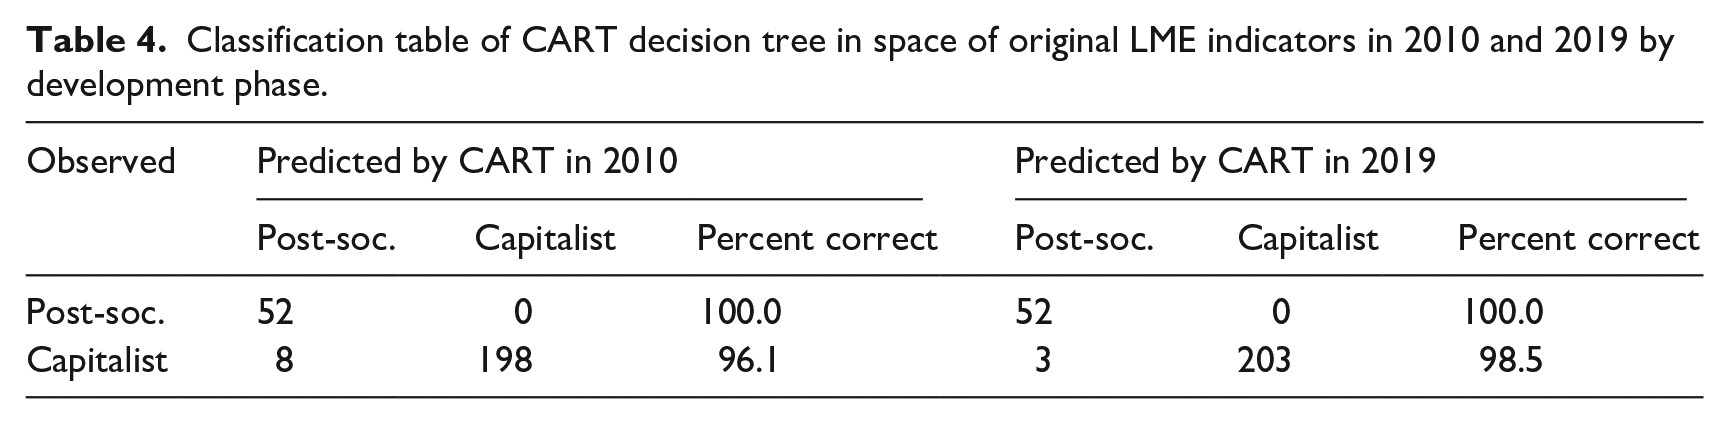
Classification table of CART decision tree in space of original LME indicators in 2010 and 2019 by development phase.
The primary division of the classification tree is based on labour productivity in 2010, clearly separating predominantly post-socialist regions from capitalist ones. Gender balance in employment emerges as a secondary but meaningful discriminant within regions characterized by lower labour productivity. In regions with higher productivity, subsequent splits emphasize female unemployment and employment rates, underlining their socioeconomic significance. Regions with favourable female employment conditions or higher general employment rates typically align with capitalist characteristics. Although gender balance metrics offer modest additional refinement, labour productivity remains the dominant factor, aligning with Krugman’s (1994) assertion of its paramount importance in regional prosperity. Capitalist regions tend to perform better across most indicators. However, the presence of post-socialist regions in clusters with higher efficiency metrics suggests that some are catching up, possibly due to reforms and integration into the broader European economy. This convergence, however, is not uniform, as reflected by the varied clusters that include post-socialist regions, indicating that while some are adapting well, others still lag behind capitalist counterparts. For better visualization and assessment, the map presented on Figure 3 transforms the decision tree model outcomes for the year 2010 into a geographic visualization, clustering European regions based on the terminal nodes of the decision tree, which correspond to concrete LME indicators. Each colour represents a unique node from the decision tree.
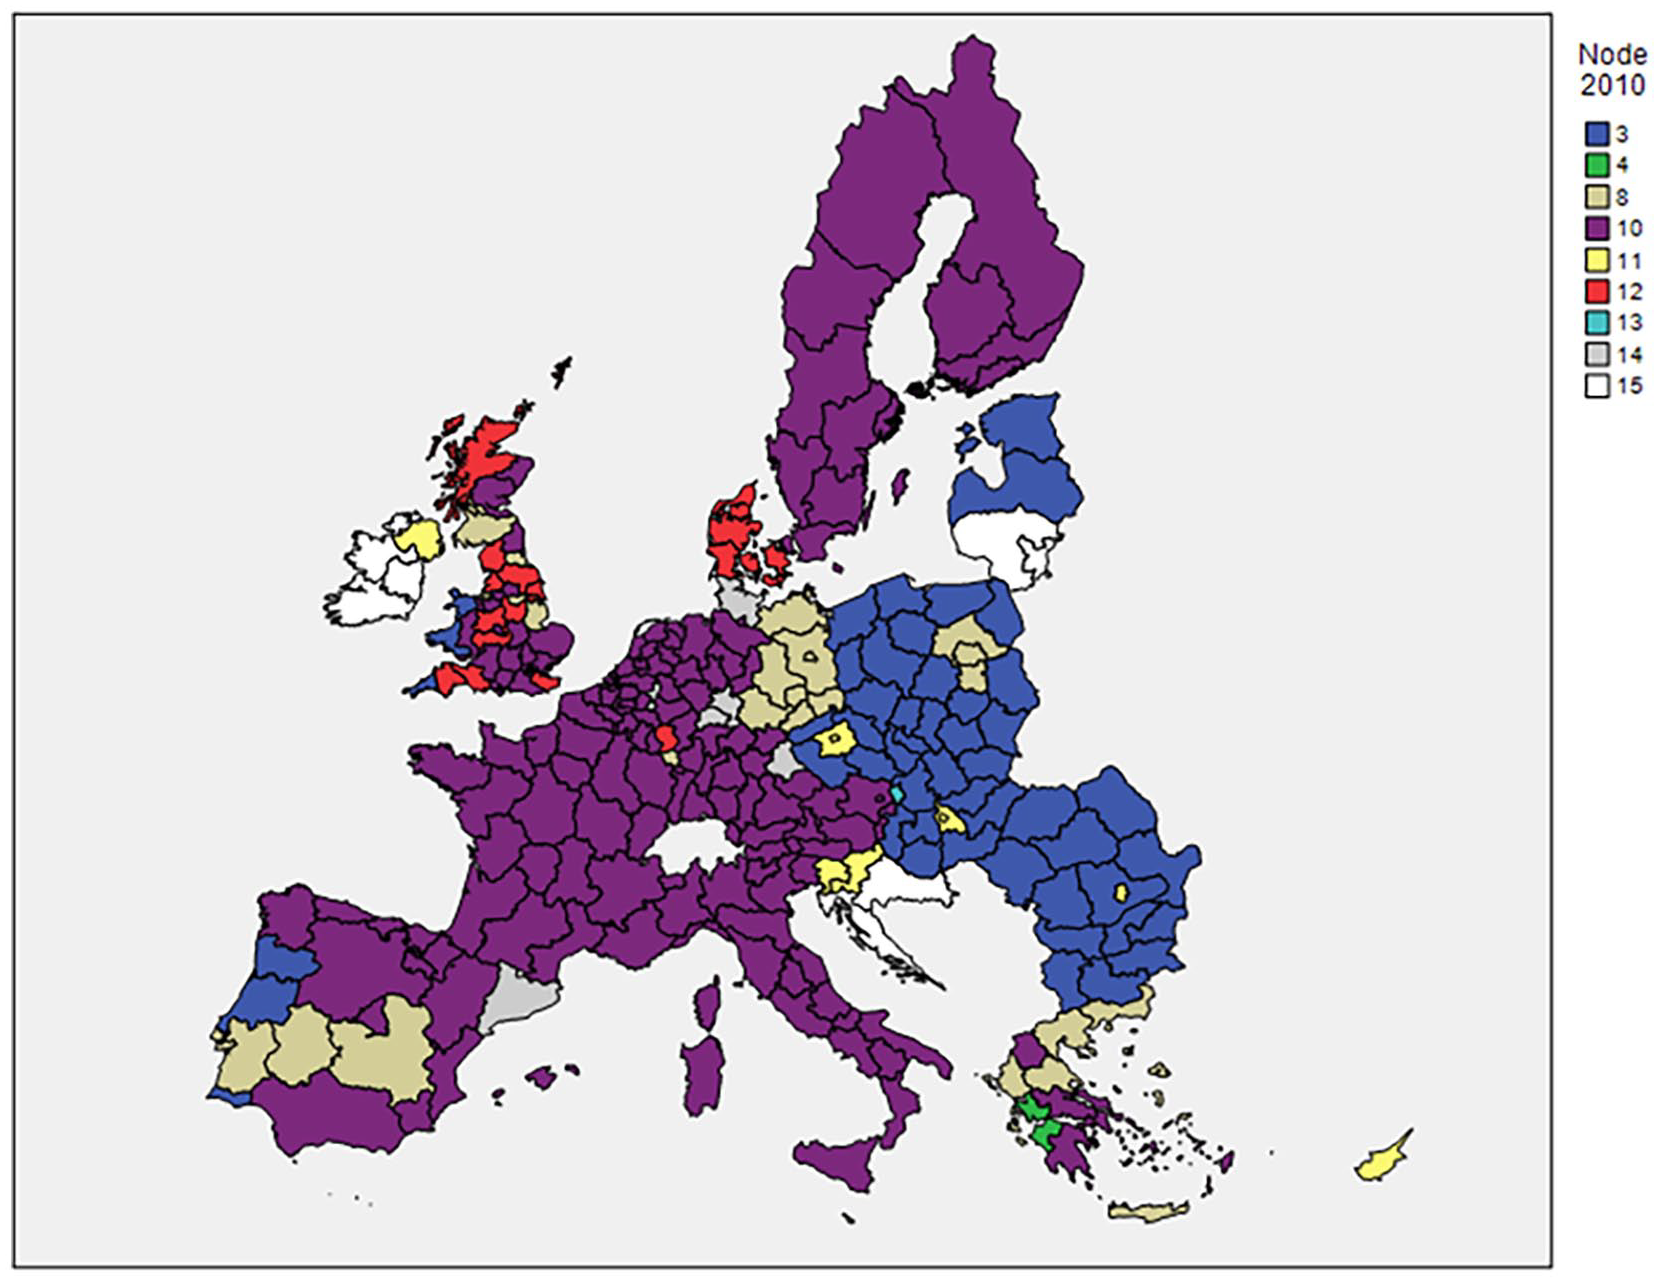
Geographic visualization of the decision tree model outcomes for the year 2010.
Node 3 predominantly comprises post-socialist regions characterized by lower labour productivity and weaker gender balance in employment, alongside a few capitalist exceptions. Node 4 includes exclusively capitalist regions with comparatively higher gender balance employment despite lower productivity. Node 8 features capitalist regions distinguished by moderate productivity but elevated female unemployment. Nodes 11 and 12 differ primarily by employment rate, grouping mixed capitalist and post-socialist regions with lower employment against purely capitalist regions with higher employment rates. Remarkably, a singular post-socialist region achieves the highest performance (the capital region of Slovakia), occupying its own distinct cluster. The geographic visualization underscores Europe’s economic diversity, facilitating intuitive regional comparisons critical for informed policy-making.
The classification table indicates that all post-socialist regions are precisely classified (without error; Percent Correct = 100%), while capitalist regions are correctly classified in 96.1% of cases. Eight capitalist regions are classified as post-socialist regions, reflecting anomalies in their economic profiles. These regions are located in node 3 (see Figures 2 and 3) characterized by lower productivity and lower gender balance employment, includes regions such as North Portugal, Algarve, Central Portugal, Cornwall and Isles of Scilly and West Wales. Remaining three regions (Cyprus, Madeira and Northern Ireland.) are in node 11, which exhibits a medium level of labour productivity and with lower employment rates. These classifications may indicate underlying structural disparities that align more closely with post-socialist economic patterns rather than their capitalist labels, suggesting a need for targeted policy interventions to address these regional disparities.
The classification for 2019 again indicates that all post-socialist regions are precisely classified, while capitalist regions are correctly classified in 98.5% of cases. By 2019, most previously classified capitalist regions had realigned with the broader capitalist regions group, reflecting a convergence in structural characteristics. However, three regions, namely Central Portugal, Cornwall and Isles of Scilly and Madeira, remained classified as post-socialist, suggesting persistent structural challenges.
The decision tree provided on Figure 4 depicts a model for categorizing European regions based on labour market indicators for the year 2019. Classification is provided in Table 4.
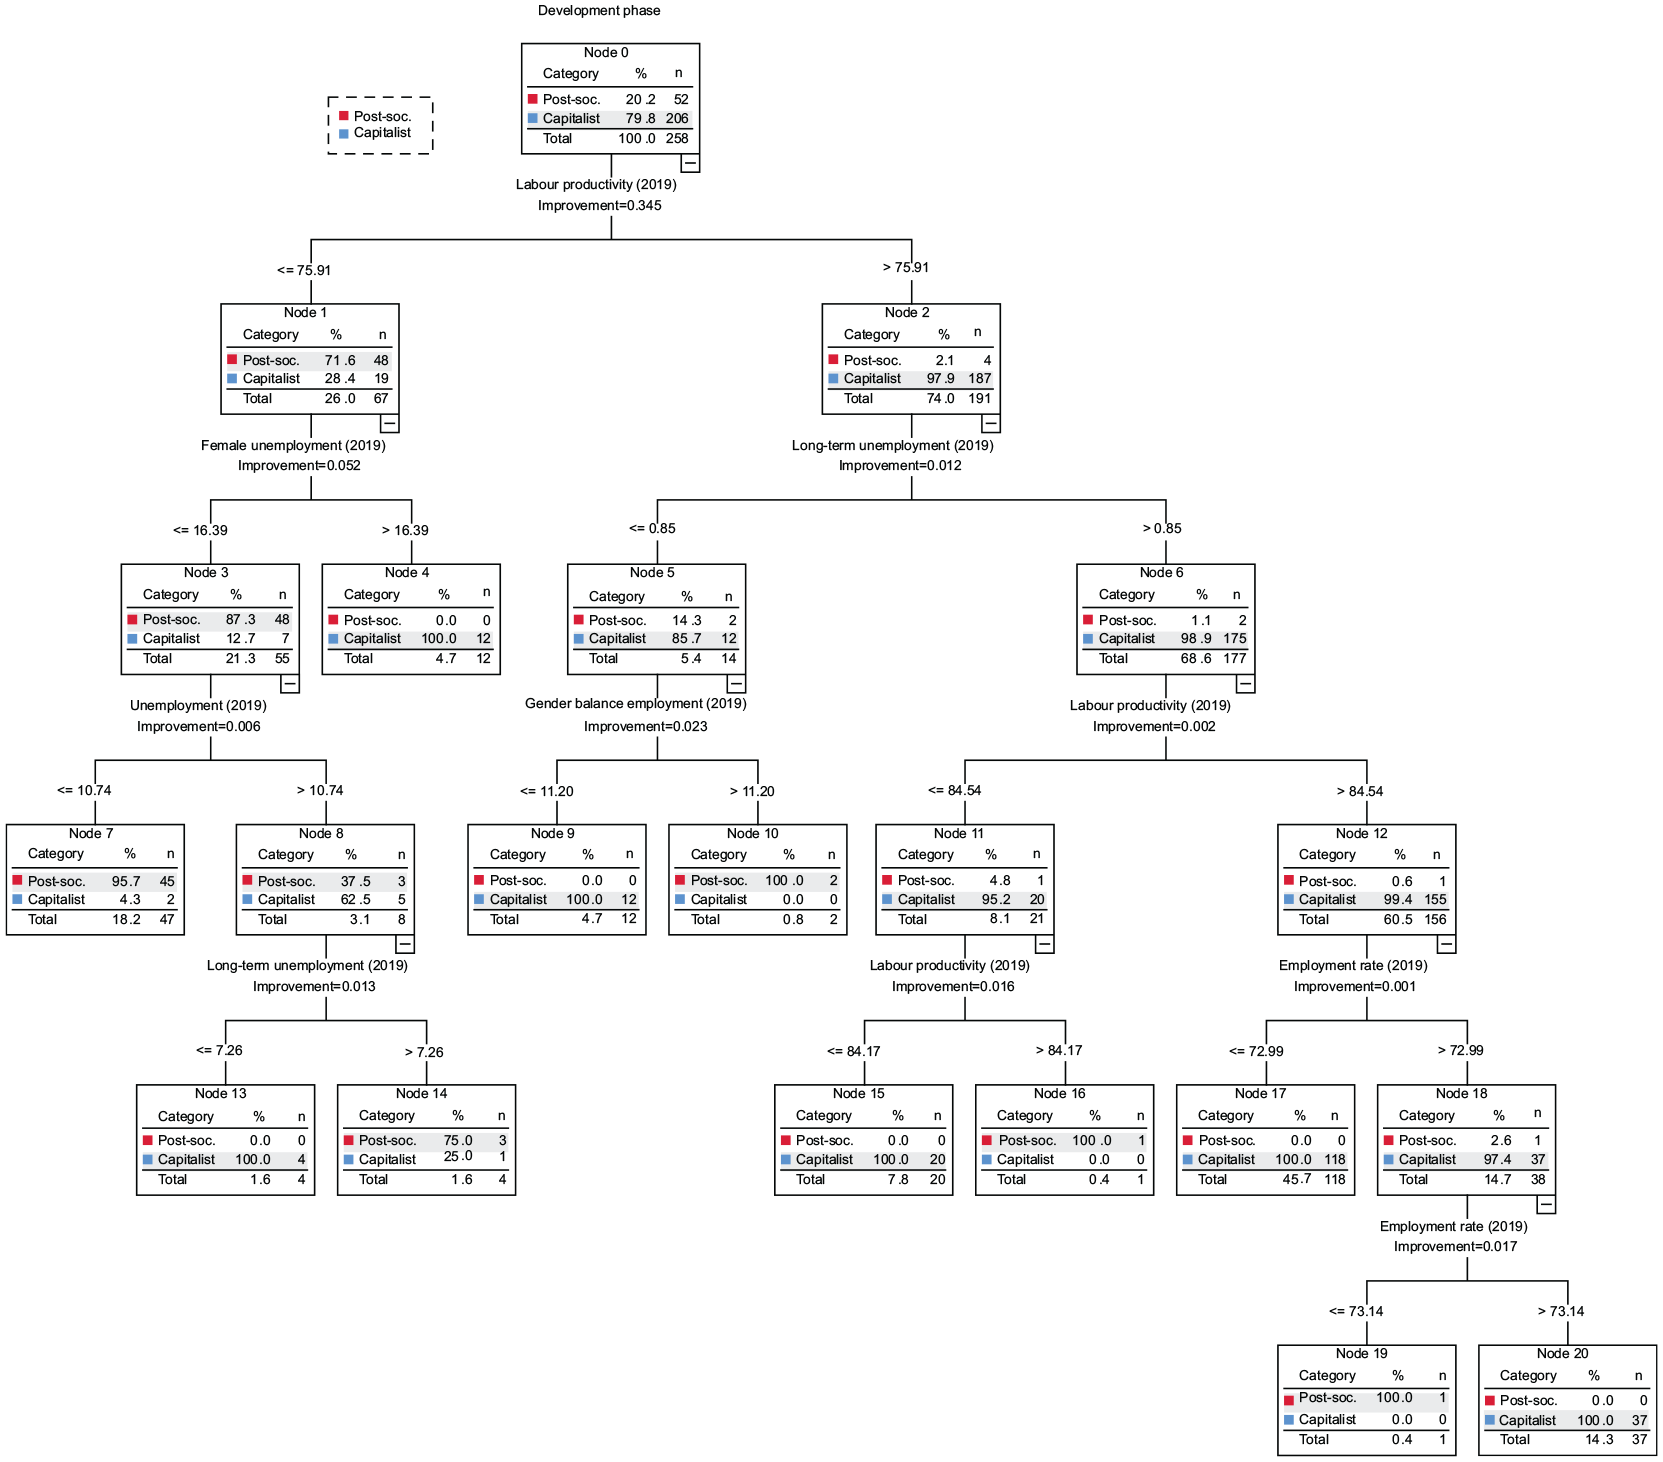
CART decision tree in space of original LME indicators in 2019 by development phase.
The tree comprises 21 nodes, each representing a decision point where the dataset is split based on the value of a particular indicator. Of the 21 nodes, 11 are terminal nodes. These nodes signify the final categories into which regions are classified, with no further subdivisions. Each terminal node encapsulates a cluster of regions sharing similar economic characteristics as per the indicators assessed (see Figure 4). The tree has a depth of five levels, indicating that the most extended path from the root to a terminal node crosses five splits, classification is given in Table 4.
At the root of the 2019 decision tree, labour productivity remains the principal factor influencing regional classification, underscoring its sustained relevance. Subsequent divisions highlight female and long-term unemployment as crucial secondary indicators, alongside gender balance in employment, general unemployment and employment rates, each refining regional categorization with nuanced significance. Terminal nodes consolidate clusters characterized by distinct economic profiles based on these labour market variables. Node 7, which includes Central Portugal and Cornwall and Isles of Scilly, exhibited lower productivity and higher unemployment, indicative of structural weaknesses that hinder economic performance. Meanwhile, Node 14, encompassing Madeira, was characterized by severe long-term unemployment and productivity issues, aligning with the notion of a development trap (Diemer et al., 2022) and Ninth report on economic, social and territorial cohesion (Laguna, 2024). These challenges constrain the ability of such regions to integrate into the global economy, thereby placing them at a competitive disadvantage within Europe. The characteristics of regions in a development trap provide critical insights into potential links with a new typology of economic complexity traps (Diemer et al., 2022). Beyond the standard features of development traps (Diemer et al., 2022; Iammarino et al., 2020; Rodríguez-Pose et al., 2024), self-reinforcing dynamics may further restrict the capacity of regions to innovate and develop new growth trajectories (Balland et al., 2022). Such limitations underscore the necessity for targeted policy interventions (Figure 5).
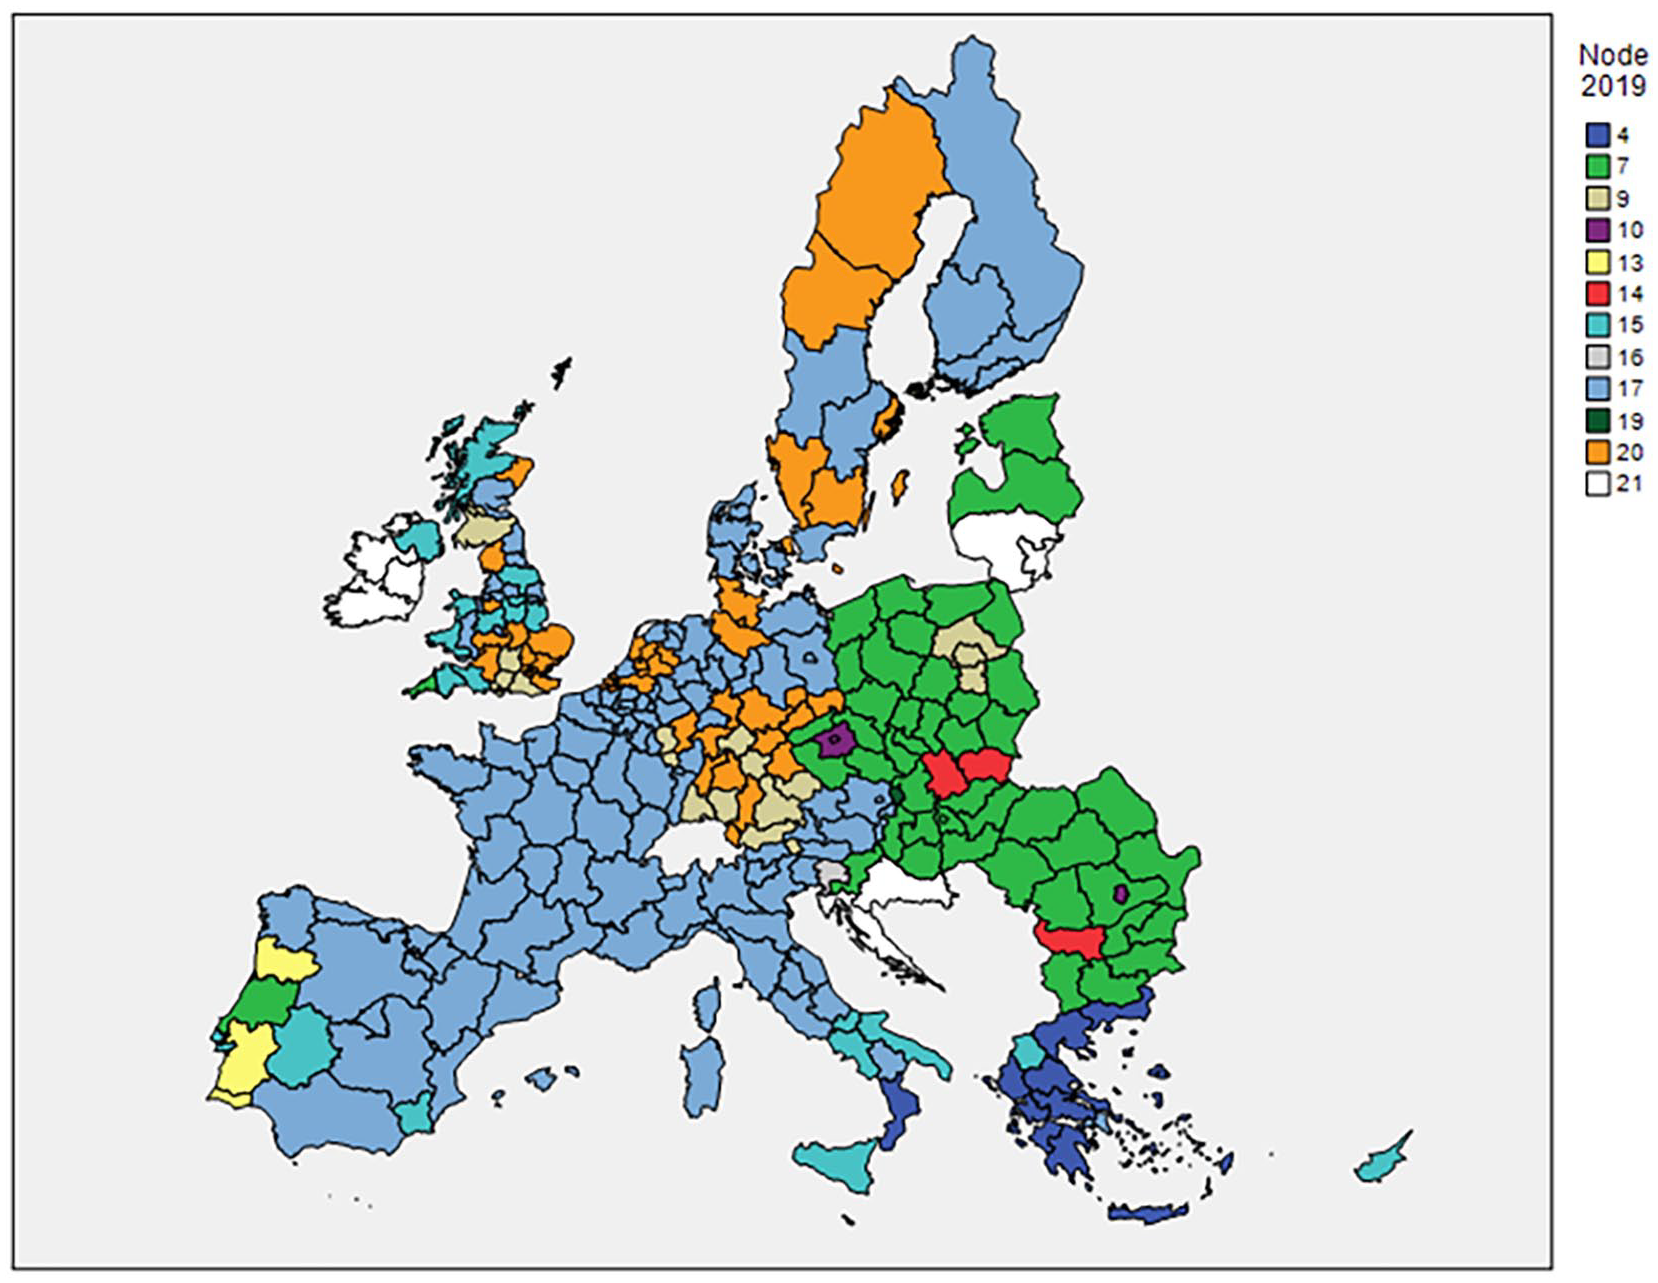
Geographic visualization of the decision tree model outcomes for the year 2019.
Geographic visualization reveals increased regional heterogeneity compared to 2010, identifying distinct peripheral capitalist regions marked by lower productivity and elevated female unemployment, while predominantly post-socialist clusters exhibit lower productivity paired with varying unemployment dynamics, reflecting the complex economic diversity across European regions. The decision tree analysis reveals that 177 regions exhibit higher labour productivity than the rest, with 175 being capitalist regions and two being post-socialist regions (the capital regions of Slovakia – node 19 and Slovenia – node 16). The divergence among these regions is then further refined by employment rates, making the group more heterogeneous than observed in 2010. The top-performing regions are located in node 20, consisting solely of 37 capitalist regions. These regions boast the highest productivity and employment rates. The capital region of Slovakia, captured in node 19, is identified as a catching-up region, exhibiting a slightly lower employment rate but still maintaining high labour productivity. Node 17 is the largest homogenous cluster, comprising entirely capitalist regions characterized by high labour productivity and marginally lower employment rates. An interesting pattern is observed in node 15, which includes solely capitalist regions that, intriguingly, have slightly lower productivity than the post-socialist region in node 16.
To shed more light on the dynamics of European labour markets, Table 5 offers an insightful comparison of how the importance of independent variables, in our case LME indicators, has evolved from 2010 to 2019, reflecting shifts in the indicators’ impact on European labour market.
Changes in LME indicators importance between 2010 and 2019.
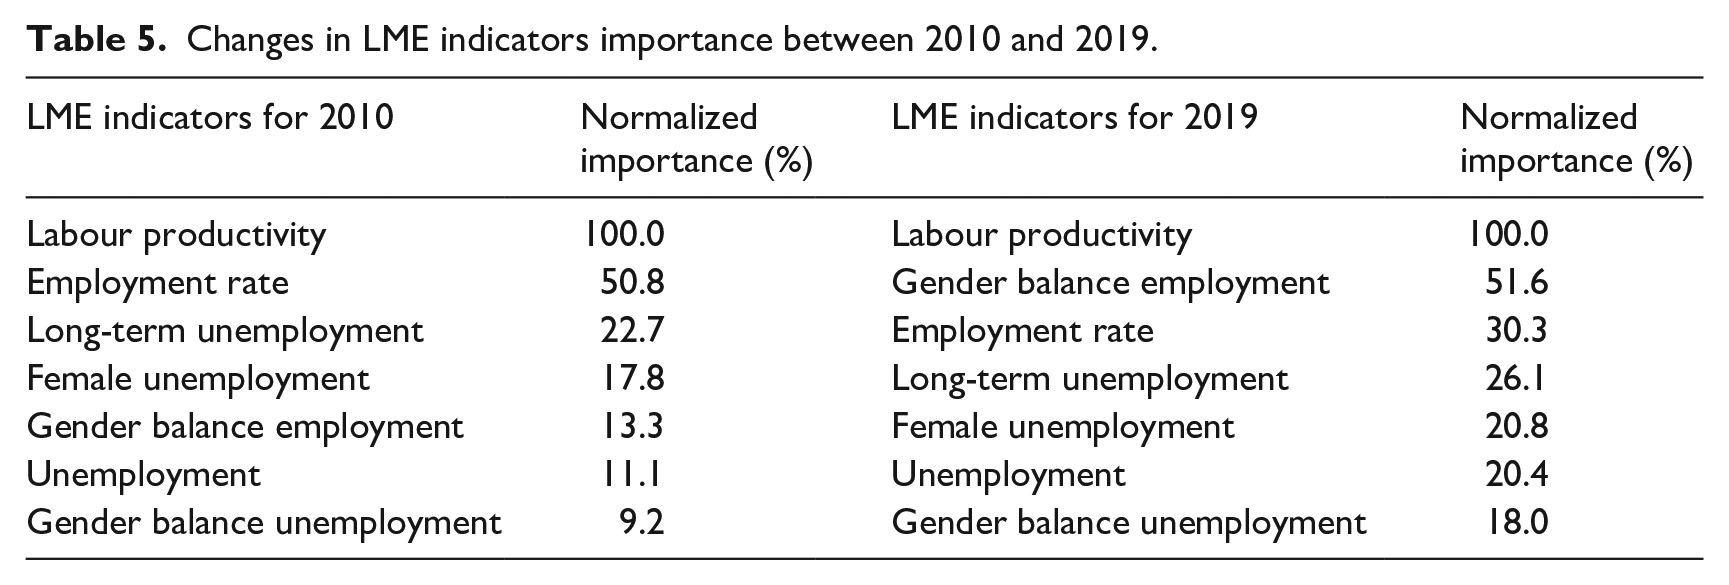
Our data comparison between the years 2010 and 2019 underscores labour productivity as the most significant determinant of regional prosperity. The importance of other economic indicators has evolved over time, reflecting broader shifts in economic and social dynamics. For instance, the importance of the employment rate decreased from 50.8% in 2010 to 30.3% in 2019. Conversely, Gender balance employment importance increased significantly from 2010 to 2019, suggesting its growing importance for overall employment health. Indicators such as long-term unemployment and female unemployment also show variations in their relative importance, indicating changing priorities and challenges within regional economies.
This dynamic shift in indicator importance not only confirms the continuous critical role of labour productivity but also highlights how other elements such as gender balance and employment rates increasingly contribute to understanding regional labour market health and policy responses.
Discussion
Labour productivity remained the key determinant of labour market efficiency between 2010 and 2019. Decision tree analyses (Figures 2 and 4) reveal a stable importance of labour productivity and gender balance unemployment yet expose evolving regional dynamics. In 2010, post-socialist regions without capitals faced stagnation but modest employment growth, while capitalist regions, particularly non-capital ones, experienced declining employment. By 2019, the landscape became more fragmented: peripheral capitalist regions showed falling productivity and rising female unemployment, whereas post-socialist regions, including capitals, saw increased unemployment. Notably, the capitals of Slovakia and Slovenia emerged as catching-up regions, achieving high productivity but facing internal country disparities due to human capital concentration mainly in capital cities. Although the threshold for distinguishing higher productivity regions slightly rose over time, the composition shifted, with fewer post-socialist regions reaching higher performance levels and an increasing number of capitalist regions, particularly in southern and western Europe, falling into the lower productivity group, signalling emerging structural vulnerabilities.
Our findings also resonate with the work of Acemoglu et al. (2005), Bristow and Healy (2015) and Rodriguez-Pose and Ganau (2022), who emphasize historical and institutional path dependencies, arguing that regional economic prospects and resilience are importantly shaped by institutional adaptability and the capacity for innovation. The variations in convergence patterns observed in our analysis may thus be partly explained by differences in institutional quality, workforce skill composition and policy responses, factors that Bristow and Healy (2015) identify as crucial determinants of resilience and that Acemoglu et al. (2005) puts in the spotlight as the key factors of long-run economic prospects. Our findings also align with Krugman’s (1991) economic geography model explaining why regions exhibit disparate patterns of labour market convergence, highlighting the roles of location and industrial specialization in shaping their labour market structures.
This study provides an in-depth analysis of convergence patterns by examining only labour market efficiency indicators across 258 NUTS 2 regions in 25 EU countries. While our findings offer valuable insights for policymakers, particularly at the regional level, where they can inform targeted measures, several limitations must be acknowledged. First, the exclusion of additional labour market indicators, such as NEET (not in employment, education or training), arose from incomplete data for the initial study period. A promising avenue for further research lies in exploring the relationship between labour market dynamics and the propensity of regions to fall into a development trap (Diemer et al., 2022; Iammarino et al., 2020; Laguna, 2024; Rodríguez-Pose et al., 2024). Investigating how specific indicators exacerbate or mitigate this risk, as well as identifying effective policy interventions, would contribute significantly to both scholarly discourse and practical policymaking. Incorporating a wider range of indicators and employing novel analytical methods could deepen our understanding of labour market convergence, thereby enriching empirical evidence and expanding theoretical frameworks.
Conclusions
The analysis of LME indicators from 2010 to 2019 reveals significant variation across the European Union. Post-socialist regions show economic adjustment and social change, while capitalist regions face stagnation in labour productivity and employment rates. Decision tree insights highlight labour productivity as crucial for regional prosperity, with some improvements in gender balance metrics, but substantial efforts needed to enhance productivity and address unemployment disparities for balanced and inclusive growth.
Our in-depth analysis of post-socialist and capitalist regions reveals persistent structural differences and path dependencies, reflecting historical legacies and contemporary economic policies (Hirt, 2013; Sassen, 2006). These findings underscore the need for targeted strategies to address unique regional challenges and opportunities. The utilization of a path dependence framework to analyze divergences and convergences between Western and post-socialist regions opens avenues for further research. By emphasizing how institutional and historical trajectories condition contemporary policy choices, this approach sheds new light on why certain developmental patterns persist or why particular reforms succeed or fail. Further research could apply these insights to other regions that possess distinct socio-political and economic legacies yet share aspirations for deeper integration or systemic transition. For instance, scholars could investigate whether the path-dependent dynamics observed in post-socialist Europe manifest similarly in Southeast Asia under the Association of South East Asian Nations (ASEAN) framework, where diverse political systems and levels of economic development coexist. The Korean Peninsula, marked by stark ideological and institutional contrasts, offers another compelling laboratory for examining whether path-dependent forces could hinder or facilitate potential reconciliation and unification processes. Likewise, in regional blocs such as MERCOSUR in South America and the African Union, legacies of colonialism, diverse governance structures and varied economic endowments may interact in path-dependent ways, resulting in unique trajectories of integration and reform.
The comparative decision tree analyses for 2010 and 2019 offer insights into the evolution of the European labour market landscape. Mapping decision tree outcomes geographically provides an intuitive tool for visualizing economic diversity and labour market profiles, enhancing our understanding of regional disparities and informing targeted policy interventions. This nuanced regional analysis is crucial for advancing economic convergence.
Our innovative application of decision tree modelling to assess LME over two periods mark a novel approach in regional labour market analysis. Creating separate models for 2010 and 2019 enabled detailed exploration of regional convergence patterns, harnessing temporal and spatial data analysis. The multi-tiered structure of our decision trees captures the intricate economic profiles of European regions, translating these findings into actionable geographic visualizations. This methodology provides a robust framework for comparing changes across periods and supports targeted economic policy-making.
The decade-spanning analysis reinforces labour productivity’s role as the paramount determinant of regional prosperity within the EU, evidenced by its consistent high importance scores. The fluctuating importance of other economic indicators reflects the dynamic socio-economic environment, with the shift from employment rate to gender balance in employment highlighting evolving labour market priorities and regional economic challenges.
The stagnation in LMEs observed in the European Union in 2010–2019 underscores the critical importance of enhancing labour productivity as a fundamental lever for improving regional prosperity and standards of living, echoing Krugman’s (1994) assertion that productivity is paramount in the long-term economic advancement of a region. As pointed out by Morris et al. (2020), it is crucial to implement policies that explicitly recognize place-specific skills gaps and shortages in order to improve productivity and address regional productivity divides. Furthermore, the observed improvements in Gender Balance Unemployment and Employment indicators, while positive, highlight the need for targeted policy interventions. To advance on their convergence path, European regions should prioritize measures to boost labour productivity and address unemployment disparities to catalyze local prosperity and ensure balanced and inclusive economic growth, aligning with McCann’s (2020) insights on the crucial role of local productivity in shaping policy responses.
This could include, in line with for example, Aghion and Howitt (2006), targeted labour market policies, including upskilling programmes and mobility incentives, can accelerate structural labour market convergence. Additionally, Campos and Coricelli (2019) highlight the importance of institutional reforms in mitigating the persistent labour market disparities inherited from centrally planned economies. Finally, in the spirit of Acemoglu et al. (2005), Bristow and Healy (2015) and Rodriguez-Pose and Ketterer (2020) economic policies aimed at fostering regional convergence should go beyond direct fiscal support and instead focus on strengthening innovation ecosystems, industrial diversification and institutional effectiveness.
In conclusion, our research draws attention to the persistence of labour market characteristics over time, while also revealing regions that break away from historical legacies and trends. Our research results also identified specific individual regions at risk of falling into a development trap, aligning with findings from several recent studies (Diemer et al., 2022; Iammarino et al., 2020; Laguna, 2024; Rodríguez-Pose et al., 2024). These findings have the potential to inform region-specific economic policies that reflect the distinct labour market conditions across Europe, fostering more tailored approaches to regional development and convergence.
Footnotes
Annex 1.
Data.
Before analyses we made some necessary adjustments of data (aggregations and exclusions) because of incompatibility of regions between initial period 2010 and final period 2019.
Aggregation of regions with capitals with other regions by averaging:
Exclusion of regions:
So after all the final count of EU states was 25 and overall number of regions was 258.
Already mentioned categorical variable ‘Development phase and capital region’ has got much unbalanced proportions of its values but it must be respected:
For multivariate analyses it is rather complication to gain right classification for both larger groups of other regions and for smaller groups of regions with capital.
The following NUTS 2 regions are covered in terms of numbers per country and in alphabetical order: Austria (8), Belgium (9), Bulgaria (6), Cyprus (1), Czech Republic (7), Denmark (5), Estonia (1), Finland (5), France (26), Germany (37), Greece (13), Hungary (7), Italy (21), Latvia (1), Luxembourg (1), Malta (1), Netherlands (11), Poland (16), Portugal (7), Romania (8), Slovakia (4), Slovenia (2), Spain (19), Sweden (8) and United Kingdom (34).
Annex 2.
Acknowledgements
The first author gratefully acknowledges support as a Fernand Braudel Fellow at the European University Institute (EUI), Department of Economics, funded by the EUI Widening Europe Programme. As part of this fellowship, we received valuable feedback on an earlier version of this manuscript during a presentation at the Robert Schuman Centre for Advanced Studies. We thank the participants for their insightful comments and suggestions.
Declaration of conflicting interests
The authors declared no potential conflicts of interest with respect to the research, authorship, and/or publication of this article.
Funding
The authors disclosed receipt of the following financial support for the research, authorship, and/or publication of this article: Funded by the European Union’s Horizon Europe research and innovation programme under grant agreements Nos. 101079219 and 101061198, and the EU NextGenerationEU through the Recovery and Resilience Plan for Slovakia under the project Nos. 09I01-03-V04-00063/2024/VA and 09I03-03-V04-00768/2024/VA.