
Abstract
Many studies have shed light on the positive side of relatedness, but little attention has yet been devoted to possible downsides of relatedness for firm performance in regions. We found in a case study of the oil-dependent Stavanger region in Norway that plants in industries that are skill-related to the dominant oil and gas industry showed lower employment growth than plants in other industries. This was the case both in the boom and the crisis periods, even when controlling for supply linkages to the oil and gas sector. However, we also found that plants skill-related to the oil and gas industry increased their relative performance during the crisis to some degree, but they did not outperform the non-skill-related plants during the crisis.
Introduction
A large body of literature has focused on the question of which economic activities (industries, products, technologies, jobs) can be considered complementary, proximate or related (Carlsson and Stankiewicz, 1991). Scholars have shed light on the positive side of relatedness in terms of knowledge spillovers and complementarities across different activities (Boschma, 2017). Studies tend to show that related variety may have a positive effect on urban and regional growth (Frenken et al., 2007), and that relatedness positively affects regional diversification (Neffke et al., 2011) and resilience of regions in times of crisis (Cainelli et al., 2019; Diodato and Weterings, 2015; Holm and Østergaard, 2015; Xiao et al., 2018).
However, little attention has (yet) been devoted to possible downsides of relatedness (Fitjar and Timmermans, 2019). Scholars have suggested that the overall tendency of regions to diversify in related activities may lead to regional lock-in, with adverse effects on long-term regional development (Coniglio et al., 2018). Moreover, it is not unlikely that the co-location of skill-related industries, i.e., industries that share similar skill requirements (Neffke and Henning, 2013) makes them compete for resources, leading to labour poaching and higher wages (Brascoupe et al., 2010; Duranton and Puga, 2004; Glaeser, 1992; Rosenthal and Strange, 2004). Fitjar and Timmermans (2019) showed that skill-related industries tend to lose their more skilled and productive workers to other higher-wage skill-related industries in the region and that skill-related firms indeed pay higher wages than unrelated firms. However, the effects of co-location of skill-related industries may be very different when one of these industries is affected by a crisis, because redundant labour may flow to and give new impulses to other local skill-related industries.
To shed full clarity on this issue, we aim to investigate whether the local presence of skill-related industries may influence employment growth differently in boom and crisis periods. We focus only on employment growth because this is the most urgent concern of policymakers during and after a crisis. Other performance measures such as sales and productivity growth are left unexplored. It is possible that the competition for talent between skill-related industries serves to increase the productivity of all related industries, while at the same time diminishing the employment growth of these same sectors (Wixe, 2015; Wixe and Andersson, 2017).
We hypothesize that the negative aspects of the relationship between skill-relatedness and employment growth may be more pronounced in a prosperous period, while the positive sides of skill-relatedness are more likely to prevail in a crisis period. We present a case study of the Stavanger region, the leading oil and gas region in Norway, which entered a crisis in 2014 when the oil price crashed. We compared the performance of local plants in skill-related and non-skill-related activities to the petroleum sector before the crisis (2010–2013) and during the crisis (2014–2016). We find that skill-related plants could not capitalize on the oil boom in the Stavanger region and basically suffered from being located close to the oil and gas industry during the prosperous period, but this picture changes somewhat the crisis period: these plants increased their relative performance during the crisis, but they did not outperform non-skill-related firms during the crisis.
The finding could be important both for firms deciding where to locate plants, and for local policymakers trying to combat the negative effects of a crisis. Relocating to or starting a business in a prosperous region could be detrimental to the plant’s growth prospects if the skills required by the new plant is also in demand from the leading local industry. On the other hand, there may be opportunities to acquire skilled labour with little competition during a crisis period, as local plants requiring such skills do not have the capacity to hire. Policymakers on their part should perhaps put more emphasis on attracting investments from outside the region into skill-related industries during a crisis, as the local skill-related industries may not have the capacity to hire redundant workers. In the prosperous periods, local governments should focus their attention to attracting industries that are skill-related but have comparable wage levels to those that are already in the region.
The question of how dominant industries affect other related industries in a region is important, and one that has not yet been explored in the relatedness literature. Other strands of literature, such as the resource curse literature, show how dominant industries could have a negative effect on other sectors in the economy in terms of labour-market competition and political considerations (Venables, 2016). In that regard, we believe that this study is relevant to many regions in similar situations where they have a mono-structural industrial composition. We present a case where this industry structure is based on resource extraction and this may inflate the results somewhat, but it may also apply to regions that are dominated by more traditional manufacturing industries such as shipbuilding.
The paper is structured as follows. Section ‘Relatedness in good and bad times’ discusses the theory on the economic effects of relatedness and presents the hypotheses. Section ‘Empirical setting: A highly petroleum-dependent region’ describes the empirical setting of Stavanger. Section ‘Empirical study – data, variables and model’ presents the data, the econometric model, and the main findings. Section ‘Main findings’ concludes.
Relatedness in good and bad times
There is a long tradition of research in management and economics of innovation that aims to identify which economic activities (industries, products, technologies, jobs) can be considered proximate, related or complementary (Boschma, 1999; Carlsson and Stankiewicz, 1991; Teece et al., 1994). In more recent years, new methods like product space (Hidalgo et al., 2007) and skill-relatedness (Neffke and Henning, 2013) have been developed to measure proximity or relatedness between activities and have been applied in the field of economic geography.
The rationale behind skill-relatedness as proposed by Neffke and Henning (2013) is that individuals who possess certain skills see that they could garner higher or retain more of their wages in a move to somewhere the skills they have are valued and can be used. Therefore, individuals are more likely to change jobs within or between industries that rely on the same set of skills, which in turn enables researchers to determine the degree to which industries are related.
In developing such new methods, scholars have highlighted the positive side of relatedness in terms of knowledge spillovers and complementarities across different activities for regional development (Boschma, 2017). The related variety literature has been influential in arguing that Jacobs’ externalities may have an impact on regional growth only when the sheer variety of activities in a region can be meaningfully combined (Frenken et al., 2007). This is because related activities represent a potential for new combinations on the one hand, and they share similar knowledge and skills that might enhance knowledge spillovers on the other hand. Related variety has often been shown to have a positive effect on regional growth (Boschma et al., 2014; Frenken et al., 2007; Kuusk and Martynovich, 2021; Tavassoli and Carbonara, 2014). Moreover, relatedness has been found to be a key input for regional diversification (Essletzbichler, 2015; Kogler et al., 2013; Muneepeerakul et al., 2013; Neffke et al., 2011). Regions have a strong tendency to develop new activities (technologies, products, industries, professions) related to existing activities because they share similar capability requirements. Studies find that new capabilities required for the development of new activities are easier to acquire and less costly when they are close to existing local capabilities (Boschma, 2017; Hidalgo et al., 2018).
The recent literature on regional resilience has also reported positive effects of relatedness (Boschma, 2015). In general, studies find strong evidence that relatedness lowers the probability that activities in a region will decline or disappear when they are related and embedded to other activities in the region (Neffke et al., 2011; Rigby, 2015). In particular, studies show that in times of economic crisis, regions with a large variety of industries that share similar skill requirements (Neffke and Henning, 2013) are most resilient. This is because these skill-related industries provide alternative job opportunities for workers that have become redundant and enable laid-off workers to move to local sectors where their skills do not diminish in value (Diodato and Weterings, 2015; Hane-Weijman, 2021; Hane-Weijman et al., 2018; Holm and Østergaard, 2015). Specialized regions are most vulnerable when no related jobs are around. This leads redundant workers to become either unemployed or to face substantially lower wages in jobs in unrelated sectors (Eriksson et al., 2016; Holm et al., 2017).
So overall, studies tend to demonstrate strong empirical support for the positive side of relatedness (Boschma, 2017; Hidalgo et al., 2018). However, this empirical fact cannot exclude the possibility that under some circumstances, there might be a downside to relatedness. For instance, scholars have suggested that the overall tendency of regions to diversify in related activities may lead to regional lock-in, with adverse effects on long-term regional development (Coniglio et al., 2018). Roessler et al. (2019) show that this is the case for specialized industrial cities in the Rustbelt states of the US which found themselves in a ‘low complexity trap’ due to diversifying in new technologies closely related to their old techno-industrial core, causing them to fall behind economically. And the proximity literature refers to the proximity paradox (Boschma and Frenken, 2010; Broekel and Boschma, 2011) to describe the tendency of agents to connect to those that are proximate (socially, geographically, institutionally) which might not always be positive for their innovative performance.
Also, the co-location of industries that share similar skill requirements, and thus draw from the same local skill base (Neffke and Henning, 2013) might lead to labour poaching and higher wages (Brascoupe et al., 2010; Duranton and Puga, 2004; Glaeser, 1992; Rosenthal and Strange, 2004). Labour poaching may also lead to a lack of incentives for firms to upgrade or train the skills of their employees (Combes and Duranton, 2006). This is especially detrimental when a region is dominated by one industry. This may imply that the position of skill-related firms that are not exposed to the same business cycle, can be under pressure. As these firms are related in skills to the principal industry, they will have problems recruiting the desired labour when companies in the principal industry pay premium wages. The skill-related firms will be confronted with upward pressure on wages due to severe local competition, lose their most competent workers to the principal industry, and replacements available locally will be rejected from this industry. Moreover, if they recruit from other regions, they risk losing them to the principal industry while the skill-related firm has incurred the search and reallocation costs (Combes and Duranton, 2006). In other words, firms do not only benefit from spillovers in a region, they may also suffer from it. Indeed, some studies find no positive relationships between firm performance and intra-regional labor mobility (Eriksson, 2011; Timmermans and Boschma, 2013). In a similar vein, the Resource Curse and the Dutch Disease literature 1 tells a story where the dominant resource-based industry has negative effects for other industries in the tradable sectors in the region or even in the country as a whole. These negative effects take the form of wage competition from the dominant industry, and incumbents in the dominant industry using their political power to influence tax- and investment policy in their favour (Venables, 2016). An influx of revenue to the government may lead to an expansion of the public sector, which in turn could put pressure on the tradable industries (Corden, 1984). These dynamics can lead to deindustrialization and an increasing reliance on resource extraction (Corden and Neary, 1982; Venables, 2016). Rather than a regional environment where there are many possibilities for knowledge spillovers between industries and opportunities for regional branching(Boschma et al., 2011; Frenken and Boschma, 2007), this could lead to regional de-branching (Fitjar and Timmermans, 2019). Furthermore, crowding out of tradable sectors in a region or country make business cycles subject to the shifts and volatility in the demand for the natural resource in question (Marchand and Weber, 2018). Fitjar and Timmermans (2019) explore parts of these relationships and show that skill-related industries tend to lose their more skilled and productive workers to the principal industry in the region that offers higher wages, and that skill-related firms indeed pay higher wages than unrelated firms. In short, this implies that relatedness offers positive effects for the principal industry that can recruit easily from a local pool of skill-related firms that leads to the erosion of skill-related firms in the region. In such a context, the benefits and costs of relatedness are unevenly distributed or tend to flow in one direction.
However, we argue that the effects of co-location of skill-related industries may differ between times of prosperity and times of crisis. We claim that the effects of relatedness will be negative for the performance of local skill-related firms when the principal industry is expanding. We expect this effect of relatedness to be different and positive for the performance of skill-related firms in the region when the principal industry is hit by a crisis. This will make redundant labour flow to local skill-related firms that are not subject to the same business cycle as the principal industry (and thus not directly affected by the crisis in that industry). This will give new impulses to local skill-related industries because wages will go down, and the new recruits will bring in new ideas. In other words, we expect that the distribution of benefits and costs of relatedness between the principal industry and skill-related firms in the region will be reversed during a crisis period, as compared to the boom period. This leads us to the following hypotheses:
Empirical setting: A highly petroleum-dependent region
We present a case study of the labour-market region containing the city of Stavanger over a period of persistently high oil price 2010–2013 and a period where prices fell substantially 2014–2016. We choose the period of 2010–2016 due to it containing a period of renewed optimism and growth in the Norwegian petroleum industry, that ended in a crisis after a substantial decline in oil prices.
Renewed optimism
The period of optimism came after a period of concerns regarding the depletion of the Norwegian continental shelf. The NCS reached peak oil in 2000 and peak petroleum in 2004 (NPD, 2019). The peak production period coincided with concerns about lack of access to new offshore areas to explore, high-cost levels (both in terms of cost per barrel produced and in terms of manufacturing) and low availability of skilled engineers (Steen and Weaver, 2017). This culminated in widespread pessimism in the petroleum industry in the years following the financial crisis in 2008 to early 2011 (Hansen and Steen, 2015). However, several large discoveries in mature producing areas of the Norwegian continental shelf, combined with the rise in global oil prices and the possibility of new areas to explore led to unprecedented investment levels and optimism in the period from 2011 to 2013 (Steen and Weaver, 2017).
A volatile, capital- and knowledge-intensive industry
The Norwegian Upstream petroleum industries utilize high levels of knowledge and capital to conduct identification, extraction and production of offshore petroleum resources offshore along the Norwegian continental shelf, and abroad (Thune et al., 2018). The oil and gas companies (such as Equinor, Shell and Exxon) coordinate and fund the steps leading up to eventual production, while sub-contracting most extraction-related activities to a diverse service sector. Together these firms form the Norwegian petroleum sector. In 2014 there were between 1500 and 2000 firms active in the petroleum sector, of which less than 100 were oil and gas companies owning stakes in producing fields (Blomgren et al., 2015). Most employees work in the related manufacturing and service industries, and the industry structure makes the service sector highly dependent on the investment decisions of the oil and gas companies. Labour depends on the volume of new projects under development, which is in turn dependent on the oil price and political decisions such as the provision of new licences. The oil and gas companies tend to invest and explore in newer and more risky areas in times of higher oil prices (Mohn and Misund, 2009), whereas they restructure, cut costs and postpone investments in new fields in periods with lower oil prices (Grant, 2003). These dynamics make the petroleum industry highly cyclical with potentially large fluctuations in demand for labour, especially for the service sector.
The shifts in labour demand in the petroleum sector also affect the labour market overall, as the petroleum sector competes for the same skills with other industries. A study by Sasson and Blomgren (2011) finds that while the petroleum industry had a relatively low proportion of higher educated labour in its beginnings, this is no longer the case. The industry has always attracted many engineers, but the share of engineers in the companies is declining as more labour has a background in business, economics, and other social sciences. As is shown in the study by Fitjar and Timmermans (2019), the petroleum industry pays substantially higher wages than other sectors. In a spatially constrained labour market with a high concentration of petroleum-related activity, such as the Stavanger region, some of this wage pressure is passed through to skill-related firms. It is likely that the possible negative effects of co-location with the petroleum industry sector affect a wider selection of skill-related firms when the petroleum sector draws from a larger skill pool, and not only engineers.
Stavanger – oil capital
Norway is highly dependent on revenues from the petroleum sector. Just before the crisis in the oil market, in 2013, the petroleum industry accounted for about 20% of GDP, 30% of investments, and 49% of exports. After the fall in the oil price, by 2016, this was down to about 12%, 21% and 35%, respectively (NPD, 2019). The consequences of these large fluctuations are likely to be the largest in the main agglomeration of the petroleum industry, Stavanger. Even though there are generous unemployment benefits in Norway, the incentive to find new jobs when you are laid off is substantial. The government only provide unemployment benefits of 60% of the salary the worker had when employed. The salary eligible for benefits is also capped and maximum unemployment benefits in 2014 were around 320.000 NOK per year, compared to an average salary of 520.000 NOK per year of all sectors. Most people employed in the petroleum sector would make far more than the national average, and thus have an even higher incentive to find a new job.
As shown in Figure 1, the oil price plateaued at close to USD 100 per barrel in the period 2010–2013 and the oil industry expanded its activities with a corresponding need for labour. This happened in a context of already low unemployment, in both Norway and the Stavanger region. Rogaland County, which contains the Stavanger region, had a very low unemployment rate, falling from 2.4% in 2010 to 1.9% in 2013, while the national average decreased from 2.9% to 2.6%. With the fall in the oil price from 2014 to 2016, investments in the oil sector fell, and the unemployment rate in Rogaland increased from 2.2% in 2014 to 4.5% in 2016. The national average increased only slightly from 2.8% to 3.0%.
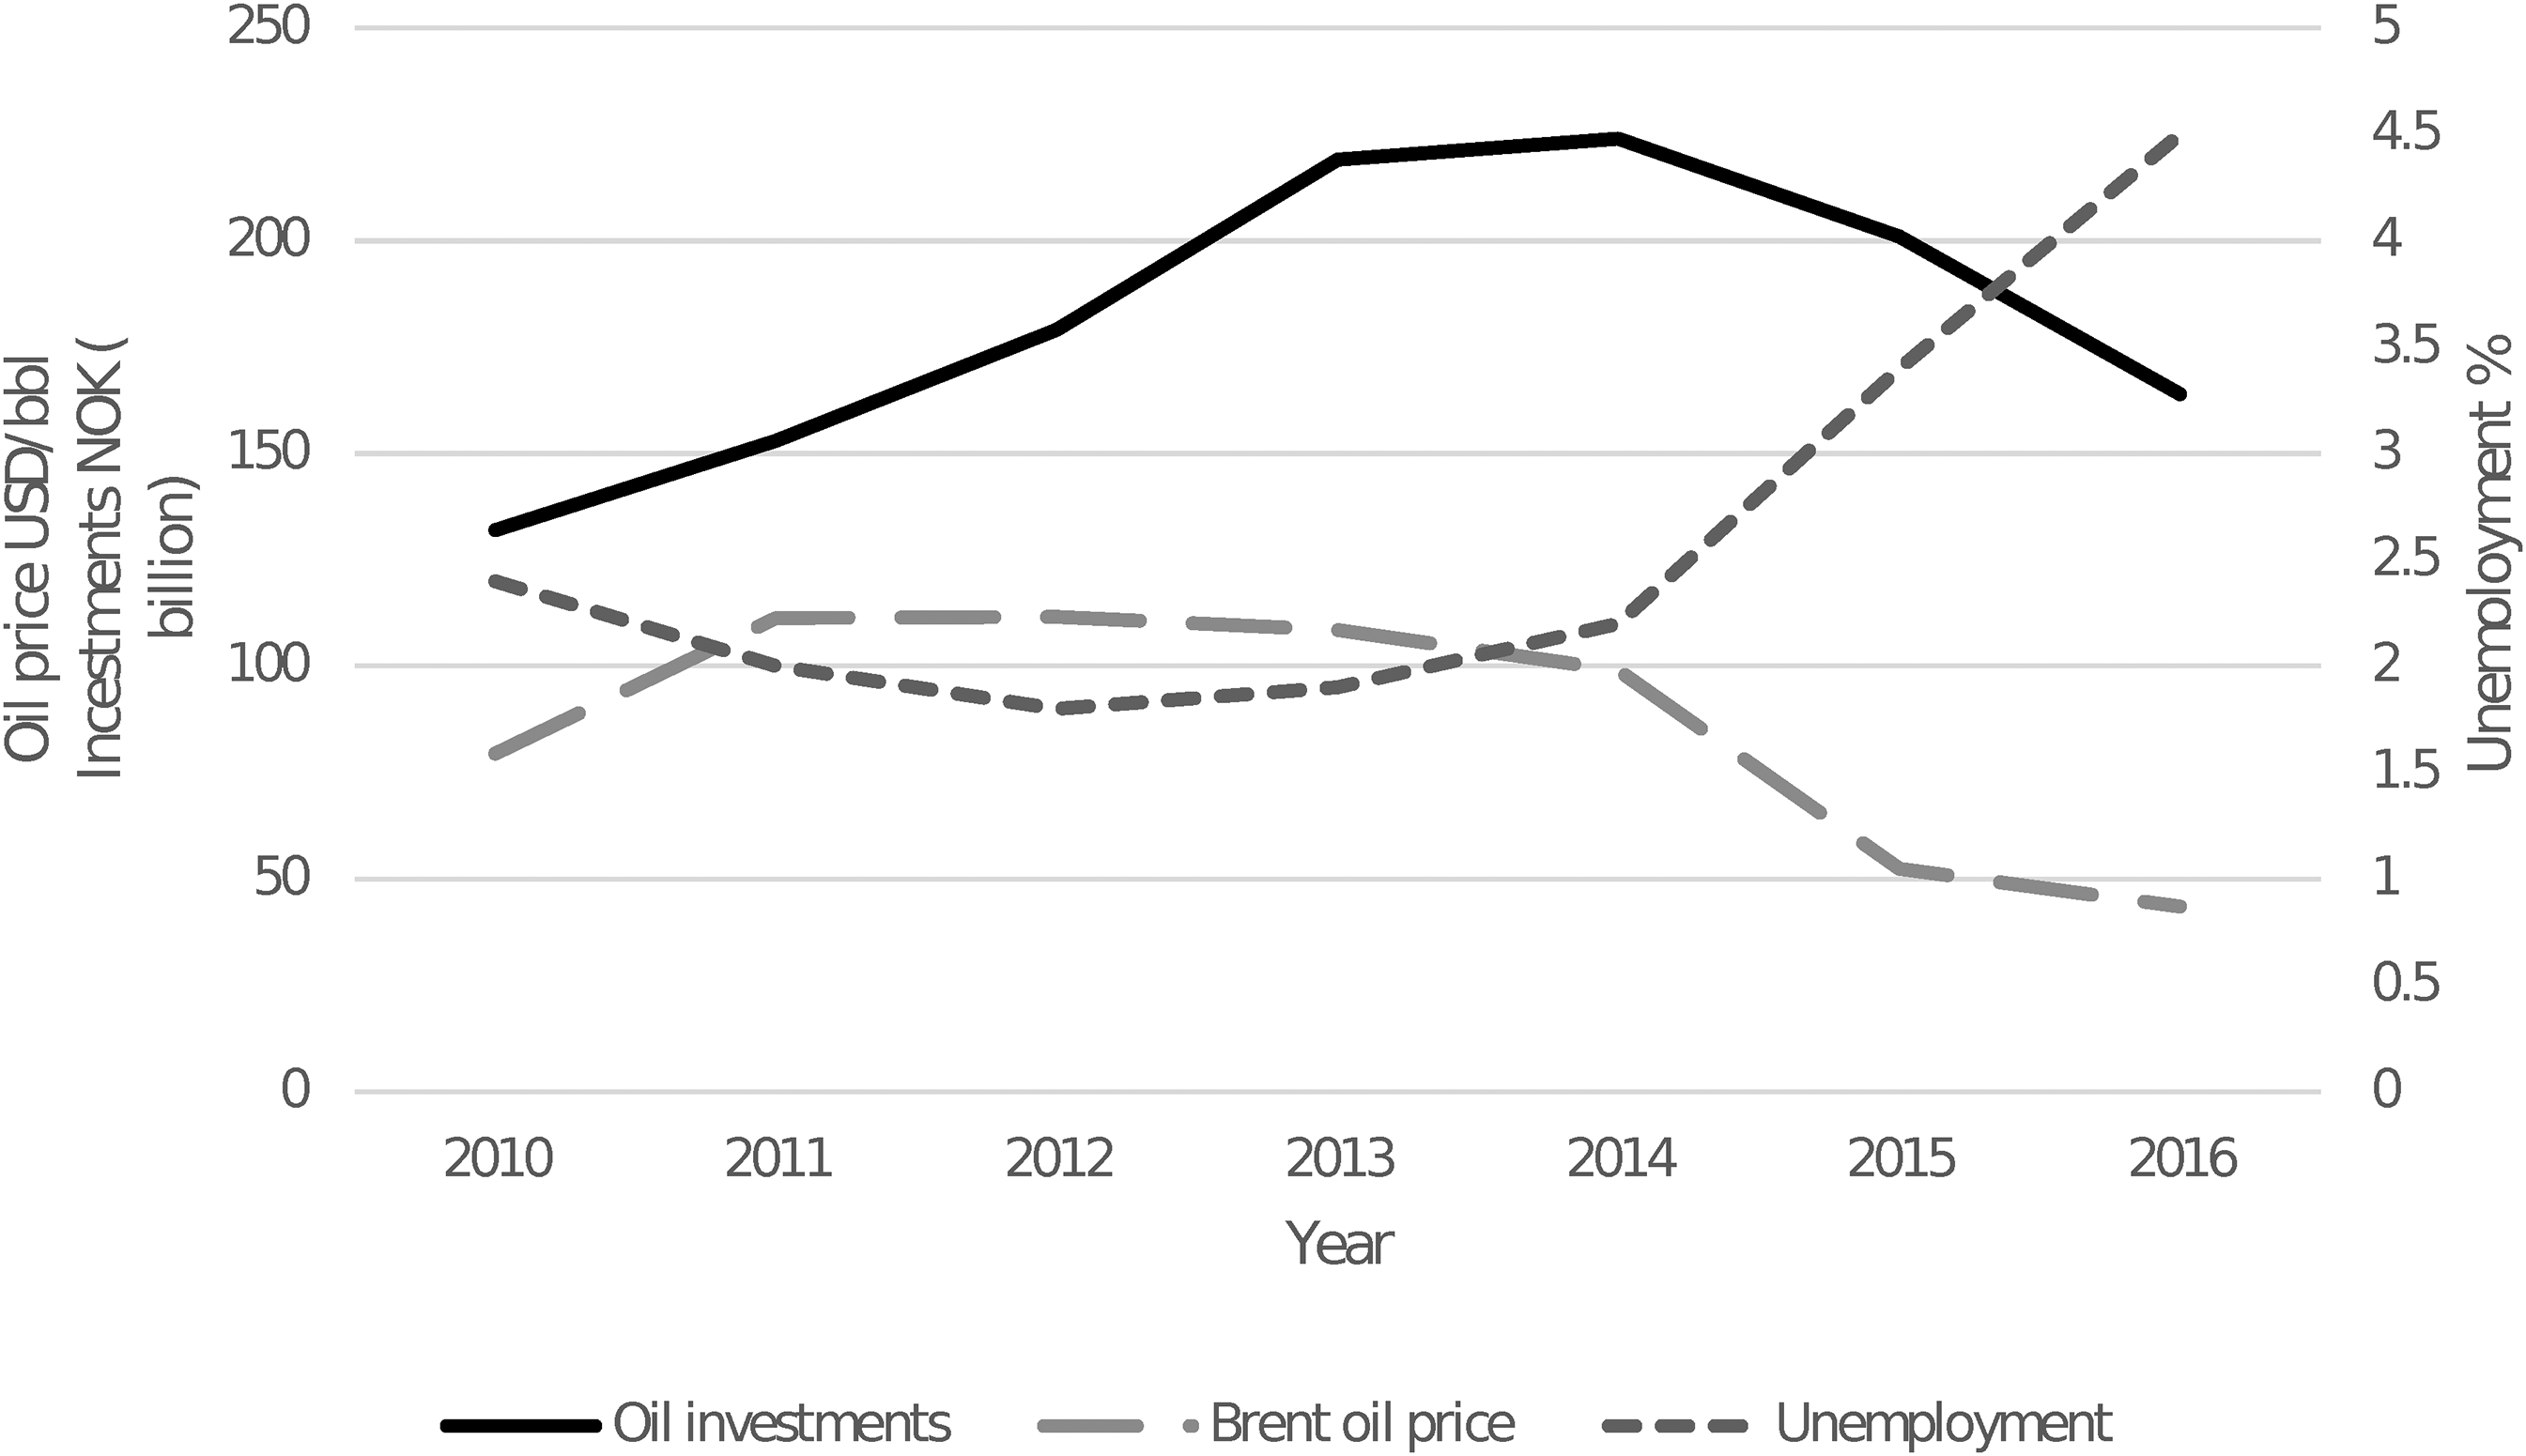
Development of oil price, unemployment in Rogaland county, and national oil extraction related investments in 2010–2016.
Empirical study – data, variables and model
Data
We use a linked employer-employee dataset covering all private-sector employees in the Stavanger region for the period 2010–2016. The data contains detailed longitudinal information on employment in the private sector covering individual worker characteristics such as age, sex, education, hours worked, which firm they work for and, in the case of multi-plant firms, the plant they work at. 2 The reference month for these characteristics is November each year. We use the plant information to sum the total number of full-time employees, with valid data to each plant to determine the growth of the plant. The analysis is restricted to workers between the age of 18 and 65 years that have worked more than 30 h per week. In cases where data on hours worked are missing, we also included workers who earn more than four times the basic amount of the Norwegian Social Insurance Scheme. 3 The basic amount was about USD 12,500 in 2010 or NOK 75,600. For reference, the average annual earnings for employees in manufacturing were about USD 71,800 or NOK 434,000 in 2010.
The individual database is merged with a dataset of relevant business statistics, which provides additional data on finances, investments, sales, and industry codes that form the basis for the control variables used in this study. We use all four size classes in the EU's classification of firms, including micro firms with less than 10 employees. However, plants classified as sole proprietorships or with an average of one employee are excluded because many such plants do not have the ambition to grow in terms of a number of employees or serve as holding companies. 4
From industries to sectors
When identifying and distinguishing between the plants whose core activities are in petroleum and those who are skill-related to these plants, we follow the approach used in Fitjar and Timmermans (2019) adapting it to NACE rev. 2. effective from 2008. First, we identify the petroleum industry, which includes the industries directly involved in the extraction of crude oil (NACE 06.10) and extraction of natural gas (NACE 06.20). Immediate suppliers, as defined by Statistics Norway (Ekeland, 2017) and Blomgren et al. (2013), are added to the petroleum sector. The suppliers are drilling services for the extraction of crude oil and natural gas (NACE 09.101), other services connected to for extraction of crude oil and natural gas (NACE 09.109), services related to operating pipelines (NACE 52.215), transport in pipelines (49.500), building of oil platforms and modules (NACE 30.113), installation and refurbishment on oilrigs and modules (30.116) and supply bases (52.223). We merge the oil and gas companies and the service industries into a broader petroleum industry.
To identify the industries that are skill-related to the petroleum industry, both operators and service, we use a skill-relatedness matrix based on worker migration between NACE industries at the four-digit level in Norway in the period 2008–2011, made available from Fitjar and Timmermans (2017) who in turn follow the skill-relatedness measure introduced by Neffke and Henning (2013). 5 We depart from the approach in Fitjar and Timmermans (2019) by controlling for the presence of a high share of petroleum revenue even in the tradable 6 industries that are not classified as petroleum industries due to legacy reasons in the NACE industry classifications. Using a dataset compiled and maintained by the research institute NORCE, we can identify all industries in Norway where more than 50% of employees in the industry work in petroleum-related activities, we interpret this as the plant having a supply link to the petroleum industry. We use non-tradable plants as a control group.
In total, we end up with five possible tradable sectors and one non-tradable sector. The tradable sectors consist of 1 – plants in the petroleum industry; 2 – plants in industries skill-related to petroleum with more than 50% of employees in petroleum-related activities; 3 – plants in industries skill-related to petroleum with less than 50% of employees in petroleum-related activities; 4 – plants in industries not skill-related to petroleum with more than 50% of employees in petroleum-related activities; and 5 – plants in industries not skill-related to petroleum with less than 50% of employees in petroleum-related activities. Unfortunately, we do not have access to the data on the full suite of control variables we wish to use for the petroleum sector, and we omit this sector from the analysis. We also exclude plants in the fourth category, plants in industries not skill-related to petroleum with more than 50% of employees in petroleum-related activities, due to very few observations.
Variables
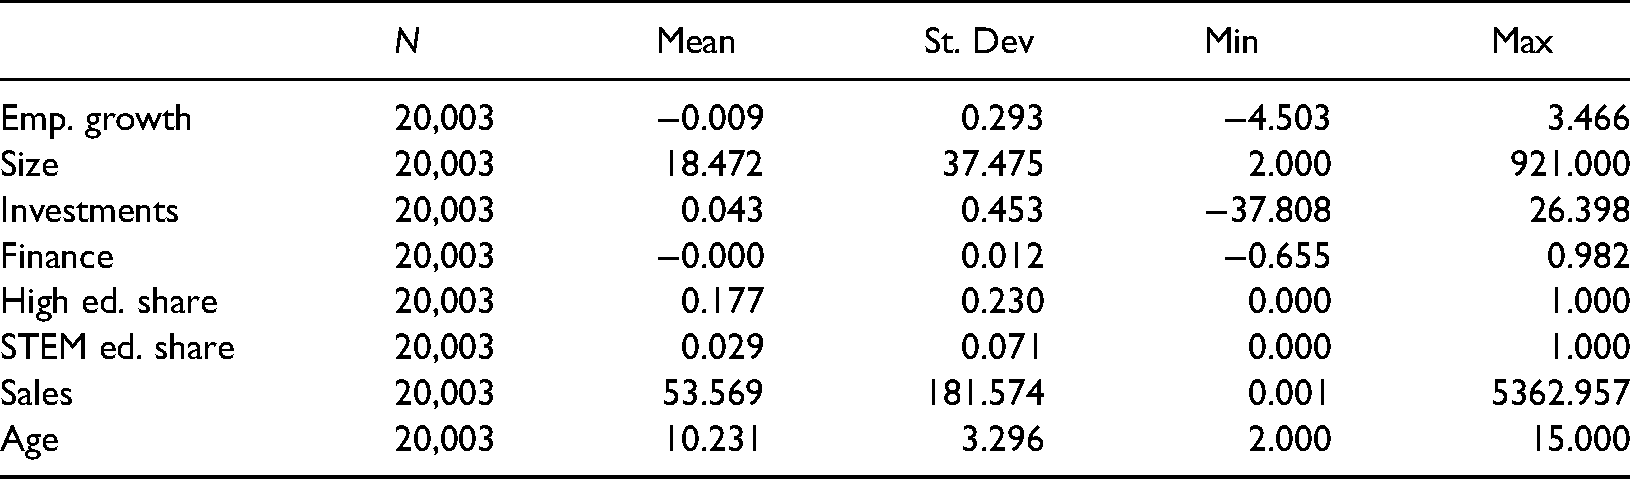
The dependent variable is the performance of plant i observed in year t measured as year-on-year employment growth in percentage terms, calculated as

Summary statistics of full plant sample.*
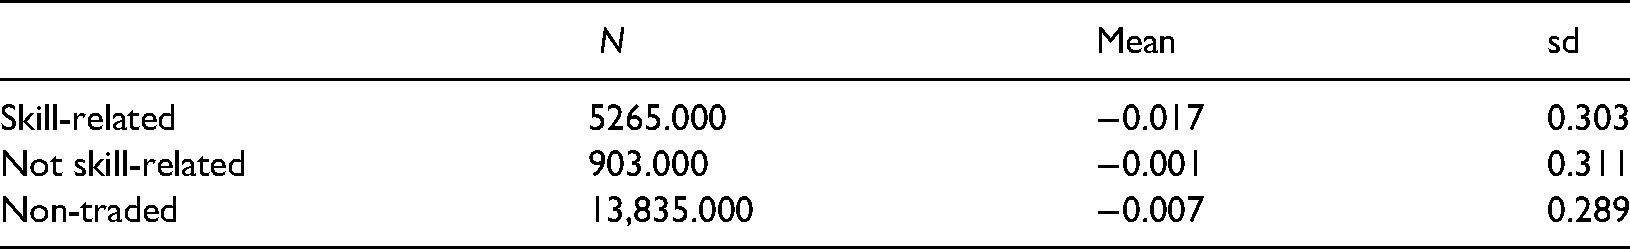
Summary statistics of annual employment growth by sector.
Model
To test our hypotheses on the relationship between growth rates, skill-relatedness and supply linkages to the petroleum industry, we use two different econometric models that relate employment growth to the predictor variables. The first model is a pooled ordinary least squares (OLS) model that does this in the following way:
The second model utilizes the panel structure of the data to account for unobserved heterogeneity across plants, such as managerial abilities, skills of the employees and production processes as follows:
Relationships between plant employment, skill-relatedness, petroleum dependence and plant characteristics.
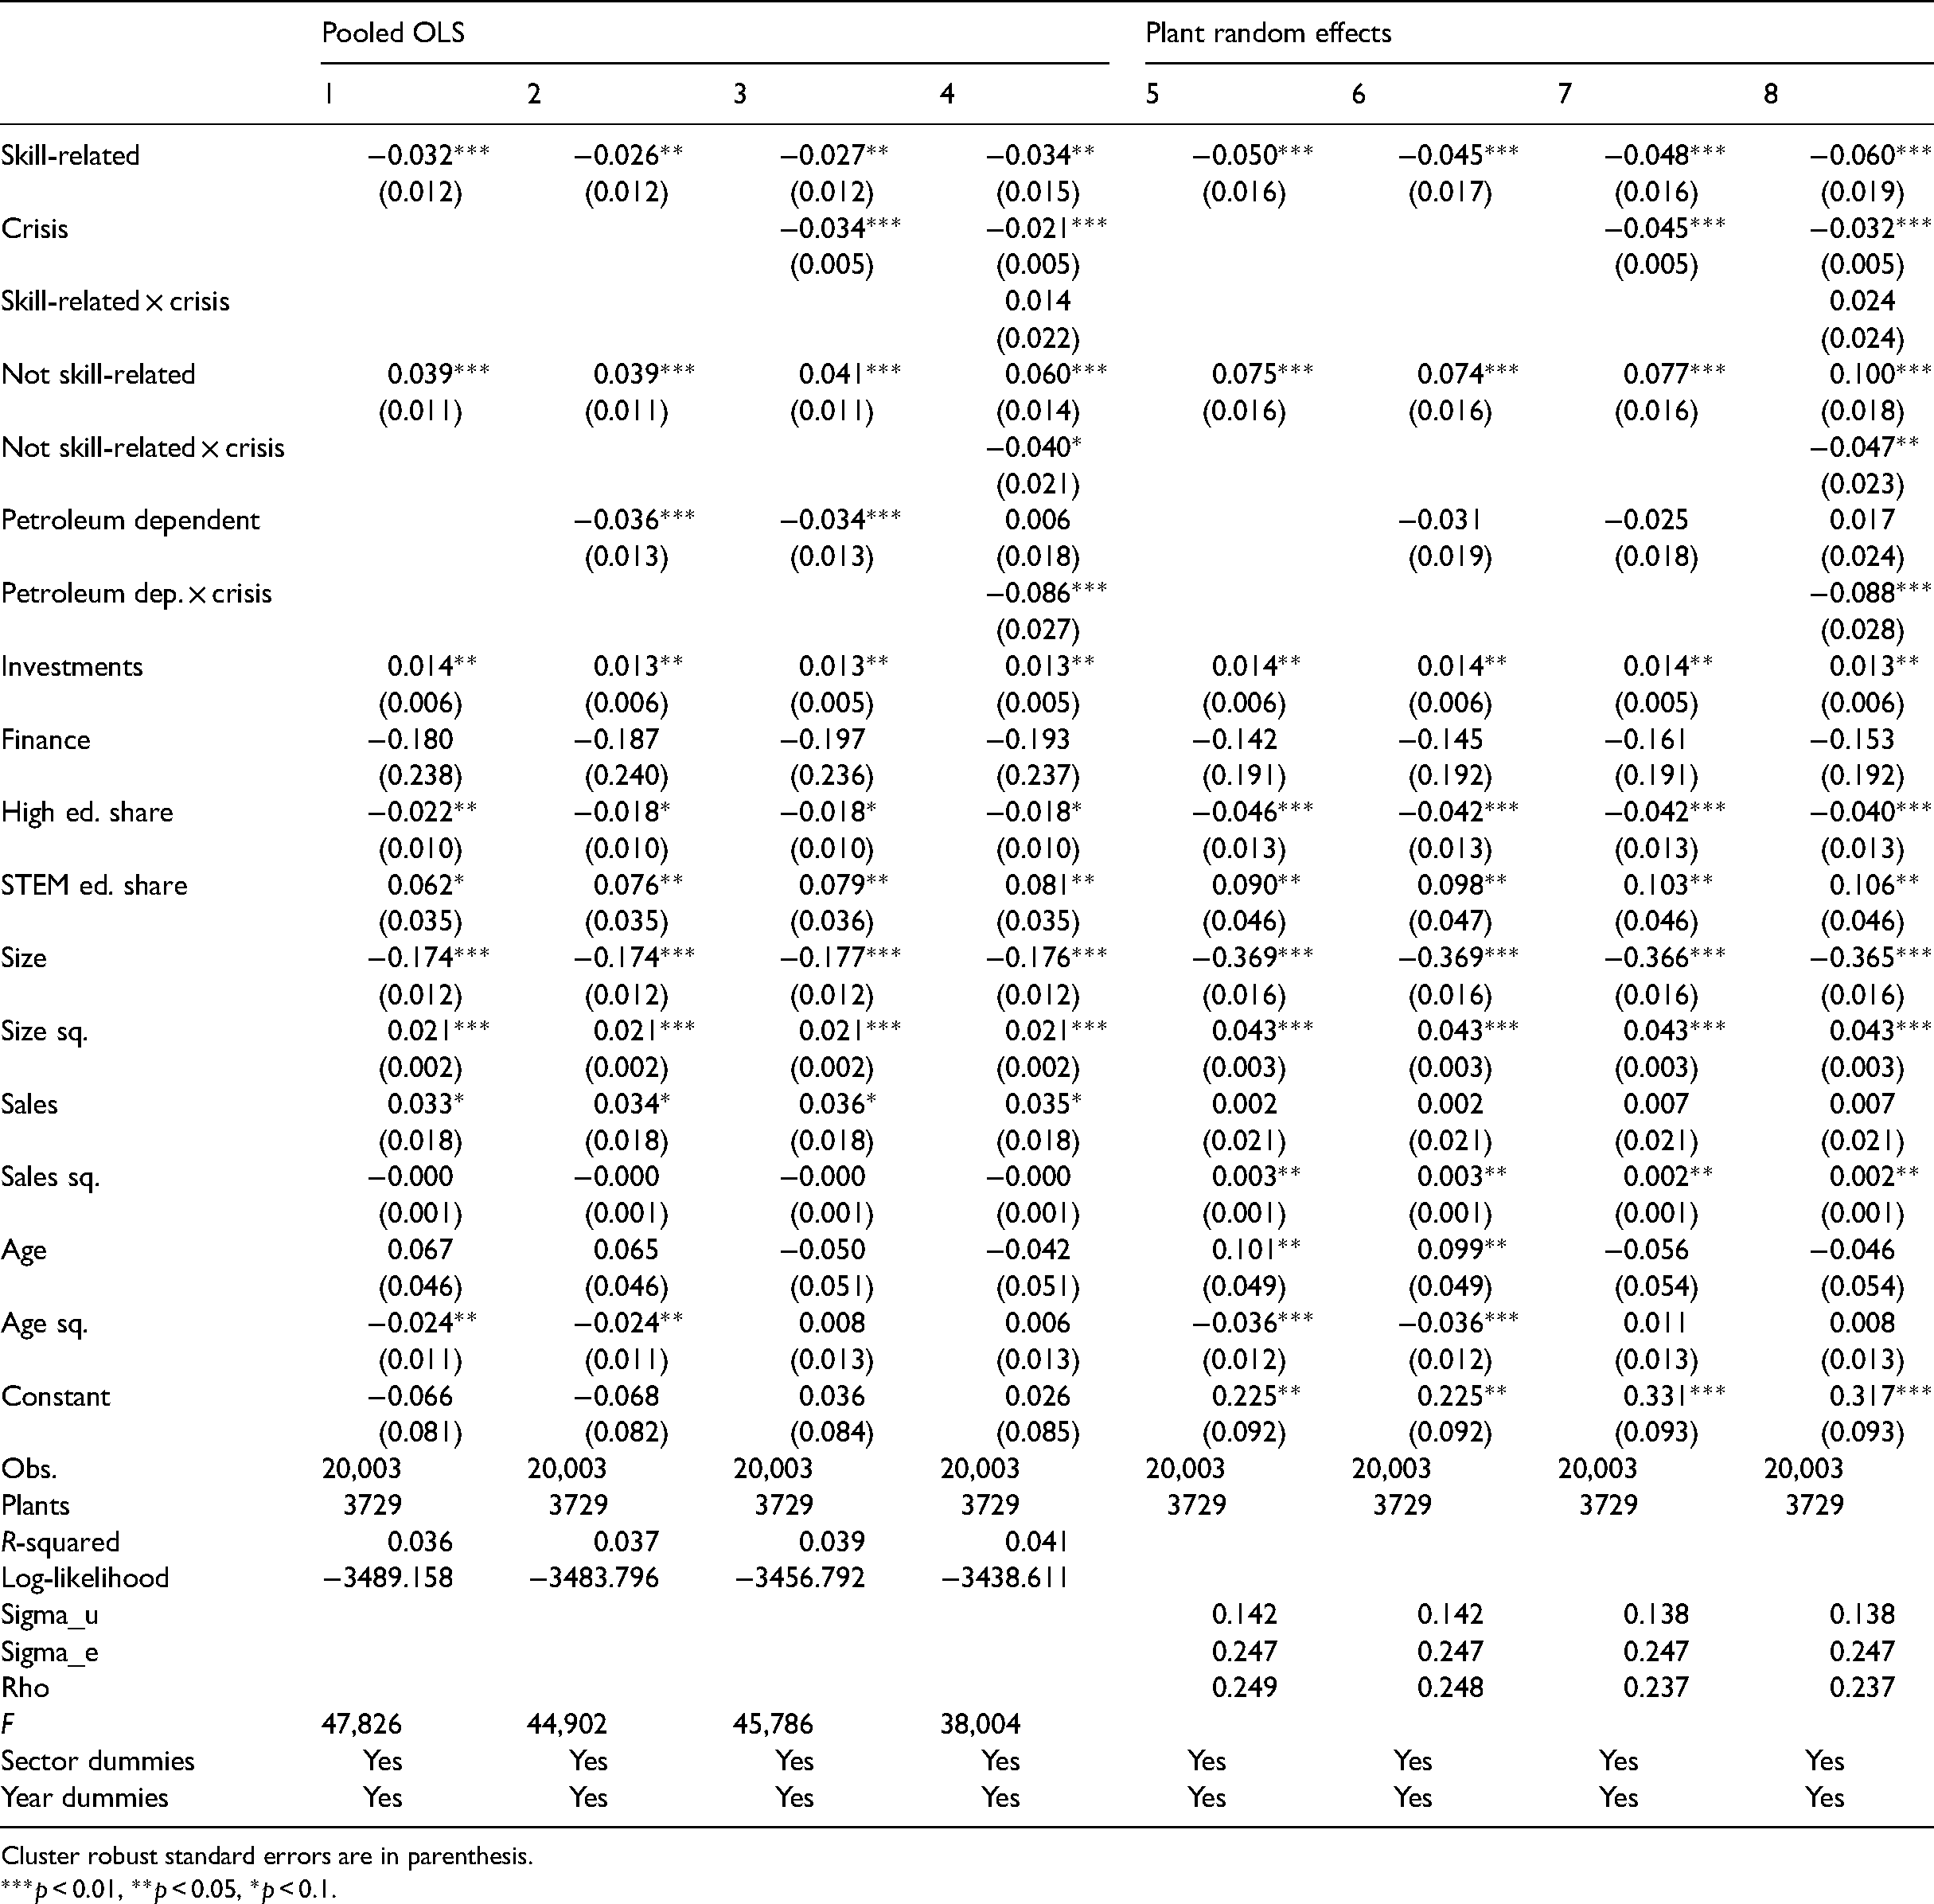
Cluster robust standard errors are in parenthesis.
***p < 0.01, **p < 0.05, *p < 0.1.
Main findings
This section presents the econometric estimates from the employment growth model presented in section ‘Variables’. Two sets of models are tested, one OLS model and one random-effects model that accounts for unobserved effects at the firm level. Recall that the hypothesis stated that the skill-related plants would perform worse than non-skill-related plants in the prosperous period, whereas they perform better during the crisis. The results support the hypothesis as they relate to the pre-crisis period but go against the hypothesized relationships for the crisis period. It seems that plants that are skill related to the petroleum industry grow slower than plants in the nontraded sector and in the non-skill related traded sector in both the prosperous and the crisis periods, although the picture is more mixed in the crisis period. The findings for the first period are in line with the story suggested by the literature cited on negative externalities in the labour market (Combes and Duranton, 2006), and that these are made stronger due to the presence of resource rents (Venables, 2016). The findings for the crisis periods only give some indication that the presence of skill-related plants helps make the region more resilient as postulated by the skill-relatedness literature (Diodato and Weterings, 2015; Holm et al., 2017; Holm and Østergaard, 2015).
Models 1–4 refer to regressions on employment growth using the pooled OLS estimator. Model 1 shows a highly significant and negative relationship between being skill-related to the petroleum industry and employment growth. The coefficient on the dummy indicating that a plant is skill-related corresponds to a decrease in employment growth of 3.2% relative to the non-tradable sector, whereas the coefficient on the not skill-related dummy is associated with an increase in growth of 3.9% relative to the reference group. Model 2 and 3 introduce dummy variables representing the supply linkage to the petroleum industry and the shock to the local economy of the oil crisis years of 2014–2016. Introducing these additional dummies only slightly mitigates the finding from model 1, although there are signs that the slower growth of the skill-related plants is driven by those that have a supply link to the petroleum industry. This result is somewhat surprising as we expected to find that those plants would be able to capture some of the resource rent associated with petroleum extraction. An explanation for this relationship could be that the extraction companies started cost savings programs before the start of the crisis that they in large part turned over to the immediate service industry, who in turn may have put pressure on plants further out in the supply chain. Introducing the crisis dummy in model 3 underscores the higher performance of the non-skill related plants relative to both the skill-related plants and the plants in the non-tradable sector.
Model 4 introduces interactions between crisis dummy and the skill-related, non-skill related and petroleum-dependent dummies. Interestingly the interaction terms seem to lend some support to the second part of the hypothesis, that the plants that are skill-related to the petroleum industry, but do not have a supply link to the oil industry better their relative performance in the crisis to the point of being not statistically different from the non-tradable industries. The non-skill related seem to be hit hard by the overall contraction in the local economy, whereas the hardest hit of the sectors is those plants that depend directly on the petroleum industry.
Models 5–8 include random effects at the plant level. Likelihood ratio tests support the heterogeneity of the intercept
Together these two model specifications indicate that there are negative aspects of co-locating with the petroleum industry in terms of competition for labour and cost of operation that are only somewhat mitigated by the crisis that hit the petroleum industry. There seem to be some knock-on effects of the crisis that hit all sectors associated with a general loss of income and spending in the region. There are however signs that those plants that share the knowledge base with the petroleum industry, and at the same time do not have direct supply linkages to the petroleum industry improve their relative performance in employment growth terms in the crisis period.
Although the period studied is short, this could indicate that the Stavanger region over time has had a tendency to diversify in activities related to petroleum extraction, which may in turn have led to regional lock-in (Coniglio et al., 2018). This may indicate that there will be adverse effects on long-term regional development in the region. The danger is that as Roessler et al. (2019) describe from the Rustbelt in the US that the region finds itself in a ‘low complexity trap’ due to diversifying in new technologies closely related to their old techno-industrial core, that will cause the region to fall behind economically. But further analysis with longer datasets is needed to explore this further.
Conclusions
The paper has addressed a key topic in the relatedness literature which has a tendency to focus on the positive sides of relatedness for firm performance in regions but has devoted little attention to possible downsides of relatedness (Boschma, 2017; Fitjar and Timmermans, 2019). Moreover, it takes up the important question in the regional resilience literature (Boschma, 2015; Diodato and Weterings, 2015; Holm and Østergaard, 2015) whether this relatedness effect is different between a crisis and a boom period. To shed light on these issues, this paper studies the growth performance of plants in a region with a dominant sector, and how skill relatedness of plants to the dominant sector affect their employment growth during the bust and boom periods. We investigate the specific case of the Stavanger region, a region that is dominated by oil and gas activity and examined whether skill-relatedness has a positive effect on plant performance in the principal industry (petroleum), skill-related industries to petroleum, and non-skill-related industries to petroleum, and whether that effect may differ between a period of prosperity and a period of crisis.
First, we found important relationships of skill-relatedness in both the prosperous and crisis period. That is, skill-related plants do not perform better than non-skill-related plants in the prosperous period, even when controlling for supply linkages to the petroleum industry. The results indicate that being part of the petroleum industry supply chain does not benefit local skill-related firms when the petroleum business is expanding. Rather skill-related firms seem to experience negative consequences, possibly because of substantial competition for talent and resulting wage pressure from the dominant petroleum industry. Skill-related plants even performed worse than non-skill-related plants and plants in the non-tradable sector in the Stavanger region during the oil boom.
Second, this differential effect between the various types of plants is mitigated somewhat in the crisis period. Plants skill-related to the petroleum industry increased their relative performance during the crisis to some extent though they did not outperform the non-skill-related firms during the crisis. And skill-related plants without supply linkages to the petroleum industry improved their performance relative to the skill-related firms with a supply linkage to petroleum firms during the oil crisis, as compared to the prosperous period. Although this might be interpreted as evidence of a positive spillover effect from the petroleum industry to skill-related industries, this effect turned out to be weak, as skill-related industries did not perform better than non-tradable plants during the oil crisis.
These findings may lead to several research challenges. First, it remains an open question why skill-related firms do not seem to benefit fully from spillovers from the declining oil industry during the bust period. This key question should be taken up in future research. Second, future research should address whether these findings are unique to the Stavanger region, and to what extent they might be generalizable to other cases, like other regions dominated by a principal industry, or regions that have a more diversified industrial structure that are confronted with a general (that is, non-sector specific) crisis. In other words, there is not only a need to replicate this study in other regions where a dominant industry is present, we also have to examine whether these findings concerning co-location of skill-related industries hold in regions with no dominant industry.
Footnotes
Declaration of conflicting interests
The authors declared no potential conflicts of interest with respect to the research, authorship, and/or publication of this article.
Funding
John-Erik Rørheim's PhD project was funded by University of Stavanger project no 10543 “Knowledge base for sustainable transition and growth in the Stavanger region and Forus business park”, funded by Forus Næringspark, County of Rogaland, Sparebanken Vest, Base Gruppen.
Notes
Appendix
Correlations.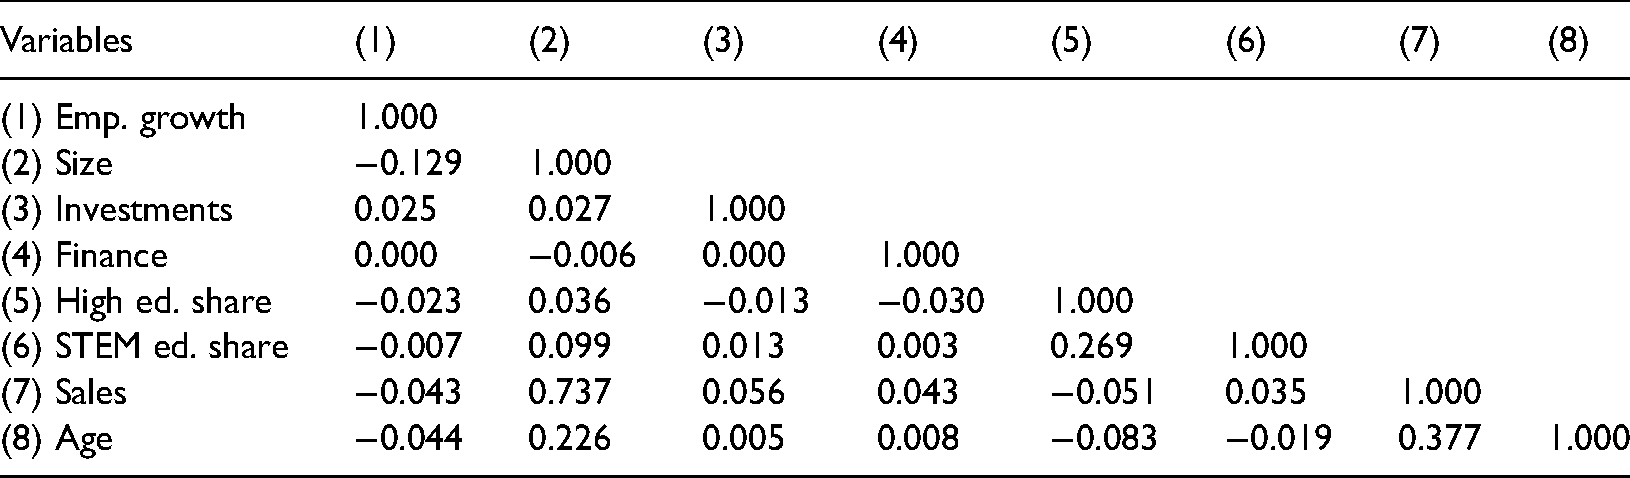
Variables
(1)
(2)
(3)
(4)
(5)
(6)
(7)
(8)
(1) Emp. growth
1.000
(2) Size
−0.129
1.000
(3) Investments
0.025
0.027
1.000
(4) Finance
0.000
−0.006
0.000
1.000
(5) High ed. share
−0.023
0.036
−0.013
−0.030
1.000
(6) STEM ed. share
−0.007
0.099
0.013
0.003
0.269
1.000
(7) Sales
−0.043
0.737
0.056
0.043
−0.051
0.035
1.000
(8) Age
−0.044
0.226
0.005
0.008
−0.083
−0.019
0.377
1.000