
Abstract
One of the driving rationales behind plans for major transport investment between Northern UK cities is that of connecting labour pools. Integrated labour pools, the argument goes, will give rise to agglomeration economies and subsequent growth. Behind this logic lies the idea that access to complementary skills in neighbouring cities will yield benefits for firms. Yet, at what travel time radius is access to these skills beneficial? Can a better understanding of this inform our assessment of the likely economic impact of proposed transport investments and subsequent reductions in travel times? Here we develop a method to estimate this radius based on the relationship between industry employment growth in a city and the size of employment in ‘skill-related’ sectors. Assuming car or rail travel, we find that for Northern cities the radius is around 45 min while for the South it is around 110 min. Manufacturing peaks around 45 min for the whole UK, including both North and South. Services, however, peak around 110 min in the South but 70 min in the North. A comparison between the UK’s Integrated Rail Plan and earlier proposals to invest in High Speed 2 rail and Northern rail connections uncovers lost opportunities for employment growth in Manchester, Leeds and Sheffield. This study provides a road-map for the deployment of methods from Evolutionary Economic Geography, originally developed to predict regional and urban growth and diversification processes as a function of the local skill mix, to evaluate the potential gains from transport infrastructure schemes.
Introduction
Here we seek to understand the role of industries and skill availability in the formation of agglomeration economies. Specifically, at what distance do firms interact and benefit from each other’s presence? This is a key question, as many transport investment efforts aim to decrease travel times – but little is known about what the target time should be (Börjesson et al., 2019).
This question is particularly timely and important in the context of efforts to better connect up cities in the North of England. With economic activity and prosperity concentrated in London and the South East, there has long been political and demographic pressure to boost the North. A series of commitments have been made, under both HS2 and Northern Powerhouse Rail plans, and more recently the Integrated Rail Plan, to better connect Northern cities, with large resources focused on rail construction and upgrades between cities. The key idea is to create a large integrated agglomeration of industries and skills, which is expected to significantly boost the local economy and expand the economic engine of the UK beyond London. But many questions about the economic benefits of such plans remain, including at what travel-time radius are the benefits of connecting cities most likely to accrue? In other words, how fast do the new rail connections need to be?
We develop a model based on one proposed by O’Clery et al. (2019) that estimates the effect of labour pooling on employment growth in cities for varying city size. Specifically, we adapt a model for industry employment growth based on the number of workers present in ‘skill-related’ industries in a city proposed by Neffke and Henning (2013). Instead of using an established definition of cities, such as the Organisation for Economic Co-operation and Development (OECD) Functional Urban Areas (FUAs), we aggregate neighbourhoods (urban Middle layer Super Output Areas or MSOAs, see the ‘Geographical data and definitions’ section) into cities based on travel times (the minimum of car and rail travel time) between them. We do this for several reasons. Firstly, it allows us to be agnostic about whether the agglomeration falls within traditional or administrative city boundaries. Secondly, by varying the travel-time threshold used to define a city, we can effectively vary its geographical size or scope. This is important because we can then estimate the travel-time radius at which industrial agglomeration is most strongly associated with employment creation. We use this to estimate or predict the effect of policies (on employment creation) such as rail investments which modify the MSOAs (and thereby their industries) accessible to a place within a particular time.
Specifically, by looking at the strength of the econometric relationship between employment growth and related employment for each city definition, our model is able to tell us at what travel-time radius or city definition labour pooling has the strongest effect on employment growth, and how this varies by sector and region. In this way, our model captures the effect of travel time between businesses and industries (and not home-to-work commuting times) on urban employment creation. We find that there is significant disparity between the optimal skill radius in the North and the South. In the former case, the radius is around 45 min, which corresponds to that of manufacturing sectors across the UK. In contrast, for the South, the radius is around 110 min, which is identical to services sectors in the South (services sectors have an optimal skill radius of 70 min in the North).
We use our model calibrated on Northern cities to investigate the impact of planned transport interventions. We focus on planned improvements between Sheffield, Manchester and Leeds under both the original HS2/Northern Powerhouse Rail plans, and the later Integrated Rail plans. Our model suggests that increased access to new skills in Manchester and Leeds (under original NPR-HS2 plans) would have been expected to add up to 3000 jobs/year in Sheffield, while Integrated Rail Plans (IRPs) to better link Manchester and Leeds should yield over 2000 new jobs per year for Manchester and 1800 new jobs per year for Leeds.
Literature
Cities and skills
Cities are universally recognised as engines of economic growth and prosperity, but what drives their success? Most economic theories of the city point towards density and diversity, of people, skills, firms, infrastructure, amenities and ideas. A large literature studies the relationship between city size and a vast number of variables including wages, innovation and jobs (Bettencourt et al., 2007). The larger the city, this literature argues, the more likely it is to produce proportionally higher amounts of these variables.
At a more dis-aggregate scale, a wealth of studies focus on the economic forces that lead to agglomeration economies (Melo et al., 2009; Rosenthal and Strange, 2004; Combes et al., 2010), defined as the productivity gains that occur when many firms and workers concentrate their activities in space. Many of these studies emphasise the role of diversity of workers and firms (Jacobs, 1969; Beaudry and Schiffauerova, 2009), and particularly the quantity and quality of job matching between firms and workers (Duranton and Puga, 2004). More generally, the literature suggests that firms and industries in related sectors pool workers to lower costs (Marshall, 1920), and that bigger cities benefit from lower job-search friction costs (Mortensen and Pissarides, 1999; Petrongolo and Pissarides, 2001; Moretti, 2010; Picard and Wildasin, 2011; Glaeser, 2011). Beyond matching between workers and firms, the diversity of skills and the interaction between workers with different skills are well-established drivers of agglomeration economies (Glaeser, 1999; Puga, 2010; Glaeser and Resseger, 2010) and industrial diversification (Harrison et al., 1996; Combes, 2000; Beaudry and Schiffauerova, 2009).
A key economic rationale behind improving transport connectivity within and between urban areas is that missing skills and capabilities hold back local industries, constraining growth and industrial diversification. Alongside traditional arguments around agglomeration economies introduced above, much of this thinking emerges from evolutionary economic geography which emphasises the role of embedded capabilities and know-how in the local work–force – that are tacit and tricky to transport (Hausmann, 2016) – in the growth dynamics of a place (Nelson and Winter, 1982; Boschma, 2009). It is these embedded skills that constrain the development paths such that cities and regions tend to diversify into ‘related’ industries and technologies, that is, those that share similar inputs and capabilities (see review by Hidalgo et al. (2018)). A large empirical literature has shown that path dependence is a feature of regional and urban industrial diversification and growth dynamics across a wide range of contexts and geographies (Hidalgo et al., 2007; Frenken et al., 2007; Neffke et al., 2011). Our model is based on an established framework within this literature that relates industry employment growth in a city to the amount of employment already present in related industries. While a large variety of empirical metrics have been proposed to proxy for inter-industry relatedness (Hidalgo et al., 2007; Frenken et al., 2007; Neffke et al., 2011), we will use inter-industry job switches to measure industry ‘skill relatedness’ (Neffke and Henning, 2013). Similar approaches have previously been used to explain employment growth and industry diversification in a range of contexts (Neffke et al., 2011; O’Clery et al., 2016, 2019; Landman et al., 2020).
Since a key tenet of this literature is the ability of firms to source relevant skills in related sectors, it follows that travel time between firms and industries within a large city or metropolitan area is a necessary condition for employment growth: firms are limited to accessing skills that can reach each other within a ‘reasonable time’ (Bertaud, 2004). Hence, while the vast majority of studies in this literature adopt fixed official administrative city or region boundaries, by reducing travel times between cities, transport interventions may be able boost diversification potential and employment growth by bringing new and related industries from neighbouring areas into the ‘basket’ of skills accessible to local employers. The phenomenon of cities generating more economic output than expected given their size due to connections to other neighbouring urban centres has been referred to as ‘borrowing size’ (Meijers et al., 2016).
The Northern Powerhouse
Infrastructure has been singled out as a key priority in successive attempts by the UK Government to re-balance growth and build economic prosperity in Northern cities such as Greater Manchester, Leeds and Sheffield which lag behind London and the Southeast in terms of jobs, incomes and productivity (Rodrigues and Breach, 2021). Infrastructure investment formed a key part of George Osborne’s vision for a ‘Northern Powerhouse’, with a legacy of this being plans for a Northern Powerhouse Rail Network, initiated in 2015 and championed by Transport for the North, a sub-national transport body. The hope was that by connecting together the populations and businesses of Northern cities, it would be possible to create a large agglomeration to rival that of Greater London – growing the region’s accessible ‘economic mass’ and creating what has been more recently termed a ‘polycentric powerhouse’ (Mott MacDonald, 2022).
The Government originally had ambitious plans (denoted NPR-HS2 below) to both invest in the Northern Powerhouse Rail network and link this to two high speed lines down to London as part of the High Speed 2 (HS2) network (Transport for the North, 2019). Anticipated travel-time improvements for Leeds, Manchester and Sheffield are shown in Figure 1. These plans were then revisited, as part of the Government’s IRP (UK Department of Transport, 2021; House of Commons Transport Committee, 2022) with a decision to abandon the Eastern leg of the HS2 network connecting Sheffield and Leeds, and a proposed new line between Manchester and Leeds via Bradford. While there are still plans to upgrade the Hope Valley Line between Sheffield and Manchester this no longer figures in the Core Pipeline of the IRP, and there is no longer a commitment to reduce travel times to 40 min. 1
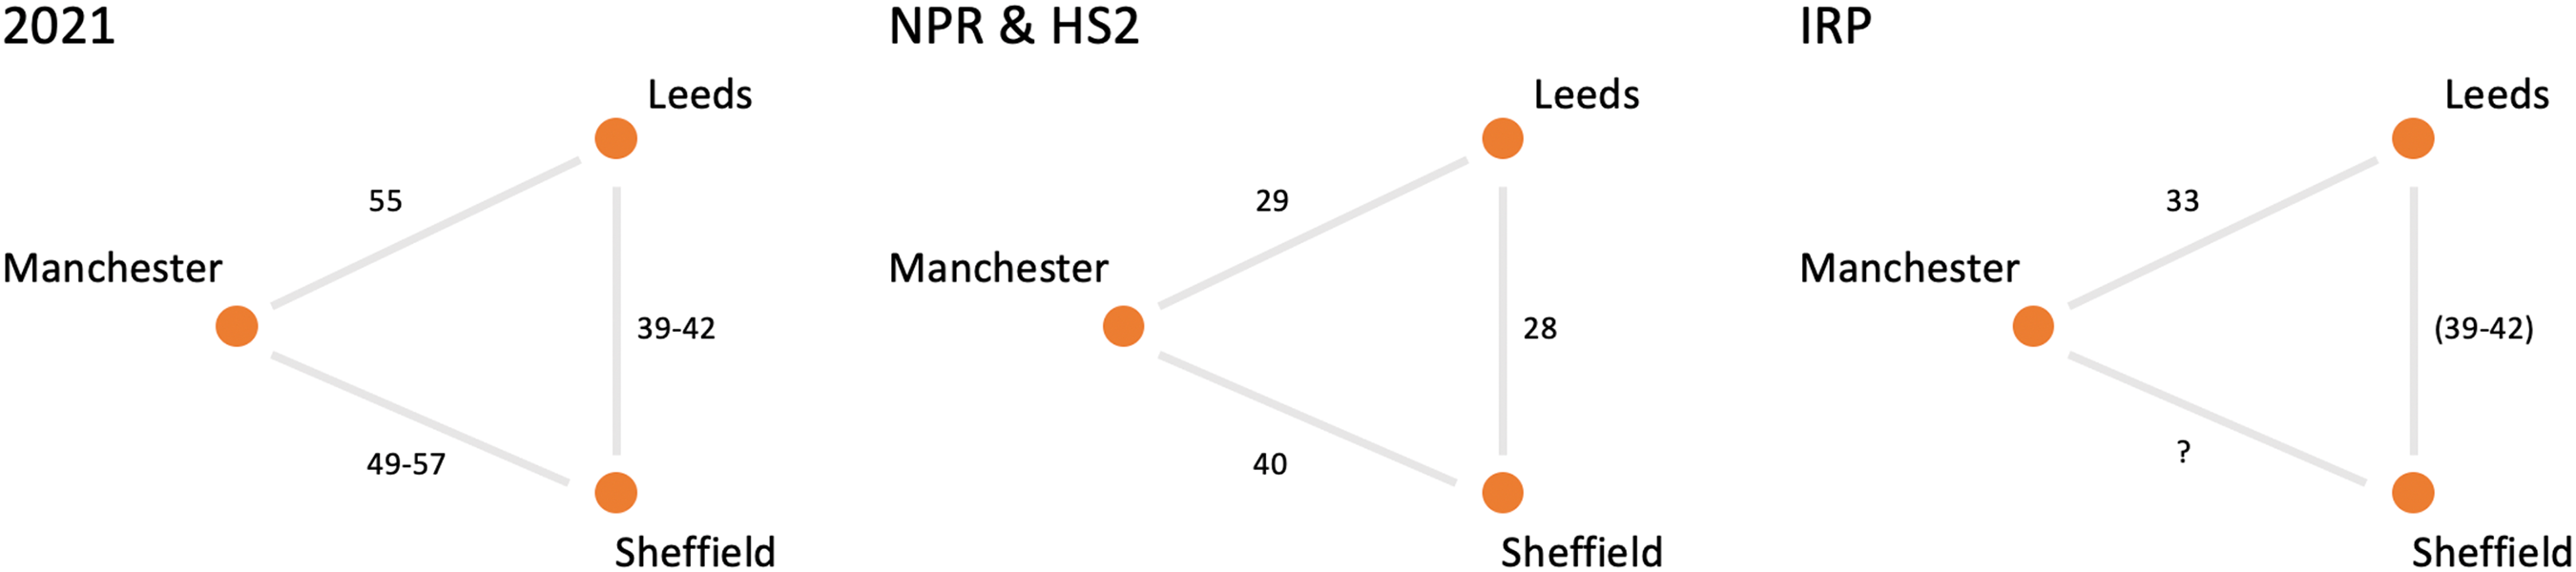
(A) 2021 baseline travel times. (B) Northern Powerhouse Rail and HS2 plans taken from Transport for the North (2019). (C) Integrated Rail Plan taken from UK Department of Transport (2021). Note that the Integrated Rail Plan for Manchester to Leeds is based on trains from Manchester Piccadilly – faster services run from Manchester Victoria.
To assess the potential economic benefits of better linking up Northern cities, a series of economic assessments have taken place (SQW and Cambridge Econometrics, 2016; Mott MacDonald, 2021) which variously estimate the impact on productivity and incomes. Assessments have been based on the gains associated with access to a larger labour pool and the ability to attract in more firms and workers to a better-connected region. Quantitative estimates have been relatively low, at least based on standard cost–benefit analysis – a study by consultancy Mott MacDonald (2021) suggested that the whole Northern Powerhouse Rail programme would raise annual Gross Value Added in the Northern Powerhouse area by 2% in 2060 if synergies with simultaneous investments in other areas were not taken into consideration. Taking other investments into account the same consultants estimate an 8% boost in productivity for the Manchester–Bradford–Leeds link alone (although this link is now less likely to be built). Based on the previous research on the ‘Northern Way’, Overman (2014) urged caution and estimated that a 20-minute travel-time reduction between Leeds and Manchester would only increase wages by 1.06%–2.70%. His previous research indicated that there would in fact be greater effects on wages from transport investments within cities.
There has been an absence of modelling as to the effects of better transport infrastructure on connecting up the specific industrial sectors found in different Northern cities. However, there is acknowledgement of the importance of bringing key city specialisms together. The Northern Powerhouse Economic Review (SQW and Cambridge Econometrics, 2016) highlighted that Northern cities are highly skilled and globally competitive in the fields of advanced manufacturing; energy; life-sciences, medical technologies and devices; and digital. Subsequent commentators have highlighted the cluster effects that could be generated by better joining these sectors up (Mott MacDonald, 2022). Closest to our work, the National Infrastructure Commission (2016) forecast higher economic potentials from boosting connections between Manchester and Leeds than between other Northern cities because their economies are richer in knowledge-based services such as financial and insurance activities, and business service activities which benefit from greater face-to-face interaction. According to modelling by the Commission, the likely agglomeration benefits (in terms of earnings) brought by better connecting Manchester and Sheffield would be two-thirds that of Manchester and Leeds – in part also because of the smaller size of the Sheffield economy, and lower productivity and skills levels.
In particular, there are concerns that the economic impacts of the reduced set of investments set out in the Integrated Rail Plan are mis-estimated due to an absence of recent and updated cost benefit analyses of the different parts of the original proposed HS2 network. The House of Commons Transport Committee (27 July 2022) points out that the last cost–benefit analysis for the Eastern leg of the HS2 was carried out in 2012. The Committee urged the Government to consider whether the abandoned Eastern leg will have greater local economic consequences than currently anticipated, particularly in view of the Levelling Up agenda. The research carried out here suggests that the new IRPs do indeed represent a loss of local economic potential in terms of jobs created for the Northern cities considered compared with earlier investment plans.
Defining cities
A large literature looks at cities as mainly unified labour markets (Ihlanfeldt and Sjoquist, 1998; Bertaud, 2004). Previous studies (Barrios et al., 2011; Feser and Sweeney, 2002) examined the spatial extent of agglomeration economies in Ireland and the US due to access by firms to a diverse pool of skills, finding evidence of economies at distances of up to 50 km and 50 miles, respectively. In related work, Meijers et al. (2016) study how inter-city connectivity affects urban performance. Constructing a network of regional cities, where edges exist if pairs of cities are within a 45-minute drive distance, the authors show that small and medium scale cities can generate more output than expected given their (local) size if they are well connected to other urban centres.
A wide variety of methods have been proposed to define cities and metropolitan areas including definitions based on population density (Rozenfeld et al., 2008), street networks (Jiang and Jia, 2011) and commuting flows (Arcaute et al., 2015). For a more detailed review of historical approaches to defining cities see Duranton (2015). Here, we develop an algorithm related to that of O’Clery et al. (2019) and Dijkstra and Poelman (2012) and use travel time between neighbourhoods (MSOA) in order to vary our city radius. Importantly, when including new neighbourhoods into a city, we are capturing the presence of industries (and skills) in those neighbourhoods as recorded by firms – and not the residence of commuters. Here, we use the minimum of car and rail time in order to estimate travel times between MSOAs. We implicitly assume that bus travel is slower than either car or rail, and hence the minimum of car and rail corresponds to an optimal trip time. We leave an investigation of travel costs to future work due to complexities around comparability between modes (e.g. cost zoning for public transport) and parking costs.
The choice to focus on car and rail as the fastest modes of transport has some implications. In some areas, a larger proportion of people will not use cars for work-related travel due to high parking or other costs. Similarly, rail travel is often expensive and restricted (Banister, 2018). Hence, our results are best interpreted as representing a likely upper bound on the effects of connecting skills and industries in integrated labour markets. Nevertheless, according to official transport statistics (2021), cars are still the most popular method chosen for accessing workplaces in Britain, constituting 68% of journeys to work in the UK in 2020, as compared to rail (10%), walking (10%), bus (6%) and ‘other’ (5%). In the North of England, car use is even more prevalent, constituting 75%–76% of travel to work trips compared with 27% in London.
Data
Industry employment data
We use the Business Register and Employment Survey (BRES) for the years 2009–2014 as a source of data on annual employment by industry and neighbourhood (MSOA). This database contains employment records from all registered firms in the UK, and is compiled by the Office of National Statistics (ONS). Employment is distributed across MSOAs using plant level data. Industries are classified using the 4-digit level standard industrial classification (SIC 2007). There are 616 industries in SIC 2007; however, only for 440 of them do we find positive employment throughout the main period of interest (2009–2014).
We will also use the UK’s skill-relatedness network (O’Clery and Kinsella, 2022; Straulino et al., 2022). This network was constructed following an established framework (Neffke et al., 2011; Neffke and Henning, 2013) using the Annual Survey of Hours and Earnings (ASHE) dataset. This dataset contains anonymised demographic and employment information of 1% of the total employee jobs in the HM Revenue & Customs (HMRC) Pay As You Earn (PAYE) records. We use it to track job switches between industry codes over the period 2009–2018. The matrix of job switches between industry pairs can be seen as a network in which the nodes are industries and the edges represent skill overlap.
We keep only nodes (industries) in the largest connected component, leaving us with 360 industries. This is the largest set of nodes such that there exists a path between any two. In practice, this means discarding nodes that are not connected to the main network by any links (orphan nodes), or small disconnected fragments of the network (e.g. two nodes that are only connected to each other). Since our variable of interest, related employment, is defined based on the presence of links to neighbouring nodes, it is undefined in the case of no links. Hence, we need to restrict ourselves to the largest connected component, so that all nodes in our set have at least one link.
During the 2009–2018 period, we see close to 350,000 flows in our data. The industries left out account for < 3000 flows, or < 1% of the observed flows. These belong to mostly agricultural, mining, gas and oil extraction and related sectors, and account for < 5% of total employment in England and Wales. The largest industry left out is ‘DEFRA/Scottish Executive Agricultural Data’ (code 100) with 175k jobs, representing 15% of the total jobs left out.
Geographical data and definitions
There are several levels of geographical aggregation in the UK. We will be using the MSOA level. These areas are defined by the ONS in order to improve the reporting of small area statistics, and each one of them contains a population of around 5000 people. We will restrict our analysis to England and Wales, as Scotland follows a different geographical coding system, and Northern Ireland is not included in our sample. There are 6791 MSOAs in England and 410 in Wales.
The common official definition of the North is a grouping of three statistical regions: the North East, the North West, and Yorkshire and the Humber. We have defined the South by grouping all the statistical regions of England not included in the above definition of the North (excluding Wales).
In order to aggregate the MSOAs into urban regions, we will use an algorithm based on the travel times between them (see the ‘Methodology’ section). Data on both car and rail travel times between MSOAs was obtained from the Google Maps API. In practice we use the minimum time of these values.
Methodology
There are two key elements to our approach. First, we outline our model to capture contribution of skill-pooling in a region to industry-specific employment growth. Second, we require an algorithm to aggregate MSOAs into cities according to travel times. Here we provide a brief overview of both elements.
Identifying the skill-pooling radius
We build on a large and growing literature that focuses on the role of inter-industrial linkages in the economic growth of a region. It has been shown that industries grow faster in regions where there is substantial employment in skill-related industries (Neffke et al., 2011; Neffke and Henning, 2013; O’Clery et al., 2016).
Following Neffke et al. (2017), for a pair of industries
Let
We estimate the effect of related employment on employment growth using the following equation

We model employment growth in the period 2009–2014. A five-year window is relatively standard in the relatedness literature (Diodato and Weterings, 2015; Diodato et al., 2018). The right hand side of our equation corresponds to data from
The coefficient of interest is
For any given city–industry pair we can use our model to evaluate the impact on employment growth of improved links to neighbouring cities. Faster transport links would allow a city to source additional skills by accessing new industries that might not be already available locally, thereby modifying its related employment. To evaluate the effect of new links, we recalculate the related employment for each city–industry pair incorporating additional industries in the newly accessible MSOAs.
Keeping everything but related employment equal on the right hand side of equation (1), we have a new prediction for (city–industry) employment growth which we can compare to the original prediction. In this manner, we obtain a straightforward estimate of the size of the effect of the new transport link on employment growth as a result of improved skill pooling.
Urban aggregation
As already mentioned in the ‘Defining cities’ section, there is a large literature on methodologies for the identification of spatial boundaries on cities. One of the most widely used methodologies is the one proposed by the OECD (Dijkstra et al., 2019). In this case, a region is divided into a grid of 1 km
Our approach resembles both Arcaute et al. (2015) and Dijkstra et al. (2019). In our case, however, we use travel time instead of commuting flows as we are interested in the potential to reach a place instead of actual trips. Additionally, we do not use a specific threshold to identify a single set of cities, but allow the travel-time threshold to vary thus constructing a set of cities for each travel time.
We first identify the urban MSOAs as those whose population density is above 1500 residents per km
Our algorithm can be summarised in the following steps:
Identify all MSOAs that satisfy the urban condition (population density over 1500 residents per km Set an increasing sequence of travel-time thresholds. We take values 25, 30, 35,…, 150. For each threshold:
Order current clusters by population size. For the largest available cluster:
Identify all other clusters that fall within the travel-time threshold. Join these clusters into one and take them off the current cluster list. Repeat (b) until the list is empty. The new clusters correspond to the current threshold. Move to next threshold and repeat (3).
Therefore, our algorithm aggregates MSOAs into cities in which all the MSOAs are under the travel-time threshold. For each threshold we have a different partition of MSOAs into cities; the larger the threshold the fewer the cities. Note that all urban MSOAs are assigned to a city, and singletons are possible.
Figure 2 illustrates the cities obtained for a range of travel-time thresholds. For each threshold, the clusters are groups of MSOAs such that travelling between any two MSOAs withing a cluster requires less time than the threshold. In Figure 2(A), we can see 309 cities; as the threshold increases, the number of cities decreases. For a threshold of 45 min, we see 72 cities (Figure 2(C)), which loosely resemble the functional urban areas identified by the OECD. Higher thresholds mean that cities that are usually considered independent (e.g. Manchester and Sheffield, or Sheffield and Leeds) merge into single clusters (Figure 2(E)).
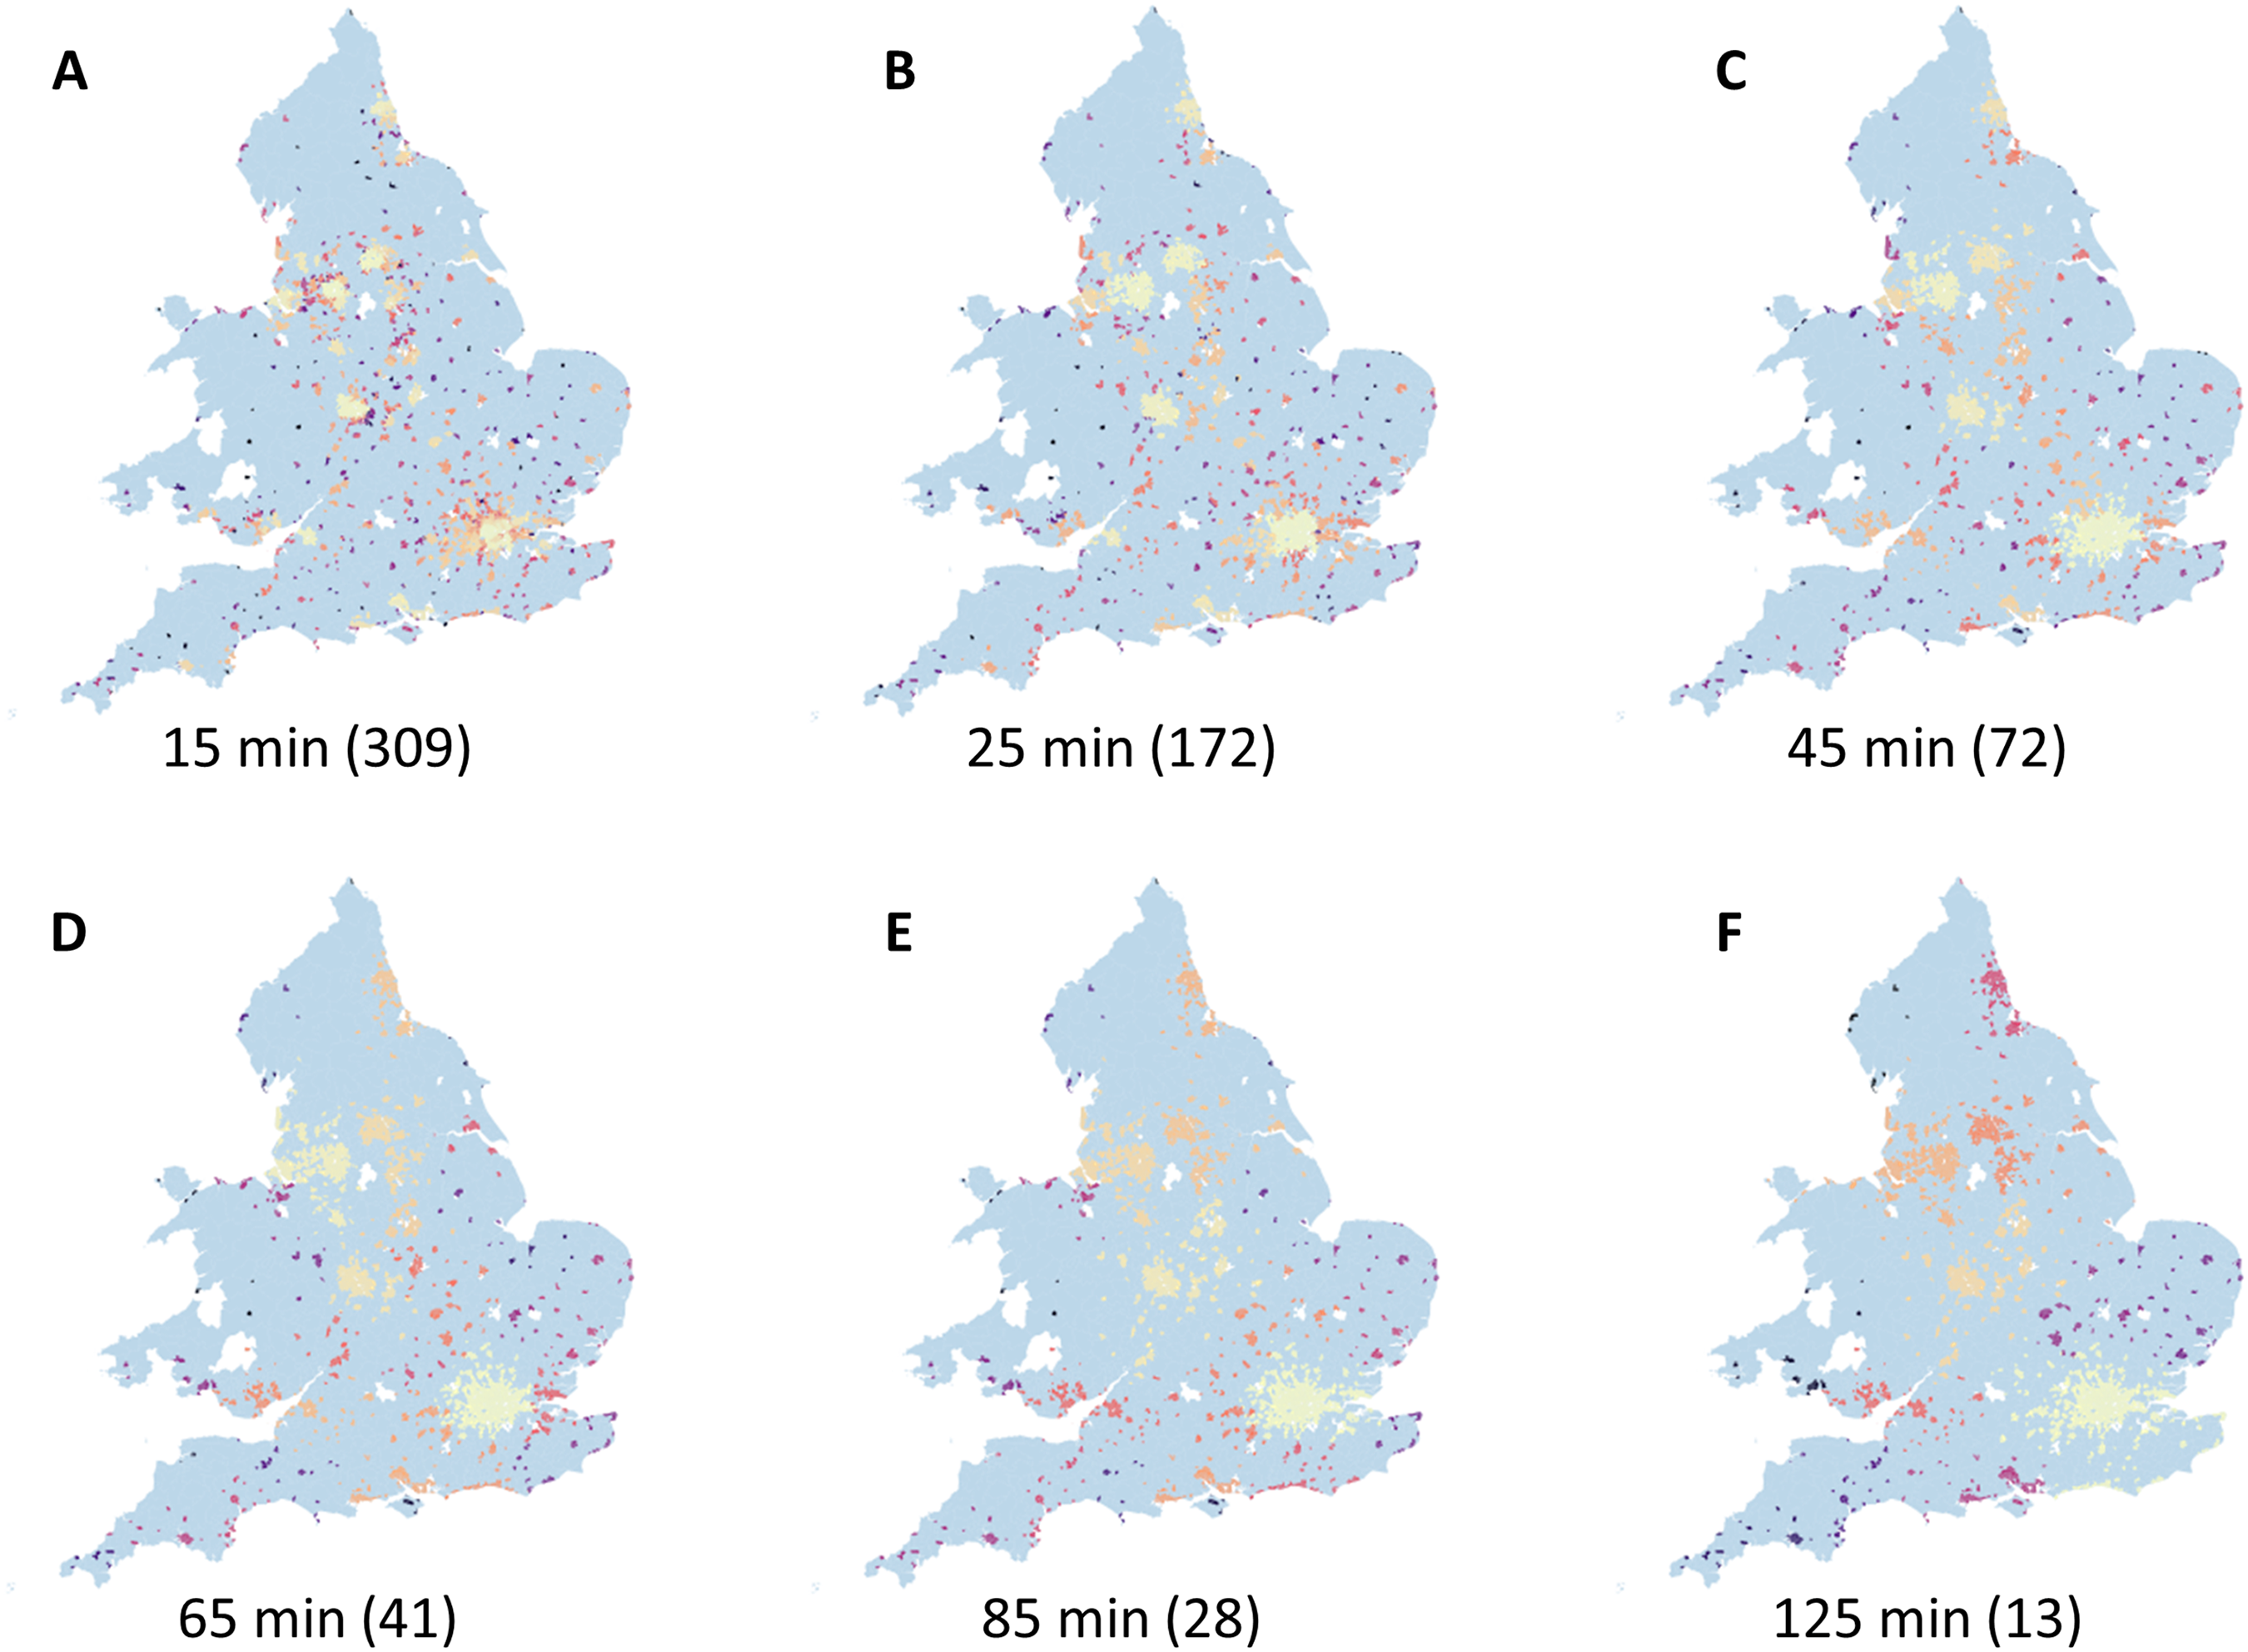
Clustering urban MSOAs. We illustrate the result of running our algorithm on the urban MSOAs of England and Wales for a number of time-travel thresholds. (A) Using a 15-minute threshold, we identify 309 clusters or cities. (B) Clusters at 25 minute threshold. (C) A threshold of 45 min gives rise to 72 cities which largely resemble the OECD's FUAs. (D–F) Fewer larger cities form when we allow the threshold to increase up 125 min. For example, we see that Liverpool and Manchester are joined around the 65-minute mark, and Sheffield joins this cluster at the 85-minute mark. MSOAs: Middle layer Super Output Areas; OECD’s: Organisation for Economic Co-operation and Developments; FUAs: functional urban areas
Results
Geographical radius at which labour pooling occurs
Our main interest is identifying what we refer to as the skill-pooling radius. In our model, this is the travel-time threshold at which clusters of related industries within cities are most strongly associated with industry employment growth. Figure 3 summarises our findings.
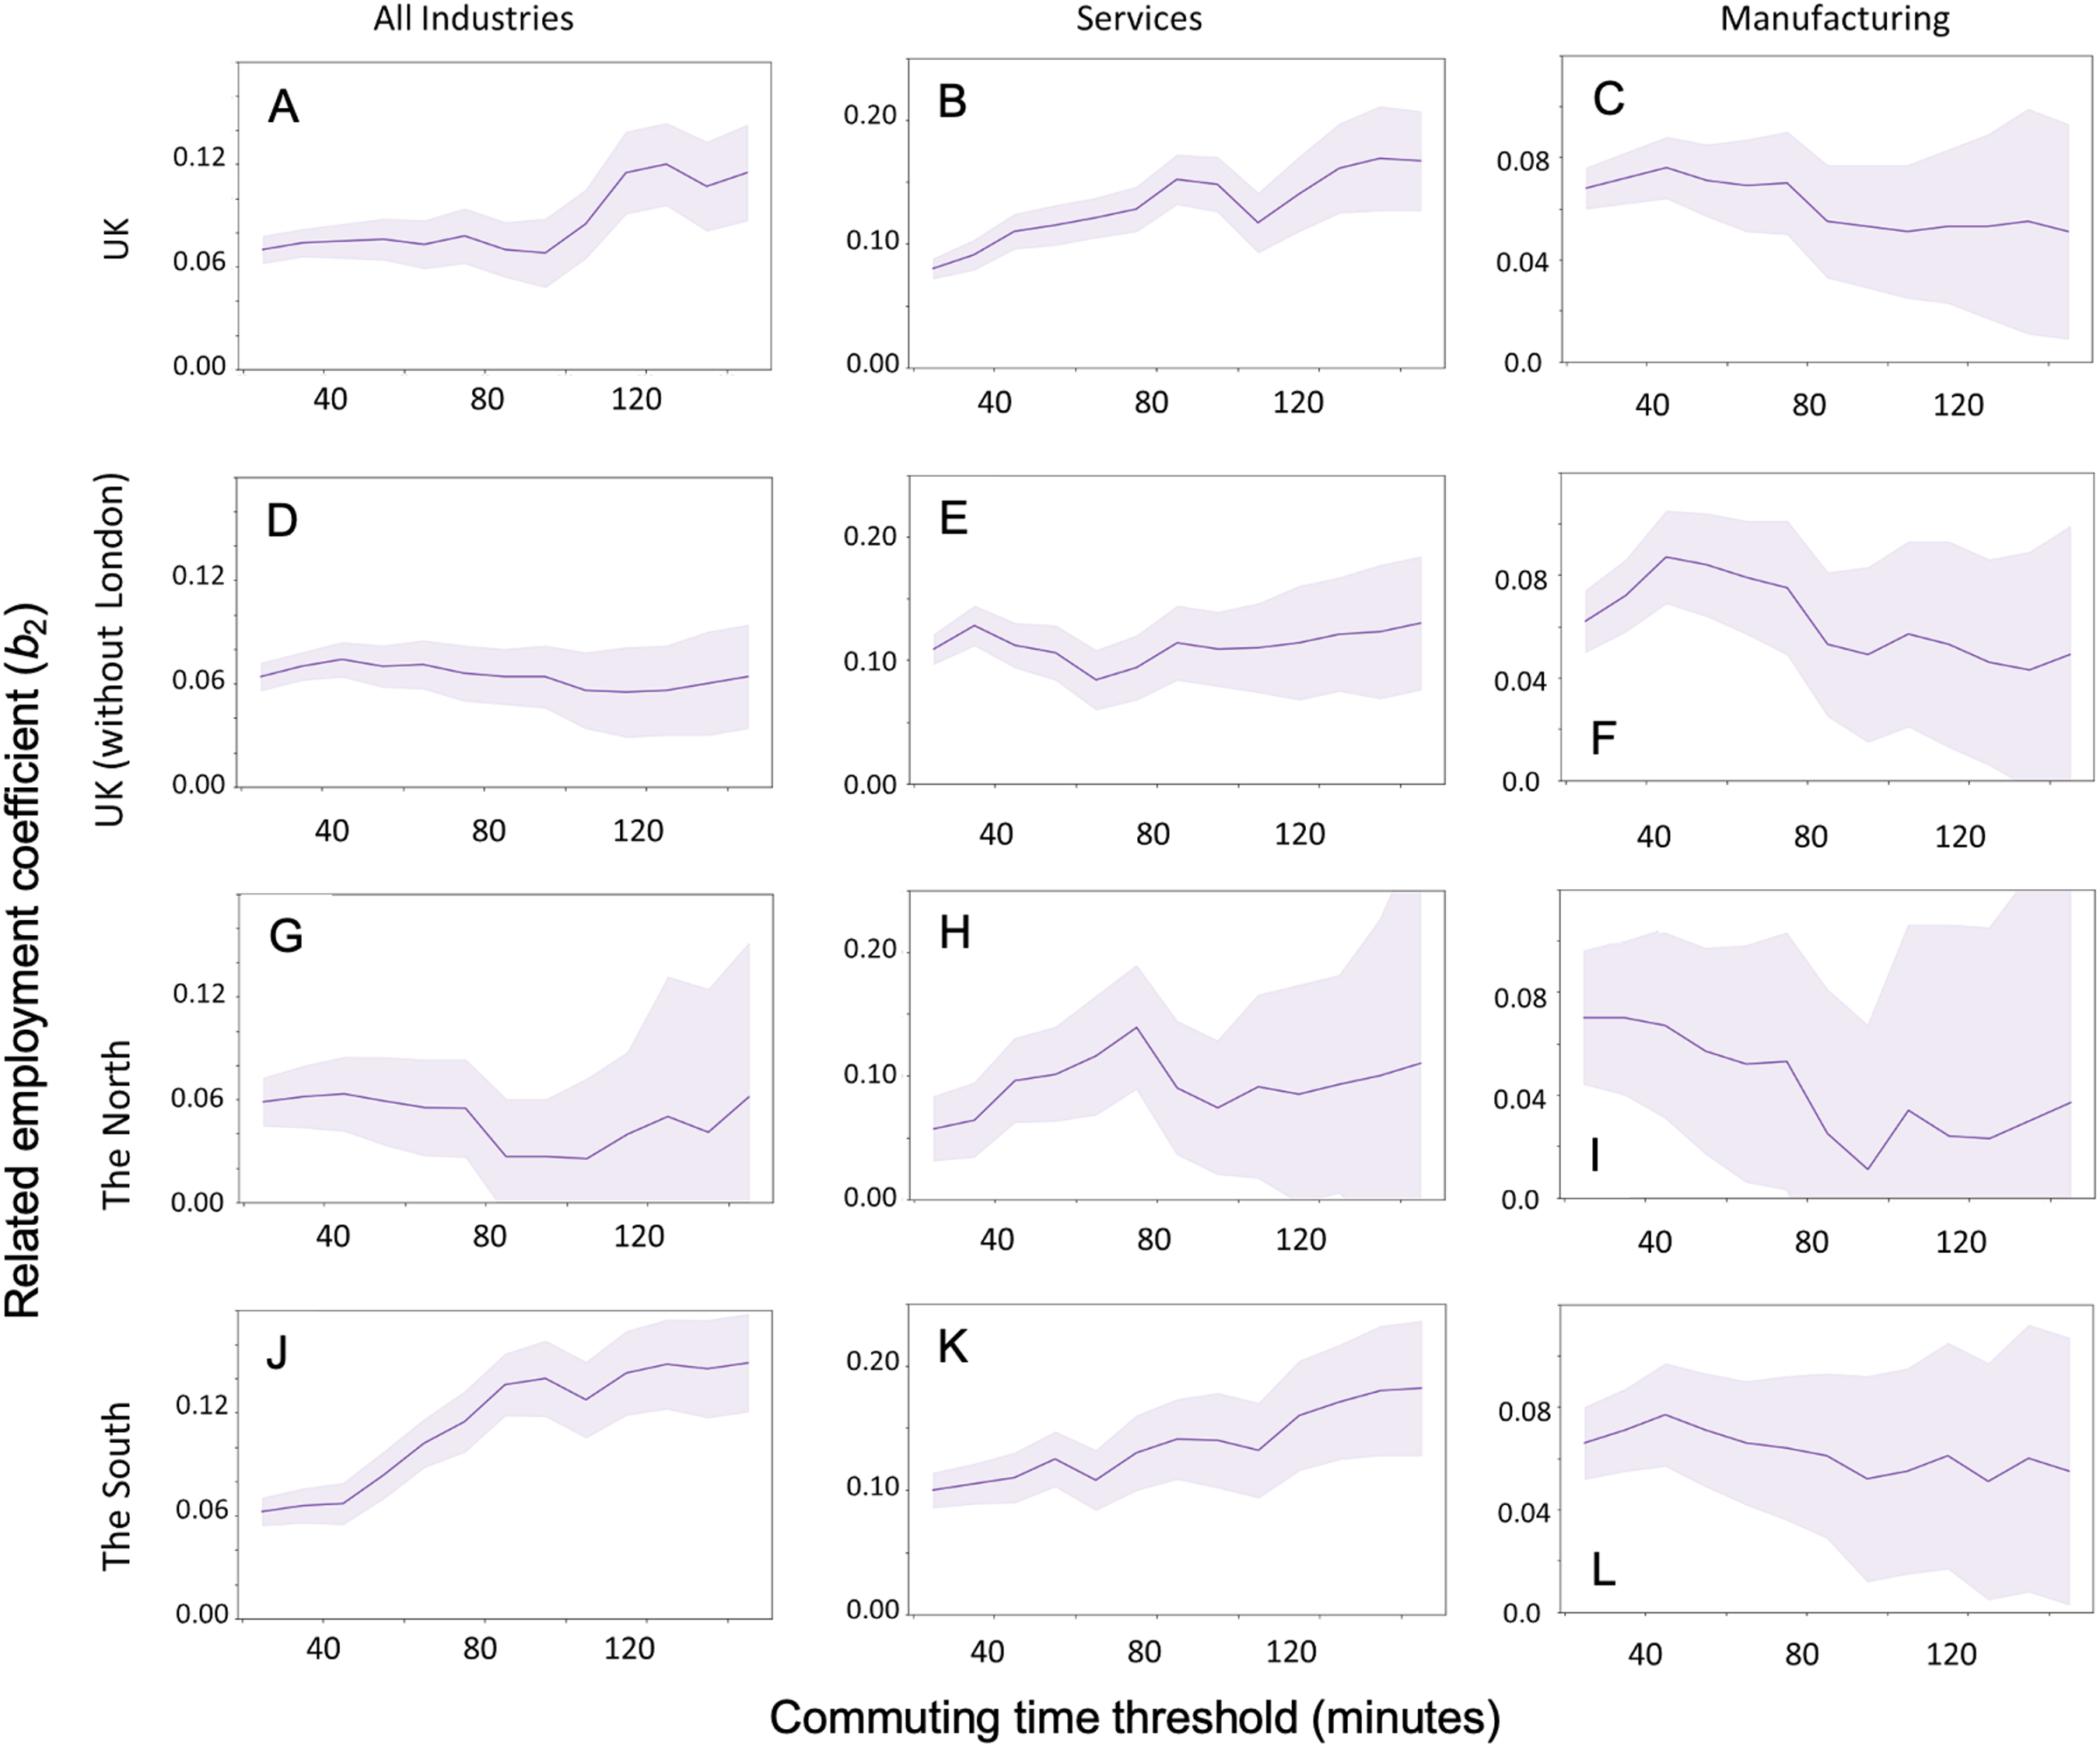
Related employment and travel time. Each figure plots the coefficient of related employment obtained by ordinary least squares (OLS) (on the y-axis) for the corresponding travel-time urban clusters (x-axis). The highlighted region shows the 95% confidence intervals. The first column shows the result when including all industries but varying the geographical area of interest. The next two columns repeat the same exercise but focusing on services and manufacturing, respectively.
In this figure, we plot the coefficient corresponding to related employment (
Considering all industries and cities in England and Wales, as shown in Figure 3(A), we observe that the coefficient remains almost flat and after a small dip around 90 min, reaches its maximum around 110 min. Notice that the confidence intervals become wider as the travel-time threshold is increased. Higher thresholds mean that fewer large cities form, and this in turn reduces the number of observations for which the corresponding regression is fitted. Fewer observations translate into more uncertainty about the fit and, therefore, wider confidence intervals.
In Figure 3(D), we repeat the analysis, but this time we do not include the MSOAs in the London region to distinguish between the dynamics of the capital and that of the rest of the country. The resulting plot is very different. We see that the coefficient reaches its maximum around the 45-minute mark and then slowly decreases. The behaviour of the curve overall is flatter than when London is included.
How can we explain the stark difference between these two curves? We further investigate by isolating services and manufacturing. The second and third columns of Figure 3 show the evolution of the coefficient when we restrict ourselves exclusively to these sectors. It is interesting to see that the plot for UK minus London in Figure 3(D) (and to a slightly lesser extent the North in Figure 3(G)) resembles the plot for the whole of the UK but when restricted to manufacturing industries in Figure 3(C), while the plot for all industries in the South (Figure 3(J)) resembles the plot that focuses on services (Figure 3(C)).
We find that the optimal radius is much smaller for manufacturing (around 45 min) than for services (around 135 min), but also stark geographical differences for services across the country. The radius for services peaks at 30 min outside London and at 70 min in the North, whereas it is at its highest for the South at over 140 min. Bearing in mind that services and manufacturing are both very broad categories, we believe that the differences to a considerable degree reflect differences in both industrial diversity and the degree of specialisation of local skills. Services in the South and especially Greater London are more diverse than elsewhere, and include high-end financial and business services (FABS) which require more specialised skills that are associated with larger job search areas. In contrast, the character of manufacturing varies less geographically, and the comparatively minor geographical variations seem primarily due to differences in city size (as per the literature review in the ‘Literature’ section).
We repeat this analysis at a more aggregate 3-digit industry level in the SI in order to check that our results are not sensitive to small values in the F and SR matrix. We find virtually identical peaks in all cases with a slight exception for the case of all industries in the North for which we find the peak is 10–15 min higher in the 3-digit case.
How do the clusters we find compare to other city definitions or urban agglomerations? We first compare the city agglomerations we identify at the 45-minute mark to the FUAs obtained by the OECD. Figure 4(A) illustrates the comparison: MSOAs are coloured according to the clusters formed by our algorithm, while the FUAs are represented by their boundary lines in blue. The number of urban clusters we find at this threshold is 72, while there are 89 FUAs in England and Wales. The main difference we observe is that some pairs or groups of cities that appear as distinct FUAs in the OECD classification are connected into a single labour pool using our methodology. For example, Doncaster and Sheffield are considered distinct cities by the OECD, but our approach provides evidence that these two cities function as a single labour market in which firms benefit from each others’ presence. In Figure 4(B), we show a similar map but for a travel-time threshold of 100 min. In this case, a significant number of FUAs are combined into larger clusters.
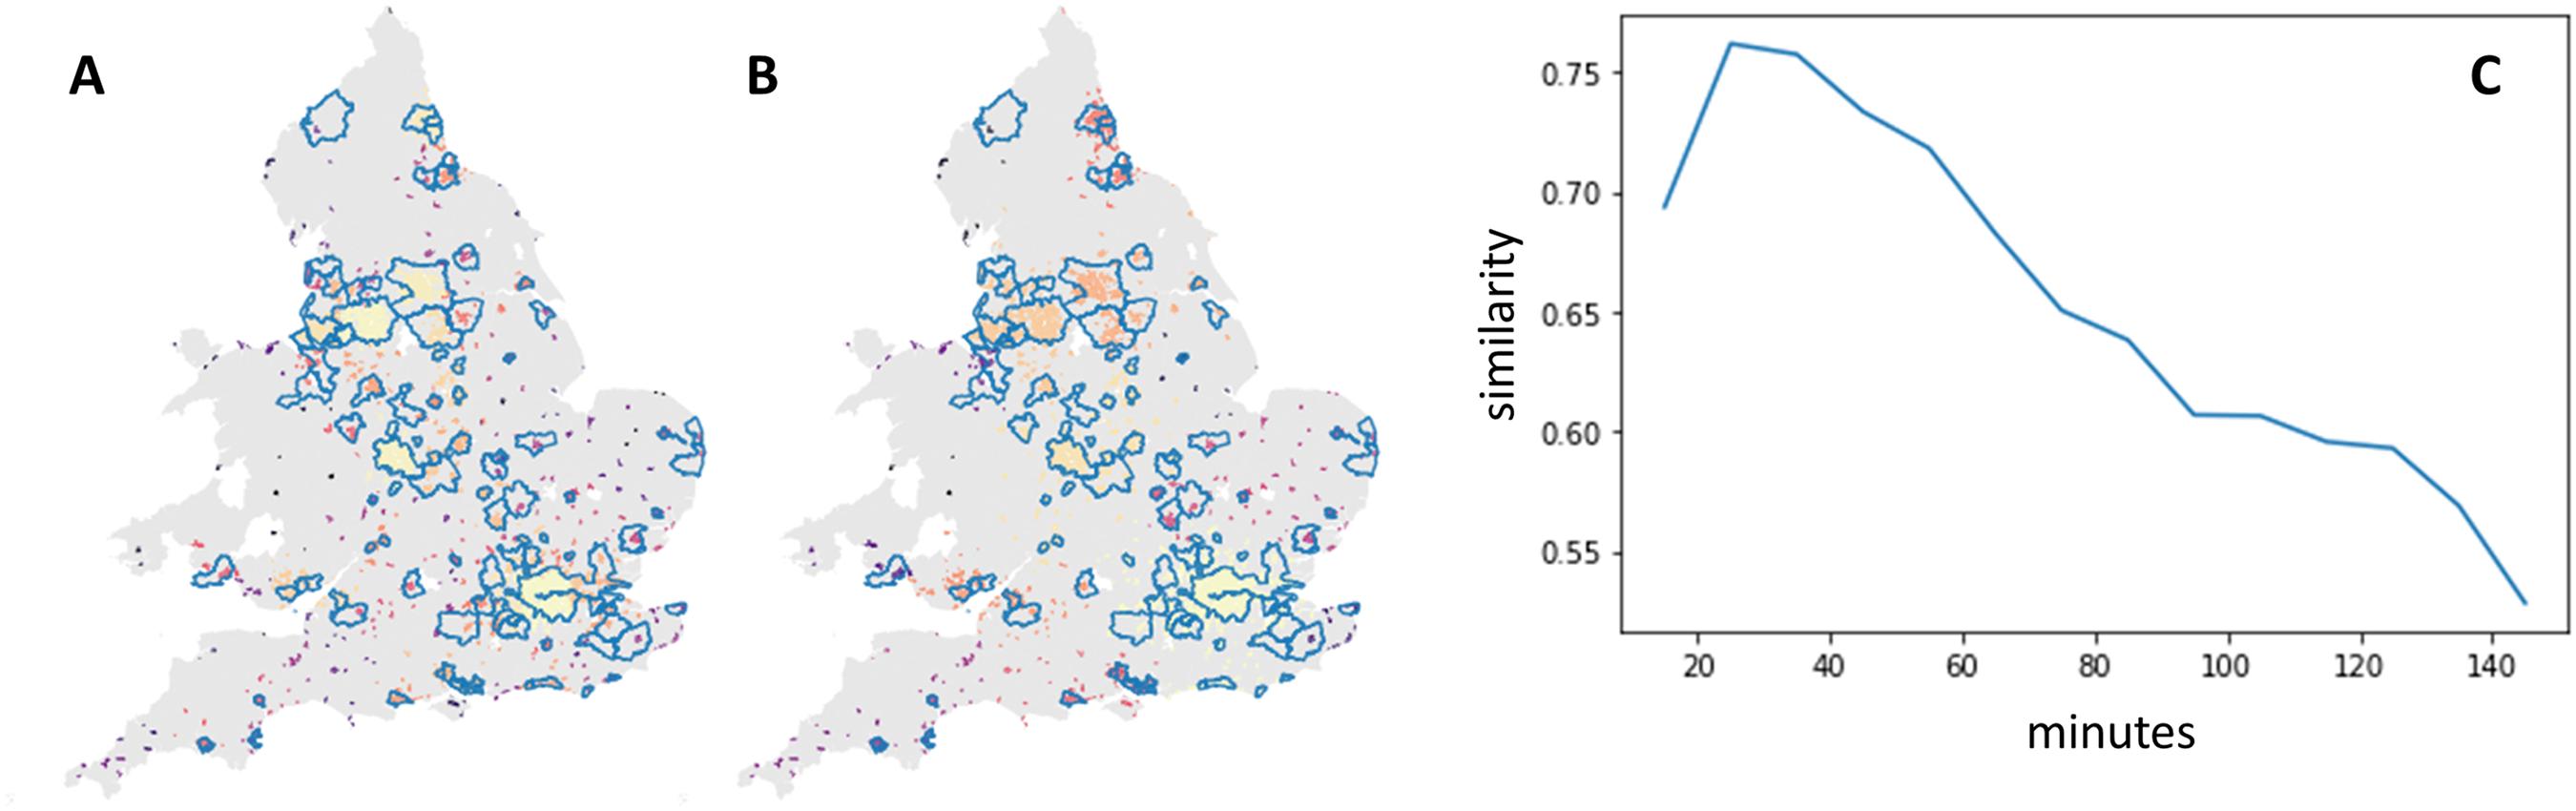
Comparing the OECD FUAs to our urban clusters. The FUAs, represented by the blue boundaries, as well as the partition of MSOAs into urban clusters corresponding to a time-travel threshold of 45 min, each colour corresponding to a different cluster. In almost all FUAs we encounter a unique colour, meaning there is only one cluster present, but some of the clusters (e.g. Sheffield and Doncaster) trespass boundary lines. (B) We see the same map, but the MSOAs are coloured according to the 100-minute clusters, and we already see that some of these clusters merge multiple FUAs into one. (C) Plots the adjusted mutual information (a similarity score) between the partition induced by the FUAs and the partitions we encounter at each travel-time threshold. Notice that these partitions are most similar for small thresholds, around 35 min. MSOAs: Middle layer Super Output Areas; OECD’s: Organisation for Economic Co-operation and Developments; FUAs: functional urban areas.
To compare the clusters with the FUAs in a more systematic way, we calculate their similarity using adjusted mutual information (AMI). This is a metric that uses information theory to measure the overlap between two partitions. Figure 4(C) shows the AMI scores between the FUAs and the urban clusters for travel-time thresholds starting at 15 min and ending at 145 min. The score is maximised for 35 min, which is a smaller radius than the one at which we find strongest evidence of skill-pooling. Hence, in general, the FUA tend to be smaller than the set of cities we find to be optimal for skill pooling at 45 min and above.
The Northern Powerhouse
In Figure 5(A), we show a schematic of our model. We assume a 45-minute travel budget between cities which is composed of train travel time and an additional time budget for onwards travel (by foot or any mode) once a traveller reaches their destination. In the case of Manchester–Leeds, we use a 30-minute train time which approximates the IRP proposals, while in the case of Leeds–Sheffield, we also use a 30-minute train time but this corresponds to original NPR-HS2 proposals (which were omitted in IRP). In the case of Manchester–Sheffield, we use a 40-minute train travel time, which corresponds to the original NPR-HS2 proposals, and are currently under discussion in respect to IRP.
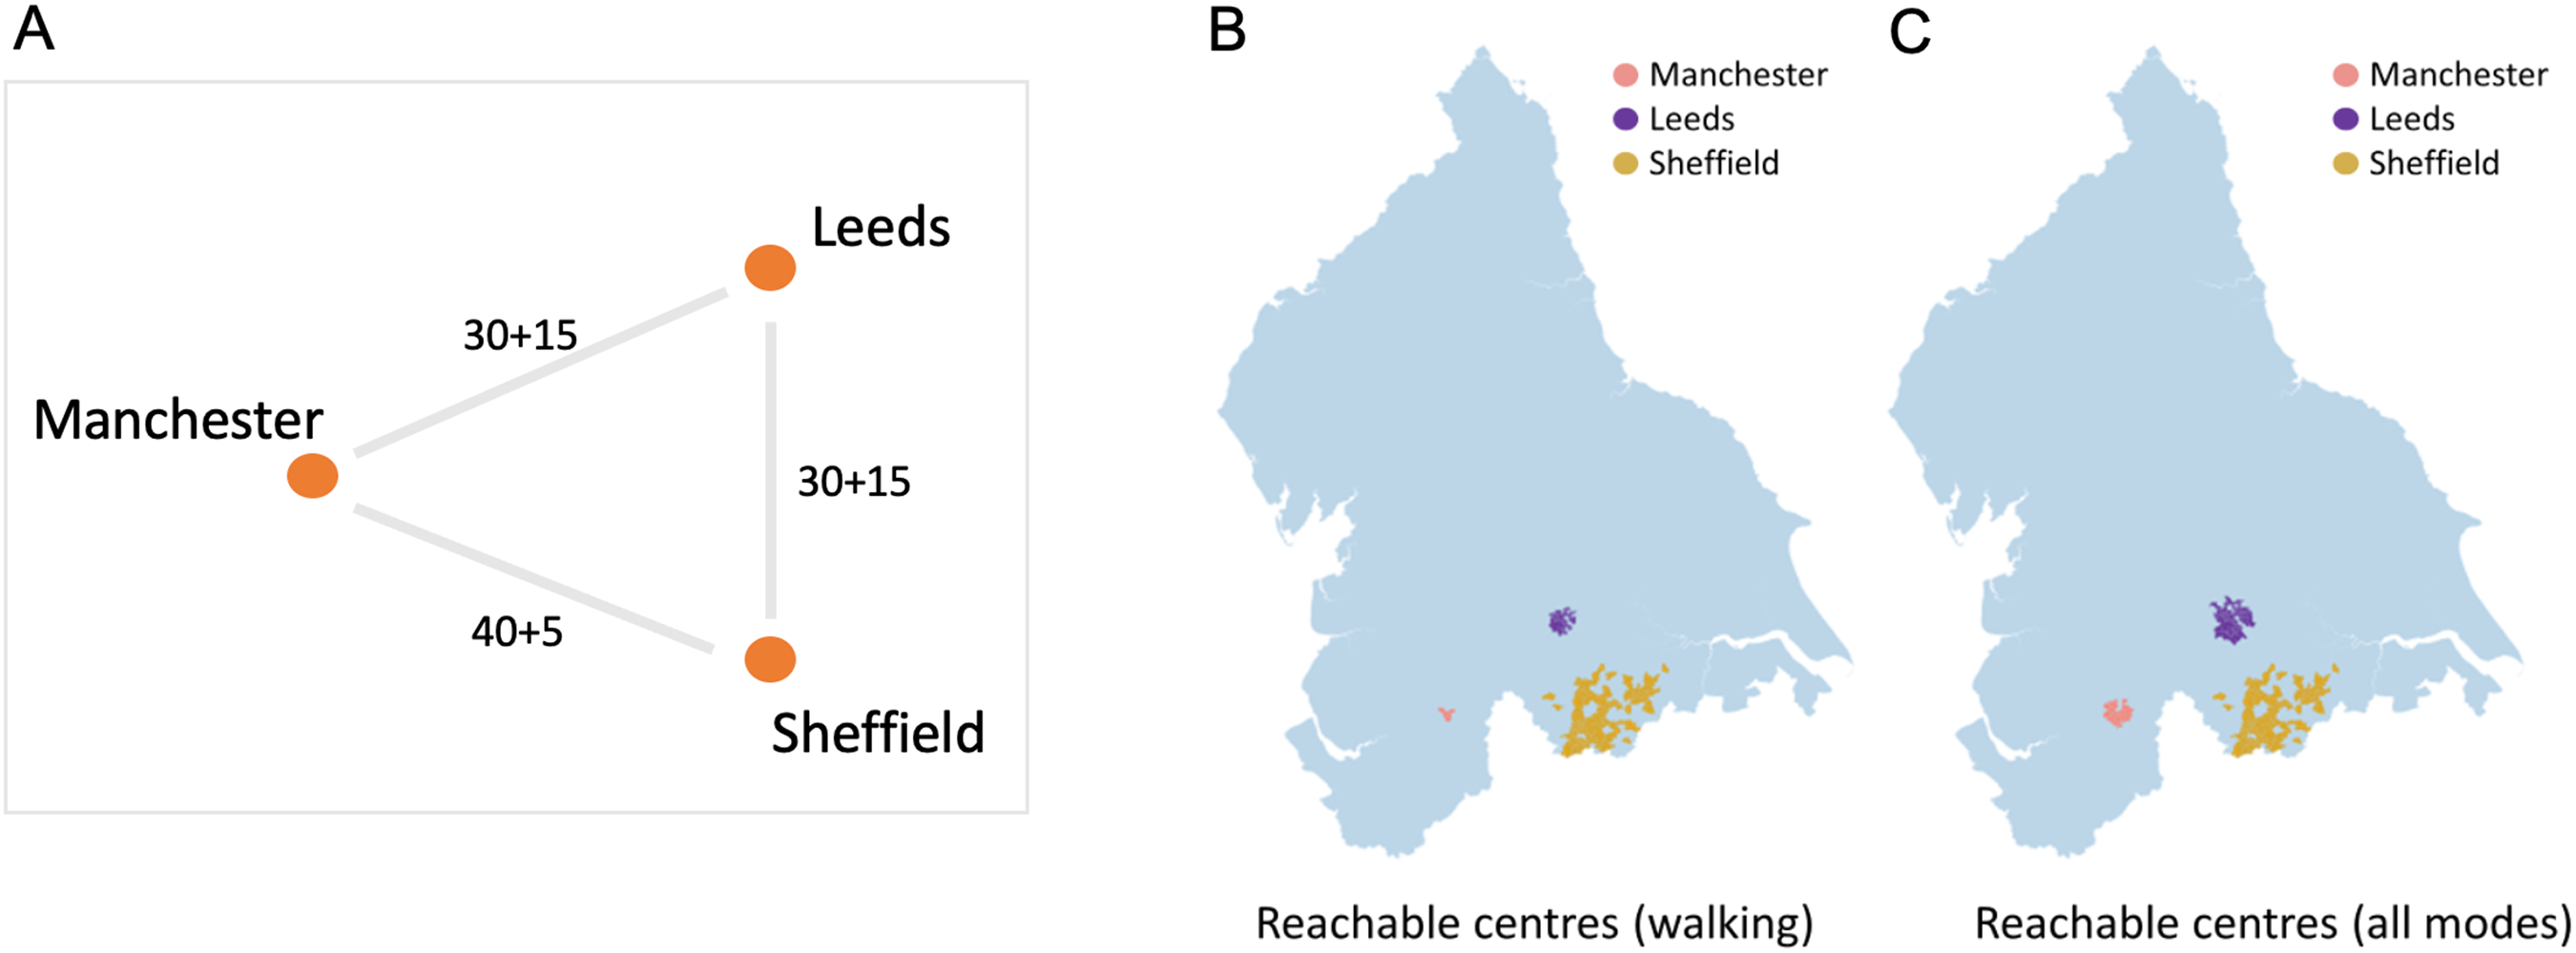
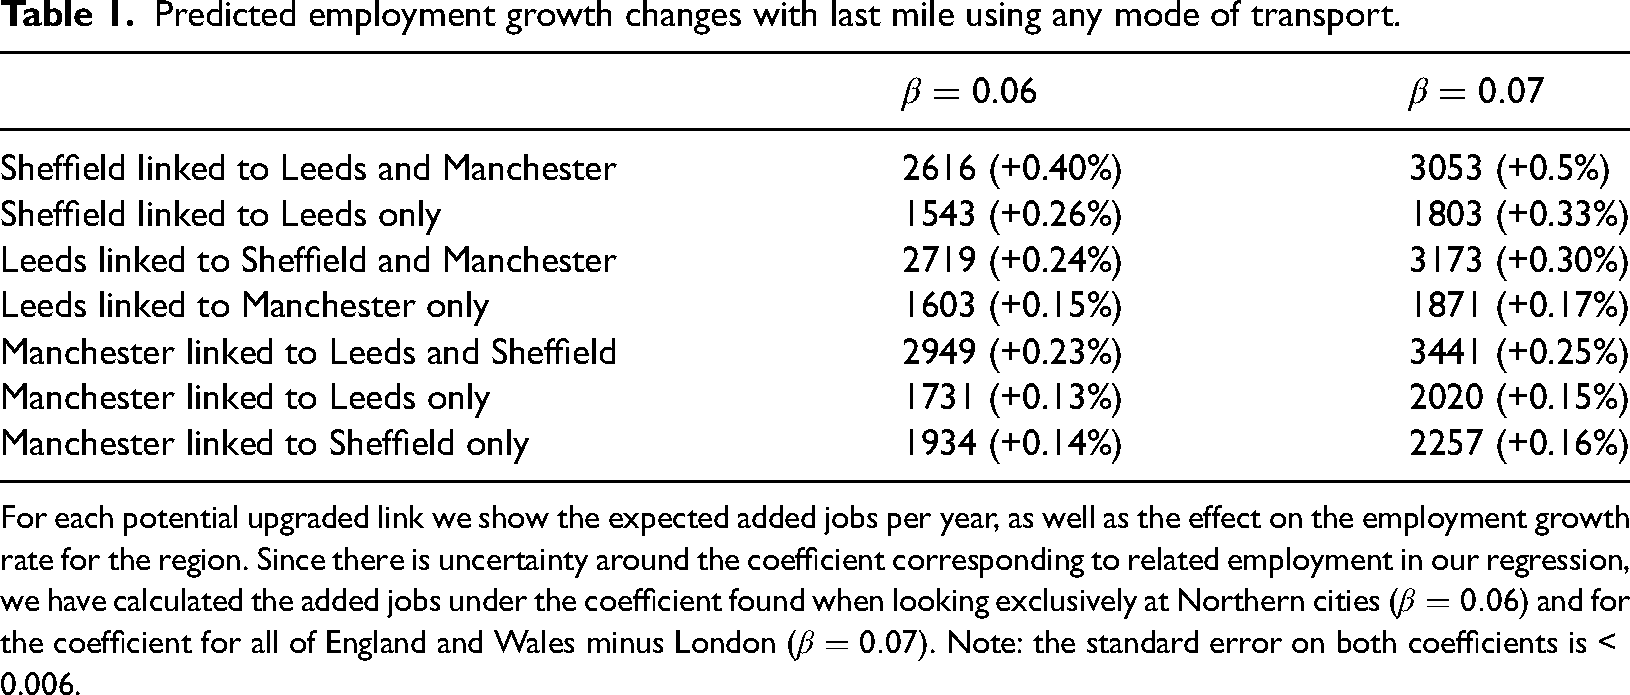
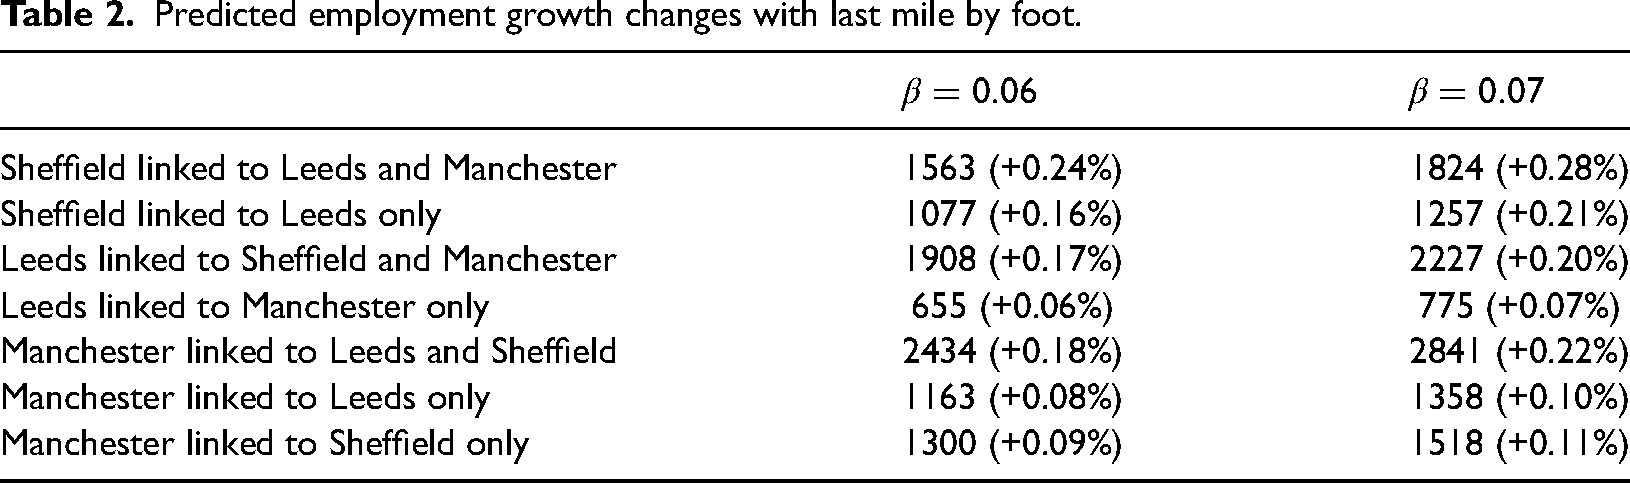
(A) Schematic diagram of our model. We allow a 45-minute travel budget between cities which is composed of train travel time and an additional time budget for onwards travel (by foot or any mode) once a traveller reaches their destination. (B) In the Sheffield case, this allows for 5 min of onward travel from the Manchester train station or 15 min from the Leeds train station. We show the MSOAs in Manchester and Leeds that can be reached from the train station under this time constraint if only walking is allowed after taking the train. (C) We show the MSOAs that are reachable if we allow any mode travel in the destination city.
To illustrate our model, we assume that Sheffield is the ‘origin’ city. In Figure 5(B/C), we show the set of MSOAs in Manchester and Leeds that are reachable from Sheffield in 45 min including both train travel and onwards travel at the destination. We have considered two cases: the first one, shown in Figure 5(B), includes all the MSOAs in Manchester and Leeds that can be reached from the train station by foot. The second one, shown in Figure 5(C), assumes that the second leg of the trip, after taking the train, can be done using any mode of transport. The first scenario is more conservative, as fewer MSOAs are reachable by foot under the time constraints.
Tables 1 and 2 show the number of predicted extra jobs (and change in employment growth rate) per year (relative to our baseline model with no rail improvements) under both any mode and foot travel in the destination city. We show calculations for the related employment coefficient we obtained when focusing on the North (which is smaller) and for the UK (without London). This provides us a range for the change in employment growth we expect in each scenario.
Predicted employment growth changes with last mile using any mode of transport.
For each potential upgraded link we show the expected added jobs per year, as well as the effect on the employment growth rate for the region. Since there is uncertainty around the coefficient corresponding to related employment in our regression, we have calculated the added jobs under the coefficient found when looking exclusively at Northern cities (
Predicted employment growth changes with last mile by foot.
Under our model, Sheffield is linked to Leeds in 30 min (NPR-HS2) and Manchester in 40 min (NPR-HS2 with possible implementation under IRP). If both of these were implemented, our model suggests that this would result in up to 3053 extra jobs a year in Sheffield which corresponds to a boost of potentially
Table 3 highlights the top industries which would have seen the biggest increase in employment growth rate in Sheffield. While it is perhaps expected that financial services and media would see a benefit from better connections to the centres of Manchester and Leeds, it is interesting to see that also manufacturing is present in this list. Hence, employment growth is expected to occur across a wide range of industries with different skill levels, and is not just concentrated in high skill level or high complexity sectors.
Industries in Sheffield with highest growth potential if the travel time to Manchester and Leeds was reduced to 40 and 30 min, respectively. Notice the diversity of industries, with manufacturing, media and finance all strongly represented.
Under our model, train travel between Manchester and Leeds is reduced to 30 min (IRP) and Sheffield to 40 min (NPR-HS2, currently under discussion). If Manchester benefited from both upgrades, then 3441 new jobs per year are predicted, but if only the IRP link to Leeds goes ahead, then just 2020 jobs per year may be created. It is interesting to note that our framework suggests that Manchester had slightly more to gain from improving its connection to Sheffield (2257 jobs per year) than to Leeds (2020 jobs per year). This suggests that the skills available in the city centre of Sheffield might be more valuable to Manchester than those in the centre of Leeds.
Finally, under our model Leeds is linked to Manchester in 30 min (IRP) and Sheffield in 40 min (NPR-HS2). If both links were improved, in the ‘any mode’ case Leeds stands to gain up to an extra 3173 jobs a year, for an employment growth rate boost of
Discussion and conclusions
Here we outline our contributions to the literature, policy implications, limitations and future work.
Contributions
In this article, we have built on previous evidence that firms benefit from proximity to other related industries for job creation in order to understand the scale of urban agglomeration at which the clustering of related industries has most effect. By defining the scale of the agglomeration by using a travel time radius we were able to be agnostic about whether the agglomeration fell within traditional or administrative city boundaries, as well as use our results to predict the effects of rail investment on urban employment creation.
Previous research has shown that the local density of employment in skills-related economic sectors is associated with employment growth, both in the UK (Straulino et al., 2022) and a number of other contexts. In the UK, previous analysis relied on predefined ‘functional urban areas’, and revealed how FUAs with a larger basket of related industries bounced back more successfully from the 2008 global economic crisis. Here, we have dispensed with administrative boundary definitions and derive the optimal geography given MSOA boundaries at which the presence of related employment (or the ‘basket of related industries’) contributes to employment growth using a ‘bottom up’ methodology. We used a travel time variable to gradually and continuously amalgamate smaller geographical areas (MSOAs) into cities. We do this until the maximum correlation between skills relatedness and employment growth is reached – defining an ‘optimal skills radius’ or unified labour market. It is at this city size that labour pooling and mixing between firms is most efficient. We find that for Northern cities this radius is around 45 min while for the South it is around 110 min. This stark difference is perhaps not surprising, with London and the South dominated by complex services, and the North host to a mix of manufacturing and services. The size of London, the high wages associated with its highly skilled occupational structure, and it’s diverse mix of industries means that the city attracts workers from greater distances. While this is only conjecture, geographical barriers in the North of England (such as the Pennines between Manchester and Sheffield) may limit employer perceptions as to what constitutes a viable local labour market.
We have used this model in order to estimate some of the benefits of connecting Northern cities via high speed rail. A key economic rationale behind these plans is that missing skills and capabilities hold back local industries, constraining growth and industrial diversification opportunities. From this viewpoint, building faster links between urban areas will open up cities to new labour markets, extending the range at which new skills and complementary capabilities are ‘discoverable’ by local enterprise, thereby unleashing previously dormant economic potential. But relatively little is known, however, about the size of the expected economic impacts of these proposals despite their cost and scale.
Here, we investigate if new rail investments could boost employment growth through bringing new related industries into the basket of skills available to each city. By looking at the change in the basket of related industries available in cities such as Sheffield, Manchester and Leeds through travel time reductions we were able to make some estimates as to potential employment impacts for each city based on plans to build and upgrade rail infrastructure as part of Northern Powerhouse Rail and the IRP. We showed, for example, that there is a marked difference between the original NPR-HS2 plans and the investment commitments listed in the IRP in the employment growth potential of cities such as Sheffield, Leeds and Manchester. Further, in contrast to the above-cited research from the National Infrastructure Commission (2016), our model suggests that more employment growth may be gained from improving connections between Manchester and Sheffield as opposed to Manchester and Leeds. These findings, however, should be interpreted with caution. Below, we outline some sources of uncertainty and limitations of the model, as well as suggestions for future work and policy implications.
More broadly, this study provides a road-map for the deployment of methods from Evolutionary Economic Geography to evaluate the potential gains from transport infrastructure schemes that aim to generate agglomeration economies. This class of model, aiming to connect the local industrial portfolio or skill mix to economic outcomes such as employment growth or industry or firm entry, is particularly well-suited to the question at hand. The emphasis on local capabilities and skills, embedded in the workforce and learnt on the job, and their spatial interaction gets directly at some of the key mechanisms that are thought to drive agglomeration economies and are the focus of large investment decisions. Our bottom-up approach to city identification based on economic outcomes rather than travel patterns alone, first introduced by O’Clery et al. (2019), is the key ingredient here, and represents an approach which can be emulated in a large number of settings and for a variety of purposes. For these reasons, this illustrative case study should prove instructive for future work.
Policy implications
As noted by Hidalgo (2022) it is not always straightforward to translate research on economic complexity and relatedness into meaningful and immediate recommendations for policy makers. While this approach can help policy makers to better understand the interconnected structure of their local economies and the potential to grow and diversify, it is less clear what steps they should take to actually intervene in this process. However, this study has revealed how analysis of economic relatedness can inform decision-making on transport infrastructure, providing an additional mechanism for the future assessment of proposed inter-city transport infrastructure.
More generally, there is a growing consensus that studies of economic impact need to include estimates of local impact, as well as consider evidence from a wider range of methodological and disciplinary sources. The House of Commons Transport Committee report on the IRP (2022-3) proposes that cost–benefit analysis should in future take into account the potential impact of investment on the wider economy, and their contribution to Levelling Up. This concurs with revisions to the UK Treasury ‘Green Book’ process in 2020, with more emphasis now being given to local economic impact, and national policy alignment to strategies such as Levelling Up and Carbon Net Zero, in comparison with strict cost-benefit ratios. In the future, cost–benefit analysis could also look at the specific industries that will benefit in different cities from transport interventions – allowing policy makers to weigh up whether these are industries that they would like to support for other reasons (e.g. net-zero transition targets and the existence of quality jobs for their residents).
In our case, given that there is no up-to-date cost–benefit analysis of the Eastern Leg of the HS2 proposals (this was last done in 2012), it is difficult to provide a precise ‘cost per job’ which would enable readers to put these economic ‘lost opportunities’ for Northern cities into greater perspective. However, it is known that the additional investment associated with the proposed new Manchester to Leeds line via Bradford would have cost an extra £9 billion – putting the additional jobs that would have been created in these two cities in perspective.
While this study has focused on the UK and its particular urban geography, the findings will be relevant to other countries – particularly those in Europe where urban areas are sufficiently close together for transport interventions to permit ‘skills borrowing’ between cities within reasonable travel times. The OECD (2015) has suggested, for example, that cities in Europe may be more likely to benefit from agglomeration spillovers between nearby cities because these cities are generally closer to each other than in the United States. However, investments in high speed rail have also been found to lead to economic spillover benefits across greater distances – and up to 2-hour travel times in China (Hou, 2022). This is a reminder that agglomeration spillovers can occur between more remote cities, particularly in certain industry sectors, such as the high-end, knowledge-based service sectors which we identified as having a larger travel-time radii. The findings will also, therefore, be of relevance to policy makers working in less dense regions where urban areas are more distributed.
Limitations and future work
There are a variety of choices and limitations associated with our methodological approach, as well as clear avenues for future work.
Firstly, in order to calculate minimum travel times within and between cities we used a measure which combined car and rail travel. In effect, we have assumed that all workers have the same probability of using rail, when in fact research shows that rail users have a skewed socioeconomic profile (see Banister (2018)). We also assume that the intervention will not affect the price structure of travel (and hence deter travellers) and assume that workers will not move homes due to the investments or the economic changes (e.g. net employment growth in certain places) they may help to generate. Because of this, as stated above, our results represent an upper bound on the effects of connecting skills and industries in integrated labour markets.
Although non-trivial in our modelling framework, future work could estimate the shares of travel modes by location and/or industry and refine the coefficient estimates to take into account this heterogeneity. Additionally, information on the monetary cost of work travel could be used to further refine the model, and better take into account local demographic factors. This latter issue is complicated by the diverse sources of monetary cost incurred in travel, the most tricky of which to get data on is parking charges which vary massively by locale.
We focus on a particular channel thought to result from the formation of urban agglomerations, specifically the mixing of skills through connecting industries and its impact on employment growth. There are no doubt a range of other channels through which better connected cities would benefit, such as supply-chain linkages, as well as a wide range of alternative outcome variables of interest. We focus on employment growth as a key signal of the economic health of a local area, but other valid choices might include wage or income growth, or industry entry and exit. In general, the model set-up is flexible and could be straightforwardly adapted in a large number of ways to modify these choices.
Finally, while remote work has grown since 2004, predominantly during the COVID-19 pandemic, but we believe the statement in the original manuscript that ‘travel time’ between firms and industries within a large city or metropolitan area is a necessary condition for employment growth: firms are limited to accessing skills than can reach each other within a ‘reasonable time’ is still broadly true. Using the National Travel Surveys for 2005–2019, Caldarola and Sorrell (2022) show that in England the overall share of workers who work from home 1 to 2 times per week increased from 3.6% in 2005 to 7.8% in 2019, and hovered around 5% in the years considered in the current article (2009–2014). The share of people working 3 or more times per week increased from 0.6% in 2005 to 1.4% in 2019, oscillating around 1% in 2009–2014. These numbers are too low to suggest significant changes in how firms can access skills at the level of England as a whole and/or in its major urban areas in the first two decades of the 21st century.
It is currently unclear whether the hike in remote working during the pandemic will have structural effects on how firms and organisations access skills in the post-pandemic era. It would seem that many employers are keen for their employees to physically return to their workplace for at least several days per week now the pandemic has been declared over in England. Teleworking frequency may have gone up, but the increase is likely to be mostly in the 1 to 2 times per week category. Moreover, it should be appreciated that the availability to work from home during the pandemic was distributed unequally across the working population, with knowledge workers and/or those on higher incomes most likely to work from home (Lee et al., 2020).
Footnotes
Acknowledgements
We would like to acknowledge Camila Rangel Smith (Alan Turing Institute) for research assistance on this project. We would also like to thank Roberto Murcio (University College London) for sharing the Google travel time matrix with us.
We would like to also thank representatives of the Sheffield City Region (and particularly Laurie Heykoop and Jonathan Guest) and Greater Manchester Combined Authority (and particularly Katrina Hann and Lisa Dale-Clough) for their active involvement in this project.
Declaration of conflicting interests
The author(s) declared no potential conflicts of interest with respect to the research, authorship, and/or publication of this article.
Funding
The author(s) disclosed receipt of the following financial support for the research, authorship and/or publication of this article: This article was completed with the support of Alan Turing Institute Award ‘Connecting up embedded knowledge across Northern Powerhouse cities’.
Notes
Appendix A: Regression tables
A key element of our analysis is the behaviour of the coefficient associated to the related employment in our growth regressions. Figure 3 in the main document shows how the coefficient varies with the travel-time thresholds. For each combination of geography (UK, UK without London, the North and the South) and set of industries (all, services and manufacturing) 15 regression were calculated, each one for a different threshold.
Appendix B: Validation using 3-digit industry codes
A key element of our analysis is the behaviour of the coefficient associated to the related employment in our growth regressions. Figure 3 in the main document summarises the relationship between this coefficient and the travel-time threshold.
Because our analysis is based on a network constructed using a 1% sample of flows (ASHE data), it may be subject to noise. To test this, we have repeated the main analysis after aggregating the data to the SIC 3-digit level instead of the 4-digit level we used in our initial analysis. To be precise, we aggregated the original matrix of jumps at 4 digit to 3 digit, and then re-computed the SR and Rel matrices.
Comparing the peaks in the curves in Figure 3, we find that the results using the SIC 3-digit industries are virtually identical to our 4-digit results with just one exception. Specifically, the peaks for all industries (the UK, North, South) are identical except for a slight shift to the right for the North. The peaks for services industries (the UK, North, South) are identical, and peaks for manufacturing industries (the UK, North, South) are also identical.
We also provide the tables equivalent to Tables 1 and 2 when using 3-digit codes. When considering the travel-time threshold of 45 min, we also see that