
Abstract
In 2020, the COVID-19 pandemic necessitated a shift to remote work-from-home (WFH) setups, including in the education sector. This transition had a significant impact on the interaction between students and instructors. To address this, our study aims to investigate the effects of the sudden transition to online learning on teaching methodology and to propose improvements to enhance its quality. We have developed a scoring system to evaluate teaching quality in the post-COVID-19 world. The scoring function incorporates various metrics, including students’ performance, sentiment towards the course (course material, teaching method, communication, etc.), feedback scores for weekly lectures, and students’ retention scores for recorded/live lecture videos. Following the Lean Six Sigma (LSS) procedure (Define, Measure, Analyze, Improve, and Control—DMAIC), we assessed the overall quality of online courses. The undergraduate courses demonstrated an increase in overall score from 86.67% during the online transition to 90.0% after implementing the suggested improvements. For graduate courses, the initial face-to-face lecture score was 55.81%, which dropped to 50.28% during the first online transition. However, after a year, the score improved to 61.59%, indicating successful improvement efforts. Upon careful analysis of the data, this paper provides suggestions to enhance students’ online learning experience during situations similar to the COVID-19 pandemic. The outcomes of the study aim to improve the quality of online learning experiences for students.
Keywords
Introduction
As a countermeasure to the highly contagious COVID-19 outbreaks in March 2020,1,2 most countries attempted restrictive measures including, but not limited to social distancing, bans of international movements, mandatory quarantine for national-level traveling, bans of public gatherings, lockdowns in cities with high spread, closure of all non-essential activities, and suspension of educational activities.3–5
Following the guidance of the WHO (World Health Organization) and the CDC (Centers for Disease Control), like most universities in the United States, the University of Texas at San Antonio (UTSA) also suspended their in-person activities and on-campus events. Considering the uncertainties surrounding the COVID-19 lockdown duration and minimizing its effect on students’ studies within a week's notice, UTSA moved all its classes to online platforms. 6 This minimized the contact between the students and the instructor. 7 However, online learning prevented students from achieving intended learning outcomes, accessing resources, communicating with their instructors, etc. Many students did not have access to high-speed internet, and personal digital devices (computers, laptops, iPads, etc.) due to economic stress. 8 The absence of face-to-face (f2f) interaction between the students and the instructor and the lack of traditional classroom socialization are among the issues encountered by the students. 9 On the other side, the instructors had truly little time to transition to online platforms and adapt their teaching materials to this unique environment, especially the use of different online platforms to teach (Blackboard Ultra, Microsoft Teams, WebEx, Zoom, etc.), distribute the lecture notes, assess students through remote online exams, provide institutional support for digital learning, and transfer lab-based experiments online. 10 This led to a heavy burden on students who had to adapt to new learning platforms, and for teachers to re-organize all their lectures from in-person to online platforms (especially for lab courses). The teaching and research environment at UTSA faced the same issues as all other universities.
Adapting to distance education in instructional design has been the subject of extensive research and scholarship over the past few decades. One important theme in this literature is the need for instructional designers to consider the unique challenges and opportunities of distance education. For example, Anderson and Dron 11 emphasized the importance of fostering social presence in online learning environments, while Köprülü et al. 12 highlighted the need to provide clear and frequent communication between instructors and learners. Another area of research has focused on the role of STEM (Science, Technology, Engineering, Math) faculty members’ perspectives in distance education. Bawaneh and Malkawi 13 have argued that technology can facilitate more flexible and accessible forms of education, but that it also requires careful consideration of issues such as accessibility, interactivity, and usability. Instructional designers must consider a range of factors related to technology when designing distance education courses, including hardware and software requirements, bandwidth limitations, and compatibility with different devices.
During the worldwide transition to emergency remote teaching, instructional designers play a critical role in developing effective distance education programs that are tailored to the needs and goals of learners. 14 To be able to improve the student experience, we first needed to identify possible dissatisfaction sources. The Six-Sigma methodology gives us a step-by-step direction to identify the causes of dissatisfaction in online course setup and opportunities for improvement. The five-phased Lean Six Sigma method—Define, Measure, Analyze, Improve, and Control (DMAIC) 15 —is a structured problem-solving methodology that drives process improvement efforts. This research uses the DMAIC approach considered as a continuous improvement methodology to analyze the data to improve the online teaching process. 16
The organization of the article begins with a project charter, defining the methodology of this study in detail. It includes a sentiment analysis technique 17 utilized in various applications for opinion mining, 18 measuring student assessment grades, instructor assessment score, and lecture material/video view score. Following the section on analyze, improve, and control, where findings from the analysis led to suggestions to improve the online course experience for the students. The concluding section summarizes the overall lessons learned from this study and insights for educators in similar situations.
Project charter
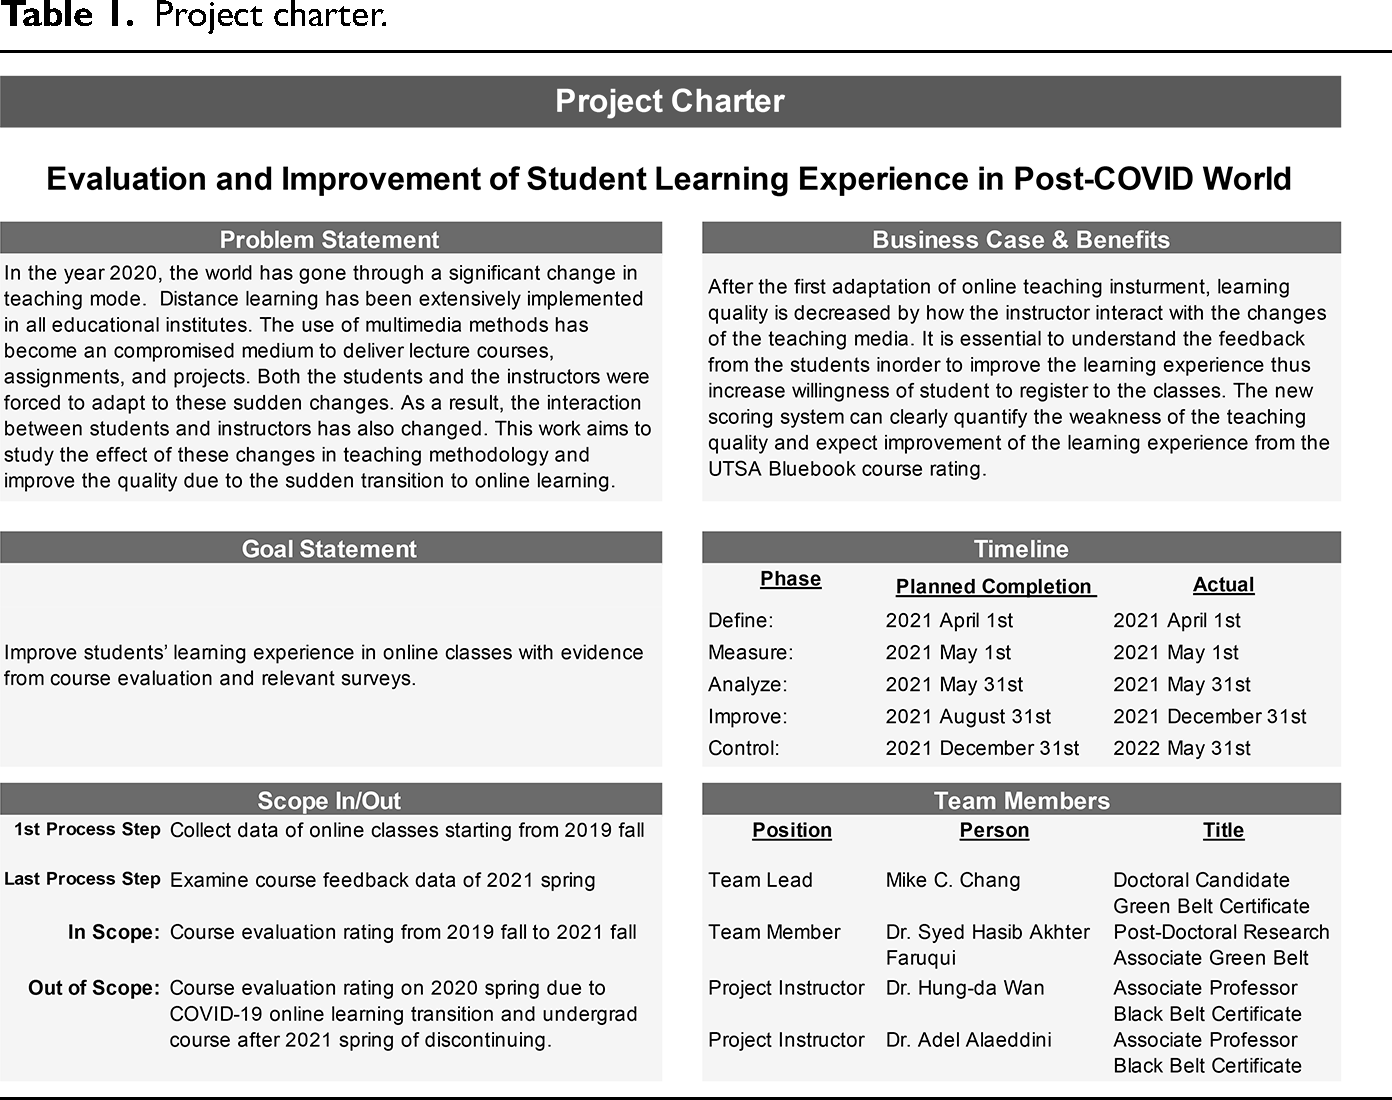
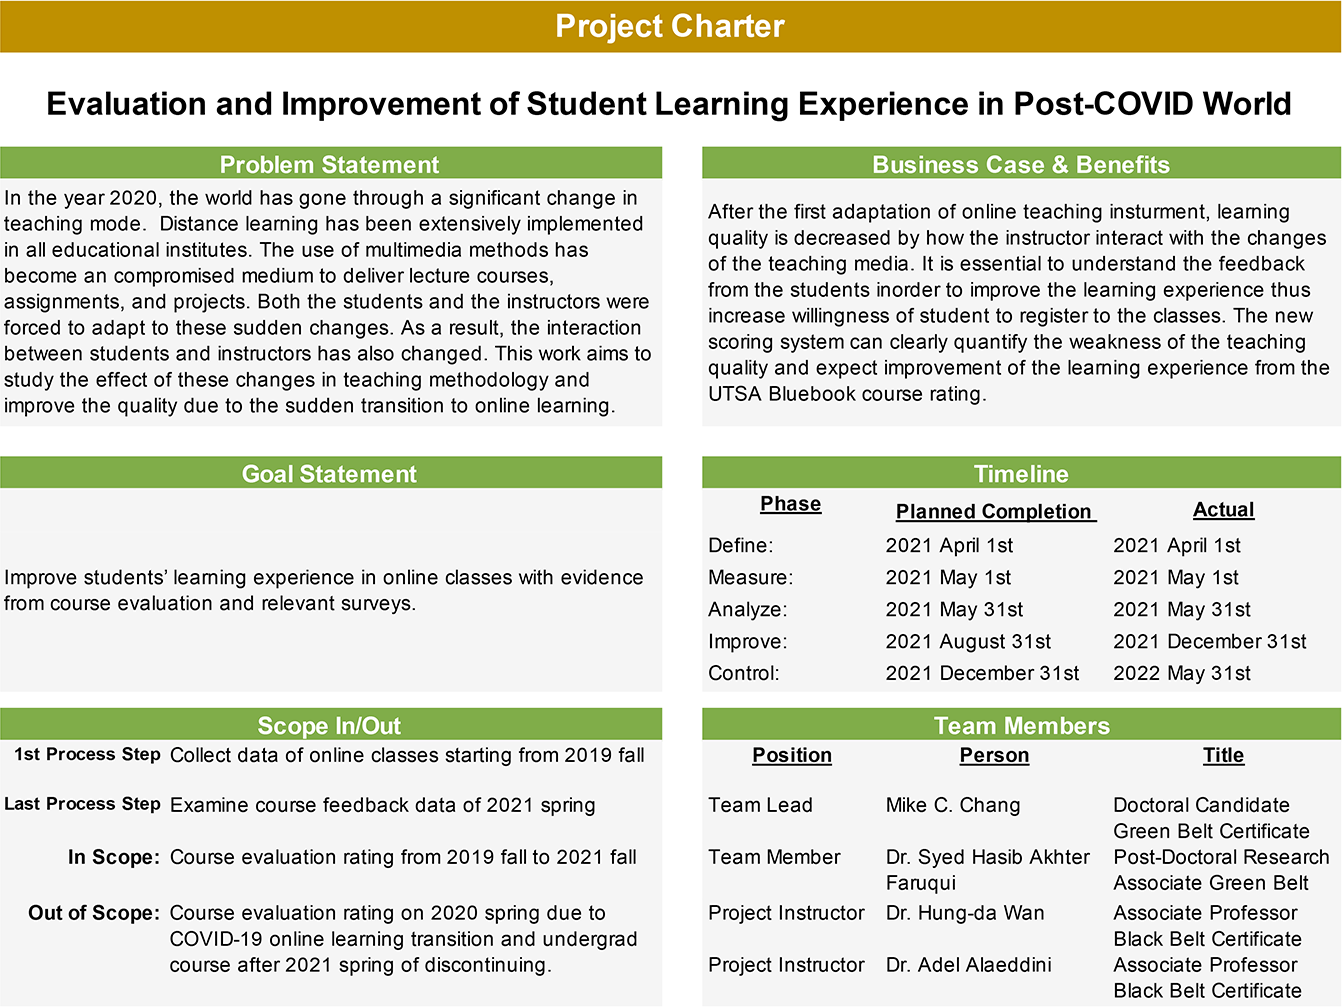
Before COVID-19, in-person interaction was a natural and effective method for learning. Changing to online classes also changed the way people communicate. 19 The instructors have to spend extra attention on utilizing online chatrooms, discussion boards, and audio-visual channels to communicate with the student. 20 To understand and improve the teaching quality and learning experience, we initiated a DMAIC project to evaluate and improve students’ learning experience in the post-COVID world. Table 1 demonstrates the Project Charter, which is the plan for the process improvement effort.
Project charter.
DMAIC: Define phase
This research aims at studying the effects of the changes in the context of two representative courses (one undergraduate laboratory course and one graduate-level course) taught in the Department of Mechanical Engineering at UTSA. First, the way to assess the effects should be established. In this research, students’ feedback plays a critical role. Setting up expectations for each lecture at the beginning of the class helps students to understand the objective of the session.
20
At each session, students’ feedback helps instructors identify the quality of their lectures and improve the contents to be discussed/included in the next lecture sessions.
21
Meanwhile, the performance of learning can be evaluated by quizzes and exams, projects, presentations, standardized tests, etc. Also, education effectiveness is the index of the improvement in the transition from face-to-face to online teaching. Tools in the before-and-after analysis are delivered to the traditional in-person class compared to the online and hybrid courses.
22
Perceived favorability of online courses (PFoOC)
23
is examined from the UTSA course evaluation rating. Considering the research criteria above, we analyzed the data collected from both the classes’ pre- and post-COVID-19 environments, focusing on the following questions:
How has COVID-19 affected teaching style? How to redefine course quality and evaluation methods?
Data collection plan
For the sake of privacy (for both instructors and students), we identified the courses as
Available data for analysis.
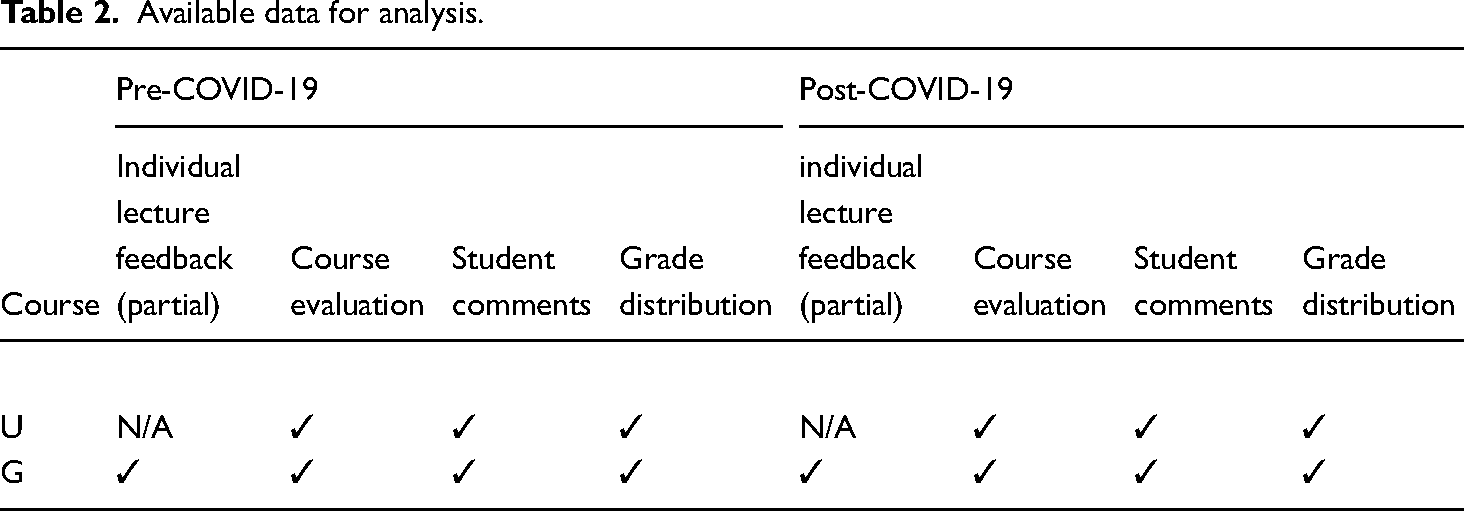
Data collection plan: Course “U”
The instructor was responsible for teaching two sections of this course for Spring 2020 (34 students) and Fall 2020 (48 students). All the classes transitioned to an online format midway through Spring 2020, which is considered the baseline semester where the instructor had to transfer their materials online. The two-class sections were given a repeated lecture (to spread students in half for better learning quality) followed by two separate Q&A times right afterward. In the regular semester, the Q&A sessions would last 15–20 min as some of the questions were common among students. They were answered in front of the class to maximize the effects. After transitioning to online sessions, these students would often reach out to the instructor at separate times of the day. This resulted in committing additional time to answer and troubleshoot students’ problems throughout the work week.
For Fall 2020, the instructor opted for synchronous online classes where they used YouTube Live as a teaching medium and introduced the real-time rewind feature offered by YouTube. With this tool, the students can rewind to the beginning of the lecture to start their class at any time. When encountering a question, they can easily scroll the YouTube video streaming to the end for a live meeting to ask a question and get an instant response. This helped restrain the Q&A and live session to a fixed time, and students from both sections could start at any time.
Data collection plan: Course “G”
The instructor was responsible for teaching one section of this course for Fall 2019 (30 students) and Fall 2020 (16 students). The classes are 75 min long, and office hours are right after the class for the next 45 min. Additional office hours are also offered by appointment (for Fall 2019). For the online classes (Fall 2020) the office hours were strictly appointment-based. The online classes were conducted asynchronously, which means the lectures were self-paced without a set time. For both semesters, the instructor conducted this class dynamically, since this course demands some basic math, statistics, and programming background. Thus, to maximize students’ understanding, the course materials are adjusted during the first half of the semester (via student surveys, quizzes, and homework grades). This approach gave the course an upper hand compared to other courses by adjusting the course materials to students’ needs. However, this course still suffered from issues with the online format. Setup for term assessments (exams) had to be adjusted throughout the two midterms. Since it was the first experience for some of the students with this type of exam, they described it as more stressful than in-person exams. Discussions of additional materials, workout problems, and coding practices had to be arranged separately for the students, and additional office hours had to be set up. Similar to Course “U,” the students would often reach out to the instructor at separate times of the day. Thus, extended office hours were committed to answering and troubleshooting students’ problems throughout the work week.
DMAIC: Measure phase
To assess the impact due to changes in course operations, we monitored the following measures:
Students’ grade distribution. Students’ sentiment score. Students’ feedback per lecture (if available). Students’ retention per lecture (if available).
These parameters helped our assessment to determine how much change is observed between courses in both setups. A hypothesis test is designed to test if the mean of the two setups (f2f and online) are significantly different after the change in class modality. The above-mentioned measures are inspected to determine the change in the quality of the classes after transitioning from f2f to an online setup. The elements of the impact assessment are described in detail below.
Students’ grade distribution
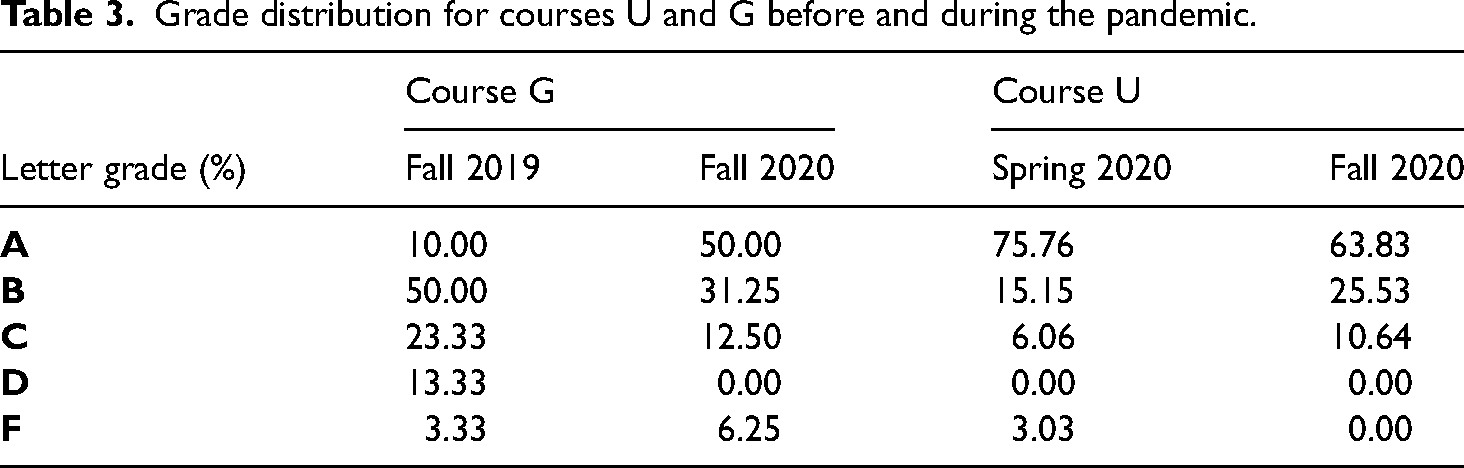
We utilized students’ final grades as a measure to determine how well a student performed in a particular course. While the grade distribution represents the class's overall performance, considering only this can be misleading. For example, in courses like “G” where the instructors adjust the difficulty and teaching level depending on the student's knowledge base, the grades can be sometimes higher or lower than expected. Moreover, in the fall of 2020 of course G, even though the class material is following the standardized teaching and testing materials from the previous years, there are more grades A and less low grades during the pandemic terms; meanwhile, during the transition in spring 2020, of course, U, there are more A grades than usual. We can find similar phenomena in the US 24 and among global universities.25–27 Thus, we consider using other parameters like students’ sentiment towards the lectures, and feedback retention of published materials. Table 3 shows the grade distribution for the courses being evaluated. Detailed grade distribution for the course “G” is shown in Figure 1 as an example.
Grade distribution for courses U and G before and during the pandemic.
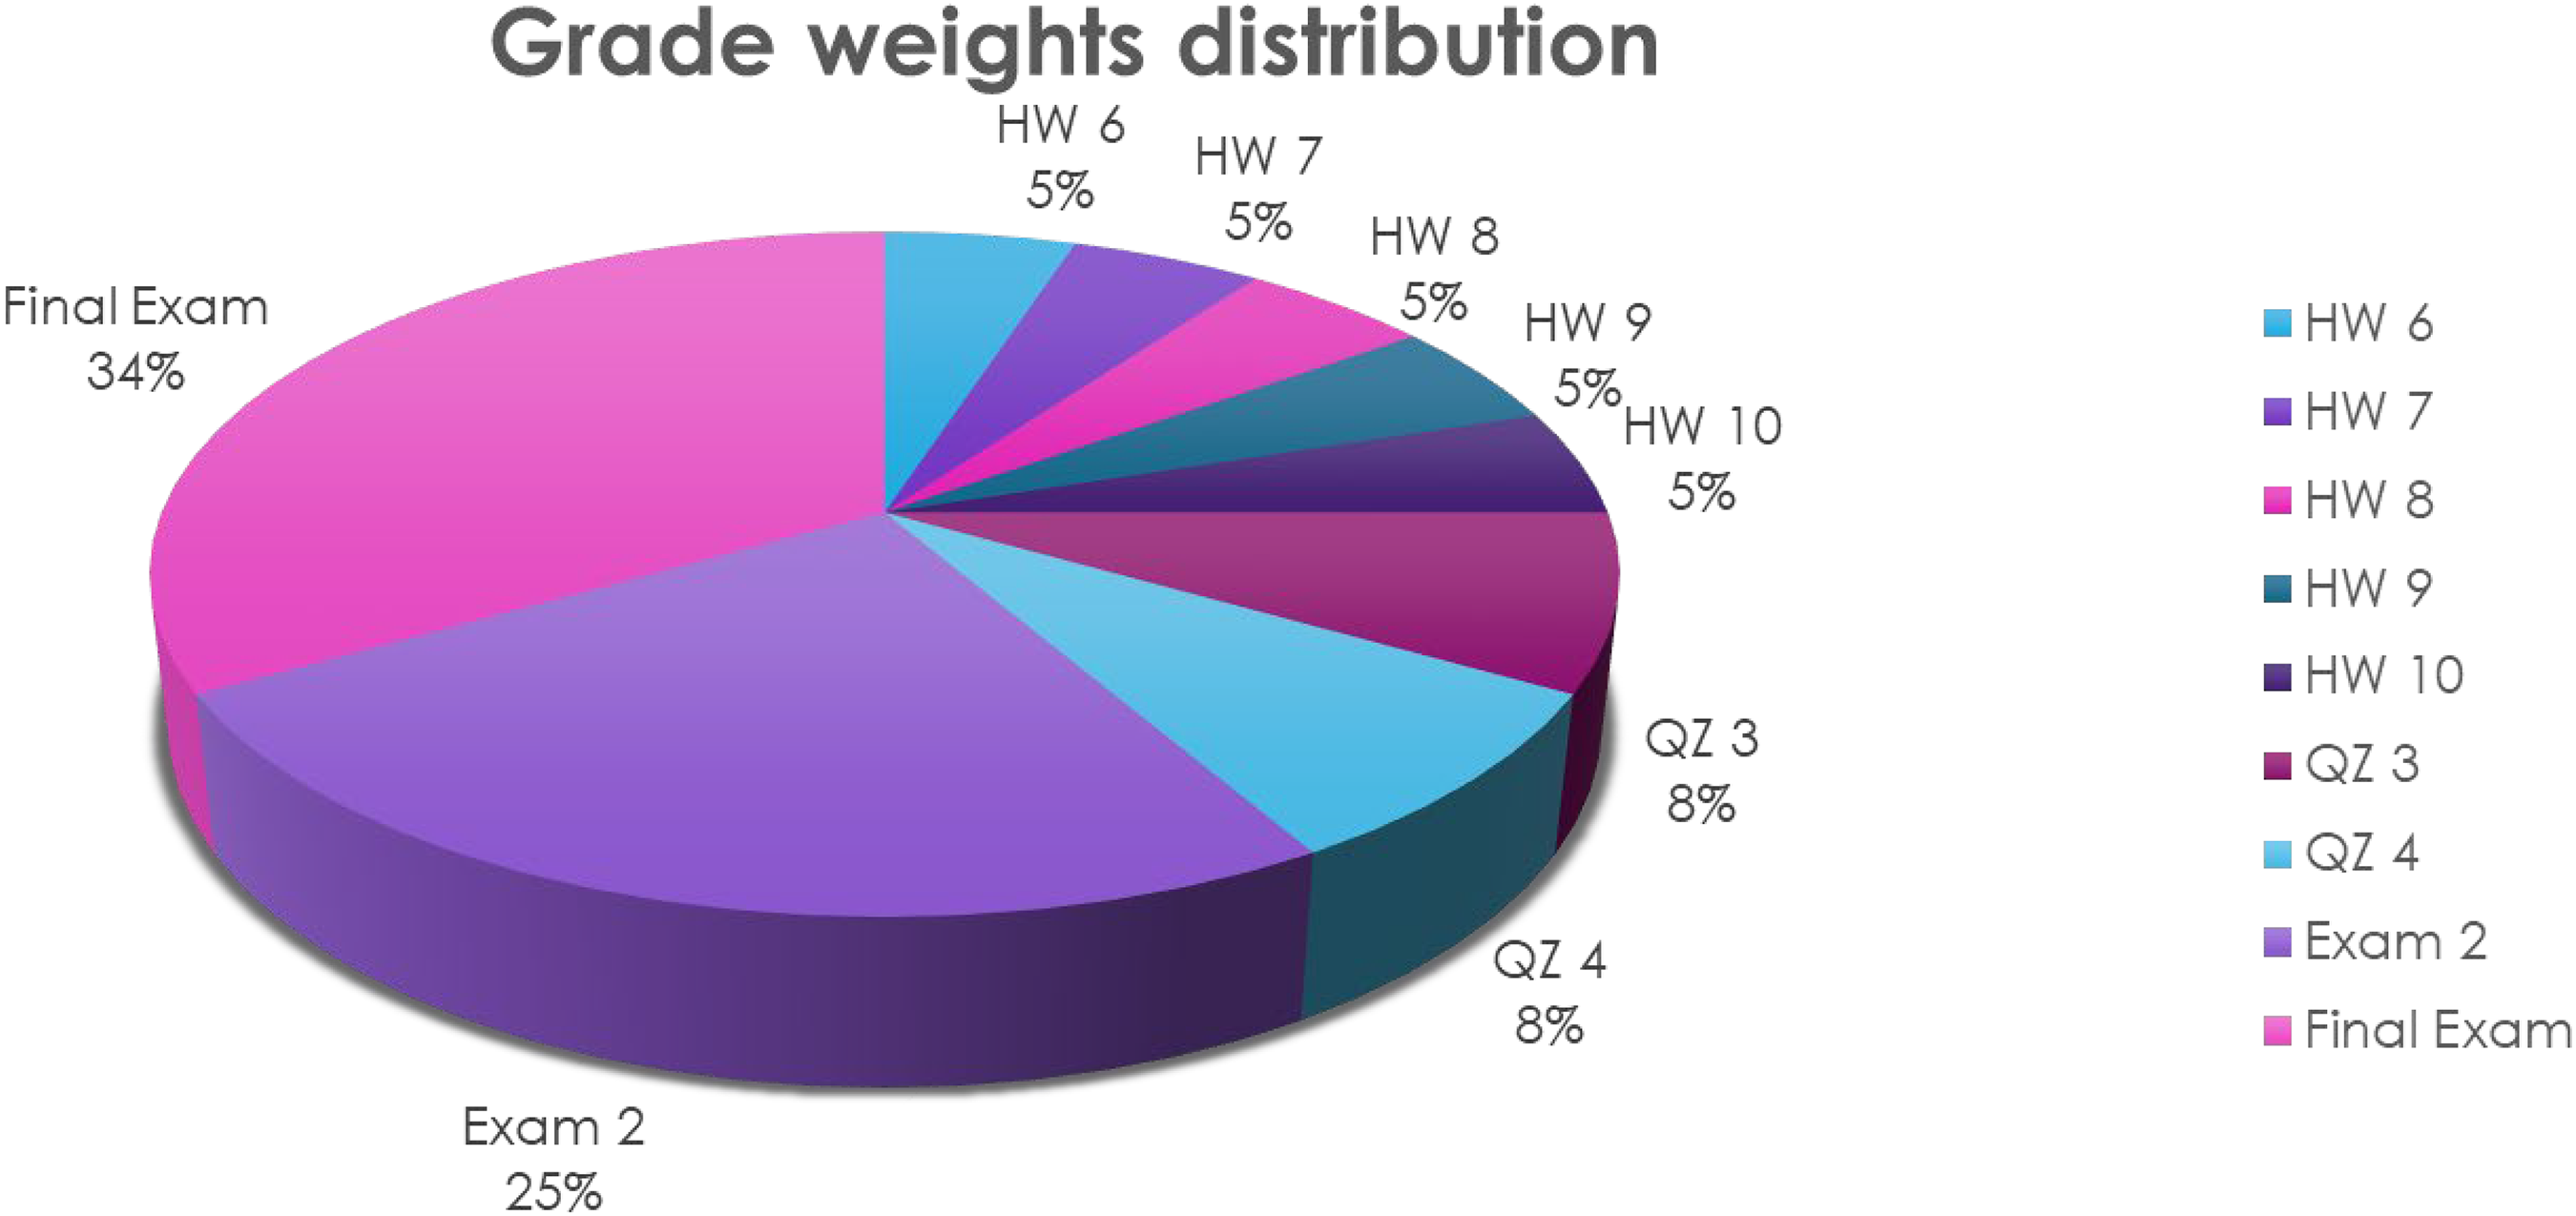
The sample weight distribution of constituent assessments.
Students’ comments sentiment score
We also developed a sentiment analysis score factor which is calculated by analyzing the students’ text-based feedback (on the final course evaluation). Sentiment analysis can detect positive or negative sentiments in text. We took the feedback from students and essentially classified the text into positive, negative, or neutral sentiments. This way of assessing a text is referred to as the polarity of a sentence, which can be used to identify feelings, emotions (angry, happy, etc.), and intentions (interested vs. not interested). 28 In Figure 2, we focused on identifying students’ emotions toward the classes.
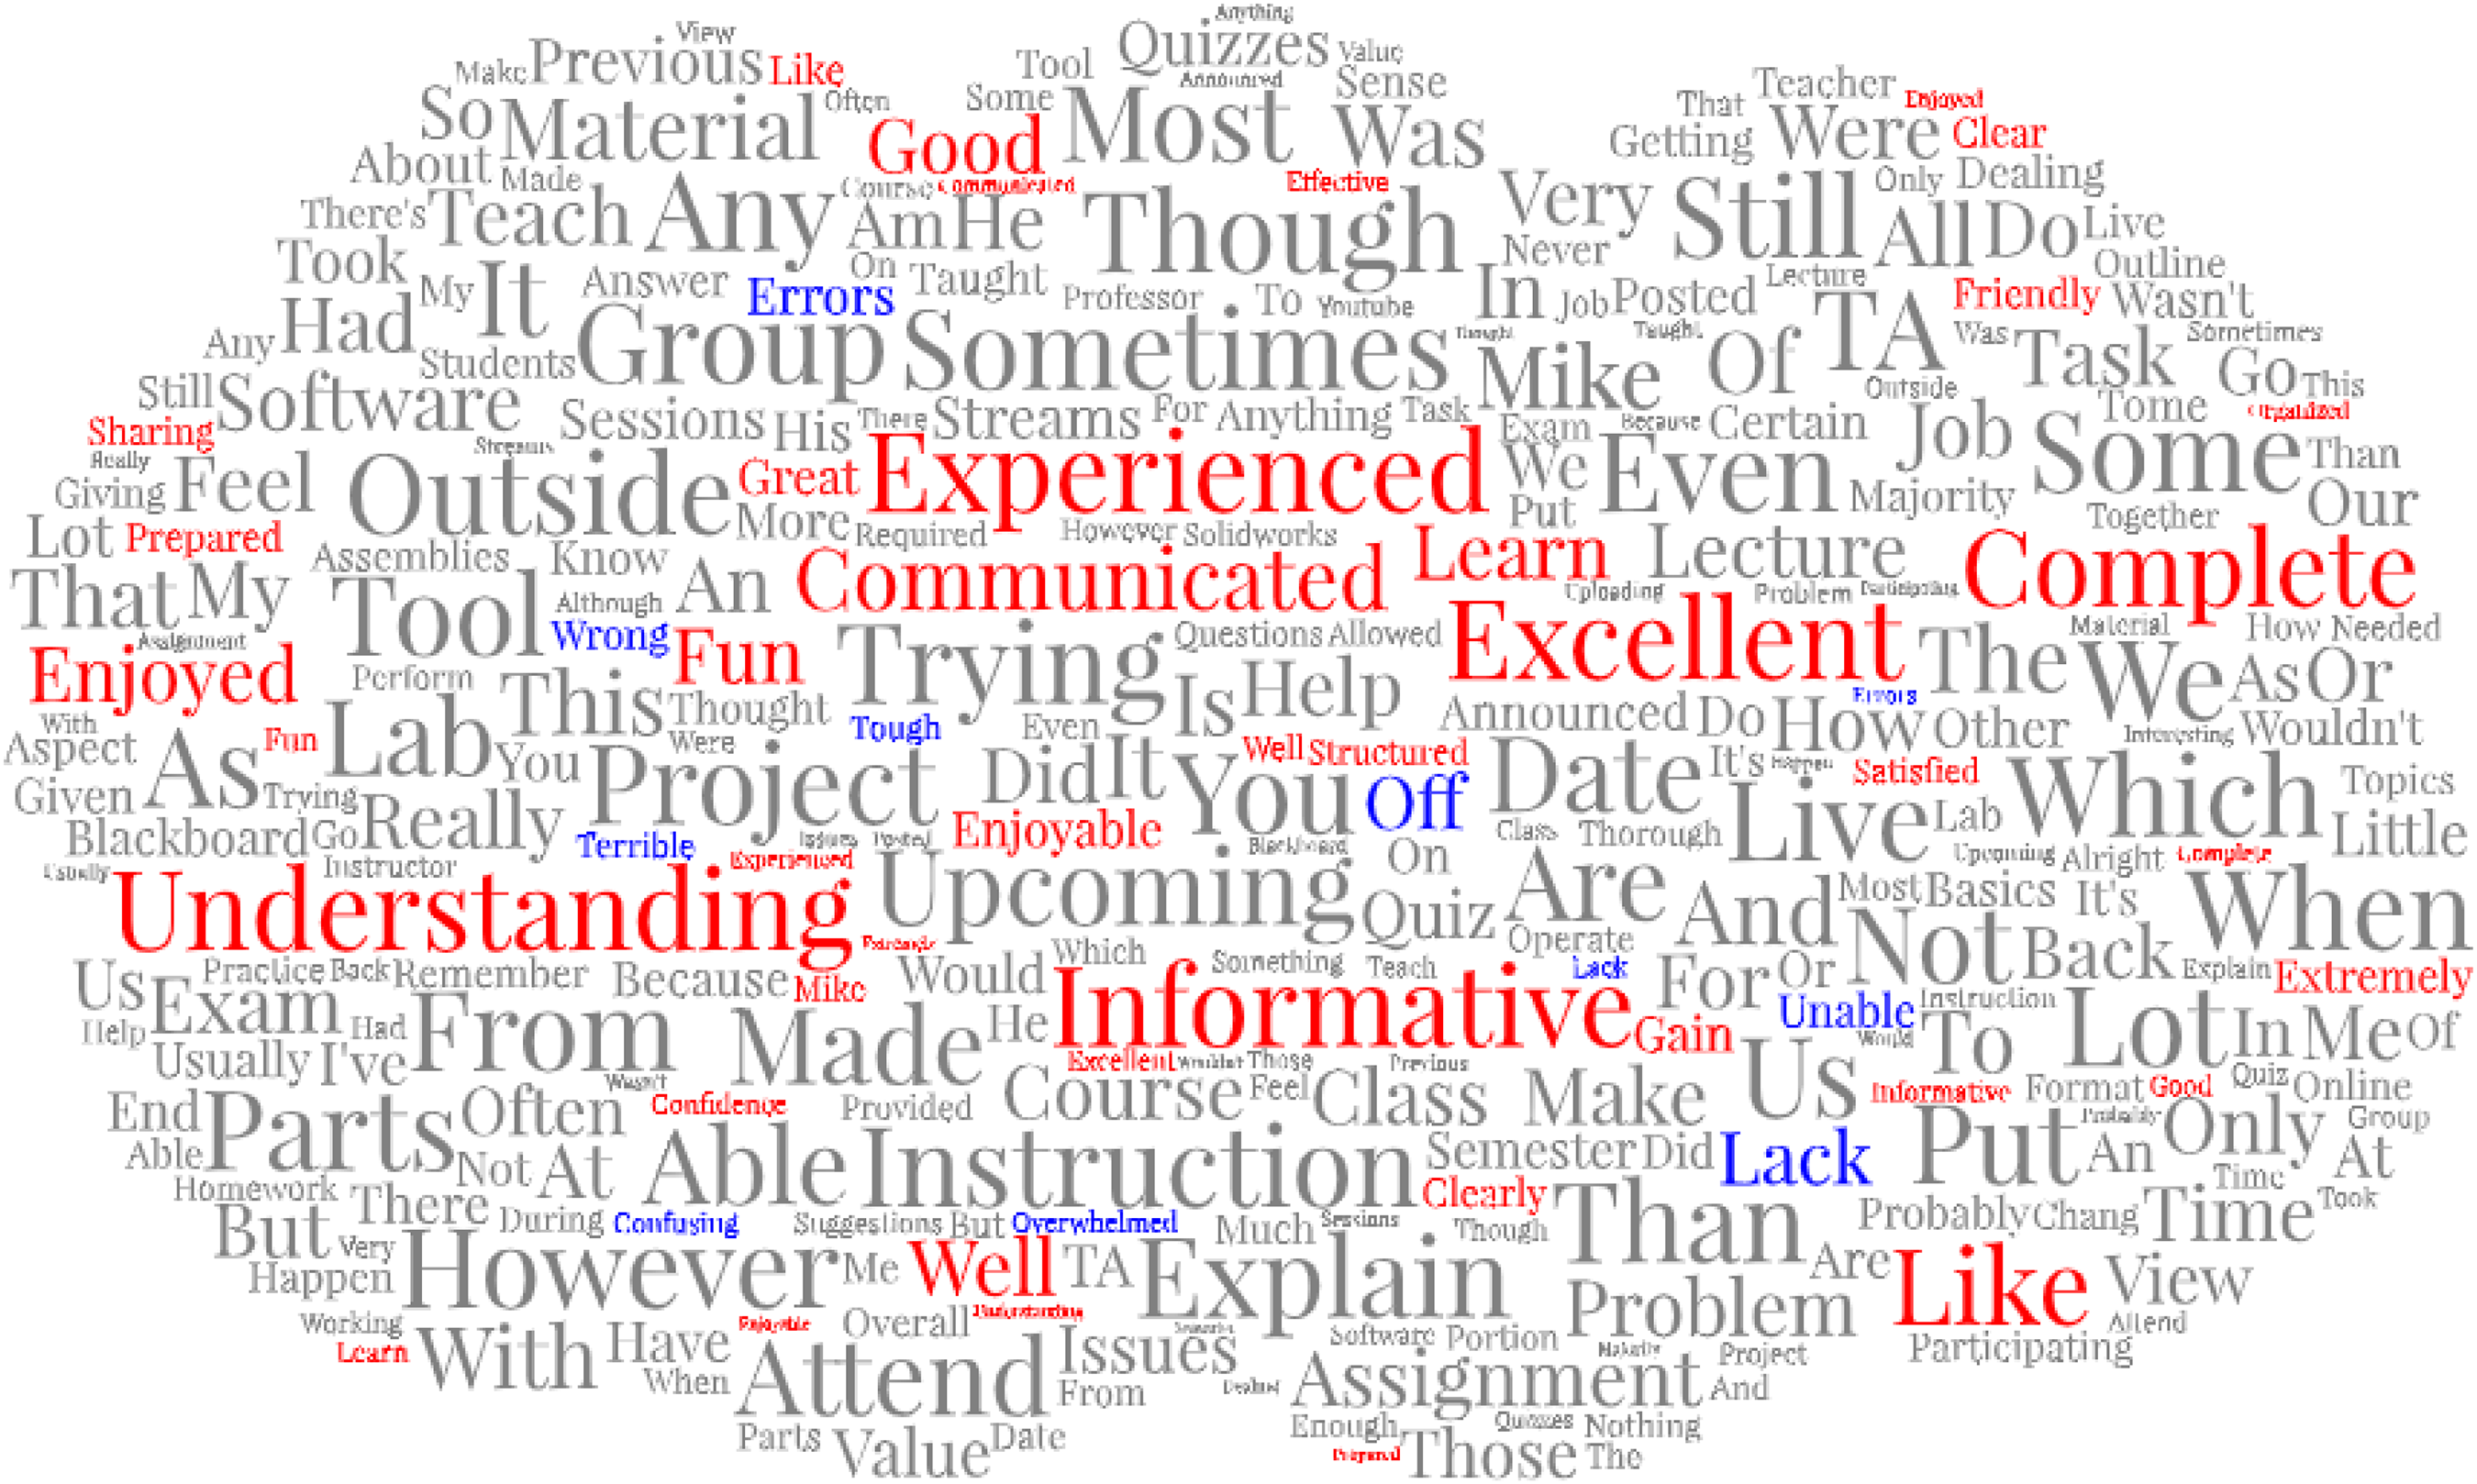
Example word cloud of possible positive and negative sentiment words. Color legend: red as positive sentiment, blue as negative sentiment, and gray as neutral sentiment.
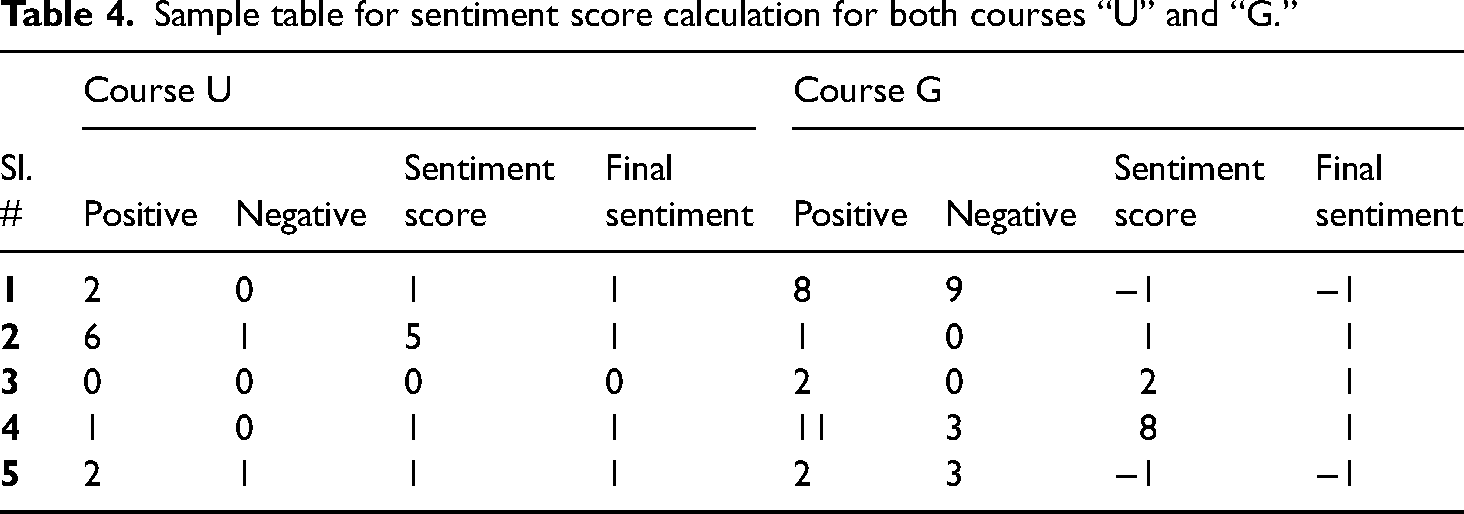
The algorithm counts every single positive and negative sentiment word from the students’ feedback collecting sheet. It summarizes the total sentiment by subtracting the positive number from the negative. This algorithm also takes into consideration the context of a sentence. Each positive sentiment context is represented by “+1,” a negative sentiment context is identified by “−1,” and a neutral sentiment by “0.” Using these measurements, we count the numbers of both positive and negative words within a sentence and compute the final sentiment score. If the final score is positive, then the sentiment is positive; if the score is negative then the sentiment is negative; otherwise, neutral. This gives the scanned sentence a broad scope of sentiment. The sentiment score also gives us a sense of how strong their sentiment is toward class. For example, a score of “+5” means the students’ sentiment is stronger towards the class than a “+1.” The sentiment score does not have an upper limit, thus the stronger the sentiment the higher (for positive)/lower (for negative) the score will be. The only constraint to this algorithm is it simply looks into positive or negative words (or lexicons). Consequently, the accuracy is limited since the same word may express different feelings, such as “the explanation was short and clear” versus “the explanation was long and confusing.” Table 4 shows the part of the sample sentiment scores with positive and negative sentiment count.
Sample table for sentiment score calculation for both courses “U” and “G.”
Students’ feedback per lecture
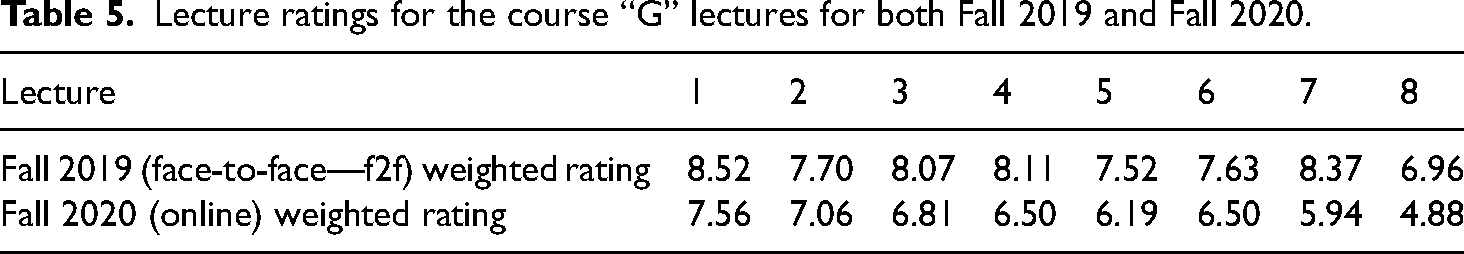
To support the evaluation, we also developed an additional measurement to improve the class lectures and assignments. This measurement can be used to improve the quality of the courses during the semester and afterward to restructure the course for the next semesters. The score is calculated on a scale of 0–10. At the end of each lecture, the students are given a survey to rate the lecture and provide comments. The survey needs to be completed before the start of the following lecture. The collected rating is then weighted and averaged as shown in Table 5 to calculate the feedback score of the lecture. During the process, we realized that it is a great practice for continuous improvement, and we strongly suggest implementing it as it gives instructors immediate feedback that can help them dynamically update their teaching methods to tend to students’ needs. Additionally, if feedback comments are available, sentiment scores can be calculated and added to this measurement. For Fall 2019 (f2f), the average score of eight lectures was 7.86 with the lowest score of 6.96. For Fall 2020 (online), the average score for eight lectures was 6.43 with the lowest score being 4.88. Coincidently, both the lowest scores were from the same lecture (no. 8), and indeed it was one of the more complex topics. It is evident that during online sessions, the scores were somewhat lower than in the f2f classes. Thus, it shows the need for improving new courses further.
Lecture ratings for the course “G” lectures for both Fall 2019 and Fall 2020.
Students’ retention per lecture
Most online platforms like Blackboard and YouTube provide a user retention statistic for any number of uploaded materials like videos that are being watched by the students. It is calculated by measuring how long the viewer sticks with the content of the video. This can be used as a measurement to analyze (whenever available) how a lecture can retain the attention of students in skipping the video to watch only a portion of it. In YouTube analytics, this is called the average percentage viewed (APV). Figure 3 demonstrates the viewing ratio of every second within the video from all visualizations. This study collects the APV of every lecture video, but without the breakdown, and view ratio to reduce the complexity.
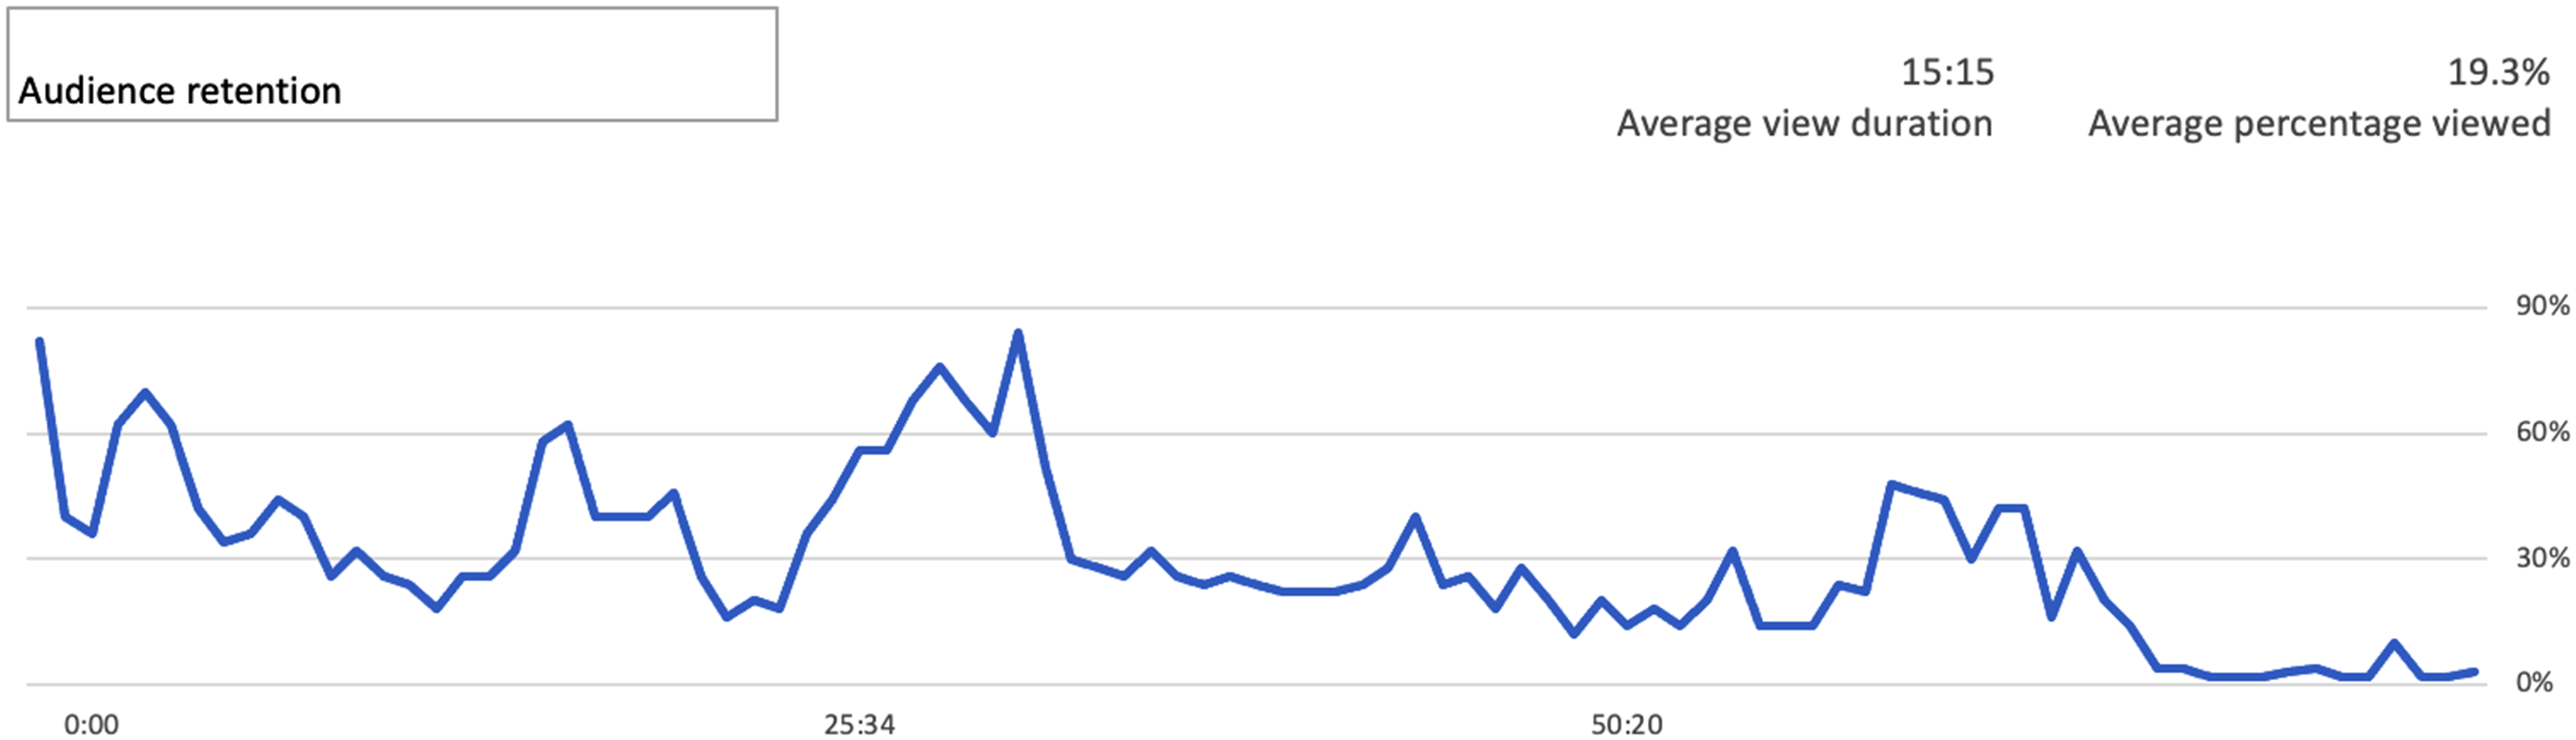
YouTube average percentage viewed feature.
Figure 4 shows different class sections identified as L1 and L3 from here, which have different class times. Class L1 starts at 8:30 a.m. and class L3 starts at 10:00 a.m. From Figure 4, we can tell the L3 students are showing higher attention to the class. According to the experience in meeting interaction, L1 students may come back later to watch the lectures due to an advantageous set-up of online teaching. Additionally, the APV of L3 shows that most 2020 spring classes have 20% to 40% of the video being viewed. Students usually skip the video directly to the sections with critical notes. Our interpretation is that this is a way to increase learning efficiency.
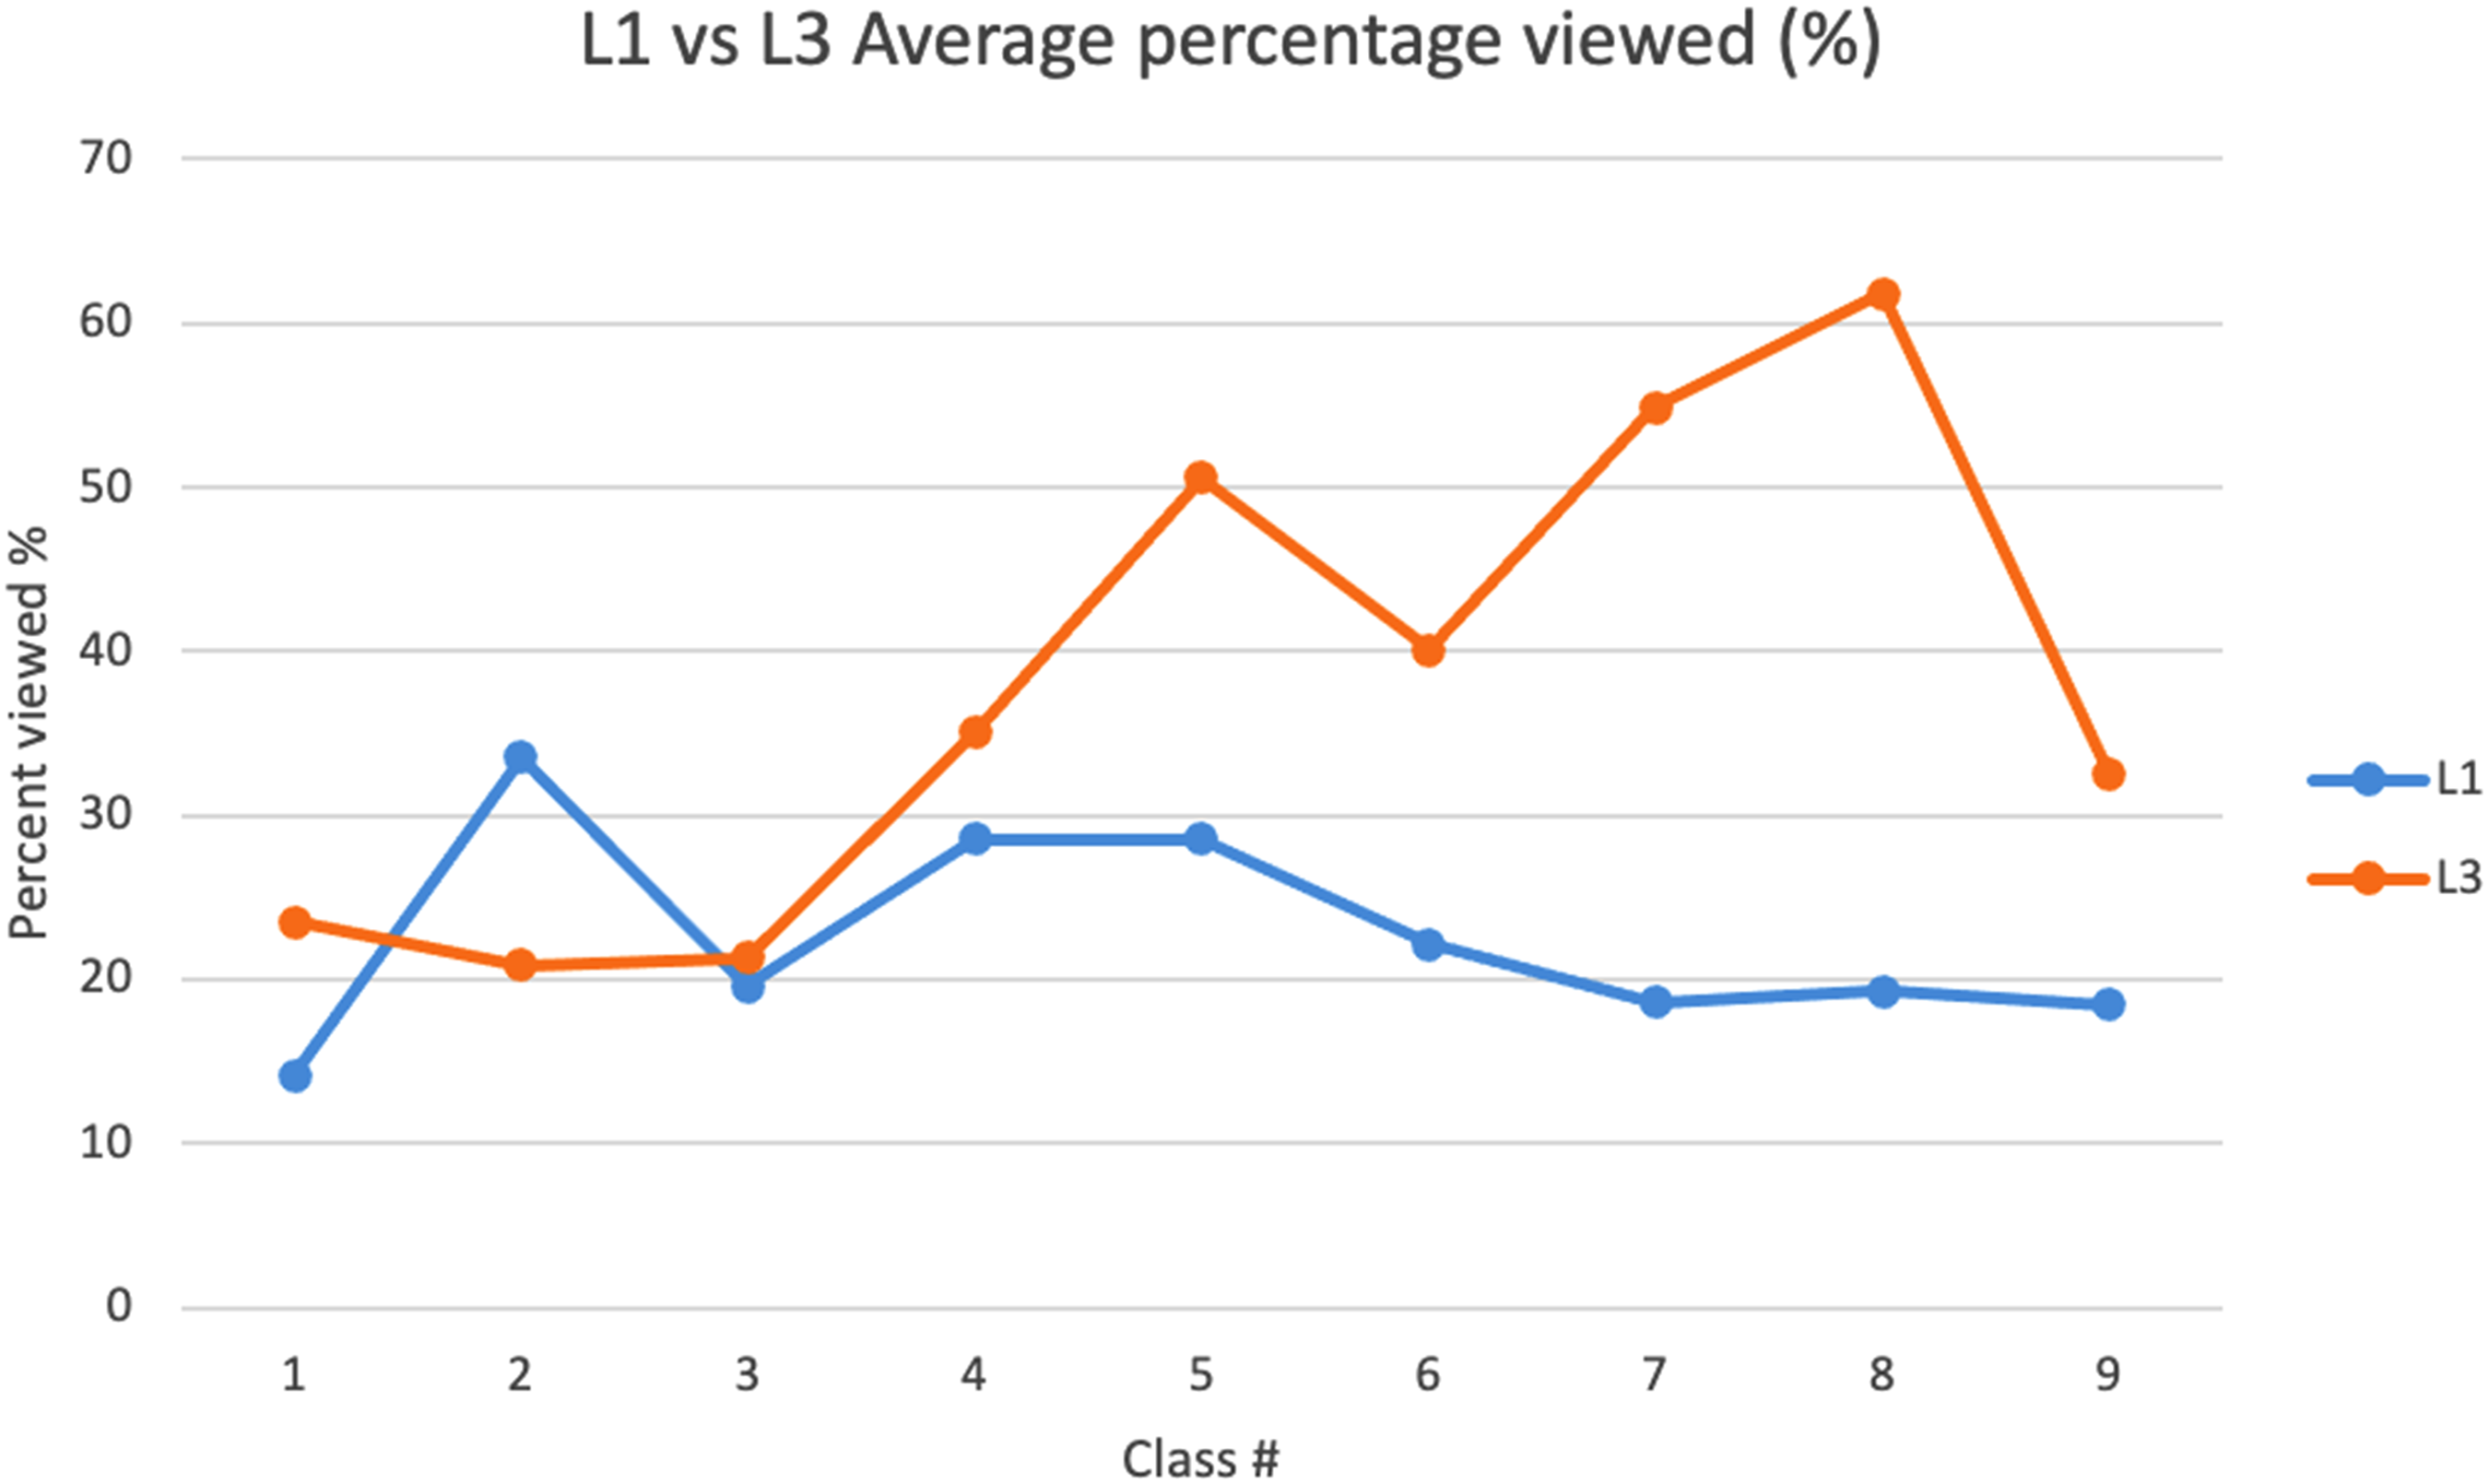
Comparison of sessions L1 and L3 average per view score (APV) of Spring 2020.
Combined scoring function
While the individual scores provide a sense of the student's performance and their thoughts toward the class, we are also interested in looking into the overall performance of the classes. For this, we combined all the calculated scores identified earlier and generated a weighted average to analyze the overall difference between f2f and online setup. The formula for the overall score is defined as equation (1):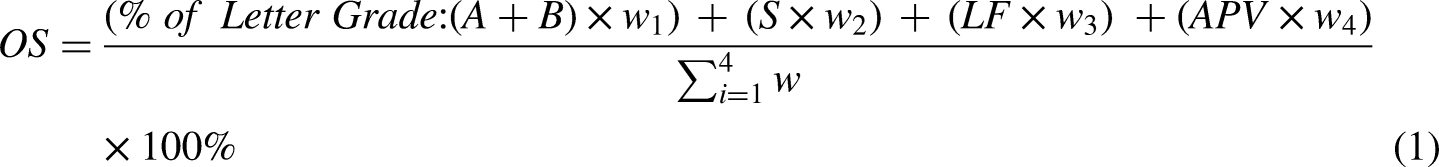
DMAIC: Analyze phase
Analyze phase: Course “U”
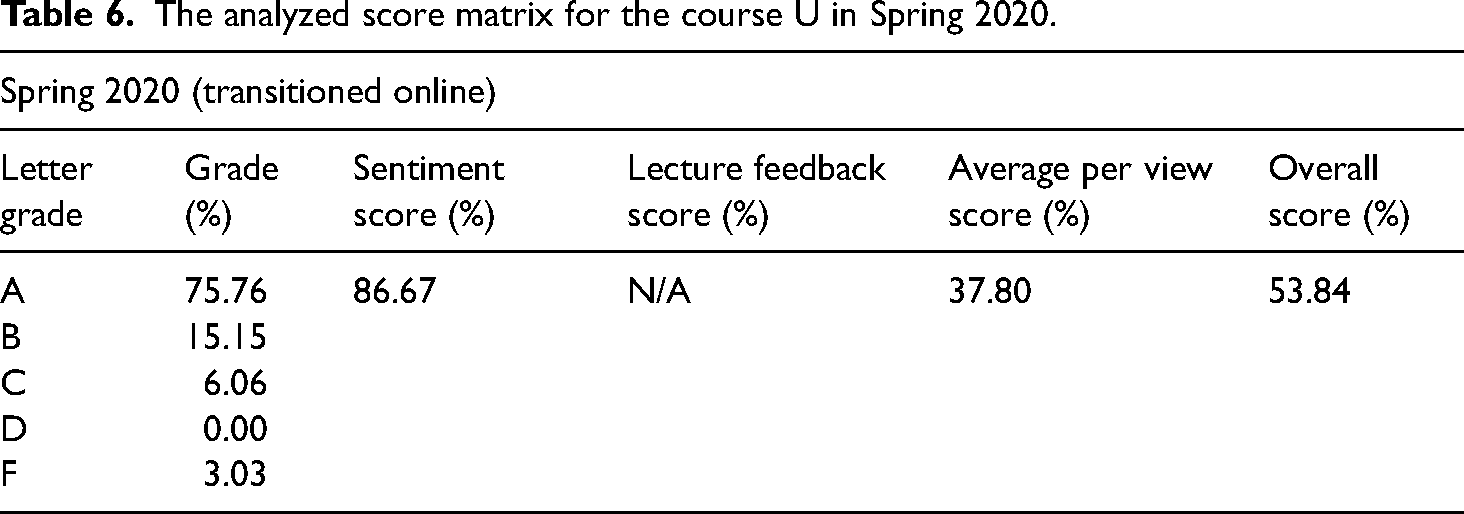
Spring 2020 was a mixed-mode semester, where the students started as f2f but later transitioned to online mode. After analyzing the student comments and overall scores based on the discussed metrics in the Measure section, the results of course “U” are shown in Table 6. In the lack of comment data and lecture feedback scores, we select spring 2020 for course U as the baseline. Also, the identified root causes for student dissatisfaction arose from several issues. For the undergraduate course, these appear to be dominant.
communication gap (as all communication systems just transitioned online), scattered homework and exam information, and reviewing the capability of the course material and Q&A session.
The analyzed score matrix for the course U in Spring 2020.
Analyze phase: Course “G”
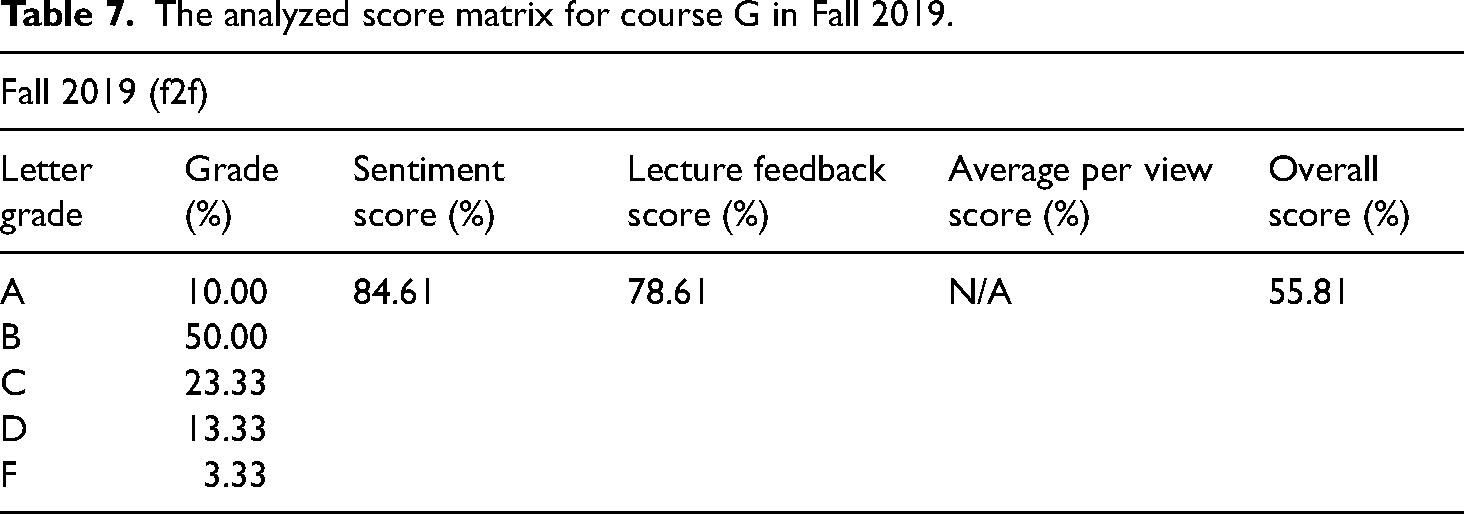
The Fall 2019 course was a f2f class. The instructor adjusted course materials as per students’ feedback mid-semester to better support the student experience. Fall 2020 was the first time the course was taught completely online, but the instructor implemented some of the lessons learned from the Fall 2019 course and Spring 2020 “U” course. After analyzing the student comments and overall scores, based on the discussed metrics, the scores for the course “G” are shown in Table 7.
The analyzed score matrix for course G in Fall 2019.
As Lean Six-Sigma dictates, continuous improvement is necessary for all systems to maximize the performance for customers’/users’ satisfaction. In this case, it is to be done for the student’s learning experience. Based on the feedback and negative sentiment keywords, most students are concerned about:
The way exams are conducted. Ideally, an exam should be set in a way to check the students’ fundamentals. Rather than set math/engineering problems, students should be assessed on how well they understand a concept and approach to an open-ended problem, or maybe a practical problem. The second most requested issue was additional resources. Instructors can provide additional resources. They do not always have to be lecture or tutorial videos. They can be recently published manuscripts in the field, books with workout examples or new knowledge, and YouTube tutorial videos.
While the overall score gave us a quantitative measure of the classes, we still need to identify the issues to improve the quality of the class. The Fishbone diagram is a very effective Lean Six Sigma tool for root-cause analysis. After analyzing the student comments from both classes, a generalized fishbone diagram (Figure 5) was developed to identify the issues students were facing. The voices of the students identified above led us into the Improve phase described next.
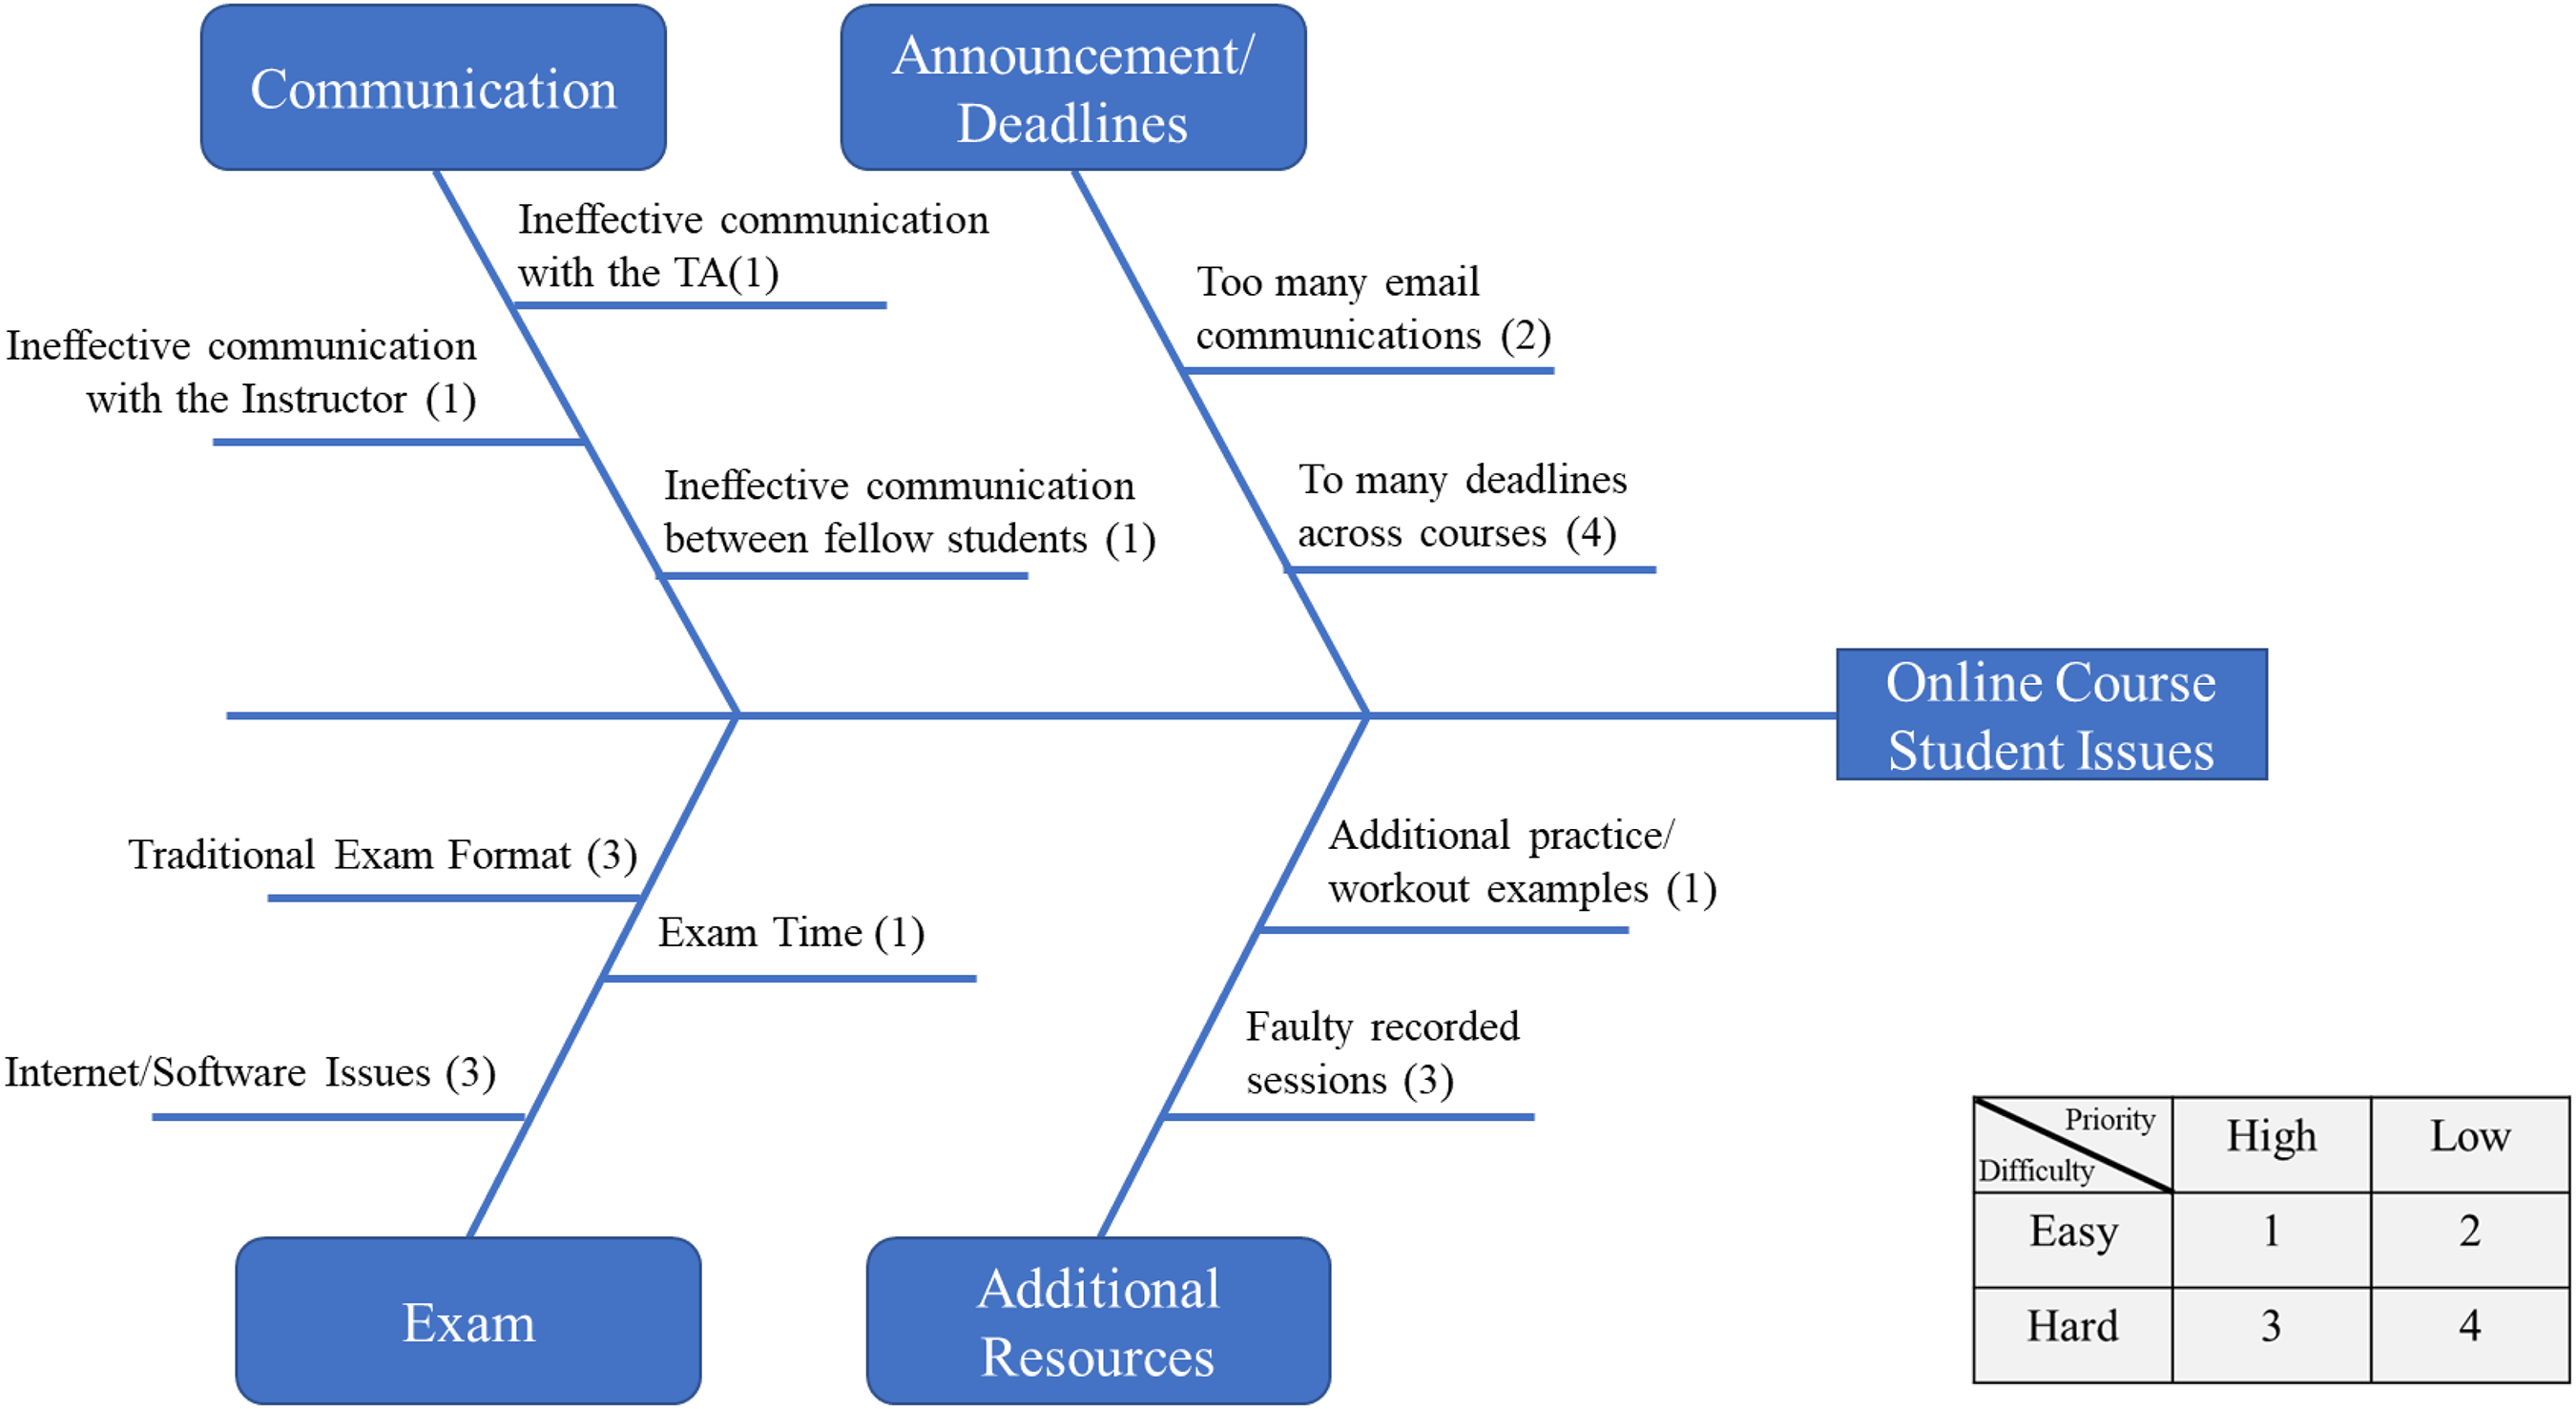
Fishbone diagram identifying the root causes for disruption in an online course.
DMAIC: Improve phase
To improve the learning experience, the identified root causes were primarily focused on, and the following suggestions were developed accordingly.
Improvement of communication: To better promote and improve communication between instructors, teaching assistants, and students, an online discussion forum has been established. Course G opened team discussion groups in Microsoft Teams for the students, which improved the communication between all parties. The students could instantly reach out to instructors within a given timeline every day. The average feedback time to students’ questions was recorded as 11.7 h. Assignment information: The deadline for assigned tasks and exams are to be posted on Blackboard a week before the systematic review, and a supporting website was also established. Availability of review material: All recorded media are made public for all students at any time throughout the semester. Moreover, class schedules are rearranged to allow a joint Q&A session to reduce instructor fatigue. Availability of online exam format: We faced plenty of software issues during the online setup, thus we transform the traditional exam format to internet-based testing by giving a customized submission link, cheating-proof questions, fair timing, and a standardized grading sheet.
For the course “U,” L1 session, students can join the live lecture for the whole 75 min plus another 90 min of real-time Q&A. For the L3 session, they can either choose to join the L1 session or enter the class online during the L3 session but use the rewind option to rewind to the earlier lecture and start their class. Whenever the student in the L3 has a question, he/she can scroll the YouTube video timeline to the end to join the shared live Q&A for instant assistance. Afterward, they can rewind to continue the lecture video. Figure 6 shows the improvement plan for this step.
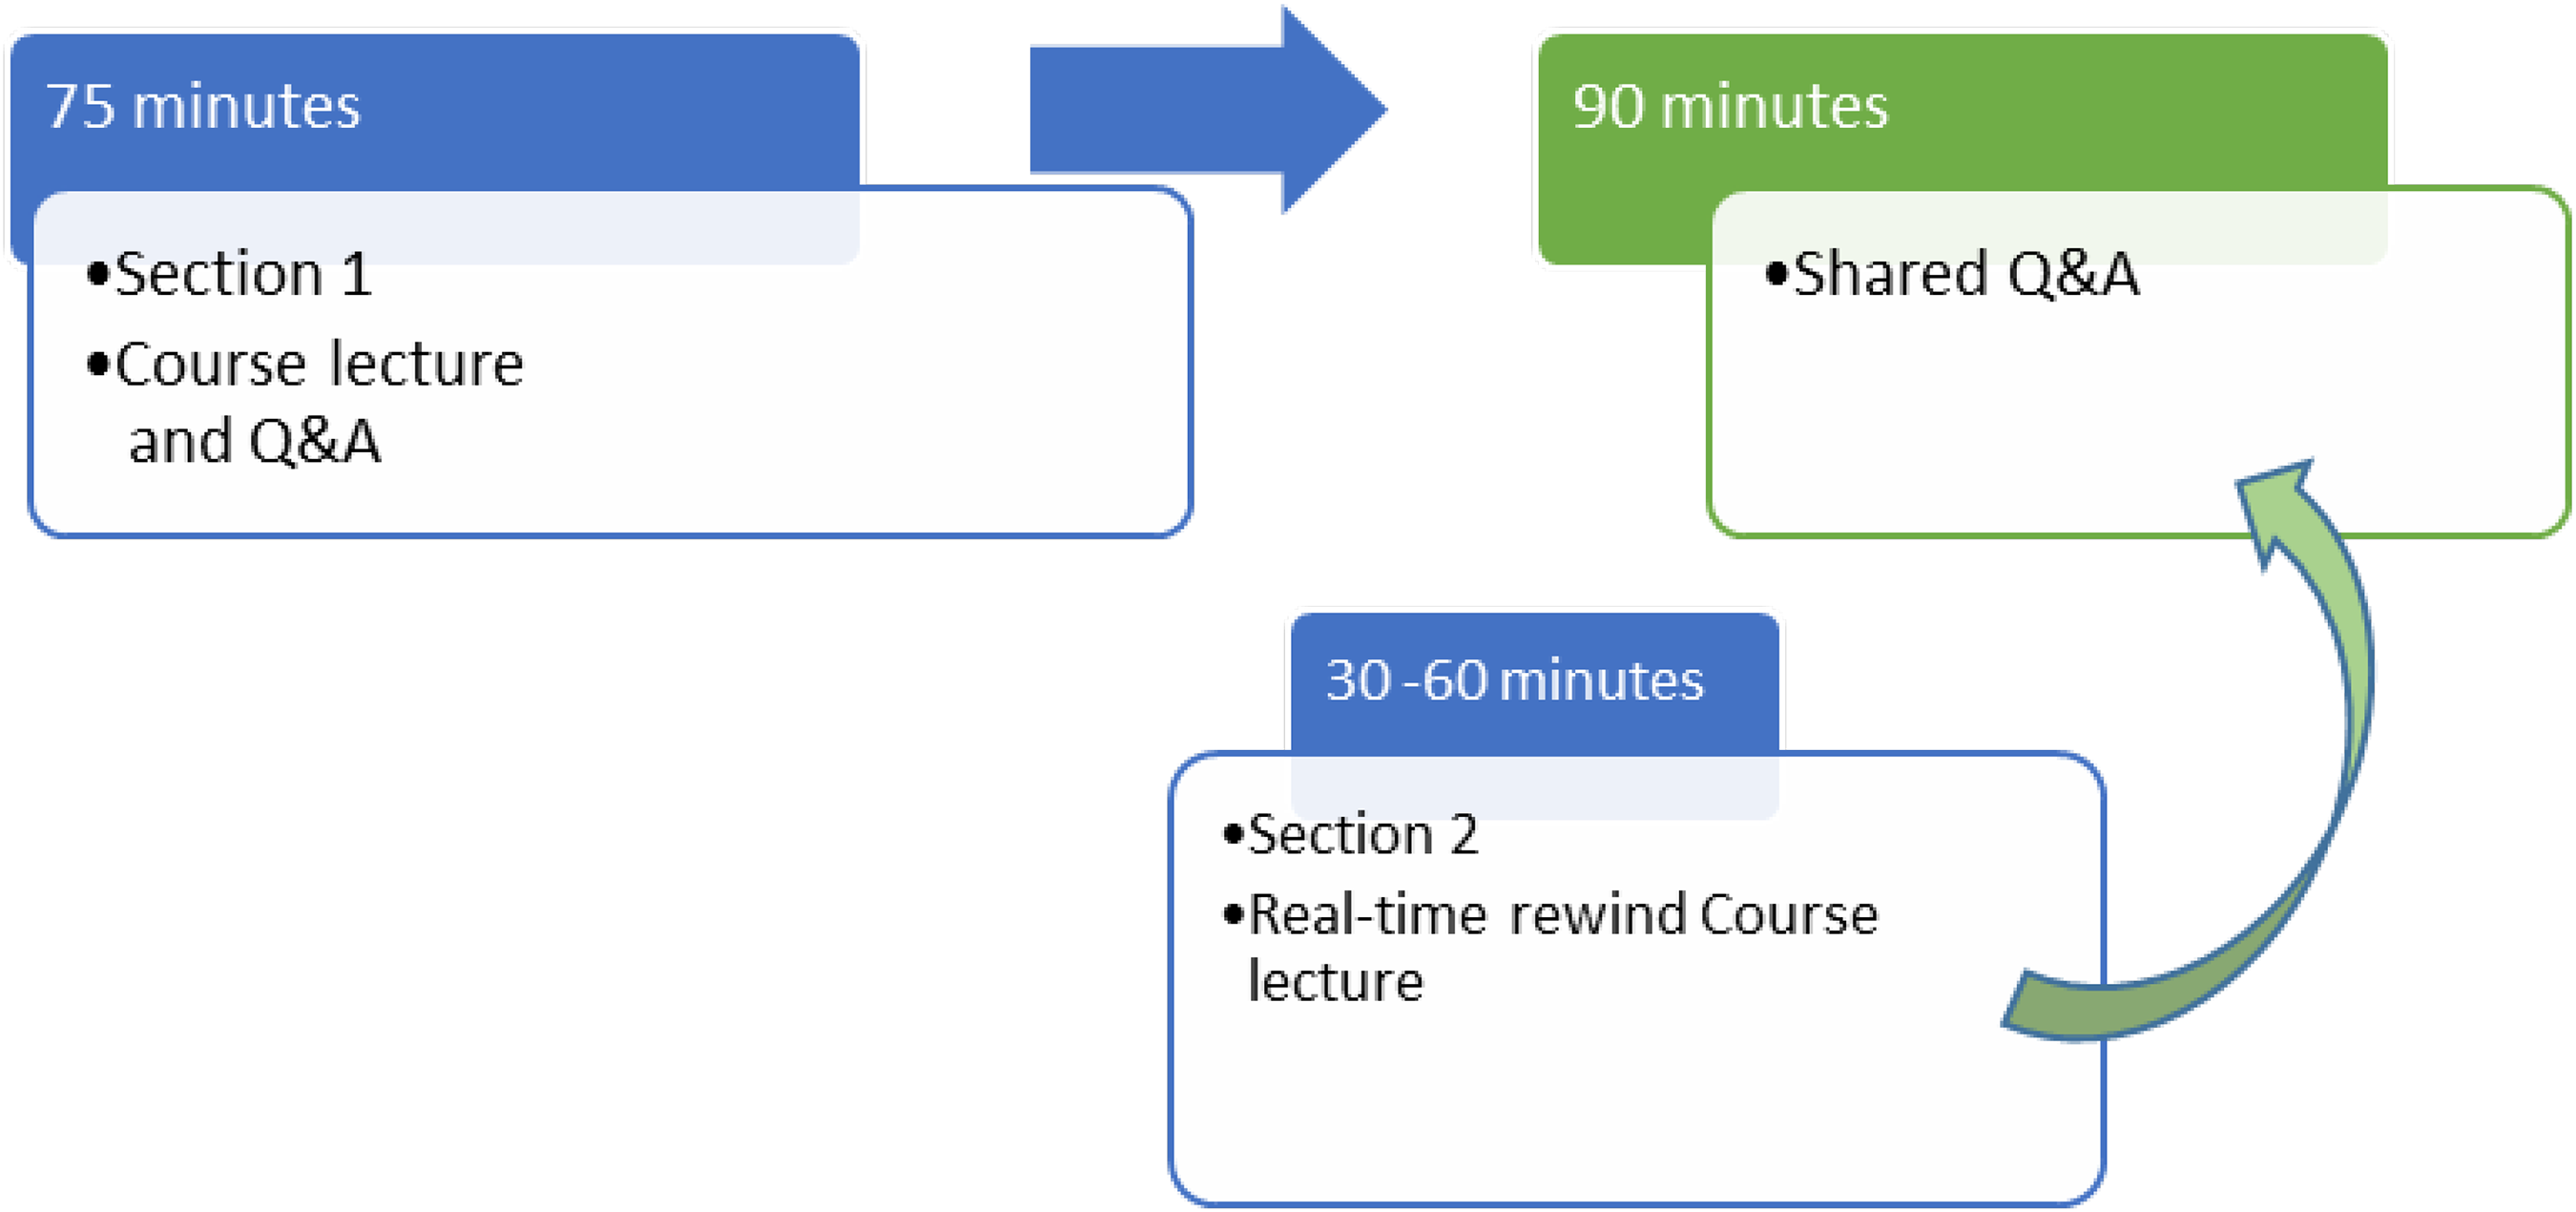
Modified class agenda for the 2020 fall semester (fully online).
For the course “G,” before every exam, an hour-long Q&A session was arranged. These sessions would also review the course materials in a summary format. In addition, to supporting the Q&A for homework, the discussion board was utilized. The instructor is available every day for a period of hours online, where the students can join the discussions. Outside the set hours, the instructor answers the questions at their availability.
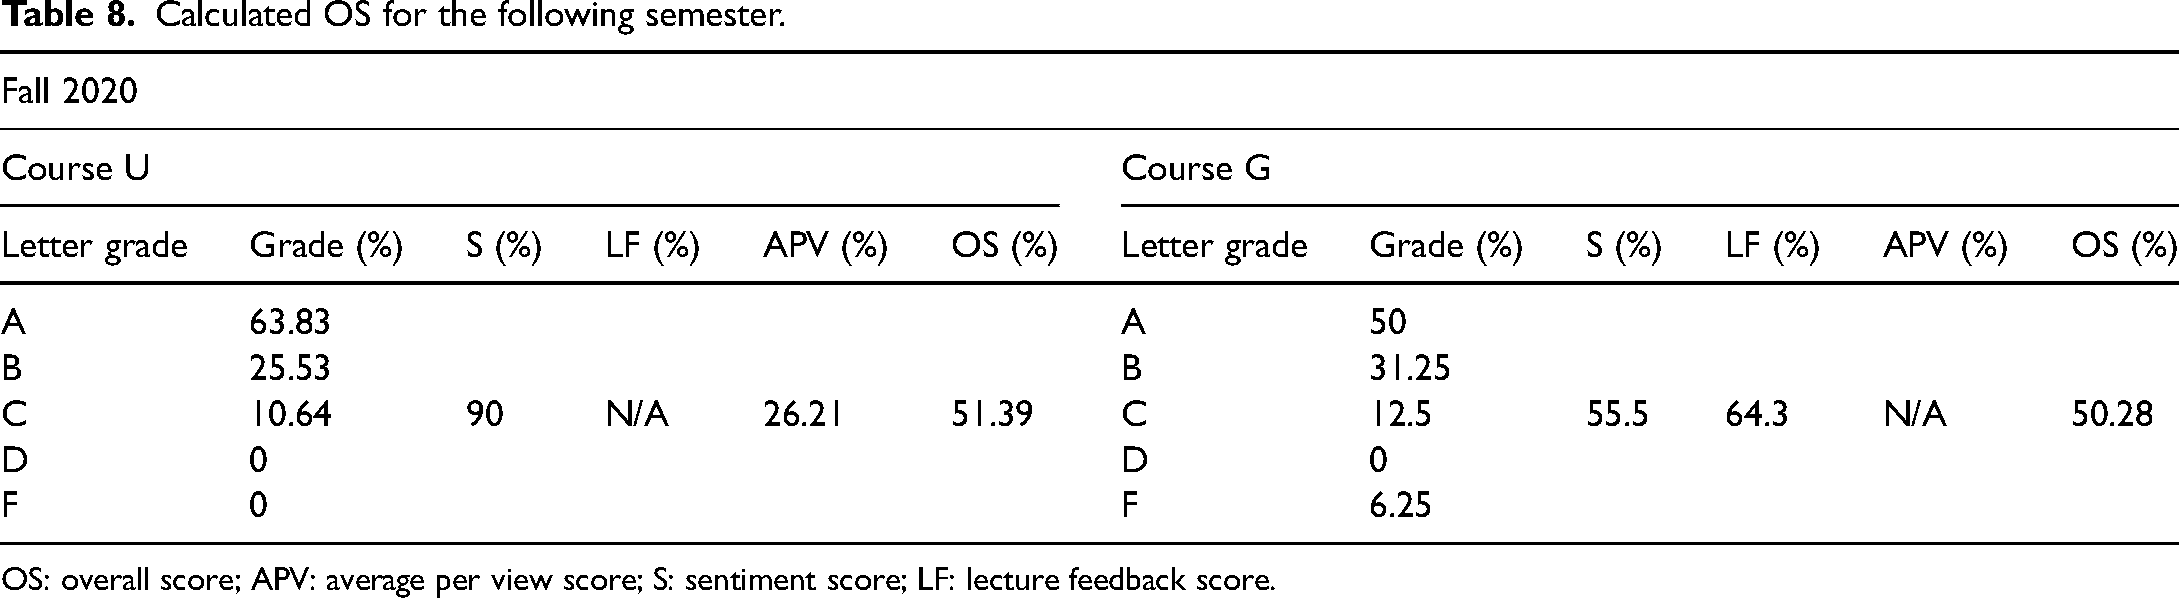
Looking into our developed scoring system in Table 8, we notice there is a jump in student morale (sentiment score) from 86.67% to 90.00%. However, the APV score has fallen from the previous score. Based on our observations, this is because students, instead of watching the whole video, focused more on the key points, and thus, reduce the APV score. One crucial point that came out of this analysis is the assessment venue, that is, exams, of the course. Setting an optimal exam scenario with ample support still needs additional thinking in the future. This is reflected in the drop in the number of A grades. The same trend was seen with course G. While the A grades have significantly increased due to the changed philosophy in exam criteria (24 h open book exams), this was not the case for the first midterm. The instructor utilized the feedback from the students to set the rules for future exams and relaxed the weights for the first exam. Note that this was the first time the course G was taught in an online format. Thus, the sentiment score took a big hit, and it went down from 84.61% to 55.55%. The overall score, of course, G has also fallen. Analyzing the comments from the students revealed several sources that can be solved in the next improvement cycle (next course cycle).
Calculated OS for the following semester.
OS: overall score; APV: average per view score; S: sentiment score; LF: lecture feedback score.
Improvement
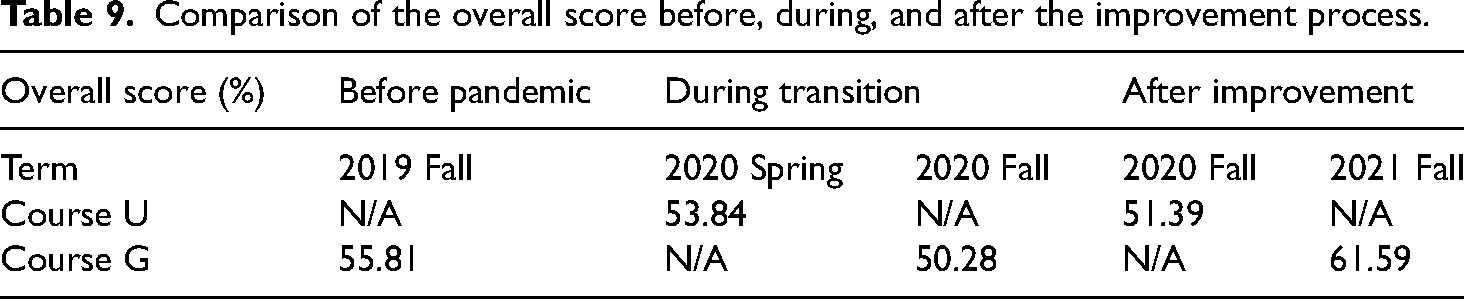
To validate the impact of the improvement suggestions, grades for the following semester were collected and compared with the baseline data to see if the changes affected the learning quality in Table 9.
Comparison of the overall score before, during, and after the improvement process.
DMAIC: Control phase
Based on the secondary analysis of the course scores, we sustain the online learning practices to maintain the students’ learning experience. The suggestions to instructors for transitioning to distance education are:
A good set of video/audio recording equipment increases the students’ wiliness to enjoy the lecture. Provide an online chat room to receive instant lecture feedback. Increase the strength of course projects which need more independent study. Avoid standardized or reused exam question which is hard to monitor. Keep active contact and announcements to the student to prompt attention every week. Analyze backend statistics frequently to address students who are fallen behind. Renew or review the video lecture every term to avoid dissatisfaction from students.
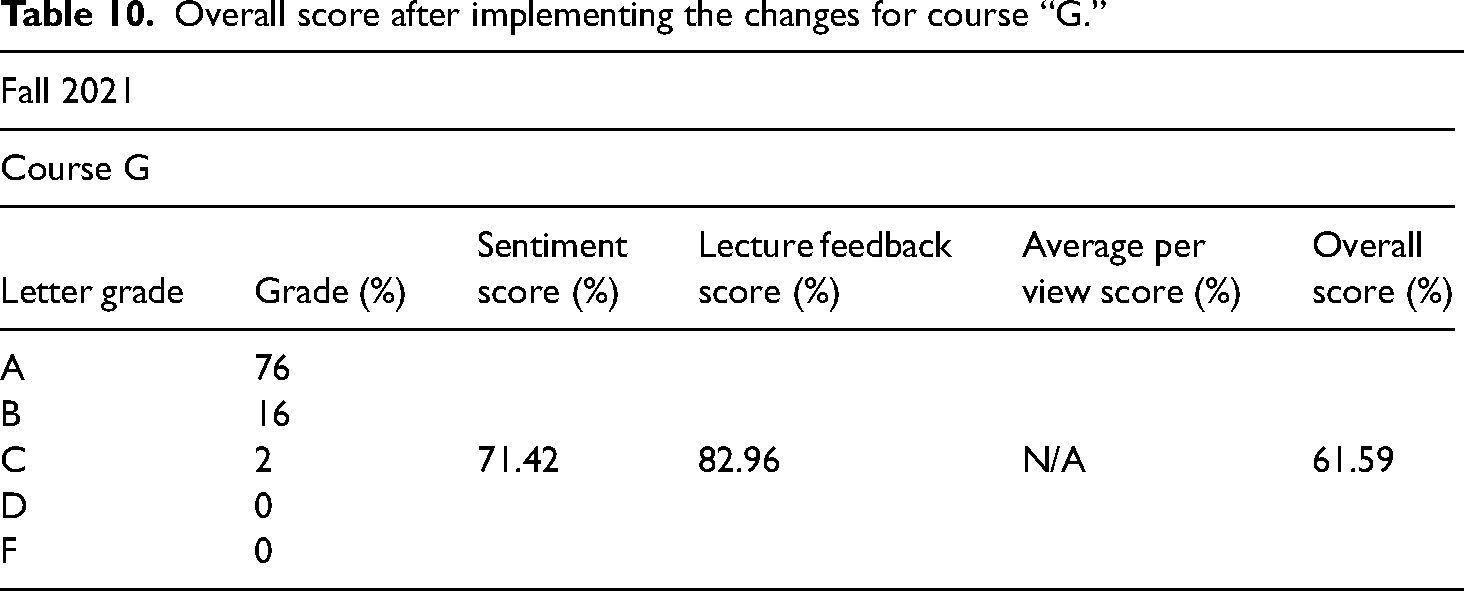
After two years of implementing the online lecturing improvement, we received an increased overall score from 50.28% to 61.59% shown in Table 10.
Overall score after implementing the changes for course “G.”
Moreover, we collect the course evaluation rating from the UTSA anonymous survey system which provides the perceived favorability of online courses (PFoOC) with the scores in three courses delivered to the graduate course G from 2019 to 2021. Feedbacks were collected to assess PFoOC from UTSA Class Climate Evaluation Survey with:
The instructor clearly defined and explained the course objectives and expectations. The instructor communicated information effectively. The instructor was prepared to teach for each instructional period. The instructor encouraged me to take an active role in my learning. The instructor was available outside of class either electronically or in person. My overall rating of the course is. My overall rating of the teaching of this course is.
With a scale from 1 as strongly disagree to a scale of 5 as strongly agree. The average rate of each item is summed up to an evaluation rating as the profile of the semester. Looking at Figure 7, it is showing the evaluation rating drops during the first transition in the 2020 fall. Soon after, both overall scores of student performance and evaluation ratings from students shows an increasing trend telling the DMAIC process has successfully managed the improvement during the transition from f2f toward online learning.
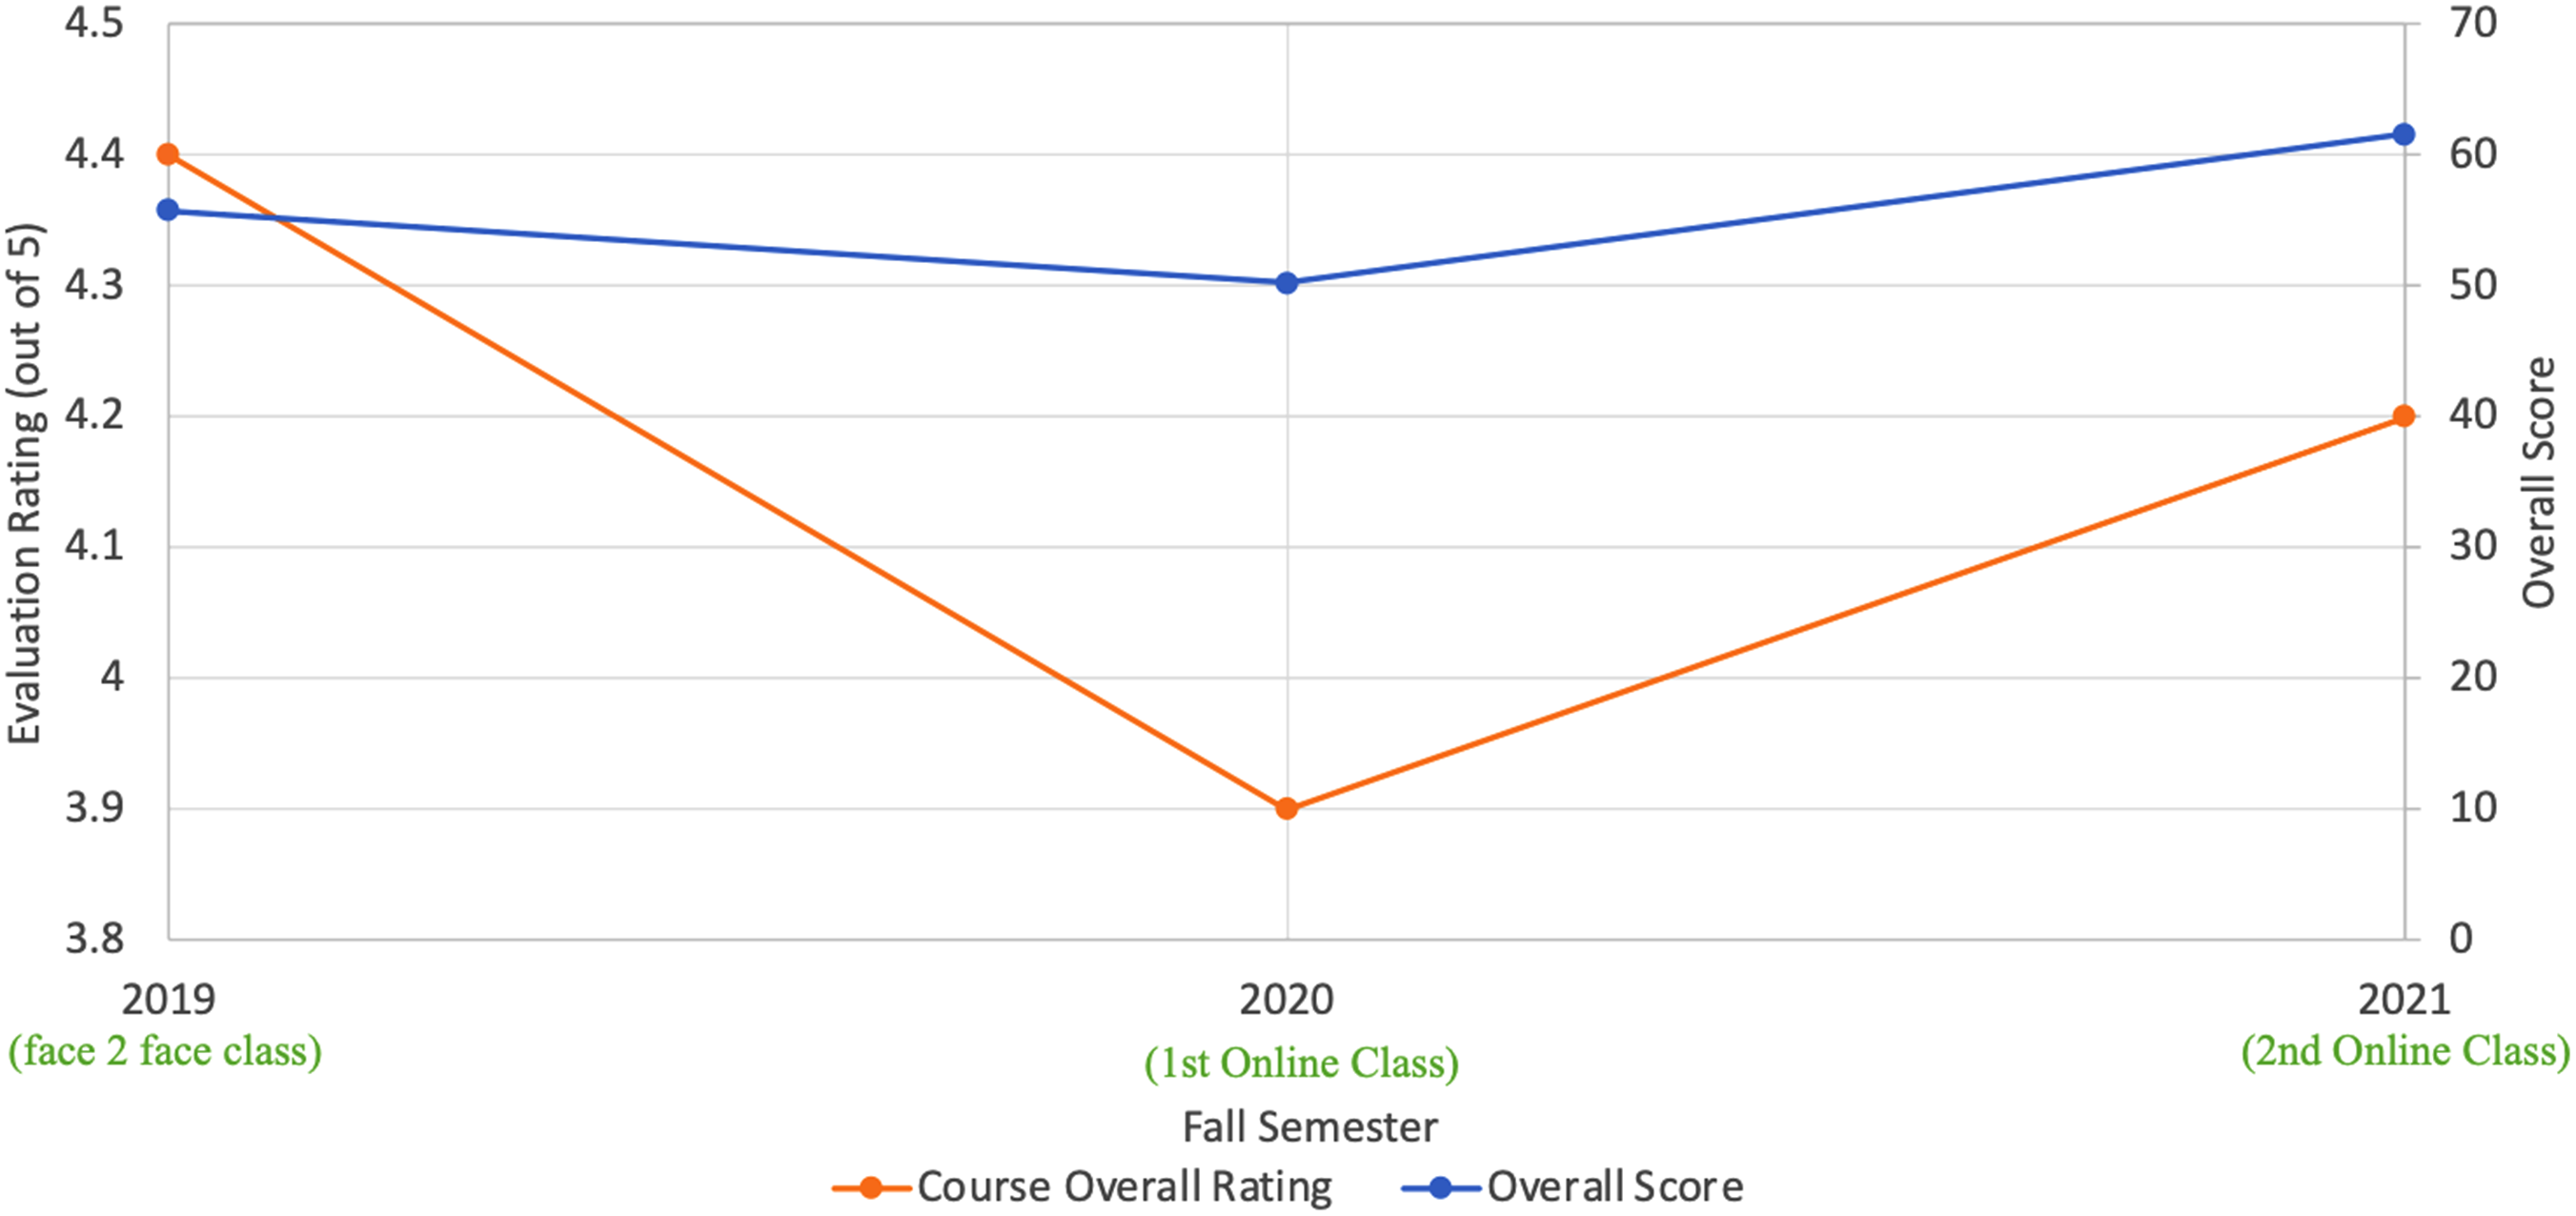
Summary of the UTSA course G evaluation score and overall score for three semesters.
Discussions and suggestions for online courses
The primary purpose of this study is to analyze the effect of transitioning education modality from f2f to online. While online learning gives the advantage of learning at one's own pace, it can also be a double-edged sword if students fall beyond their regular studies. Additionally, too much exposure to digital devices can put a lot of mental and physical stress. As students cope with the online platform, they tend to incline more towards improved learning, but this needs a little push and assistance from the instructor. While analyzing the student feedback, we learned that many of them prefer learning with additional workout examples and then discussing them with the instructors. Although in this study, we did not see any significant difference in teaching methodology, a few minor changes could undoubtedly improve the quality of learning for the students significantly. Also, in this process, the scoring function has been useful to assess the performance of online courses in both what the students’ comments are and how they behave when taking online lectures.
Based on this case study, here are suggestions for instructors to effectively integrate online and offline teaching in the post-epidemic era:
Establish a solid communication platform that can be used by all parties involved, including instructors and students. This platform should enable seamless communication, announcements, and discussions. Utilize a standard announcement board to list all future assignments and exam submission deadlines. Additionally, instructors should discuss major dates at the end of every week's class to keep students informed and organized. Provide additional learning materials to supplement the online and offline instruction. While students can find resources on the internet, curating relevant and reliable materials can prevent confusion and ensure students have access to high-quality resources. Conduct a survey assessment at the beginning of the semester to understand the student base and adjust the course outline or syllabus accordingly. This helps tailor the content to the students’ needs and preferences. Host lecture notes, tutorials, and videos in a stable and easily accessible platform. Having a centralized location for students to access course materials enhances convenience and ensures consistency. Include in-class examples and hands-on sessions to improve students’ understanding of the class materials. These activities can be conducted during offline sessions to provide practical applications and reinforce concepts learned online. Conduct exams flexibly in terms of both exam time and date, as well as the testing platform. Providing flexibility accommodates different schedules and ensures fairness in assessment. Build a library of frequently asked questions (FAQs) for each topic and keep it accessible on the online platform. This resource allows students to easily find answers to common questions, reducing the need for instructors to repeatedly explain the same concepts. Establish a dedicated study space: Set up a designated area for studying that is free from distractions. This space should be conducive to learning and equipped with the necessary tools, such as a reliable internet connection and an undistracted room space. Manage time effectively: Create a schedule that incorporates both online and offline learning activities. Allocate specific time slots for attending virtual classes, completing assignments, engaging in offline study, and participating in discussions. Stick to the schedule to ensure a balanced and productive learning routine. Actively engage in online discussions: Participate actively in online discussions and forums. Contribute insights, ask questions, and collaborate with classmates to enhance understanding and exchange ideas. Engaging in these discussions can foster a sense of community and promote collaborative learning. Take advantage of additional learning materials: Explore the supplemental learning materials provided by instructors, such as lecture notes, tutorial videos, and recommended resources. These materials can deepen the understanding of the subject matter and offer different perspectives. Seek clarification when needed: If encounter challenges or have doubts, don’t hesitate to seek clarification. Reach out to the instructors through the designated communication platform or email. Asking questions and seeking help promptly can prevent misunderstandings and promote continuous learning. Practice self-discipline and self-motivation: Online learning requires self-discipline and self-motivation. Set goals, stay organized, and hold the time accountable for completing assignments and meeting deadlines. Develop effective study habits, take breaks when needed, and stay focused during virtual classes and offline study sessions. Network and collaborate with peers: Engage with the fellow classmates and build connections through online platforms. Collaborate on group projects, form study groups, and share insights and resources. Collaborative learning can enhance the understanding of the material and provide additional support. Stay technologically prepared: Ensure access to the necessary technology and software required for online learning. Regularly check the internet connection, update software as needed, and familiarize yourself with the online platforms and tools being used. This preparation will help avoid technical difficulties and maximize the learning experience.
Also, guidance for students can effectively navigate and make the most of the integration of online and offline teaching in the post-epidemic era:
By following these suggestions, students can effectively adapt to the integration of online and offline teaching methods, actively participate in their learning journey, and optimize their learning outcomes in the post-epidemic era.
Conclusion
The sudden shift to online learning during the COVID-19 pandemic has had a noticeable impact on teaching quality and course ratings. However, this article has successfully demonstrated how online teaching can effectively integrate into the post-epidemic era, leading to improved learning outcomes. By utilizing the DMAIC procedure, we analyzed and addressed the challenges encountered during the transition from pre-COVID-19 to post-COVID-19 teaching and learning.
Through the development of a project charter and the collection of student performance data and lecture feedback, we were able to identify the root causes of disruption in online courses. To comprehensively evaluate course ratings, a new scoring system was designed, taking into account both student and instructor perspectives. By employing sentiment analysis on student comments and analyzing online video retention rates, we made significant improvements to the lecture material and time arrangements, resulting in enhanced learning experiences.
The results of our efforts are evident in the overall scores of undergraduate courses, which increased from 86.67% during the online transition to 90.0% after implementing the necessary changes. Similarly, graduate courses showed progress, starting with a score of 55.81% during face-to-face lectures, declining to 50.28% during the initial online transition, and eventually improving to 61.59% post-improvement. Additionally, official course evaluation ratings indicated a shift from a decline in the students’ learning experience during the pandemic to a positive rating following the transition, reflecting the success of our improvement initiatives.
The COVID-19 pandemic has presented instructors with new opportunities to leverage multimedia tools in teaching, and the lessons learned from this transformative journey have inspired us to enhance students’ learning efficiency by focusing on key content through online video lectures. Furthermore, facilitating active communication between students and instructors, such as through timely online messaging and problem-solving, has proven to reduce the need for extra office hours and significantly contribute to an enriching learning experience.
In summary, the integration of online teaching methodologies in the post-epidemic era has proven to be effective in addressing the challenges brought forth by the COVID-19 pandemic and improving the overall learning experience. Leveraging technology and communication tools, we can optimize teaching practices, maximize learning outcomes, and continue to adapt to the evolving educational landscape.
Footnotes
Declaration of conflicting interests
The author(s) declared no potential conflicts of interest with respect to the research, authorship, and/or publication of this article.
Funding
The author(s) disclosed receipt of the following financial support for the research, authorship, and/or publication of this article: This work was supported by the Air Force Office of Scientific Research (grant number FA9550-16-1-0171).
Data availability statement
Data sharing is not applicable to this article as no datasets were generated or analyzed during the current study.