
Abstract
Changes in sound intensity are important components of piano performance. Previous research in this area has largely focused on perception of changes in pitch and timing, with little investigation of sound intensity. The present study used Musical Instrument Digital Interface (MIDI) technology to algorithmically control the key velocity, and thereby sound intensity, of consecutive piano tones. Non-musicians (n = 20) and experienced pianists (n = 30) played pairs of consecutive piano tones with 0–15 arbitrary units (a.u.) of change in key velocity, indicating whether they perceived the first, second, or neither tone as louder. All participants completed the test with C4, and a subset (n = 24) with pitches C2 and C6 also. The mean just noticeable difference (JND) ranged from 2.71 to 4.48 a.u., corresponding to 0.68–1.22 dBC on the Yamaha Disklavier used to produce the stimuli. Experienced pianists demonstrated lower JND, which the authors theorize may be linked to listener motivation. When two tones were played with the same key velocity, participants tended to perceive the first tone as louder. The authors discuss a number of factors that may be relevant considerations for application of the findings in music and psychoacoustics research. These findings hold insight for music performance researchers, psychoacoustics researchers, and pedagogues.
Keywords
It is important for music performance research to be grounded in an understanding of the abilities and limits of human listeners to distinguish between sounds. Key velocity and timing of consecutive keystrokes are important components of piano performance research, yet the findings of research that uses these variables may not be applicable to the performance context if human listeners cannot discern measurable changes in these sound parameters. Repp (1999) investigated how large a change in time intervals between consecutive piano keystrokes must be for it to be perceivable, finding that a change as small as 20 ms could be perceived by experienced musician listeners, whereas non-musician listeners could perceive changes as small as 35 ms. There is, to our knowledge, no research to understand how large a change in key velocity must be for it to be perceivable to a human listener. Key velocity data is a measure of the sound intensity of a piano tone (Goebl & Bresin, 2003). The lack of data around perception of changes in key velocity makes it difficult to interpret research findings that express changes in sound intensity in terms of the key velocity.
Musical Instrument Digital Interface (MIDI) data is often used in piano performance research to record and reproduce the pitches, timing and key velocity of piano tones. MIDI data indicate the pitches that are played, the key velocity and timing of the onset and offset of each note. MIDI data are frequently used to take physical measurements of piano performances, enabling researchers to make comparisons between performers (Beckman, 1994; Repp, 1996) or to understand changes in a pianist’s performance under a variety of circumstances, such as psychological stress (Yoshie et al., 2008), auditory feedback deprivation (Repp, 1999), and muscle stiffness (Andison, 2011). Researchers have also used MIDI data to quantify changes that may occur in pianists who have medical conditions (Salmon & Newmark, 1989) such as focal dystonia (Jabusch et al., 2004) and Parkinson’s disease (Bronte-Stewart et al., 2000). MIDI data can be recorded using any MIDI-equipped instrument and reproduced on computer-controlled keyboard instruments. Researchers have tested the precision of computer-controlled acoustic pianos including the Bösendorfer SE and the Yamaha Disklavier, finding that computer-controlled acoustic pianos are reliable tools for recording and reproducing the timing and loudness of key strokes, particularly in the mid-range of pitches and key velocities (Goebl & Bresin, 2001, 2003; Repp, 1993). This constitutes a useful tool for research in music performance and perception, yet the perception of changes in key velocity remains little understood.
The smallest perceivable change of key velocity can be investigated by measuring the just noticeable difference (JND) of intensity between two different key velocities. The JND is a psychoacoustical measurement that has two underlying components: sound intensity and loudness. Sound intensity relates to a physical characteristic of sound while loudness perception is the psychological subjective sensation of how loud a sound is (Moore, 2003). Sound intensity is typically represented in decibels (dB) or watts per square meter (W/m2), while loudness can be represented in various units such as phon (Fletcher & Munson, 1933) or sone (Acoustical Society of America, n.d.). Psychoacoustics researchers have studied the relationship between sound intensity and loudness for decades, testing empirical data against theoretical models and laws (see Lentz, 2020 for a recent chapter on this topic). Part of this research investigated intensity discrimination, or the smallest change in sound intensity that can result in a person perceiving a difference in loudness between two sounds. JND is typically presented in dB, arbitrary units, or as a Weber fraction (i.e., the ratio of the JND over the intensity of the reference sound) (Lentz, 2020).
The JND varies depending on the frequency, intensity, and spectral characteristics of the sounds. For narrow-band noises presented at least 20 dB above the person’s thresholds of audibility (i.e., the smallest sound pressure level that results in the detection of a sound) the JND reported as a Weber fraction is generally constant regardless of the reference sound intensity (Lentz, 2020). That is, the JND remains proportional to the reference sound intensity level for narrow band noises above 20 dB (i.e., for narrow-band noises, the JND increases as the intensity of the reference sound increases). For pure tones, Florentine and colleagues (1987) demonstrated that the JND reported as a Weber fraction in dB is dependent on both presentation level and frequency of the reference sound. Their sample of six adults with normal hearing showed the best average intensity discrimination in dB SPL at 500 Hz and the poorest at 16 kHz. Generally, this study showed a worsening of intensity discrimination as the frequency increased. Another key finding is that intensity discrimination improved as presentation levels increased, except at 14 and 16 kHz where the Weber fraction remained constant regardless of the presentation level. It should be noted that these authors used pure-tones ranging from 0.25 to 16 kHz, a high-frequency range that exceeds the pianos’ range; the fundamental frequencies on a conventionally tuned piano in equal temperament ranges from 27.5 Hz (A0) and 4186.0 Hz (C8) (Koenig, 2015). It is difficult to extrapolate these findings to a musical context, as piano tones have overtones and harmonics, while pure tones are frequency specific (Lentz, 2020). This body of research suggests that the JND is influenced by the interaction between several components of the sound spectrum. As such, many authors pointed out that no one model can accurately predict loudness or JND patterns (Florentine et al., 1987; Simpson & Reiss, 2013).
Psychoacoustic research on JND has focused primarily on the sound’s physical characteristics, and less on the listeners’ characteristics. In their seminal paper, Fletcher and Munson (1933) suggested that listener characteristics such as age, hearing, and “manner of listening” would impact loudness perception. Using tone-bursts at 0.5, 1, and 2 kHz, Freigang and colleagues (2011) found that age and hearing loss were associated with higher JND in older adults in comparison to younger adults, which was attributed both to peripheral and central auditory deficits. Florentine and colleagues (1987) noticed that their participants’ JND was larger than those reported in the literature and hypothesized that this was the result of reduced motivation. To test this hypothesis, they repeated a portion of their experiment and added training and provided feedback on performance and financial incentive to their participants. These additional measures resulted in JND being similar or better than those reported in the literature, supporting the impact of listeners’ motivation and training. These findings support that there is value in considering listener characteristics in JND investigations, as the sound acoustical characteristics and theoretical models may not fully explain the empirical data.
Research problem
The complexity of factors that may affect JND for sound intensity makes it impractical to extrapolate from measures of JND with non-musical stimuli to a music research context. The lack of data concerning JND of sound intensity in piano tones makes it impossible to interpret research that expresses changes in sound intensity of piano tones. Given the extensive use of MIDI data as a source of information in music research and music perception research, it is paramount that we understand how large a change in key velocity must be for it to be perceptible to human listeners. It is also relevant to understand how music training of those listeners may affect their auditory perception. In the following research study, we therefore asked four central research questions:
What is the JND in sound intensity of two consecutive piano tones?
Is the JND in sound intensity of two consecutive piano tones affected by whether the first or second note is louder?
Is the JND in sound intensity of piano tones affected by music training of the listener or by pitch?
When presented with two piano tones of the same key velocity, do listeners more frequently mis-identify the first note or the second note as louder?
Method
Due to the novelty of our research questions, pilot testing was an important source of preliminary data to refine the methods used in this experiment. Adjustments made to the data collection procedure based on the pilot testing are discussed below where relevant.
Participants
The main inclusion criterion for experienced pianists was a minimum qualification of Grade 8 in the Royal Conservatory of Music, a qualification that is a minimum entry requirement for many undergraduate programs in music in Canada. The main inclusion criteria for control participants were that they had less than 1 year of lifetime experience playing or taking lessons in piano and less than 2 years of lifetime experience taking lessons on any other instrument. All participants were at least 18 years of age and had no known hearing impairments.
A total of 50 participants (30 female, M = 26.9 years, age range = 19–45) gave consent to participate in this study. These included 30 experienced pianists (19 female, M = 26.97, age range = 19–45) and 20 control participants (11 female, M = 26.90, age range = 19–38). Our initial investigation was into JND of one pitch only (C41). As we proceeded, we added two additional pitches (C2 and C6). Accordingly, there are more participants who completed the test with C4 (n = 41) than C2 (n = 33) and C6 (n = 33). Several participants chose to withdraw before completing all three pitch experiments due to fatigue or other reasons. A total of 24 participants (11 female, M = 27.7 years, age range = 19–39) completed all three pitches, 12 of whom were pianist participants (7 female, M = 27.83 years, age range = 21–39) and 12 of whom were control participants (4 female, M = 27.58 years, age range = 19–38). The total participants (n = 50) are included in analyses that consider pitches separately and the smaller subset (n = 24) is used for analyses that make comparisons among pitches.
Instrumentation and calibration
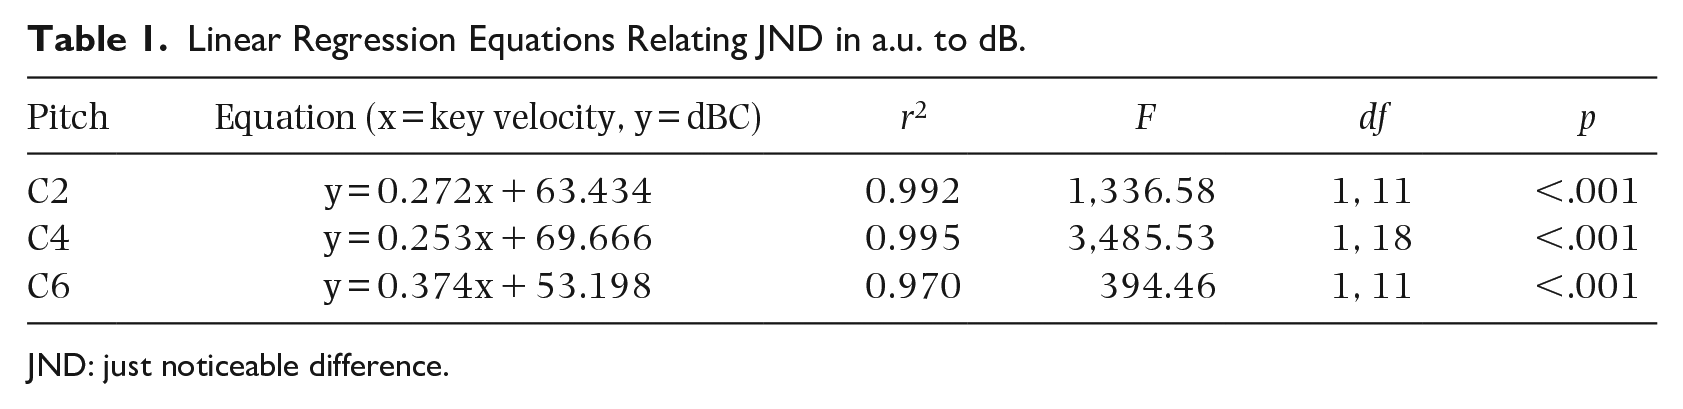
The present study used a computer-controlled grand piano to produce piano tones, a Yamaha Disklavier Mark III. We took sound intensity measurements for each of the pitches at each of the key velocity levels using a sound-level meter offering the options of dBA and dBC weighting. We used a linear regression model to describe the relationship between key velocity levels in arbitrary units (a.u.) to sound intensity in decibels (dBC). dBC was chosen as its frequency weighting is relatively flat, making it closer to dB SPL than dBA. See Figure 1 for a plot of the relationship between these two variables. The linear regression equations are presented in Table 1.
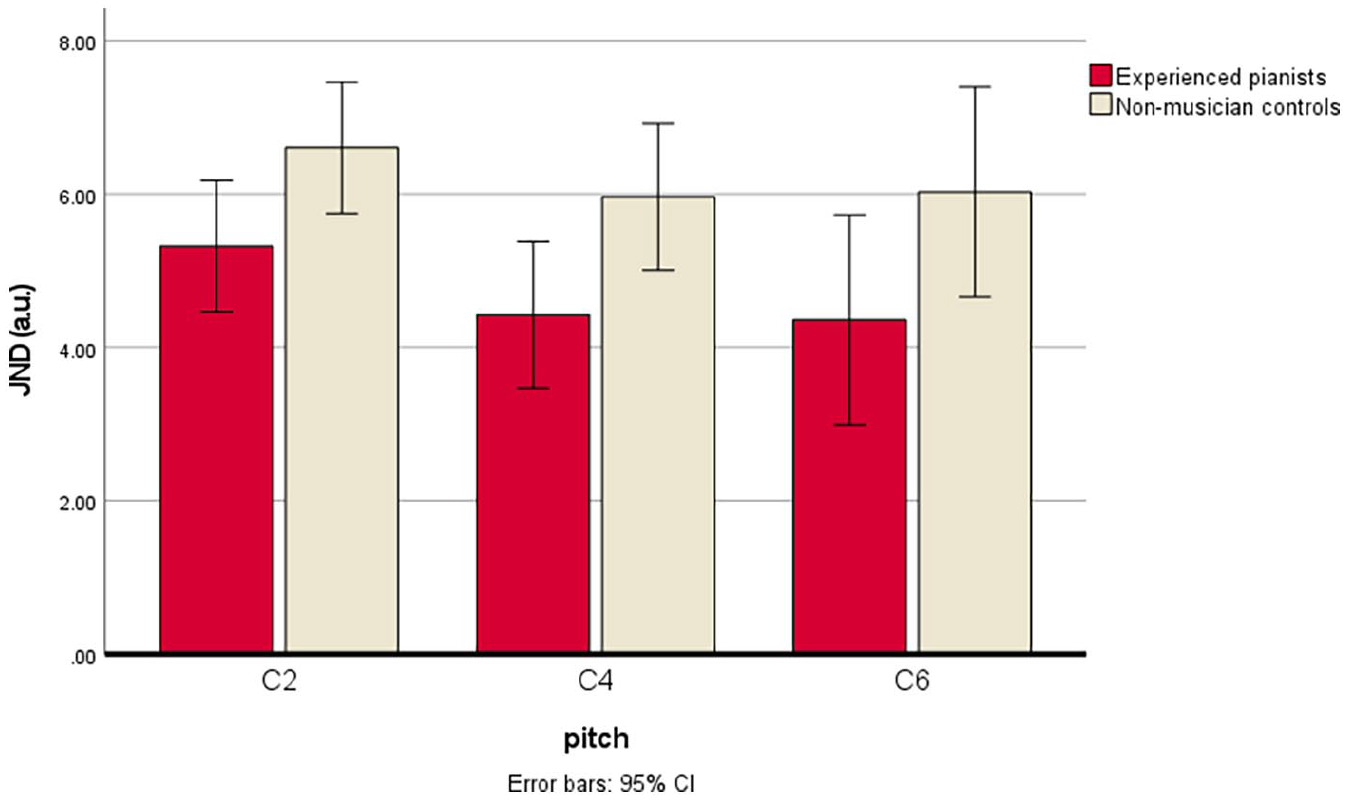
JND for Experienced Pianists and Non-Musician Controls Across Three Piano Pitches.
Linear Regression Equations Relating JND in a.u. to dB.
JND: just noticeable difference.
Stimuli
A purpose-built algorithm gave specifications for the auditory stimulus. The stimuli consisted of two consecutive piano tones, each 400 ms between key depression and key release, with a 750 ms separation between the two tones (see Figure 1). This procedure was based on the procedure described by Plack (2014) in which each tone was 500 ms long with a 500 ms gap. During pilot testing and calibration, we noted that the resonance of the grand piano created some interference between the two notes, prompting us to shorten the tone duration. The first of each pair of piano tones was consistently played at 65 key velocity units (described in arbitrary units or a.u.) and the second increased or decreased by 1–15 a.u. We selected 65 a.u. as the baseline key velocity because that ensured that all stimuli presented by the Disklavier would be within the most reliable range for key velocity replication as described by Goebl and Bresin (2001).
Procedure
In each JND test, participants were played a series of pairs with 5-s gaps in between the pairs. The test samples included six pairs at each level of difference (1–15 a.u.) in key velocity: three samples where the first tone was louder and three samples where the second tone was louder. Additionally, participants were played six samples in which the tones were the same key velocity. The order of change in key velocity between the first and second tones was randomized (e.g., 5 a.u. decrease, 10 a.u. increase, 1 a.u. increase, etc.). JND was defined as the smallest difference a participant could correctly identify two out of three times.
Research participation took place in a recording studio. Participants were tested on each pitch separately. We chose not to randomize the pitches within testing because participants in the pilot study indicated that they found the changing pitches interfered with their ability to focus on sound intensity. Order of presentation of pitches (e.g., C4, C2, C6) was randomized. Participants were invited to enter the recording studio, were told about the study, and invited to read the letter of information and consent form. Volunteers who consented to participate filled out a brief intake form detailing their history of music education, current music making practices, age, gender (as they define the construct), and left- or right-handedness. A lab employee explained the procedure and gave the participant a set of practice examples to become accustomed to the procedure. Participants were asked to indicate when they perceived the first note as louder, the second note as louder, or the notes as the same loudness. Participants were told that the samples included pairs where the two notes were of the same loudness.
Results
Measures of central tendency for JND
Some participants (n = 16) were able to perceive changes as small as one unit of key velocity from the baseline 65 a.u., which is the smallest measurable change available to use with this instrumentation, in at least one of the pitch conditions. However, only two participants were able to detect a change this small in both first note louder and second note louder conditions for any particular pitch. Of the six conditions listed in Table 2, five participants demonstrated a JND of just one unit in more than one condition. Two participants demonstrated a JND of one unit in three conditions. No participants were able to perceive changes as small as 1 unit of key velocity in all three pitches. The median key velocity was between 3 and 5 a.u.
Measures of Central Tendency for JND of C2, C4, and C6.
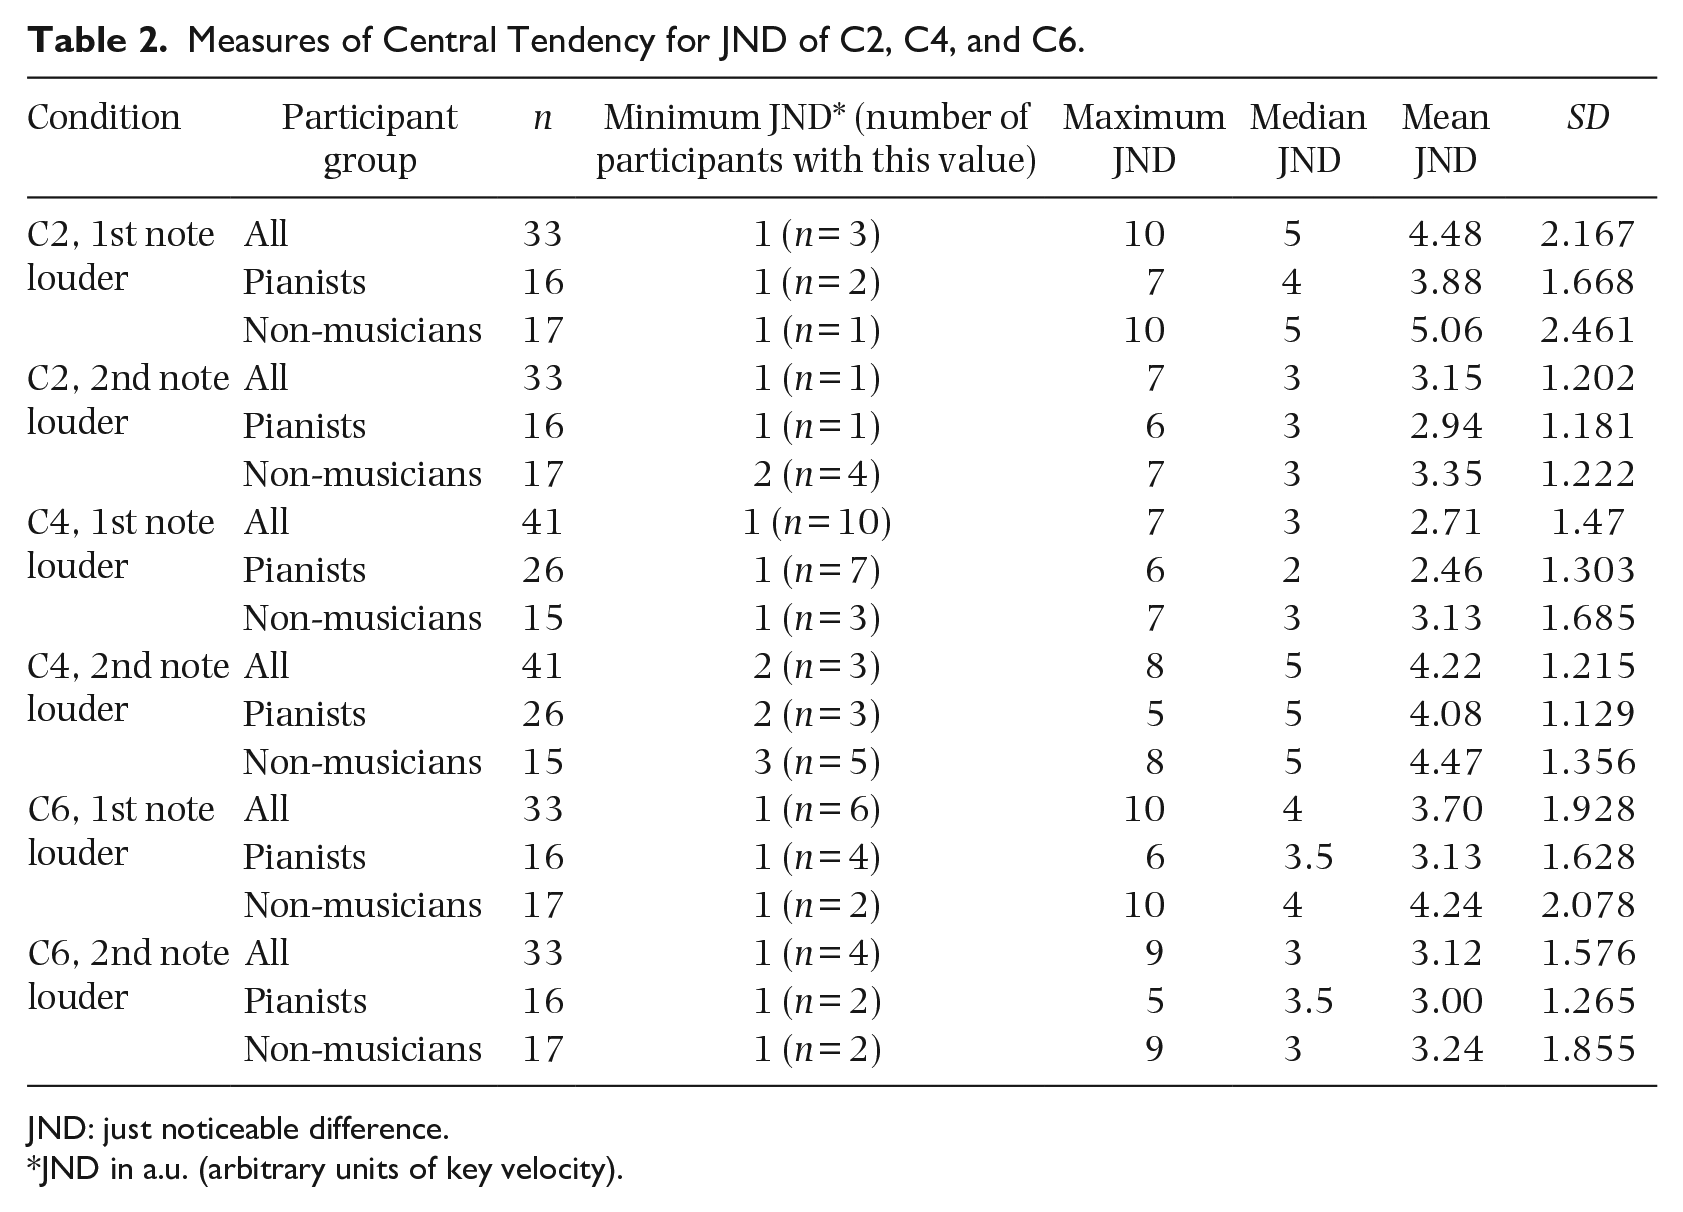
JND: just noticeable difference.
JND in a.u. (arbitrary units of key velocity).
The data were not normally distributed when separately considering samples where the first and second notes were louder. When using an aggregate measure of these two types of samples (e.g., mean), the data were normally distributed. Accordingly, we used parametric tests for inquiry into overall JND and nonparametric tests for analysis between samples where the sound intensity increased and decreased. A Pearson product-moment correlation found no significant relationship between participant age and JND of C2, r(31) = .150, p = .406, C4, r(38) = .193, p = .233, or C6, r(31) = .113, p = .529.
First or second note louder
We observed that participants’ JND was often different when the first or second of the two consecutive notes was louder (see Table 2). Wilcoxon signed-rank tests found that this difference was statistically significant for C2 (n = 33), Z = -2.674, p = .007, and C4 (n = 41), Z = -4.220, p < .001, but not for C6 (n = 33), Z = −1.178, p = .239. To better understand these differences, we conducted the Wilcoxon signed-rank test considering only those 24 participants who completed all three pitches of the test. For pianist participants (n = 12), the difference between JND when the first and second notes are louder remained statistically significant for C4, Z = −2.871, p = .004, but not for C2, Z = -0.775, p = .436, or C6, Z = 0, p = 1. For control participants (n = 12), there were no statistically significant differences between first and second pitch louder for C2, Z = −1.801, p = .072, C4, Z = −1.628, p = .103, or C6, Z = −.783, p = .434.
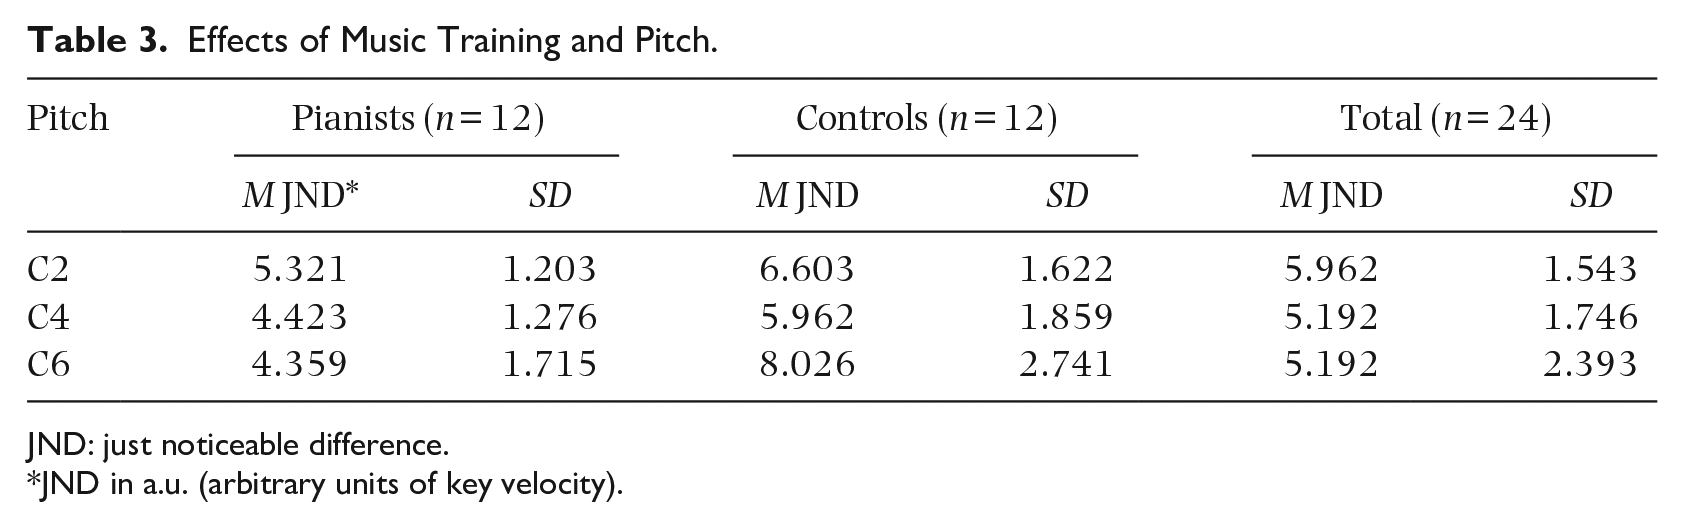
Effects of music training and pitch
To investigate the effect of music training and pitch on JND, we conducted a mixed between within subjects analysis of variance (ANOVA) using data from those 24 participants who completed data collection for all three pitches. There was no significant interaction between pitch and music training (Wilks’ Lambda = .971), F(2, 21) = 7.135, p = .736, η2 p = .029. There was a main effect for pitch (Wilks’ Lambda = .595), F(2, 21) = 7.135, p = .004, η2 p = .405. Follow-up pairwise comparisons found that JND was higher for C2 compared with C4 (p = .021) and C6 (p = .029), but no difference between C4 and C6 (p = 1). Using a Bonferroni correction to control for type 1 error, none of these pairwise remains statistically significant. The main effect comparing pianists with controls showed a significant effect of music training, F(1, 22) = 6.507, p = .018, η2 p = .228. See Table 3 for details.
Effects of Music Training and Pitch.
JND: just noticeable difference.
JND in a.u. (arbitrary units of key velocity).
Misidentification of tones with same key velocity
Finally, we wanted to know whether listeners tended to misidentify the first or second pitch as louder when the two piano tones were played with the same key velocity. The data for samples where the two tones were played with the same key velocity were not normally distributed and we therefore used nonparametric tests. First, we compared data for those 24 participants who completed all three pitch tests. Wilcoxon signed-rank tests found that participants were more likely to respond that the first pitch was louder in samples where the key velocity of the two pitches was the same in C2, Z = −2.395, p = .017, C4, Z = −2.299, p = .022, and C6, Z = −2.968, p = .003. Using a Bonferroni correction for alpha level across these three comparisons, only the comparisons for C2 and C6 remain statistically significant. We then analyzed the data for pianists and control participants separately. The frequencies of responses are provided in Table 4. These data suggest that the pianists were more likely to respond that the first pitch was louder when both pitches were of the same key velocity, whereas the control participants were not. Using a Bonferroni correction across these six comparisons, only the comparison for pianists with C6 remains statistically significant.
Comparison of Responses When the Two Stimuli in the Pair Were of the Same Key Velocity.
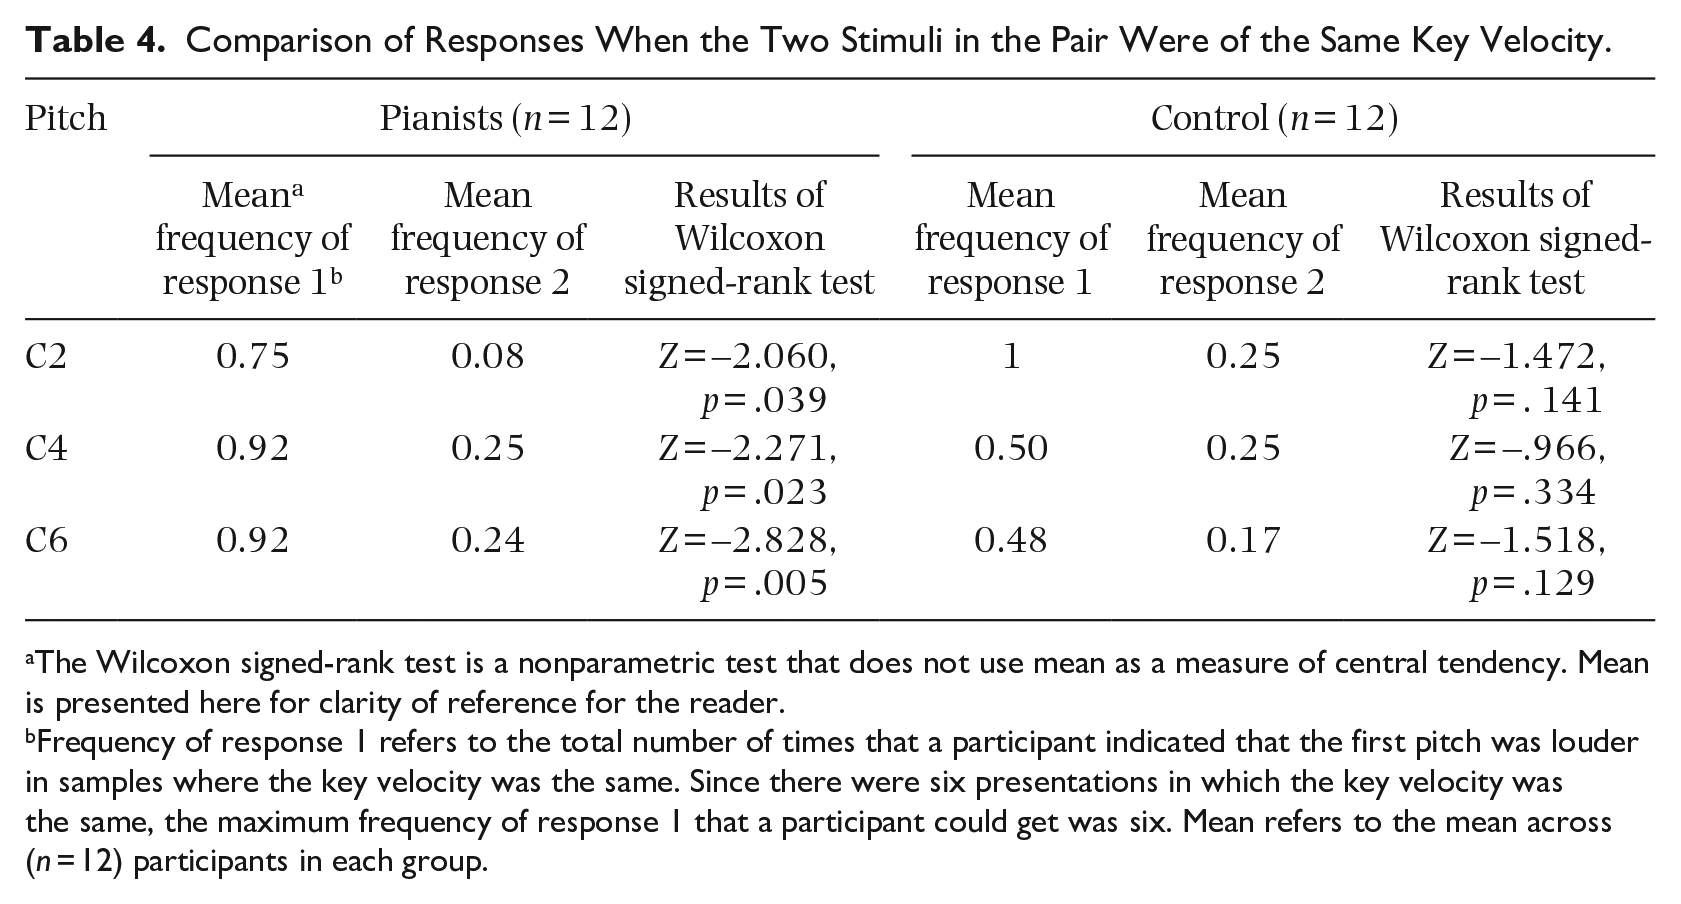
The Wilcoxon signed-rank test is a nonparametric test that does not use mean as a measure of central tendency. Mean is presented here for clarity of reference for the reader.
Frequency of response 1 refers to the total number of times that a participant indicated that the first pitch was louder in samples where the key velocity was the same. Since there were six presentations in which the key velocity was the same, the maximum frequency of response 1 that a participant could get was six. Mean refers to the mean across (n = 12) participants in each group.
Discussion
The findings of the present study give insight into the nature of loudness perception of piano tones. We found that participants could identify between 3 and 5 a.u. of change in key velocity and several participants were able to identify a change as small as 1 a.u., the smallest measurable change in MIDI data, in a limited number of conditions. Our findings suggest that music performance research using MIDI data could interpret changes as small as 3–5 a.u. of change as potentially audible to human listeners, with some listeners having an even smaller JND for a limited number of conditions. At the same time, sound production on our instrument may vary from that of other computer-controlled pianos. We therefore recommend that researchers wishing to use the present data to interpret their own findings calibrate the instrument used in their research, referring to the regression equations in Table 1 to compare the data in terms of dBC. JND was lower, suggesting more acute perception, for pairs of pitches where the first of the two pitches had the higher key velocity. In pairs where the pitches were of the same key velocity, there was a slight tendency for pianists to perceive that the first of the two was louder. Experienced pianists in our study demonstrated a smaller JND than non-musicians, suggesting more acute perception. Participants demonstrated a higher JND, suggesting less acute perception, for the lower pitch in our study (C2), compared with C4 and C6. Music research, therefore, could take into consideration the participant characteristics and the pitches of the auditory stimuli in interpreting their findings. The possible reasons for these findings are discussed below.
There are a number of factors identified in the research literature that could explain the smaller JND in musicians in the current study. First, musical training may have resulted in better central auditory skills in pianists. There is some literature supporting that musicians have better central auditory abilities compared with non-musicians. Meha-Bettison and colleagues (2018) found that adult musicians performed better than non-musicians in a speech-in-noise perception task. Other studies showed that musicians have better time discrimination (Zaltz et al., 2017) and frequency discrimination than non-musicians (Mandikal Vasuki et al., 2016; Zaltz et al., 2017). However, Zaltz and colleagues (2017) did not find better intensity and spectrum discrimination in their sample of pop and rock musicians. These findings cannot necessarily be generalized to populations of classically trained musicians. The limited literature suggests that the musician advantage may be seen in specific central auditory skills as opposed to all of them.
Another possible way to explain the smaller JND in musicians could be participant motivation to succeed in the listening task. Increased motivation has been shown to improve performances in listening tasks (Pichora-Fuller et al., 2016). For example, Zhang and colleagues (2019) demonstrated that monetary rewards improved participants’ performance in the most difficult listening tasks of their experiment. In the Framework for Understanding Effortful Listening (Pichora-Fuller et al., 2016), this phenomenon is attributed to greater motivation leading to a larger allocation of cognitive resources to the listening task. Replicating this study and purposefully altering the participants’ motivation would shed light on its potential role in the current experiment.
Furthermore, the stimuli chosen for this experiment may have influenced the two groups differently. Piano tones are more familiar to pianists than they are to the control group, and familiarity with the stimuli has been shown to alter performance in listening tasks. Reymore and Hansen (2020) proposed the hypothesis that some musicians are more accurate at naming pitches played on their primary instrument compared with other instruments. These authors hypothesized that high familiarity with the timbral cues of their primary instrument and articulatory motor imagery may be at play in this phenomenon. Being familiar with a melody provides an advantage in detecting its alteration (Dowling et al., 2008) and can lead to the perception that a musical sequence is longer than a non-familiar one (Kowal, 1987). It is also noteworthy that Dawson and colleagues (2017) did not find significant correlations between scores on a self-reported musicality questionnaire and intensity discrimination using (non-familiar) narrowband stimuli. The dissimilarity between the current finding and Dawson and colleagues (2017) supports the hypothesis that familiarity with the stimuli may impact the JND of intensity (i.e., non-familiar stimuli may not result in a difference in JND between a group of musicians and non-musicians). The study of familiarity in listening tasks is relatively recent, and its effect is typically investigated with more complex stimuli such as voices and melodies. To our knowledge, familiarity has not been taken into consideration in previous JND psychoacoustic experiments. Investigating if the differences between pianists and controls seen in this study are maintained when using non-musical stimuli (or non-familiar stimuli) would help to reveal the potential role of familiarity in the group differences observed in this study.
The a.u. JND differences between pitches show different patterns when converted into estimated dBC. This is because the corresponding dBC for 1 a.u. is different for each pitch (see slopes of linear regression equations in Table 1). As shown in Table 5, the mean JND in estimated dBC is smaller for C2 than C6, showing the opposite direction than the a.u. difference. The mean JND in estimated dBC for C2 remains larger than C4, which is the same direction as the a.u. difference. To explore this difference, we conducted another mixed between within subjects ANOVA, this time using estimated dBC instead of a.u. This showed the same pattern of main effects: no significant interaction between music training and pitch (Wilks’ Lambda = .936), F(2, 21) = 0.713, p = .502, and significant main effects of both music training, F(1) = 6.017, p = .023, η2 p = .215, and pitch (Wilks’ Lambda − .575), F(2, 21) = 7.776, p = .003. However, pairwise comparisons between pitches showed different patterns (see Figure 2) with JND of C4 being lower than C2 (p < .001) and C6 (p = .002) and JND of C2 being lower than C6 (p = .022). Using a Bonferroni correction to control for type 1 error, only the comparisons with C4 remain statistically significant. However, when we examine previous research investigating JND by pitch, the only pitches that showed demonstrable differences were in a high-frequency range, higher than those that we included in the present study (Florentine et al., 1987). Given the lack of previous research on JND of sound intensity at different frequencies, it is not possible to precisely identify the characteristics of the C4 stimuli that might explain the difference identified here. However, C4 is the only pitch that is within a singable range for most trained and untrained singers (Siupsinskiene & Lycke, 2011), corresponding to a frequency of 261.6 Hz in equal temperament (Koenig, 2015). If participants used a strategy of mentally singing the pitches to discern which was louder, the singability of C4 could result in a larger or more efficient allocation of cognitive resources during the listening task. These findings should be interpreted with caution, however, because they are exploratory findings of an analysis done with estimated dBC using calibration data, rather than the key velocity that was directly controlled by the instrument in this experiment.
Comparison of JND Between a.u. and dBC.
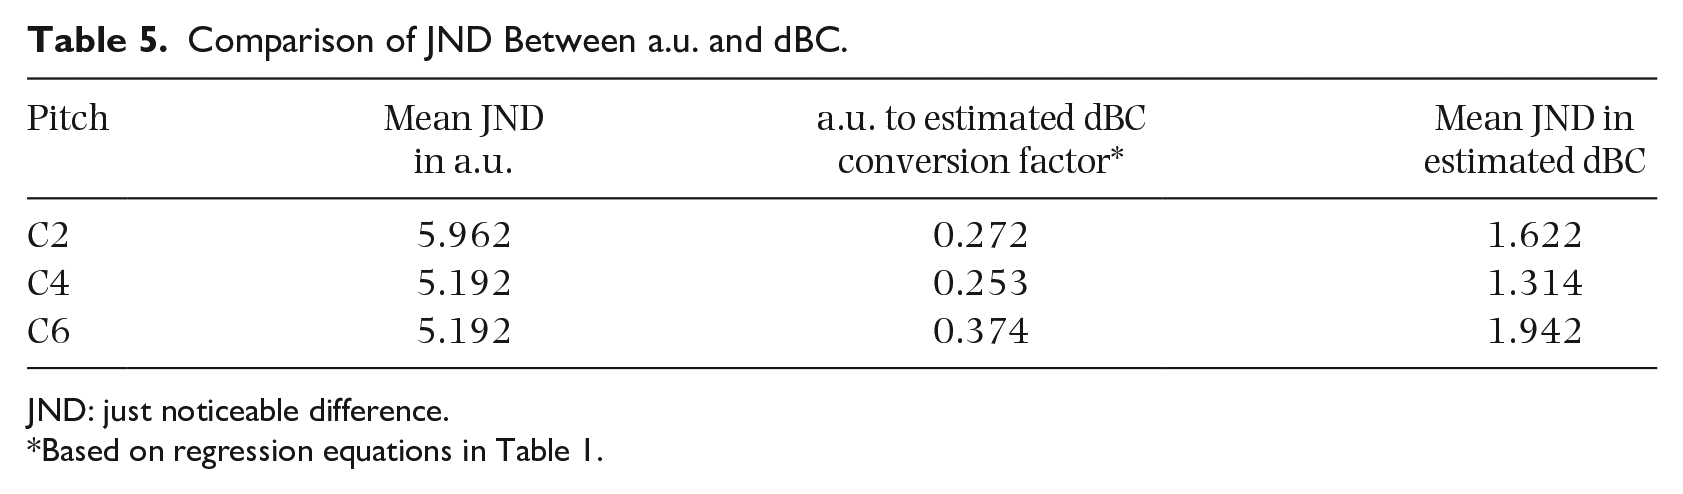
JND: just noticeable difference.
Based on regression equations in Table 1.
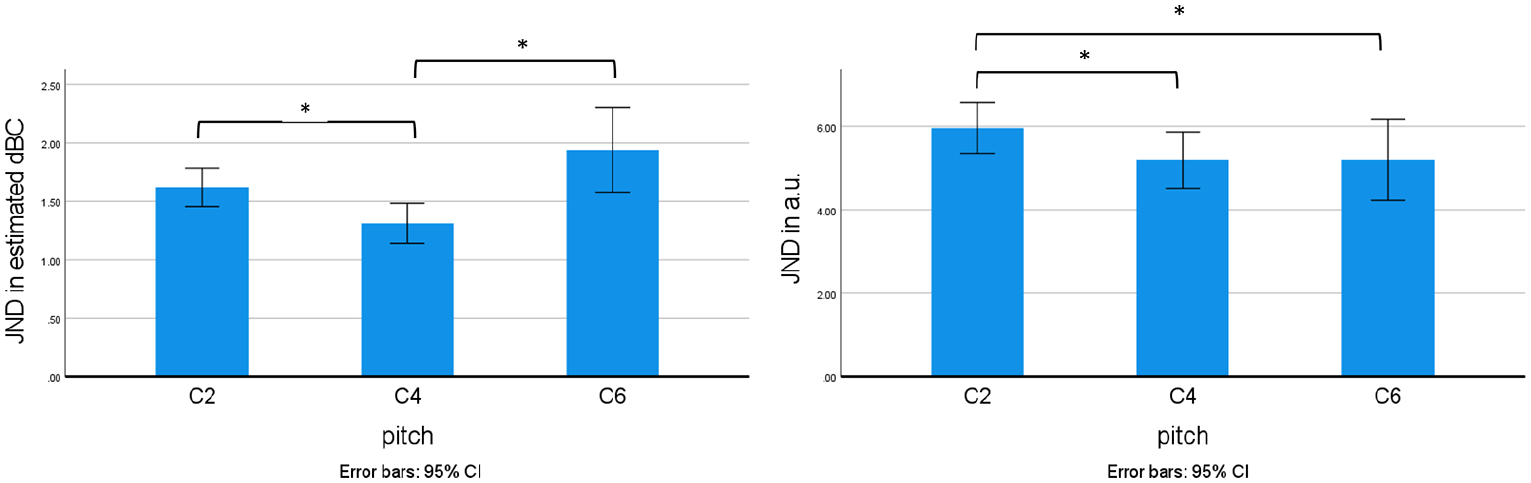
JND Comparisons of Pitch Using dBC and a.u.
Participants in the present study demonstrated lower JNDs when the first pitch had the higher key velocity. In a comparison of the 24 participants who completed all three pitches, this difference was statistically significant only among pianists in the C4 listening task. This may be related to common accent structures in Western music, wherein the first note in a measure is considered to be the primary accent. Drake and Palmer (1993) found that when presented with a musical score, experienced pianists played the first note with greater key velocity than the second note, even when the printed music included no bar lines. This effectively made the first stimulus to be the primary metrical accent. Another study found that musicians were more likely to tap along with a music recording at the level of each measure whereas non-musicians were more likely to tap along with music at the level of each beat (Drake et al., 2000). Given that this study occurred in a North American context where Western music is dominant, and that musicians are taught in Western music to place a metric accent on beat one, it is possible that the pianists in this study perceived the first note as louder more frequently because of a tendency to place a metrical accent on the first stimulus. During a pilot study for this project, pianist participants commented that they often heard the first pitch in each pair as being “beat one,” the second as being “beat two,” and they reported mentally counting “three–four,” waiting for the next “measure” to begin. To reduce this tendency, we intentionally lengthened the pause between pairs such that participants would not hear the next stimulus as being in the meter of the previous pair, but it is possible that the tendency to hear the stimuli metrically persisted. We did not systematically inquire into nor manipulate participants’ perceptions of metrical patterns during data collection and therefore these participant reports do not constitute evidence to explain the results of Research Question 4. These reports suggest the potential for future research to assess whether the metrical composition of an auditory stimulus affects JND.
There are a number of limitations to the present results which elucidate future research directions. In the present study we measured JND of sound intensity when the two auditory stimuli were the same pitch. The JND may have been different in a melodic or rhythmic musical context, as these elements can change the perception of accentedness (Drake & Palmer, 1993). Future research could investigate the JND of key velocity when other such elements are added. Stimuli that are more representative of musical excerpts could provide insight into the relationship between perception of differences in loudness and perception of musical features. The present study used a consistent presentation level of 65 a.u. for the first of two stimuli, corresponding to 81.114 dBC (for C2), 86.111 dBC (for C4), and 77.508 dBC (for C6). This presentation level was chosen to ensure optimal reproducibility of the piano tones using the computer-controlled piano, however, Florentine and colleagues (1987) found that the JND improved as presentation level increased from the participants’ hearing thresholds to 95 dB SPL for pure tones. Future research could investigate whether the JND of piano tones changes with adjustments to the presentation level. The participants in this study were experienced pianists and non-musicians. The findings for pianists may not apply to trained musicians who are not pianists. Given the possibility that familiarity with stimuli may be an explanatory mechanism for the differences between pianists and non-musicians, future research could include non-pianist musicians and/or non-familiar stimuli. The present study used piano tones exclusively. The findings may have been different if the auditory stimuli were altered, as highlighted by the Dawson and colleagues study (2017). Finally, a possible explanation of our findings is that the pianists were more intrinsically motivated to do well on the task. The individuals conducting data collection in the present study noted that many of the experienced pianist participants asked more questions about the stimuli, were generally more excited to complete the tasks, and more frequently asked what their results were than did the control participants. While these observations do not constitute evidence toward motivation as an explanatory mechanism, they do suggest that future research investigating auditory perception of musical stimuli among musicians and non-musicians consider the potential role of motivation.
This research study holds insights for music performance and perception research. Studies that use MIDI data could consider that changes in key velocity as large as 3–5 a.u. could be perceptible to human listeners, with listeners occasionally hearing changes as small as 1 a.u. On our instrument, a single a.u. of key velocity corresponds to 0.272 dBC (for C2), 0.253 dBC (for C4), and 0.374 dBC (for C6) of change from the baseline of 65 a.u., which corresponds to 81.114 dBC (for C2), 86.111 dBC (for C4), and 77.508 dBC (for C6). Readers wishing to use the present finding to interpret their own research data can consult the regression equations in Table 1 to convert the present results into dBC and, using calibration data for their own instrument, determine whether their measured results could be perceptible to human listeners. Music performers and pedagogues could consider the possibility that listeners entrained with Western music conventions may be primed to hear the first of two auditory stimuli as metrically accented and adjust their playing strategies accordingly. The present results suggest that future research should take into consideration factors including listener motivation, music training, pitch, and whether the first or second stimulus has the higher key velocity. Considering these factors and using the present data can help illuminate how music performance research findings can be interpreted in a real-world context, increasing the applicability of music performance and perception research beyond the experimental context.
Footnotes
Acknowledgements
The authors thank Professor Christian Giguère for his work in calibrating the Yamaha Disklavier used in this study, Victoria Milloy for her input during the initial stage of test procedure development, and Mikael Swirp for his assistance with the final stages of data collection.
Funding
The author(s) received no financial support for the research, authorship, and/or publication of this article.