
Abstract
In the present study, the permittivities of iron and steelmaking by-products including electric arc furnace (EAF) stainless steel dust, ferrochrome converter (CRC) dust, blast furnace (BF) sludge, basic oxygen furnace (BOF) sludge, and basic oxygen furnace (BOF) slag were investigated. The cavity perturbation technique was used to measure their permittivities as a function of temperature and frequency, while thermogravimetric (TG), differential scanning calorimetry (DSC), and mass spectrometry (MS) analysis were used to interpret the permittivity results. The results showed that the BF sludge exhibited the highest permittivities, whilst the BOF slag had the lowest permittivities. Based on maximum loss tangent values and heating rates, the materials ranked: BF sludge > BOF sludge > EAF stainless steel dust > CRC dust > BOF slag. Key factors influencing permittivities included water removal, iron oxide reduction, and carbonate decomposition. Microwave heating mechanisms transitioned from dipolar rotation at the initial stage to ionic conduction at later stages.
Keywords
Introduction
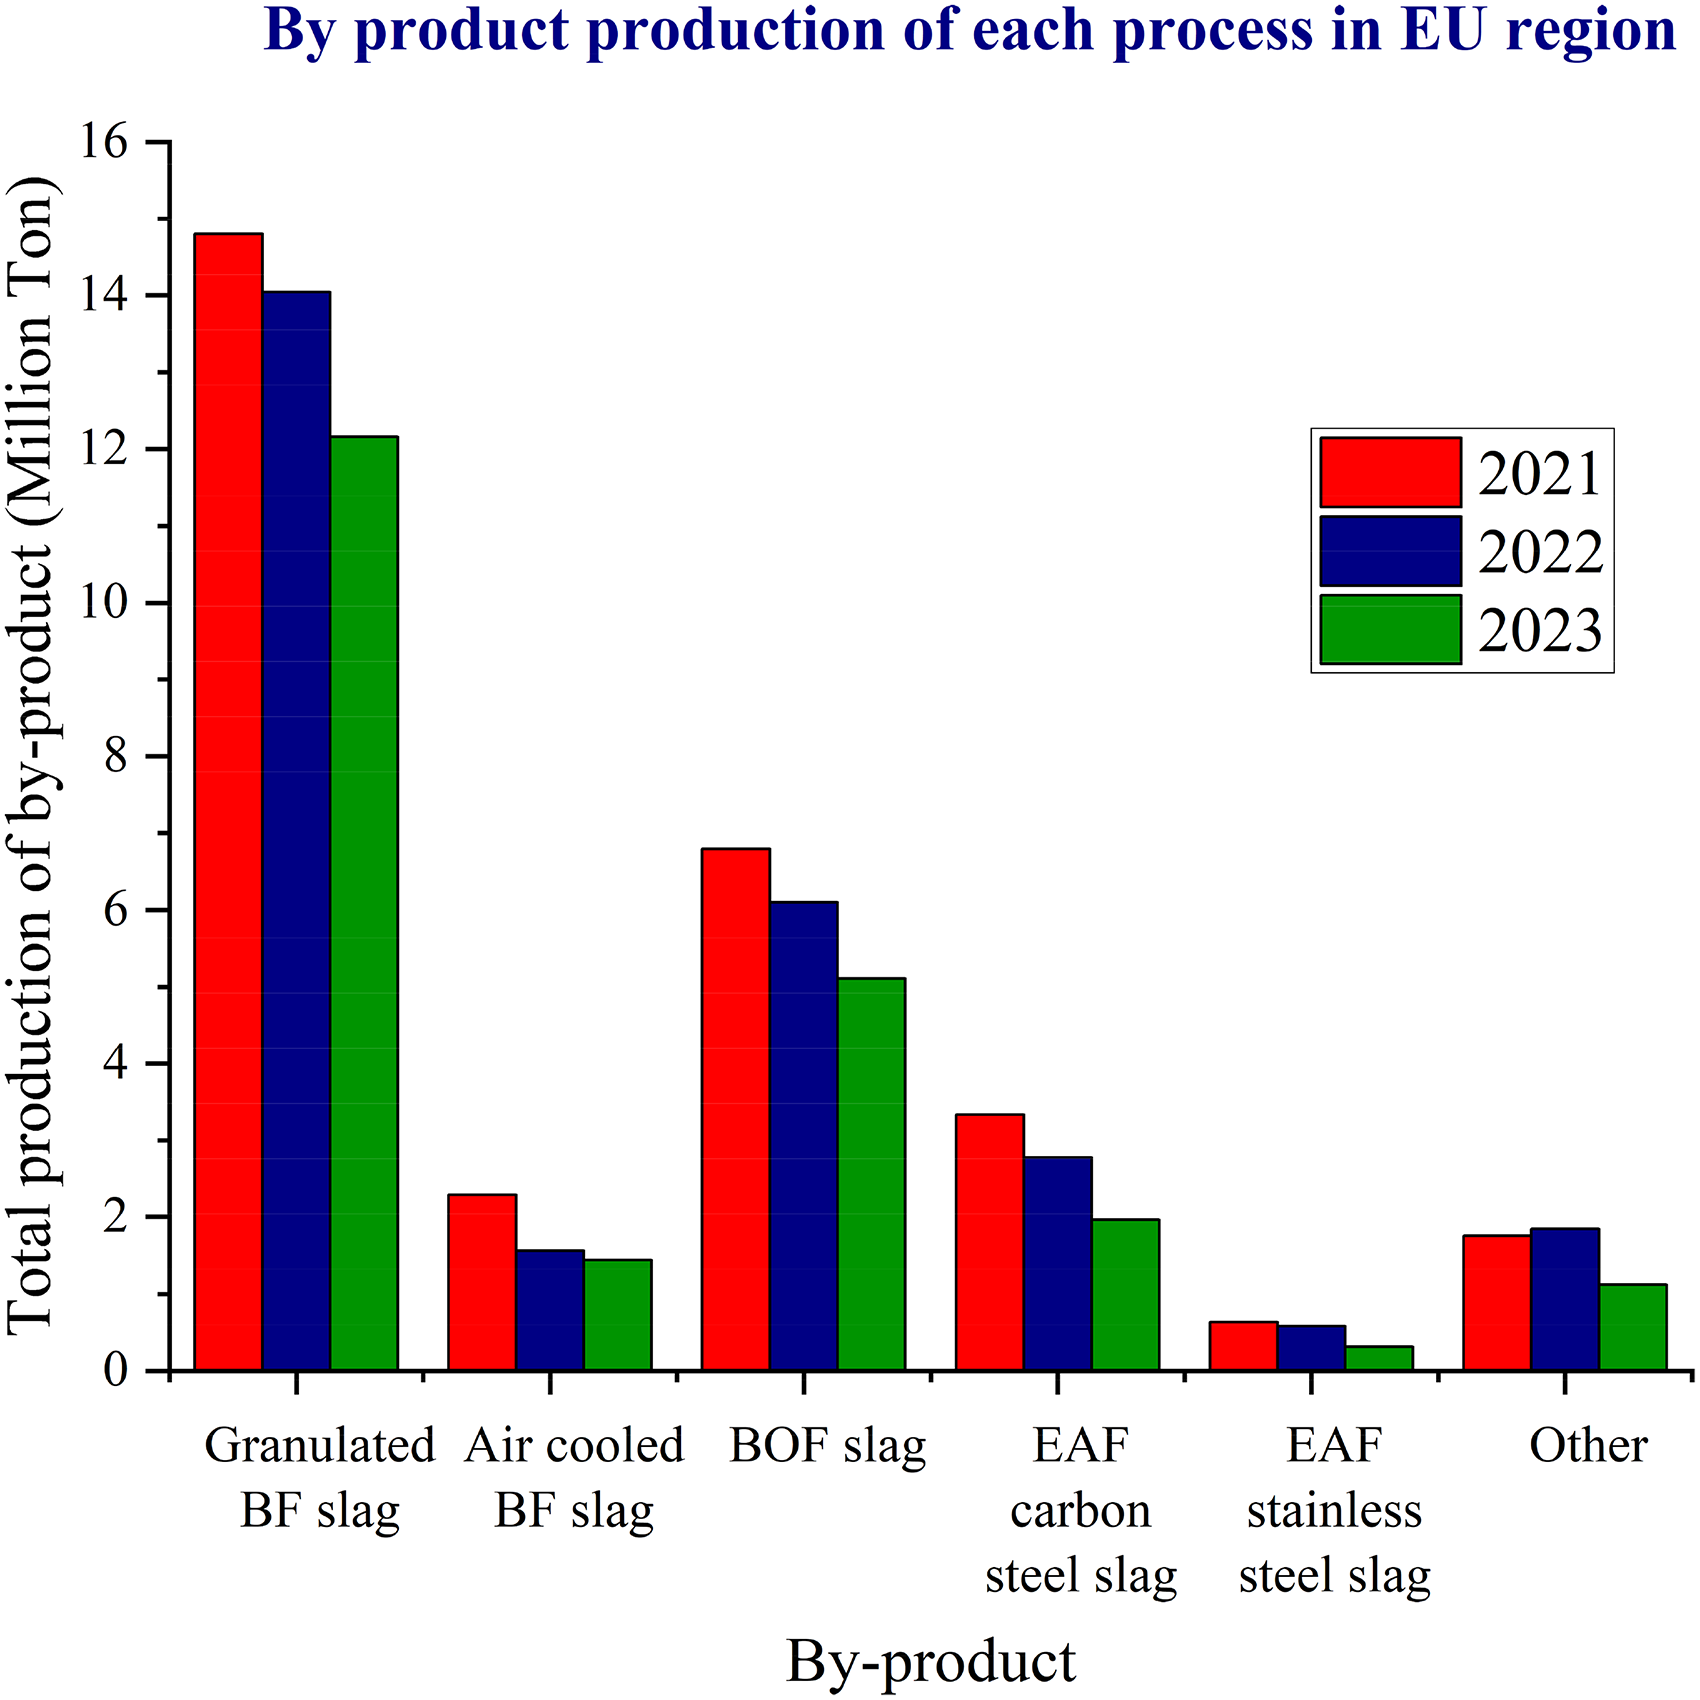
Recycling the by-products generated from the iron and steel industry is an efficient way to minimise waste disposal and promote the use of secondary raw materials. Furthermore, recycling is becoming increasingly important due to the depletion of the high-grade iron ores and the continued expansion of the iron and steel industry. The primary by-products in the iron and steel industries include slags, sludges and dusts. Among these, blast furnaces (BFs) and basic oxygen furnaces (BOFs) are the major producers of by-products, surpassing other furnace types such as electric arc furnaces (EAFs). In the European Union (EU), steel production has the third largest income (143bn in 2022) as compared to the other EU industries. 1 Hence, it is crucial to recognise the challenges and constraints of the current processing techniques and find more sustainable solutions. The total amount of by-products resulting from the production of 1 tonne of steel during 2016 in the EU was 661 kg. 2 The total by-product generation in the EU in 2021, 2022 and 2023 is illustrated in Figure 1.
While some by-products, such as BF slags, is repurposed effectively, many others are disposed in improper landfills, which may pose risks to human health and negatively impact the ecosystem. According to the United Nations Framework Convention on Climate Change accounting methodologies, the management of greenhouse gas (GHG) emissions from solid waste is a critical issue as they account for 5% of global GHG emissions, which is mainly due to methane emitted from landfill sites. 6 In order to avoid landfilling, these residues are typically treated using pyrometallurgical processes, hydrometallurgical processes or a combination of both. The primary pyrometallurgical method for recycling fine steel by-products is the Waelz kiln process, which utilises carbothermic reduction to extract valuable metals such as iron (Fe), zinc (Zn) and lead (Pb) from the metal oxides in dusts.7,8 In this technique, the main limitations are the high-energy requirements for reduction processes, the complex speciation of the various metal-bearing phases in dusts, the re-oxidation of the non-ferrous metals after reduction, the enrichment of the hazardous impurities in the generated fume and residue and the limited treatment capacities of recycling processes8, 9 . On the other hand, the hydrometallurgical methods for recovering metals utilise chemical reactions in aqueous-based solutions. Here, the challenges are the high water consumption, the increased potential to contaminate the ground water, the occurrence of additional environmental hazards such as acid mine drainage, the significantly higher processing times and the limitations of the purification process to approach 100% metal recovery.10–12 A recently introduced hybrid approach combines both techniques, and here pyrometallurgical methods are first employed to concentrate and partially refine materials. This is followed by hydrometallurgical leaching for further purification or the extraction of specific metals13– 15 . Although iron can be efficiently precipitated, it does not allow for the efficient extraction of the other valuable metals from the remaining residue. 16
To address the challenges mentioned above, microwave heating has been proposed as a new approach for processing the secondary raw materials generated from the iron and steel industries. Although microwave heating was initially introduced for household use, it has since found utilisation in numerous fields, including analytical chemistry, process metallurgy, biosciences and the food industry17, 18 . For process metallurgy, the key features of microwave heating are the fast and the efficient heating in comparison to conventional heating, which is highly inefficient, particularly in the later stages. Microwave heating generates heat throughout the material's volume, resulting in faster heating rates and also moisture movement, thereby optimising the heating or drying process, especially during the falling rate period. Although the throughput can be enhanced by installing a high-frequency microwave unit, this may involve a high initial cost. However, it will increase production capacity and generate more revenue in the long term. 19 Even though microwave processing requires higher safety standards (zero microwave leakage) and involves significant capital investment, the benefits it offers make it a brilliant option for this application since it enables precise control of processing parameters, reduces overall treatment time and minimises secondary pollution compared to conventional methods. In order to optimise the process parameters such as frequency, heating time and the particle size of input materials, it is necessary to predict the behaviour of the material under a microwave field. The fundamental property, which determines the interaction between the field and the material of interest, is the complex permittivity, which is comprised of both the real and the imaginary permittivities. These permittivities are essential for calculating the loss tangent and the half-power depth (HPD), which are important parameters in determining how a material behaves in a microwave field. Also, the permittivities are required to model the heating behaviour of the material and can be used for process scale-up. Since this microwave is a selective heating technique, this is optimal for heterogeneous solid by products to achieve effective and sustainable treatment.20,21
Recent studies have examined the permittivities of pyrometallurgical raw materials and products. 22 Their research showed that the permittivities of ferrochromium were more well-behaved than ferromanganese, even at high temperatures. This was attributed to the more stable crystal structure, the higher Curie temperature, and the lower susceptibility to oxidation of the ferrochromium as compared to ferromanganese. They concluded that microwave heating of ferroalloys and reaction mixtures is a viable option for pyrometallurgical processes, offering an alternative to fossil-fuel combustion as an energy source. Additionally, Pickles and Marzoughi 23 have investigated the possibility of utilising microwave energy for the recovery of nickel metal from nickeliferous laterite oxide ores. The results indicated that under microwave irradiation, both the iron and the nickel oxides were successfully reduced to their metallic forms using activated charcoal, leading to the formation of ferronickel particles. This process was characterised by distinct changes in the permittivity values and these results can be employed for the development of numerical models for designing industrial systems. Furthermore, Omran and Fabritius 24 have investigated BF sludge as a reducing agent for zinc removal from steelmaking dust. Given its high fixed carbon content and elevated permittivity values, BF sludge has demonstrated potential as an alternative to carbon for the reduction of EAF and ferrochromium converter (CRC) dusts under microwave radiation. Recent studies have demonstrated that microwave drying is an effective method for processing BOF sludge, resulting in robust briquettes that are suitable for transportation and application in slag bath operations. 25 Several studies have indicated that the coke and magnetite containing by-products heat very well in a microwave field due to the high permittivity values of magnetite, and the high polarisability and high electron mobility of the coke (graphite) structure. 26 In addition, Omran et al. 27 have studied the permittivities of zincite and franklinite phases as a function of temperature, which are the main phases in EAF dust. They observed that both the zincite and the franklinite phases had low permittivity values.
In the present research, the permittivities of various iron- and steelmaking by-products were studied in detail. The main objective was to provide valuable data for developing numerical models and for the design of scaled-up cavities. The permittivities of BOF slag, BOF sludge, BF sludge, CRC dust and electric arc furnace stainless steel (EAFSS) dust were studied and compared as a function of temperature and frequency. Using the permittivity data, the loss tangents and HPDs were calculated for each material. In addition, thermogravimetric (TG), differential scanning calorimetry (DSC) and mass spectroscopy (MS) analysis were performed and utilised to interpret the permittivity results. Finally, the possible mechanisms of the interaction of the microwaves with the by-product materials were discussed.
Microwave heating principles
Microwave heating, a process technology developed in the 1970s, utilises electromagnetic radiation to generate thermal energy in materials. Knowledge of the permittivities of the materials of interest is crucial for understanding their microwave heating behaviours. Dipolar rotation and ionic conduction are the two main mechanisms to produce heat in materials.
28
Atoms in dielectric materials respond to an applied electric field by changing their positions to form dipoles, whose orientation continuously changes as the direction of the electric field vector changes. These induced dipoles continuously rotate as the direction of the electric field vector changes.
19
Additionally, ionic conduction occurs when the cations and anions rearrange and move in the opposite directions under the influence of the electric field.
29
The complex permittivity

The real permittivity (ε′) represents the material's ability to convert energy from the electric field into stored energy, while the imaginary permittivity (ε″) is a measure of the ability of the material to convert the absorbed energy into heat. Both have the same physical parameters (F m−1). The loss tangent (tan δ) measures the ability of a material to be heated by microwaves (equation (2)) which is a unitless property. A higher loss tangent indicates greater energy dissipation, and therefore the material would have a higher heating rate as compared to a material with a lower loss tangent19,30–
32
:

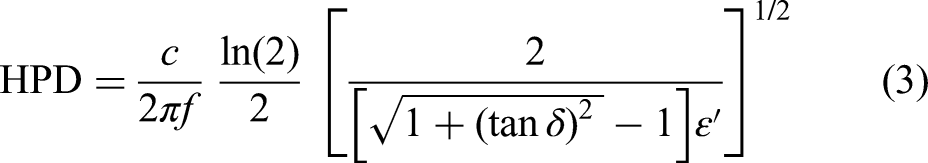
HPD is another important parameter and is defined as the distance (mm) in the material where the incident power has decreased to 50% of its original value at the surface,
33
and is defined as follows:
The power dissipation (P(z)) is the amount of power absorbed per unit volume by a material (W m−3) when exposed to an electric field and is defined as follows:

The heating rate of a material has been derived from Maxwell's equation,19,29 as follows:
Theoretical equations for the complex permittivity
The impacts of temperature and frequency on the permittivities of solids are complex and this resulted in both extensive experimental and theoretical research from 1985 to 2005. Maxwell, Debye and Jonscher have developed various equations for solid materials. However, most of these equations are not universally applicable to the various material types. West et al. 34 concluded that, based on extensive experience with a wide range of crystalline and amorphous materials, an ideal Debye-like response is never achieved in practice. Jonscher 35 and Jonscher 36 developed the fractional power-law ‘universal’ dielectric frequency response, which matched the data quite well, although the exact mechanism, likely related to ion or polaron hopping, is still not fully understood. Dyre and Schroøder 37 demonstrated that the AC conductivity response of completely disordered systems, such as glasses, follows a single universal curve when properly normalised, with the real part of the AC conductivity (σ′) curve depending solely on the system's internal geometry. As shown in Figure 2, the AC conductivity remains constant at low frequencies, matching the DC conductivity. However, near the ‘relaxation’ frequency (fc), it begins to increase with a constant slope.
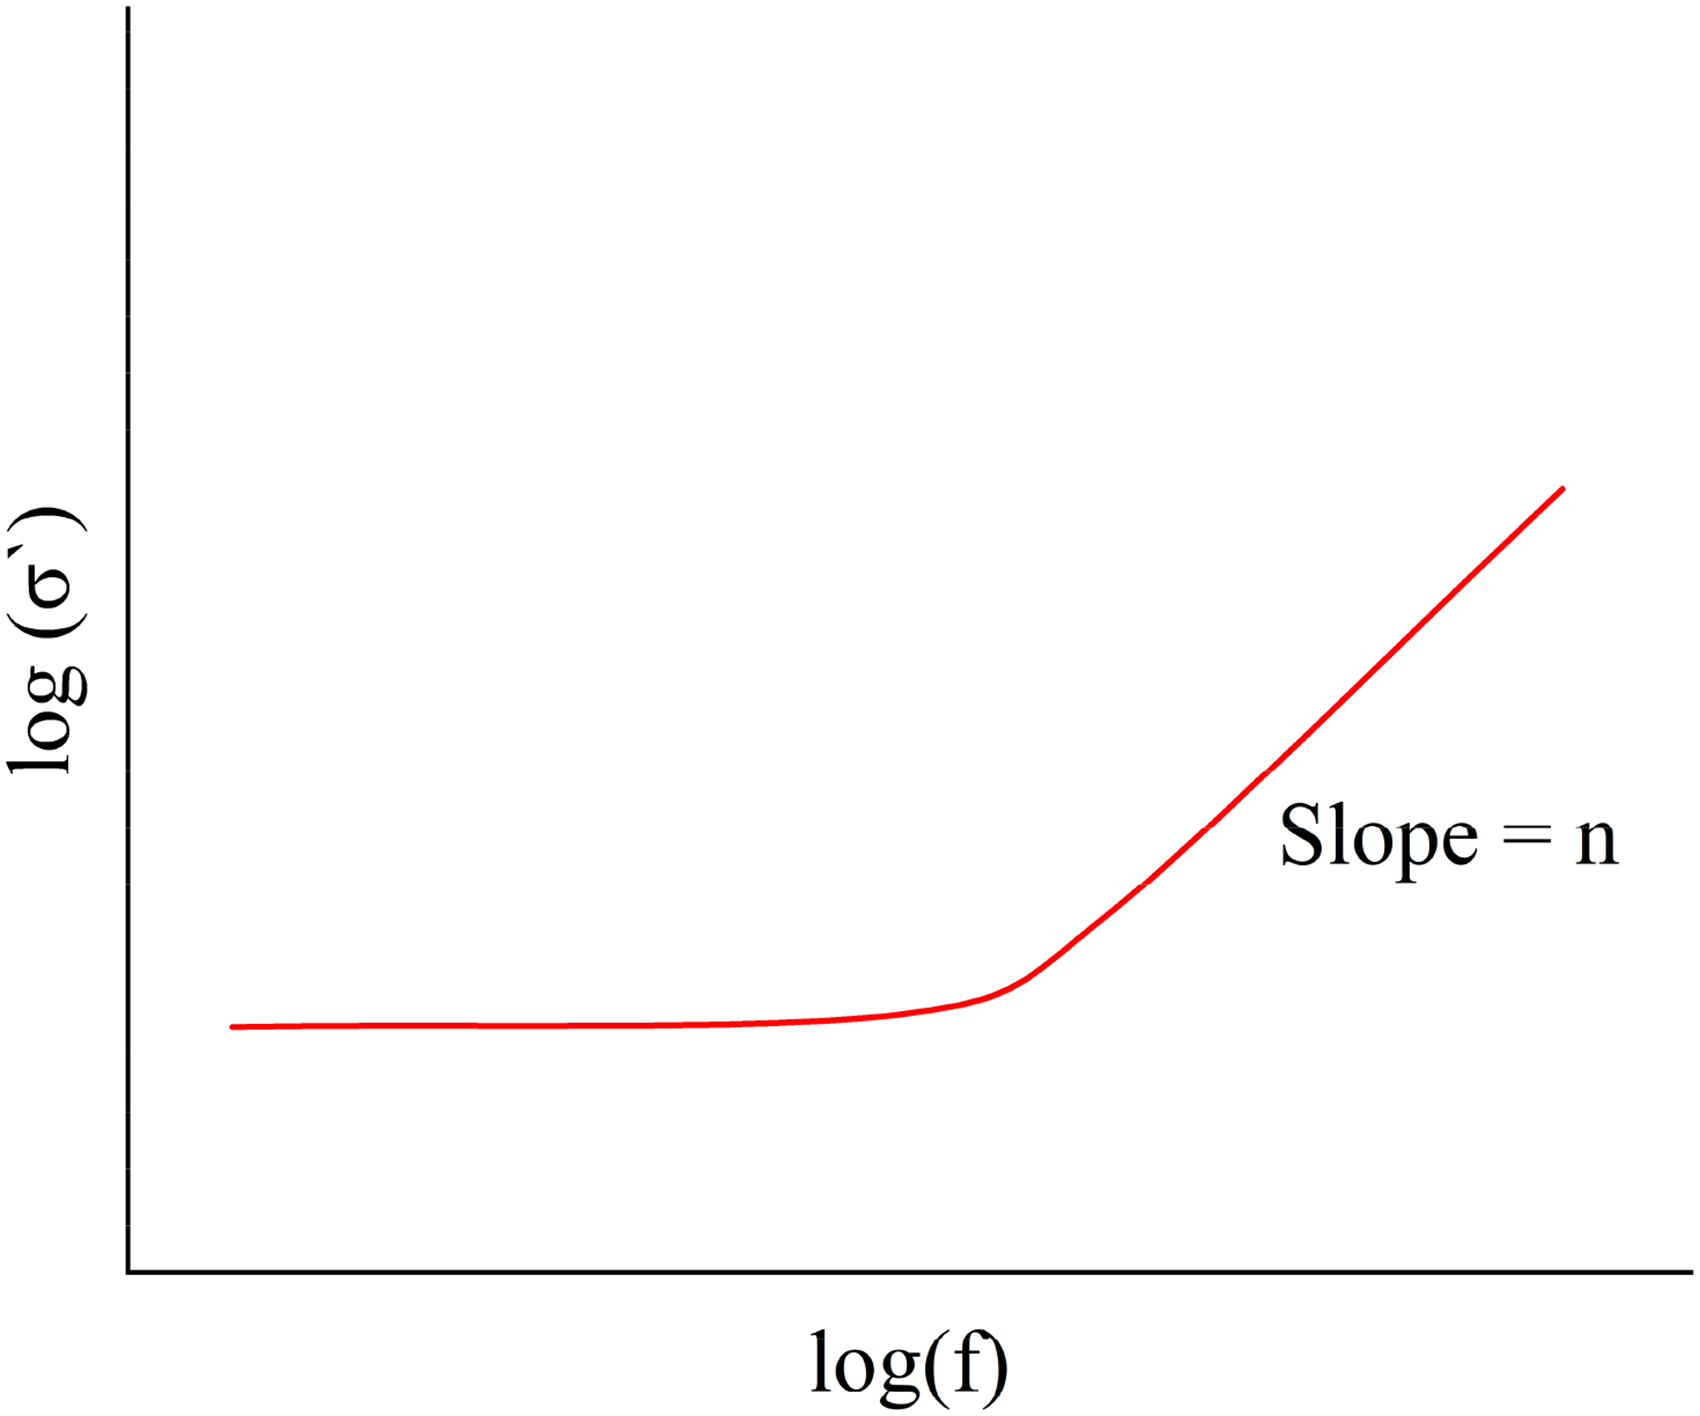
AC conductivity changes as a function of frequency.
The frequency (fc = ωc/2π) at which the curve is no longer horizontal is known as the ‘relaxation’ or ‘hopping’ frequency, and experimentally falls between 100 Hz and 100 kHz for temperatures ranging from 150 to 400 °C:
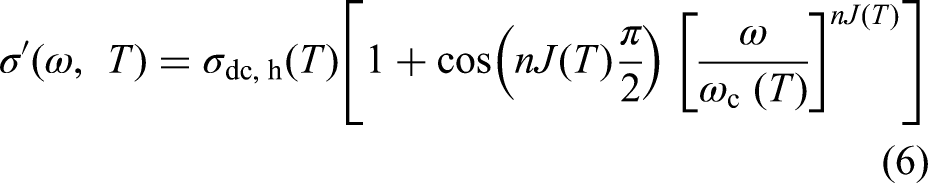
Many researchers including Baranovskii and Cordes, 38 Dyre and Schroøder, 37 Paz et al., 39 Kahnt, 40 Murugaraj et al. 41 have demonstrated that this universal dependence leads to relationships between ε′ and ε″, which are rooted in hopping charge carrier mechanisms, such as ionic conduction or polarisation. Traditional Debye equations for ε′ and ε″ are derived from either (1) permanent dipole rotation mechanisms, which are rare in solids and typically involve molecules or radicals in cages or on surfaces, or (2) Maxwell–Wagner configurations in heterogeneous materials that exhibit Debye-like frequency dependencies.
At frequencies significantly above

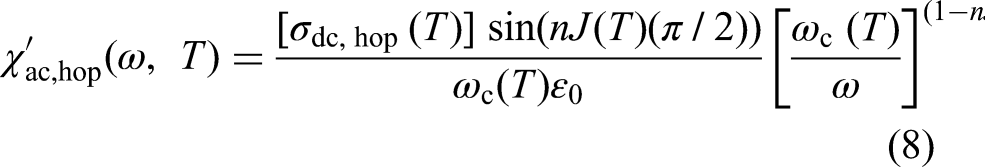

The total real and imaginary permittivities of a material are the sums of the contributions from each active mechanism:
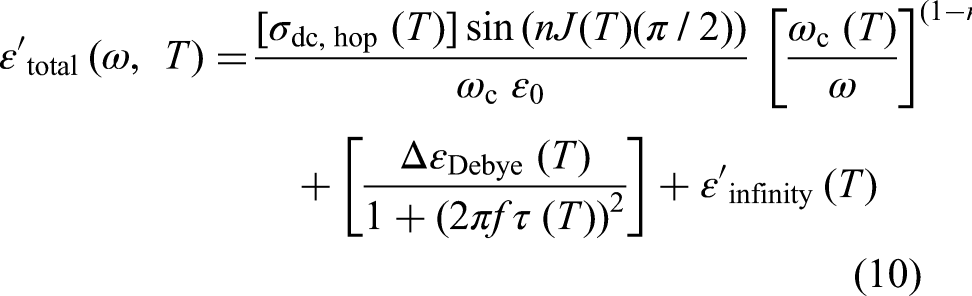
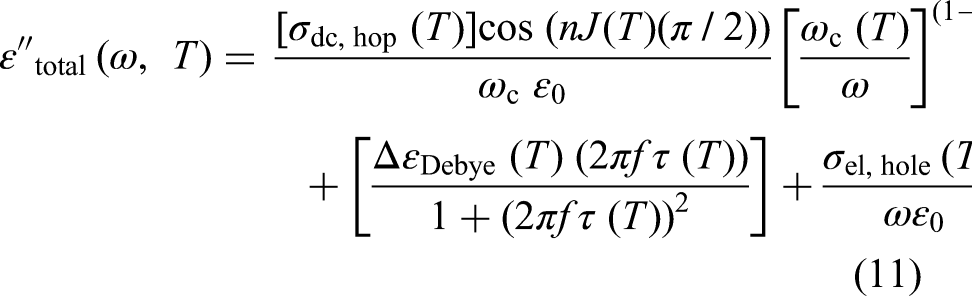
These two equations allow for a comparison between the experimental results and theoretical values, which is another objective of this study. The curve fitting is applied separately to the Debye and Jonscher equations to evaluate how well each individual equation aligns with the experimental results see the Supplemental materials). Identifying the nJ(T) value is the key factor for deriving the permittivity values. In this case, the frequency-dependent values of ε″ are fitted to the actual results, assuming either Debye or Jonscher behaviour, to estimate the best approximation for nJ(T) at each temperature. These nJ(T) values are then applied to equation (11) to achieve the best fit for each temperature. The constants are not sufficiently understood to predict nJ and Arrhenius activation values due to the complexity of the process and needs to be further modified.
Materials and method
Raw materials
The iron- and steelmaking by-products used in this study were BF sludge, BOF slag, BOF sludge, CRC dust and EAFSS dust. As shown in Figure 3(a) BF sludge is generated during hot metal production. 43 During the reduction process of iron ores in a BF, flue gas is produced. In the baghouse, the dust particles are separated from the flue gas and the dust contains valuable mineral particles, primarily haematite and coke. These particles are then transferred to water scrubbers and subjected to a centrifuge process, resulting in the formation of a thick sludge material mixed with water. In the subsequent step, the hot metal is transferred to a BOF, as illustrated in Figure 3(a). The primary function of the BOF is to reduce the carbon content of the hot metal by combustion with injected oxygen, forming CO(g) and CO2(g). Additionally, refining reactions such as dephosphorisation, desiliconisation and demanganisation occur. 44 Steel scrap is also added to the BOF, but in smaller proportions as compared to the EAF. Fluxing agents such as lime and dolomite are typically added to control the final steel and slag chemistry and protect the refractory walls of the furnace. Similar to the BF sludge, BOF sludge is generated from the flue gases in the BOF and is collected after the centrifuge process. CRC dust and EAFSS dust are generated at distinct stages of the stainless-steel production process, as illustrated in Figure 3(b). CRC dust is generated in the CRC, while EAF dust originates from the EAF. Both types of dust are collected in baghouses. 45
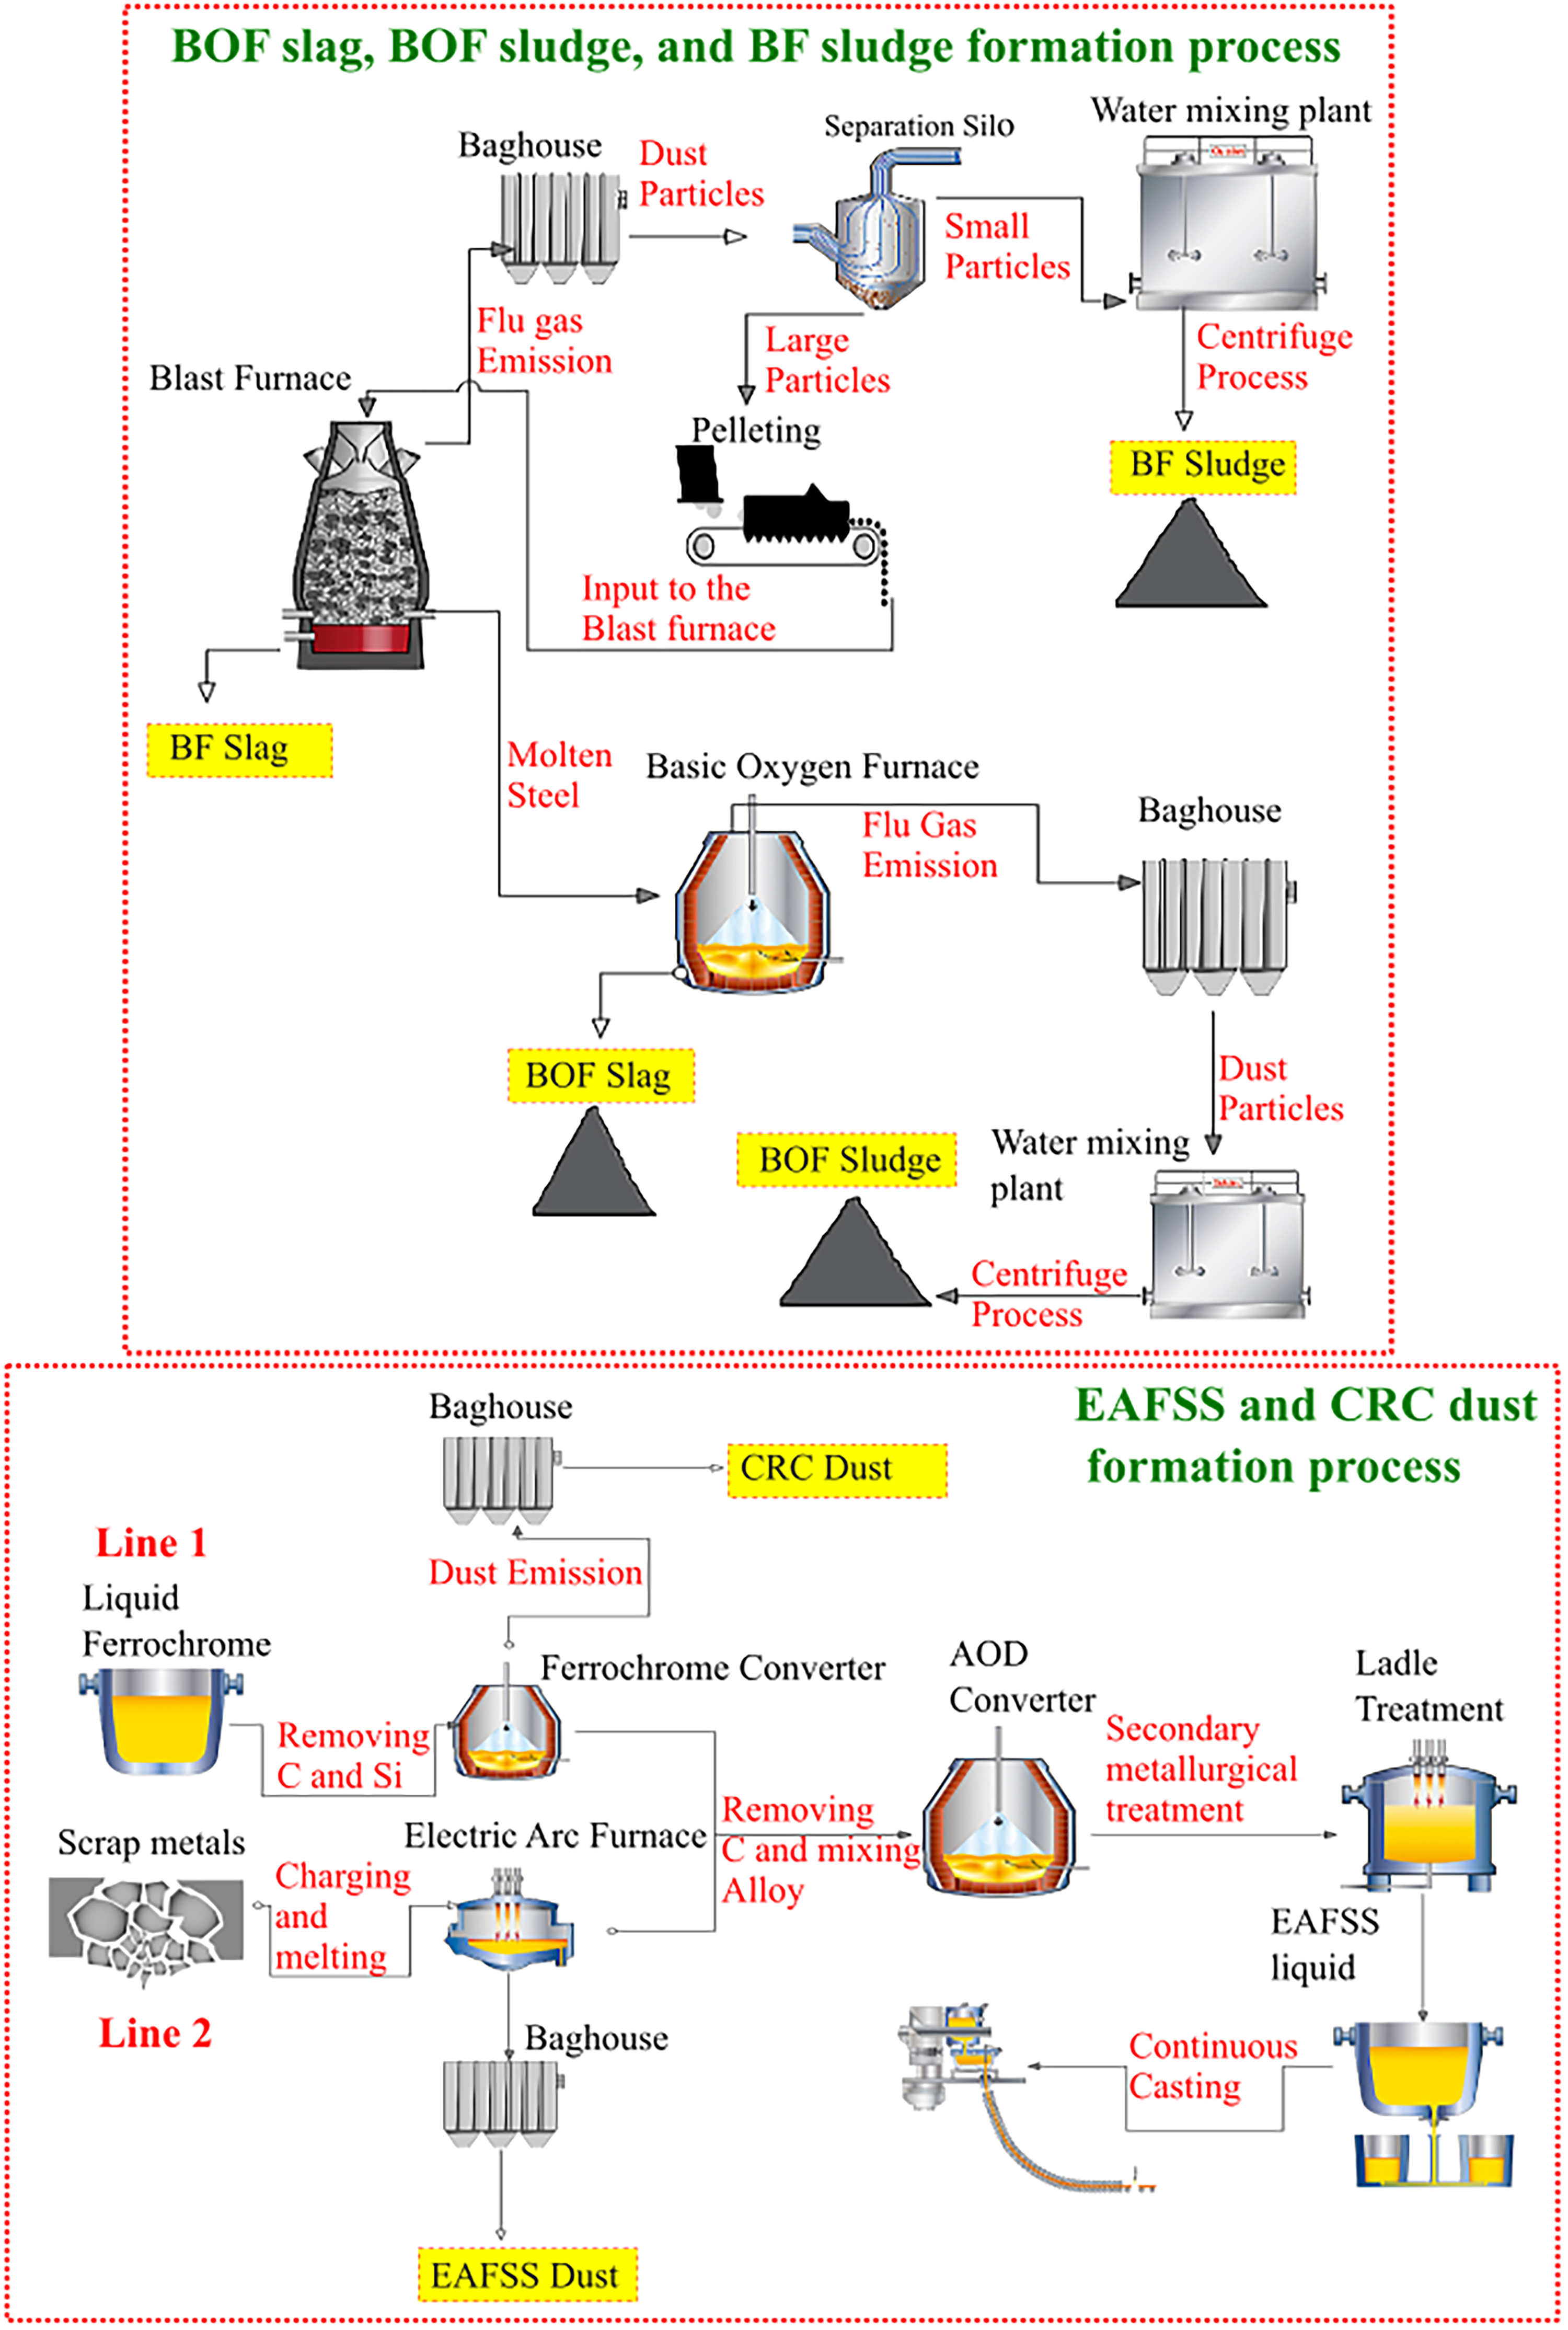
By-product formation in the iron- and steelmaking processes: (a) formation of BF sludge, BOF sludge, and BOF slag, and (b) formation of EAFSS and CRC dust. BF: blast furnace; BOF: basic oxygen furnace; EAFSS: electric arc furnace stainless steel; CRC: ferrochrome converter.
The chemical and mineralogical compositions of the iron- and steelmaking by-products utilised in the present research are given in Tables 1 and 2, respectively. BF sludge is mainly composed of coke and haematite, in addition to lime and quartz. 46 Magnetite is the major component of BOF sludge, with haematite, wustite and metallic iron as minor phases. 47 Iron chromite and zincite are the primary species in CRC dust, with minor lime and periclase. In EAFSS dust, franklinite and zincite are the main mineral phases. 48 BOF slag is mainly composed of calcium ferrite, lime and portlandite, with magnetite, wustite, metallic iron and quartz as secondary phases.
Chemical compositions of the by-products.
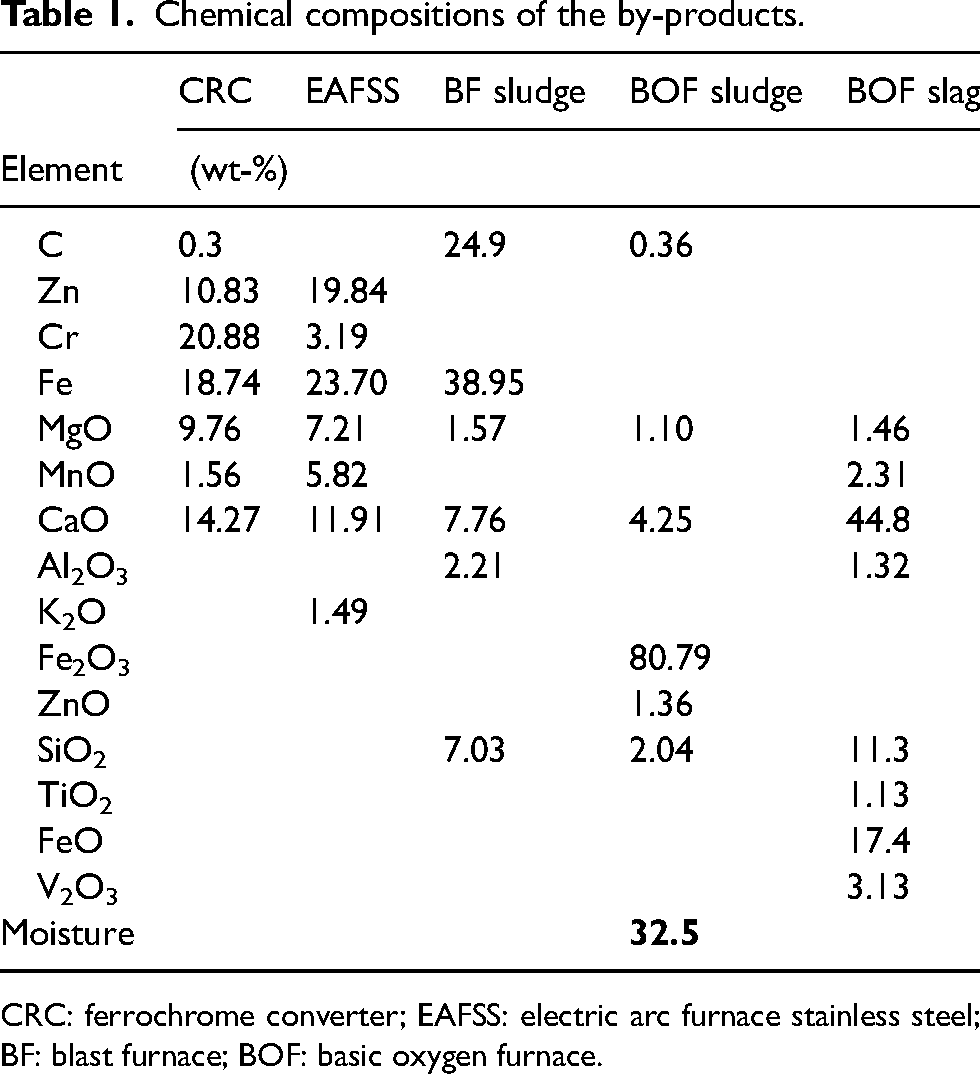
CRC: ferrochrome converter; EAFSS: electric arc furnace stainless steel; BF: blast furnace; BOF: basic oxygen furnace.
Mineralogical compositions of the by-products.
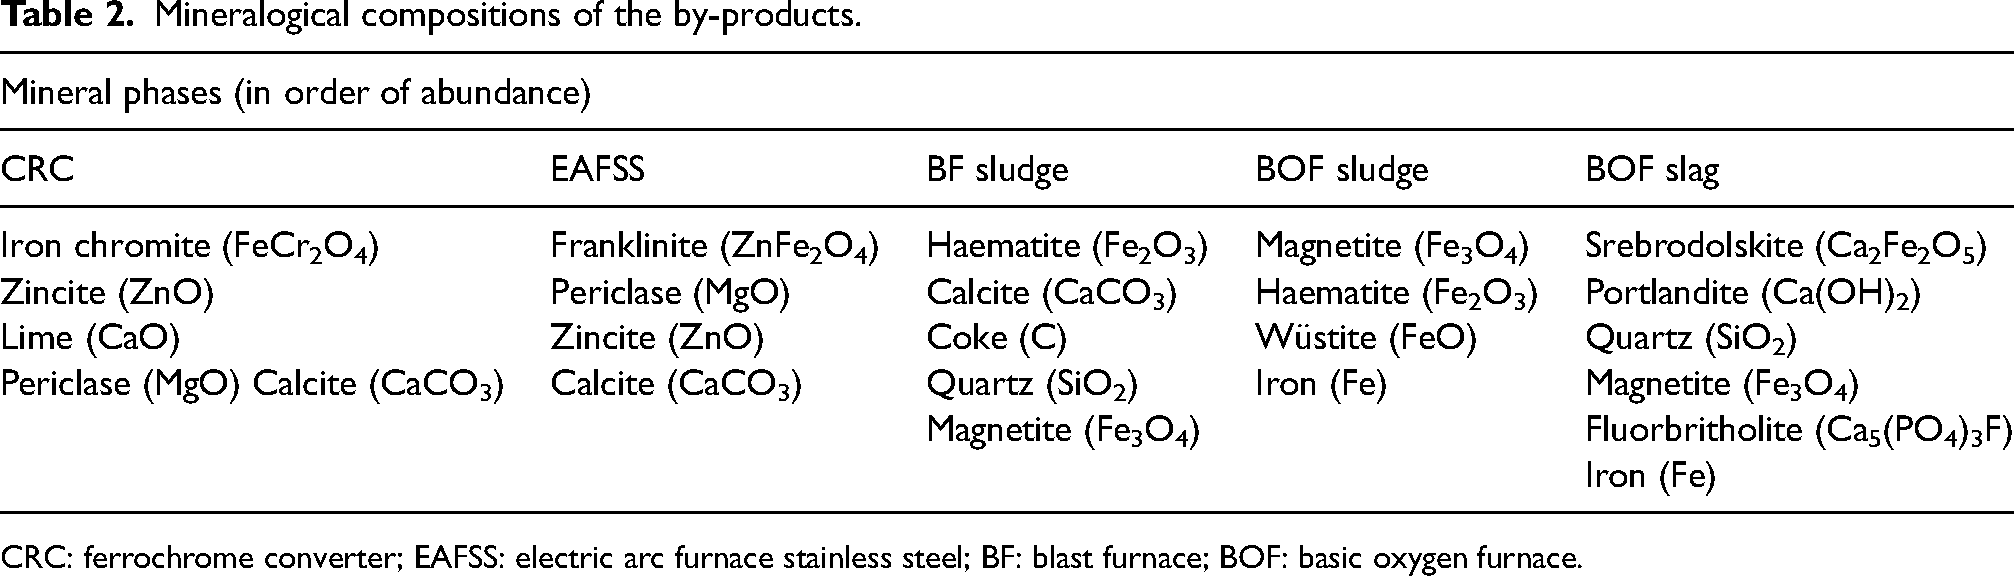
CRC: ferrochrome converter; EAFSS: electric arc furnace stainless steel; BF: blast furnace; BOF: basic oxygen furnace.
Permittivity analysis: cavity perturbation technique
In the cavity perturbation technique, the changes in the cavity response, specifically the resonant frequency and the quality factor, are obtained by comparing an empty sample holder with those measured with a sample in the holder.
In this method, measurements were taken of the transmission power over each resonance to obtain the peak frequency and Q factor of the transmission peak49, 50 . As shown in Figure 4, the cavity perturbation instrument setup consists of three main components: (1) a conventional heating furnace operated by computer control, (2) a TM0n0 cylindrical cavity with a diameter of 580 mm and a height of 50 mm, well-insulated and cooled to measure dielectric properties across various frequencies, operating at a fundamental mode of 400 MHz and (3) a long, cylindrical fused silica tube with an internal shelf to securely hold the sample in place during testing.
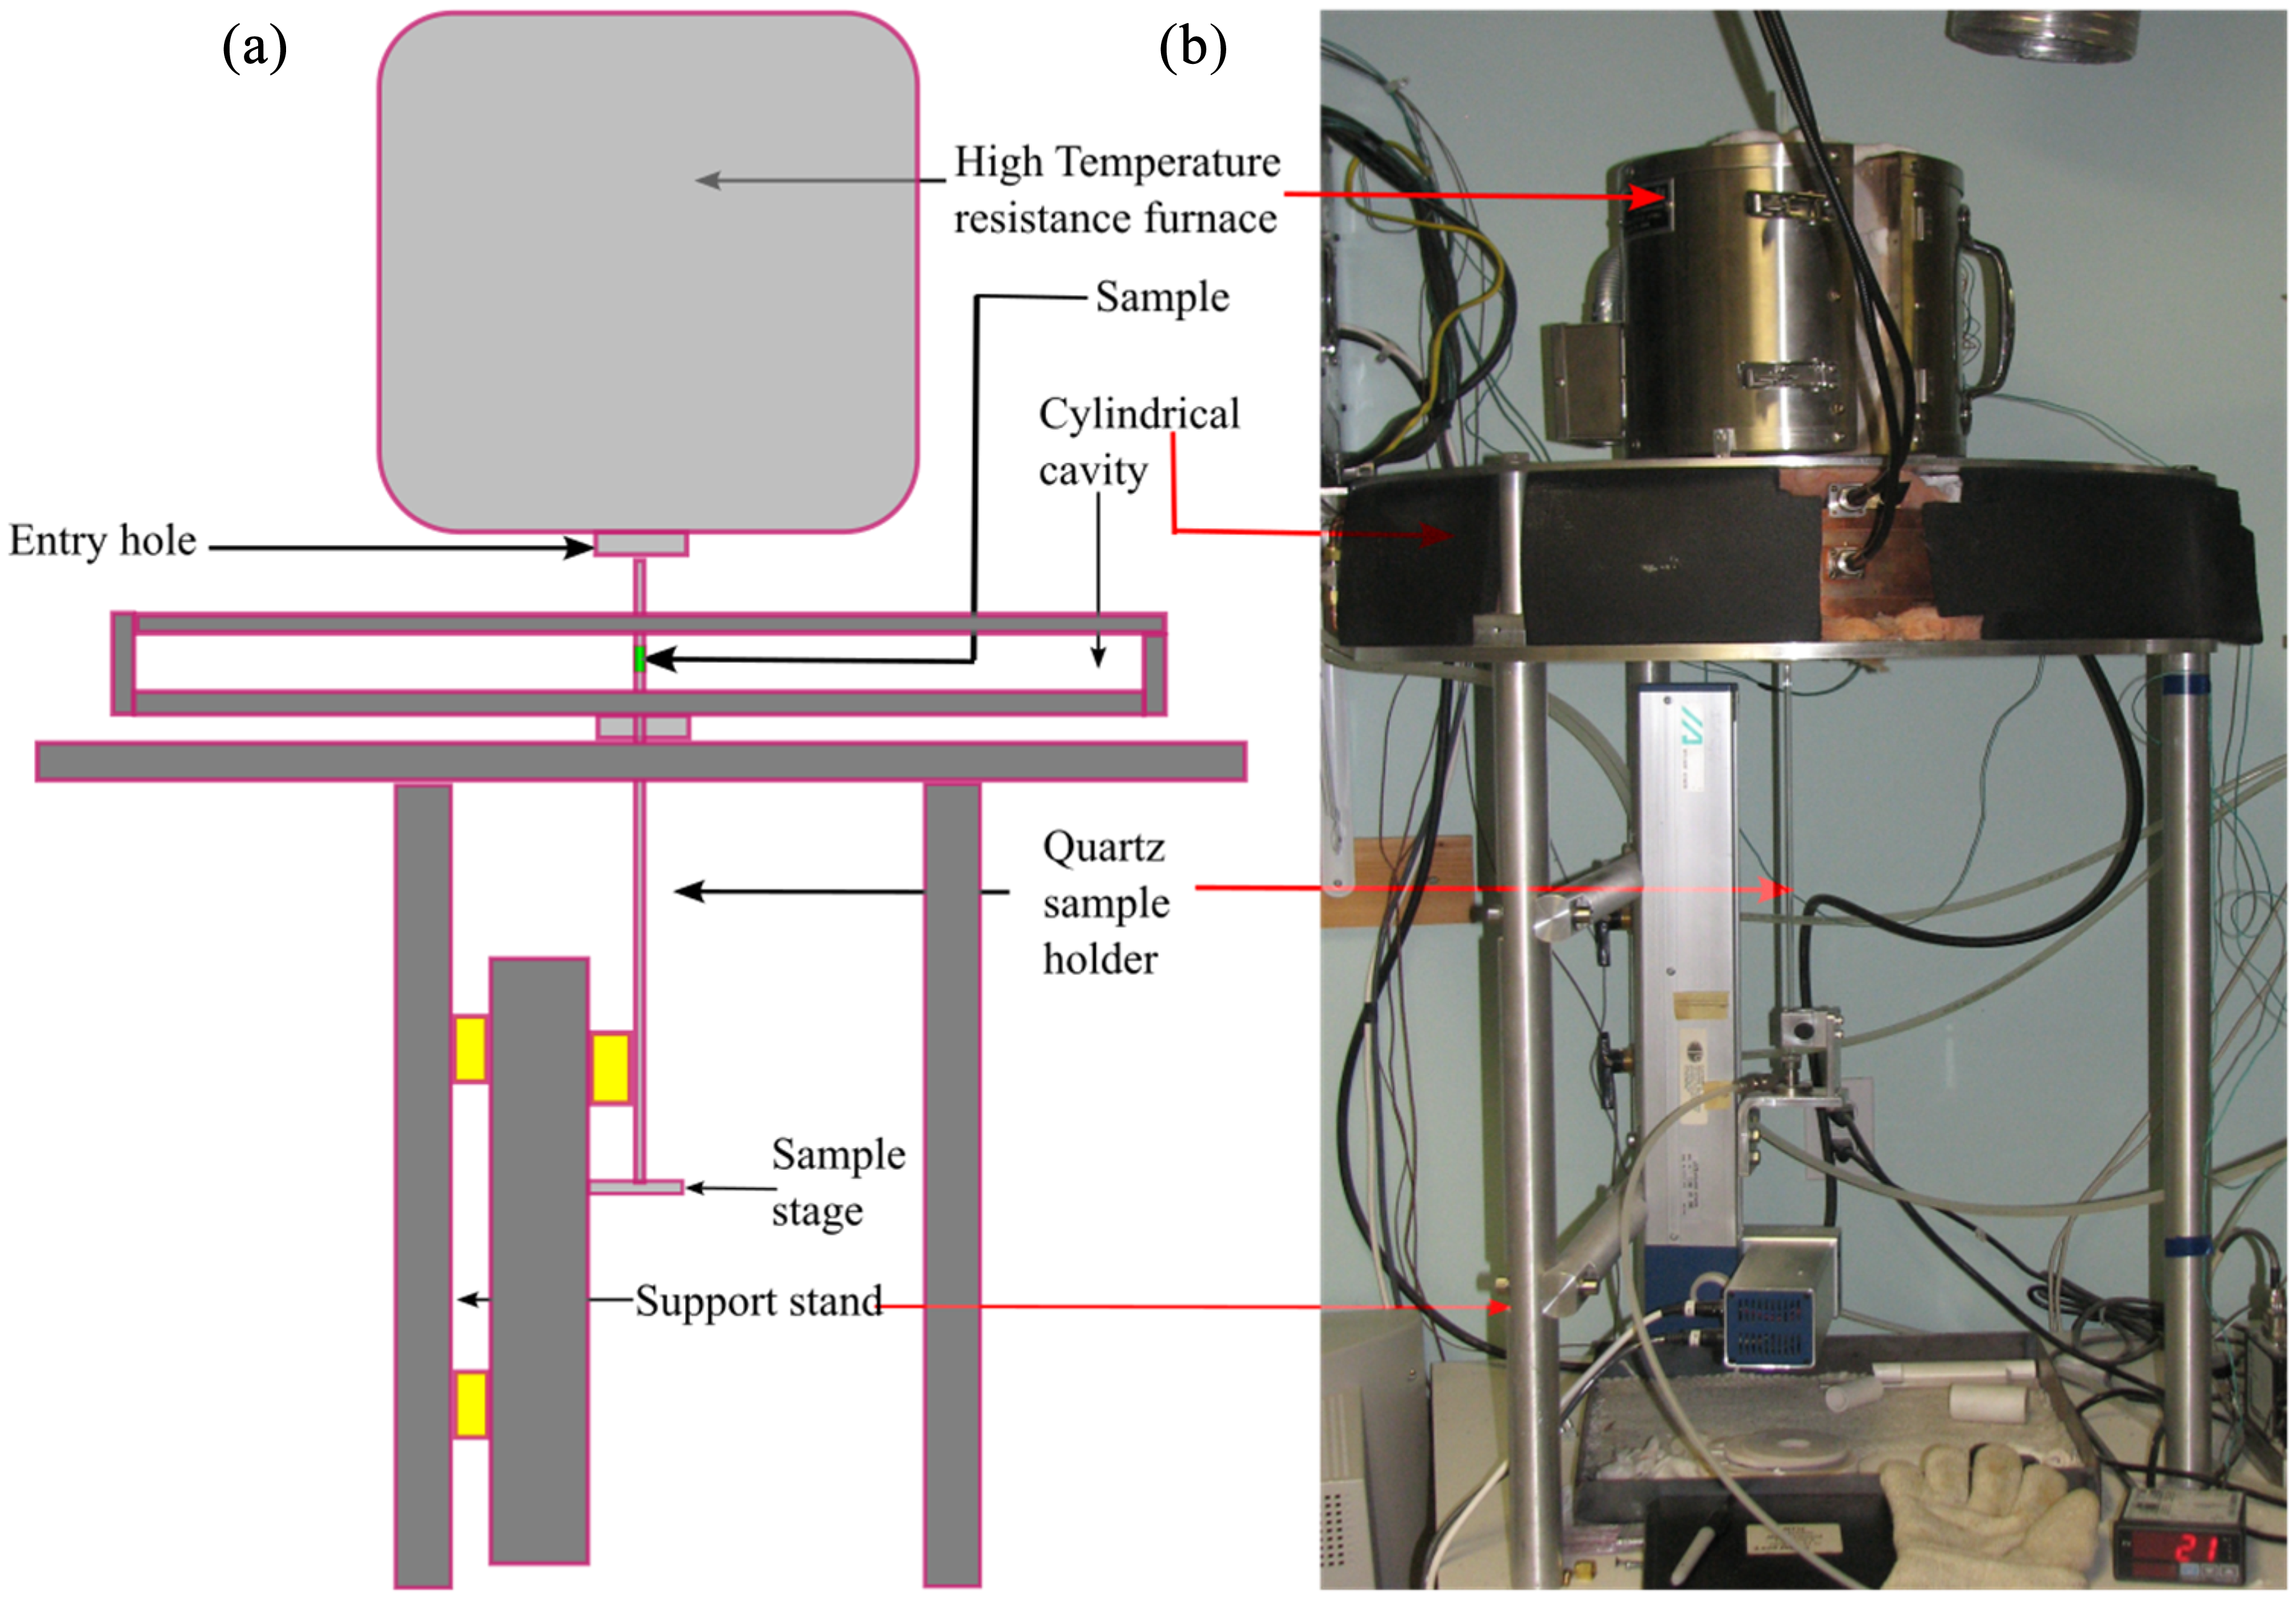
Schematic diagram of the microwave properties north (MPN) cavity perturbation system: (a) schematic diagram (modified from 22 and (b) real image.
To perform a measurement, the sample holder containing the sample is first pre-heated in the conventional furnace and then is rapidly moved down into the central field region of the cavity. This cavity is constructed from furnace-brazed, thick-walled Oxygen-Free High Conductivit copper, with cooling channels integrated into the central axial section since it is directly exposed to high temperatures. A typical measurement ‘run’ consists of two cycles over the planned temperature sequence. The first cycle, with only the empty holder, establishes baseline empty holder subtractions. The identical second cycle, with the sample, provides the required frequency and Q-change data.
In this study, a GE-214 fused silica tube with a sample holder was used, with an outer diameter of 8 mm and an inner diameter of 6 mm. A controlled atmosphere was maintained around the sample during the experiment by flowing 10 sccm (standard cubic centimetres per min) of ultra-high purity nitrogen vertically past the sample holder. To determine the sample mass, the sample holder was first weighed empty, then reweighed after loading with the sample. Three pressed pellets of the powdered material were used for the EAFSS dust analysis. For the CRC dust, BOF slag and BF sludge samples, the powders were loaded into an alumina crucible by carefully tapping it on a tabletop. The BOF sludge sample, being a damp, sticky and pasty mass, could not be handled like the other powder samples. Instead, a cork borer was used to create a ‘plug’ of the appropriate diameter to fit the crucible. After the crucible was loaded into the holder, a quartz lid was placed on top to prevent air from back-streaming into the holder. The permittivities were measured at five frequencies: 397, 912, 1429, 1948 and 2466 MHz. The permittivities measurements were performed three times at room temperature and then the temperature was ramped up to 1150 °C in steps of 50 °C. After reaching the maximum temperature, the samples were cooled down to 100 °C in 50 °C intervals before returning to room temperature. These measurements enable the determination of the permittivity values:
The generalised formulae for calculating the permittivities of a specimen positioned at the maximum electric field in the resonant cavity are given in equations (12), (13) and (14) as follows:
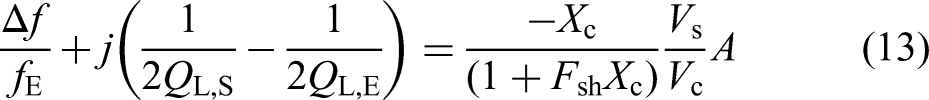
where fE and QL,E are the cavity frequency and the loaded Q (unitless), respectively, with the empty holder in place and Δf is the frequency shift produced by introducing the sample. QL,S is the loaded cavity Q, measured with the holder containing the sample. Fsh is a real number dependent only on the sample shape. Vs and Vc are sample and cavity volumes, respectively. A is a unitless constant dependent on the shape of the cavity electric field spatial distribution in each resonance mode, The values of A and Fsh are determined for each resonant mode by measurements on many calibration test samples of varying dimensions and known dielectric constant values.
After calculating the complex susceptibility Xc the complex permittivity can be calculated by using the below equation:
A measurement consists of pre-heating the holder (with sample) to the desired temperature in the conventional furnace and then rapidly moving the holder down so the sample is in the centre of the cavity, the region of maximum electric field.19,53
Thermal analysis
TG and DSC studies were conducted using a NETZSCH STA 449 F3 graphite furnace, enabling simultaneous TG and DSC determinations. The furnace's off-gas line is connected to a NETZSCH QMS 403 D mass spectrometry (MS) analyser which provides data on evolved gases during TG analysis. The objective was to determine the thermal behaviour of the various by-product materials under the same atmosphere and temperature conditions as used in the permittivity studies. The thermal analysis data was utilised to interpret the permittivity results.
Results and discussion
CRC dust
The thermal analysis results for the CRC dust under a nitrogen atmosphere up to 1200 °C are shown in Figure 5. As shown in Figure 5(a) and (b), the total mass loss of the CRC dust can be categorised into two main distinct stages: dehydroxylation and decomposition of carbonates. It should be noted that in the XRD analysis it is not possible to differentiate between CaCO3 and Ca(OH)2 since both have almost the same small peak patterns. From 350 to 430 °C the dehydroxylation process has occurred and Ca(OH)2 is converted into CaO as shown in equation (15).
45
This reaction is associated with an endothermic peak (Figure 5(c)) and a rapid fluctuation in the ionic current curve corresponding to water vapour as shown in Figure 5(d) over this temperature range. From 530 to 630 °C, CaCO3 is converted into CaO, as shown in equation (16). This temperature range is characterised by fluctuations in the ionic current curve related to CO2(g) (Figure 5(d)), which is accompanied by an endothermic pattern in the DSC curve (Figure 5(c)). Subsequently, no significant variations are observed in the TG, DSC and MS curves, indicating that no reduction or significant reaction occurred at higher temperatures due to the absence of a reducing agent:

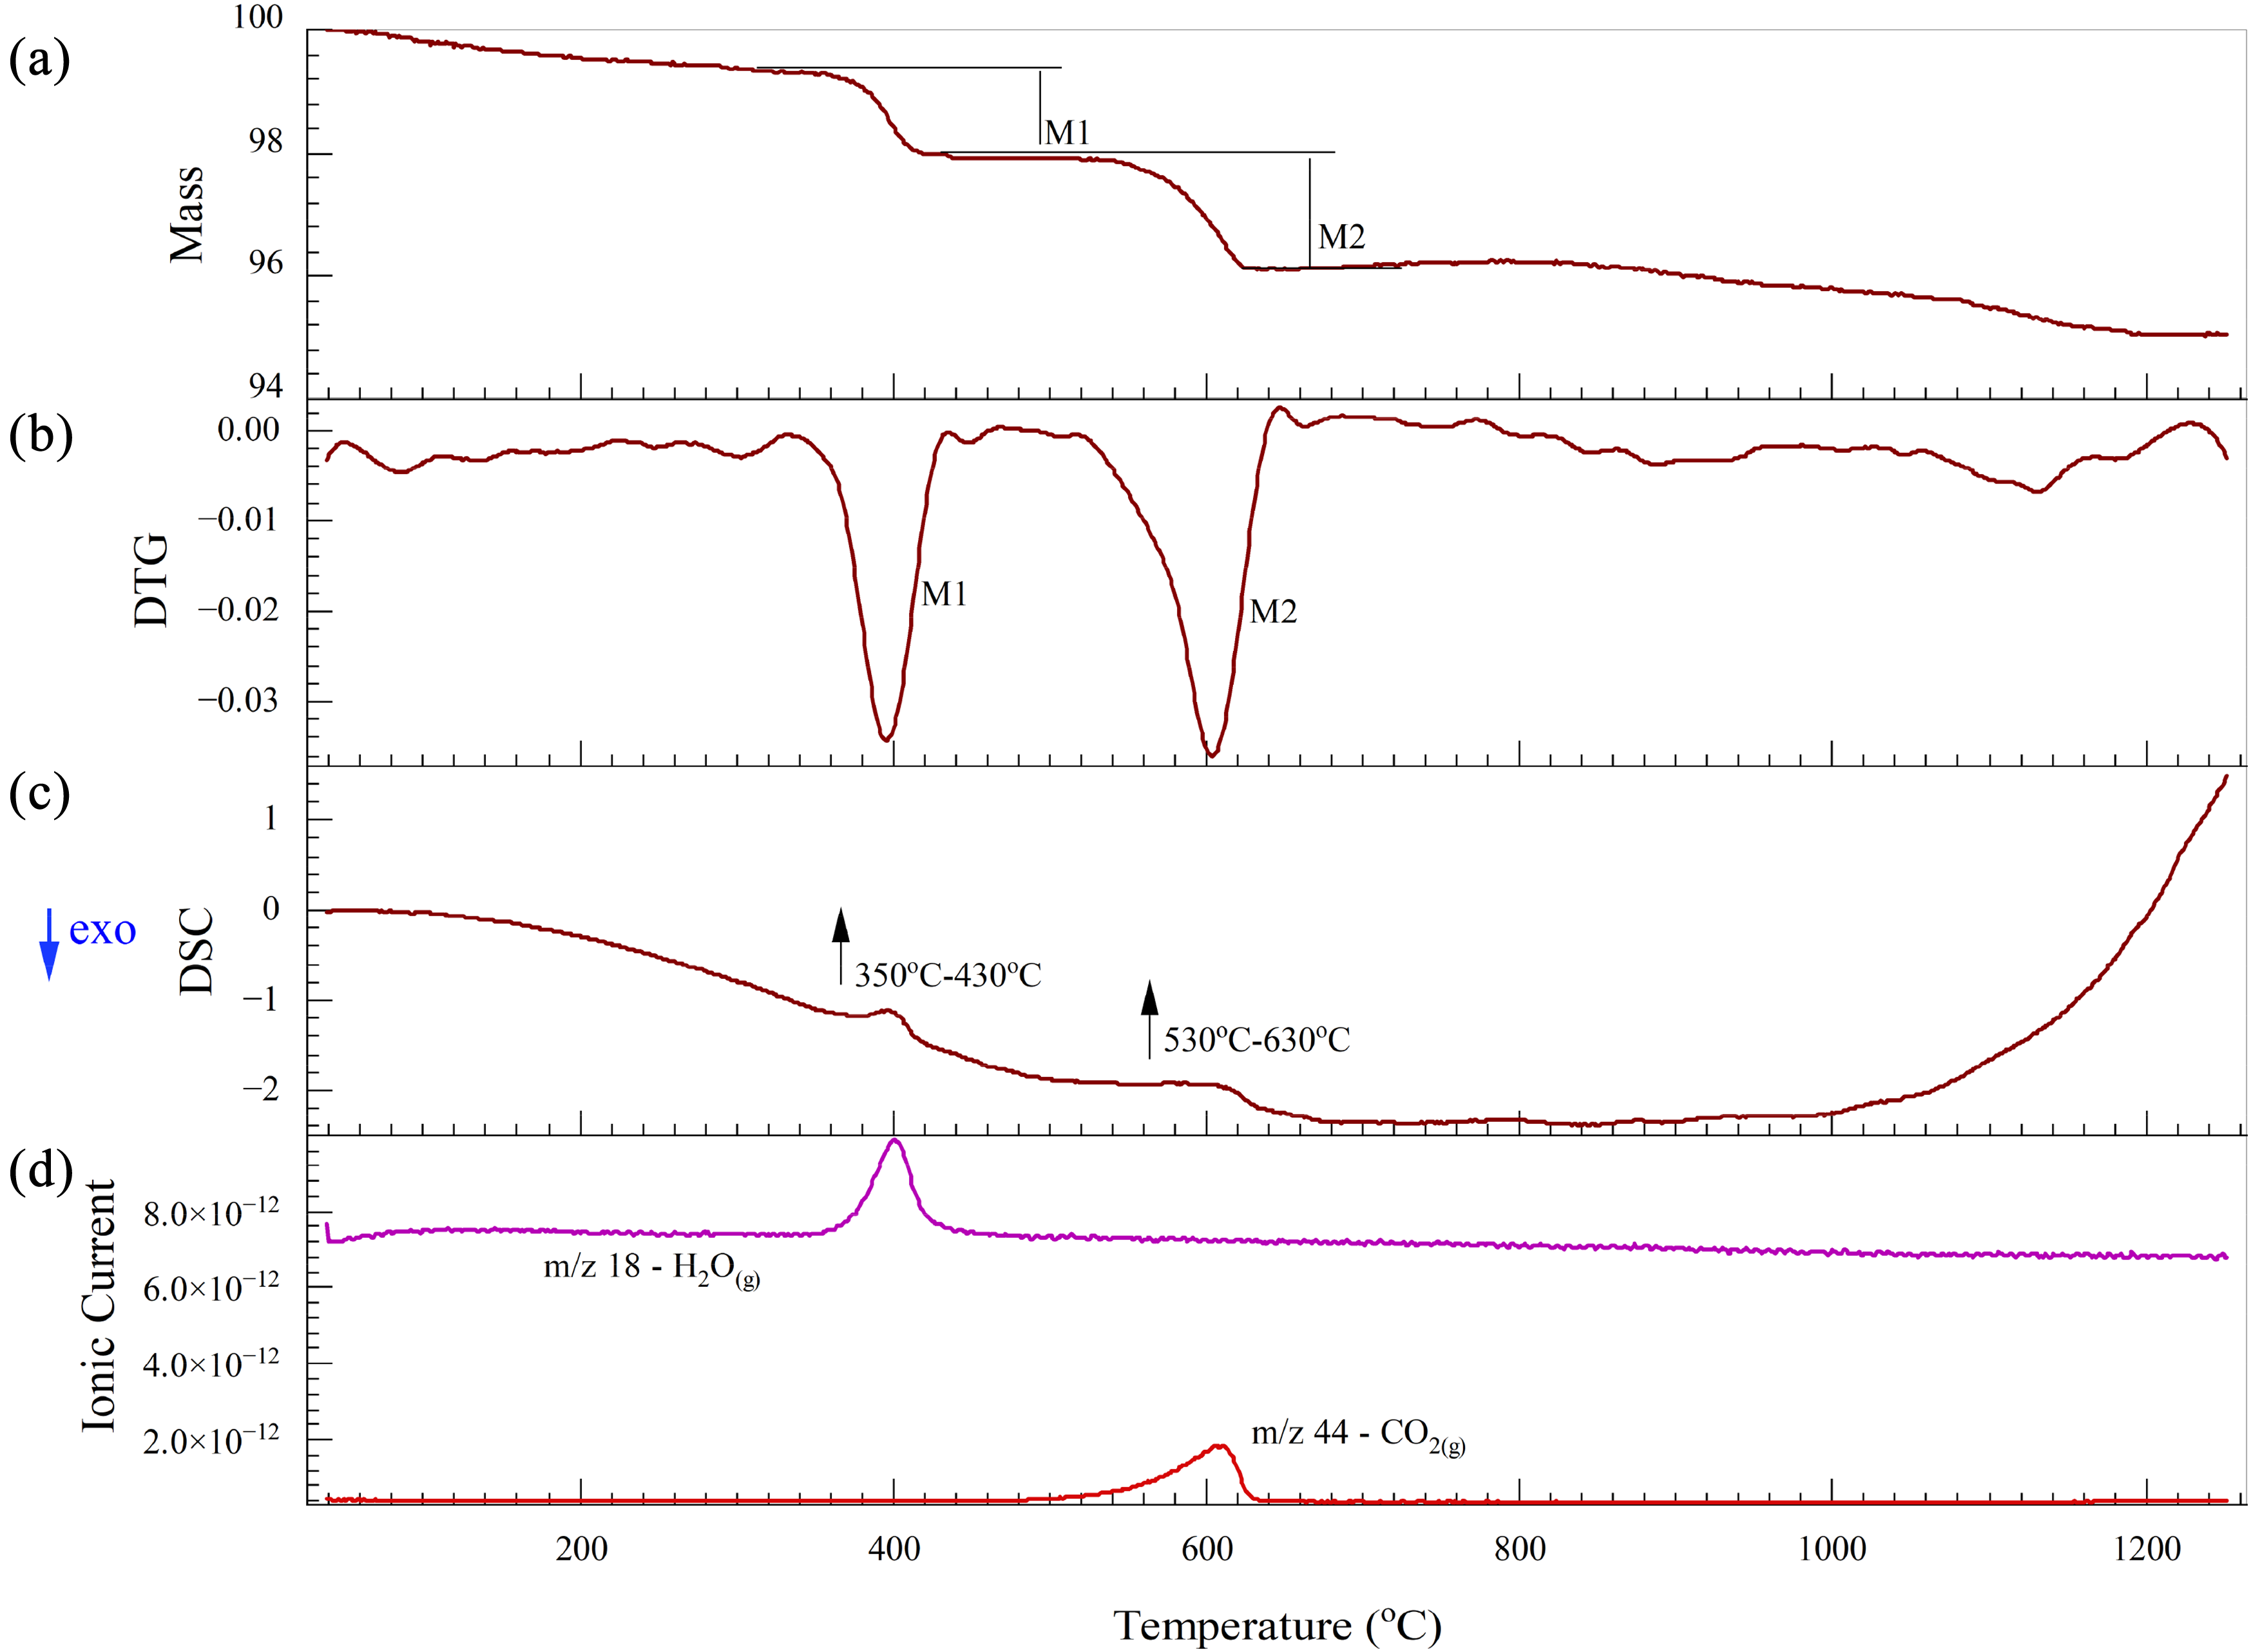
Thermal analysis of CRC dust under a nitrogen atmosphere: (a) TG; (b) DTG; (c) DSC and (d) Mass spectrum. CRC: ferrochrome converter; TG: thermogravimetric; DSC: differential scanning calorimetry.
The permittivities of the CRC dust under a nitrogen atmosphere are shown as a function of temperature in Figure 6. The real and imaginary permittivities follow similar trends with slight variations across the experimental temperature range and frequency bands as shown in Figure 6(a) and (b), respectively. Both permittivities are relatively low and inversely proportional to frequency, with the maximum permittivities observed at the lowest frequency of 397 MHz. Up to 600 °C, the real permittivity remains stable, demonstrating that temperature does not significantly impact the microwave absorbance. The imaginary permittivity undergoes a significant transition at about 400 °C and this indicates a change in the loss mechanism (Figure 6(b)). At temperatures below 400 °C, dipolar losses dominate due to the presence of water and hydroxyl groups. 54 The high content of metallic oxides in the CRC dust introduces free electrons, which begin to move in response to the external electric field as the temperature increases. 55 This shift in the loss mechanism, as seen in Figure 6(b), occurs around 400 °C. Between 600 and 800°C, the real permittivity gradually increases, with the effect being more significant at lower frequencies. Between 750 and 900 °C the imaginary permittivity exhibits a notably steeper gradient, particularly in the lower frequency bands, for example at 397 MHz, while the real permittivity gradually increases up to 1050 °C. Bobicki et al. 51 have explained that the imaginary permittivity is directly proportional to the electric conductivity and the frequency is inversely proportional to the real and the imaginary permittivities. At lower frequencies, ions have more time to move in response to the applied field, enhancing the material's ability to store and dissipate energy due to frictional forces from ionic motion. In the CRC dust, the primary mineral phase is iron chromite, and the ionic conductivity increases at elevated temperatures due to the rapid movement of electrons and ions in the iron chromite phase. 51 Beyond 1050 °C, both permittivities rise sharply across all frequency bands, signalling the onset of the sintering process at elevated temperatures.
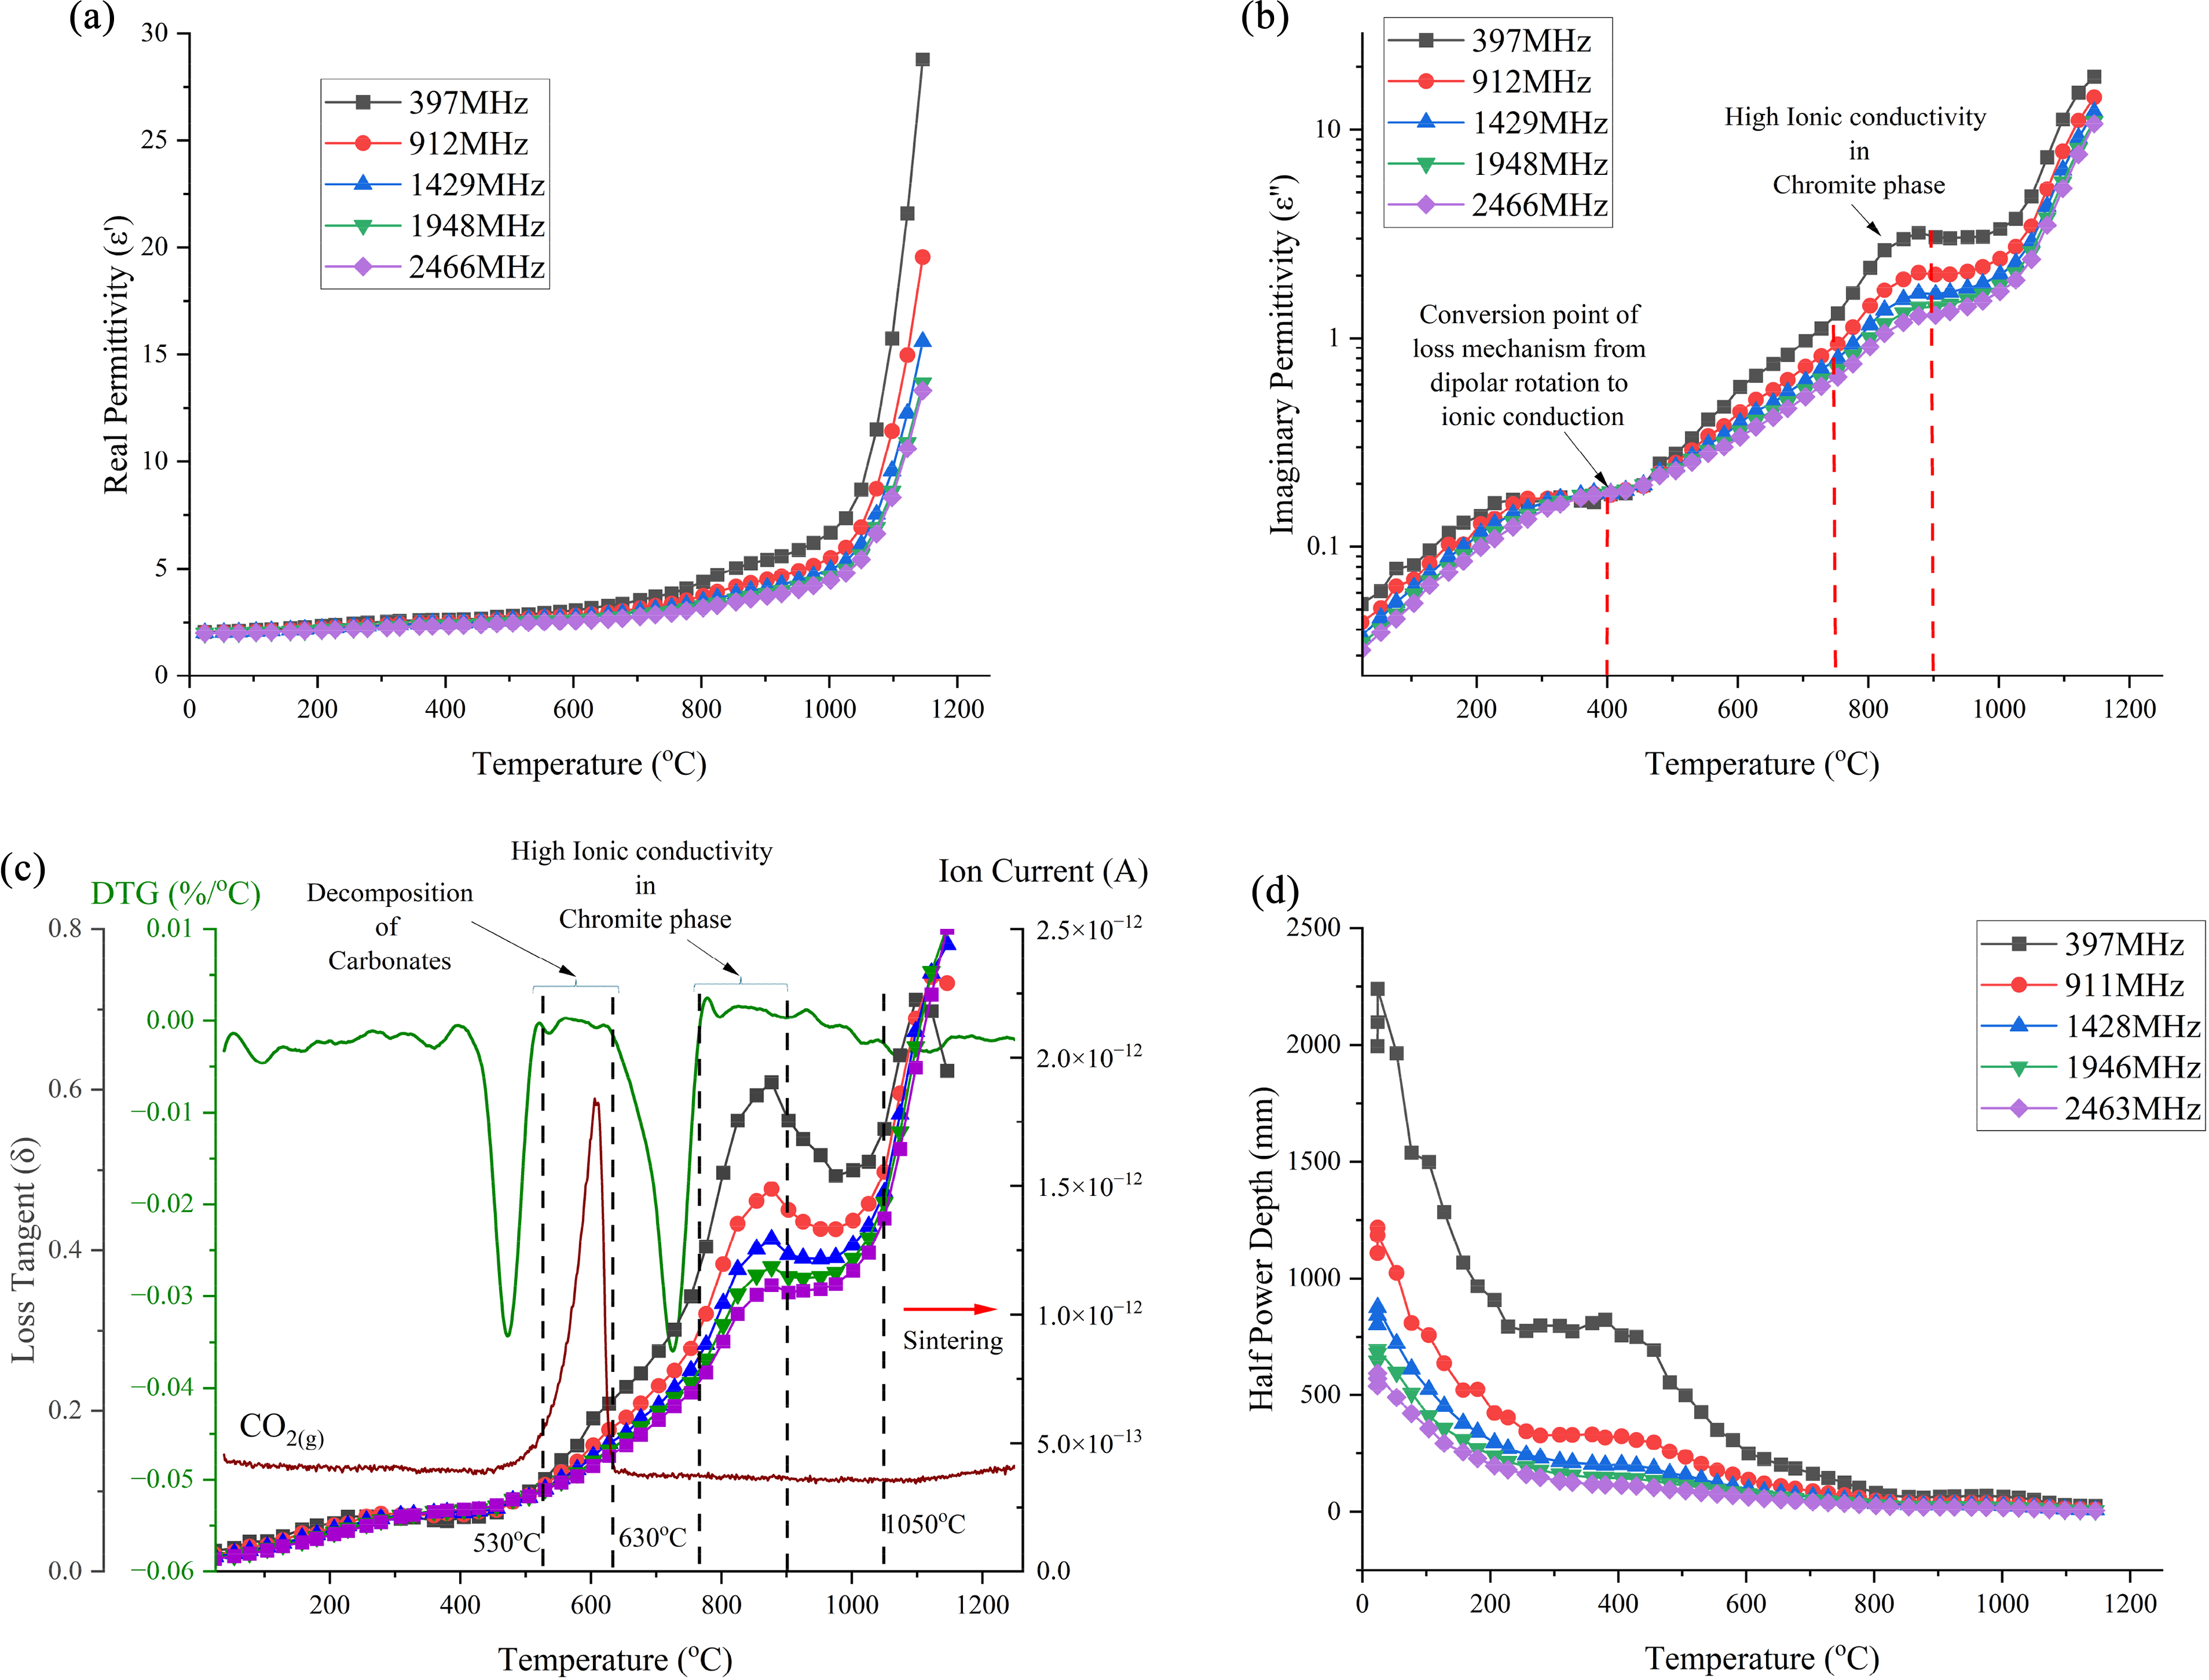
Permittivities, loss tangent and half-power depth of CRC dust: (a) real permittivity; (b) imaginary permittivity; (c) loss tangent; DTG and MS curves and (d) half-power depth (initial density: 1.37 g cm−3). CRC: ferrochrome converter; MS: mass spectrometry.
The loss tangent curve in Figure 6(c) indicates that after 530 °C, the CRC dust should heat more effectively with microwaves, as the loss tangent gradually increases to 630 °C. In this temperature range, the derivative thermogravimetric (DTG) curve indicates significant mass loss, due to the decomposition of carbonates, with notable fluctuations in the ionic current curve due to CO2(g) evolution (equation (16)). Between 750 and 900 °C, there is a rapid increase in the loss tangent, due to ionic conduction with higher electron hopping in the iron chromite phase. Subsequently, there is a sudden drop in the loss tangent around 1050 °C, and thereafter the loss tangent increases again dramatically due to the sintering process which occurred after 1050 °C. 56 Materials with loss tangents greater than 0.05 are considered to effectively heat in a microwave field. 57 The loss tangent in this sample remains significantly higher than the threshold value of 0.05, indicating that this CRC dust is an excellent candidate for microwave heating.
Figure 6(d) illustrates the variation of the HPD for the CRC dust with temperature at different frequencies. This result is crucial for determining the optimal sample thickness, as the HPD is the distance the microwaves penetrate before the power is reduced to half of its initial power at the surface. The HPD is higher at lower temperatures, exceeding 2000 mm at the lowest frequency of 397 MHz, and decreases with increasing frequency. At lower frequencies, the sample thickness can be increased up to 80 mm without affecting microwave energy absorption until the temperature reaches about 800 °C. However, at higher frequencies, the HPD is reduced. As shown in Figure 6(d), for a frequency of 2463 MHz, the sample thickness should be below 25 mm when heated to 800 °C to ensure uniform heating.
EAFSS dust
The thermal analysis of the EAFSS dust under a nitrogen atmosphere is shown in Figure 7. The mass loss between 380 and 430 °C corresponds closely to the endothermic reaction observed in the DSC curve illustrated in Figure 7(c) and is attributed to the dehydroxylation process as given in equation (15). This process is associated with the fluctuations in water vapour observed by the mass spectra over this temperature interval (Figure 7(d)).
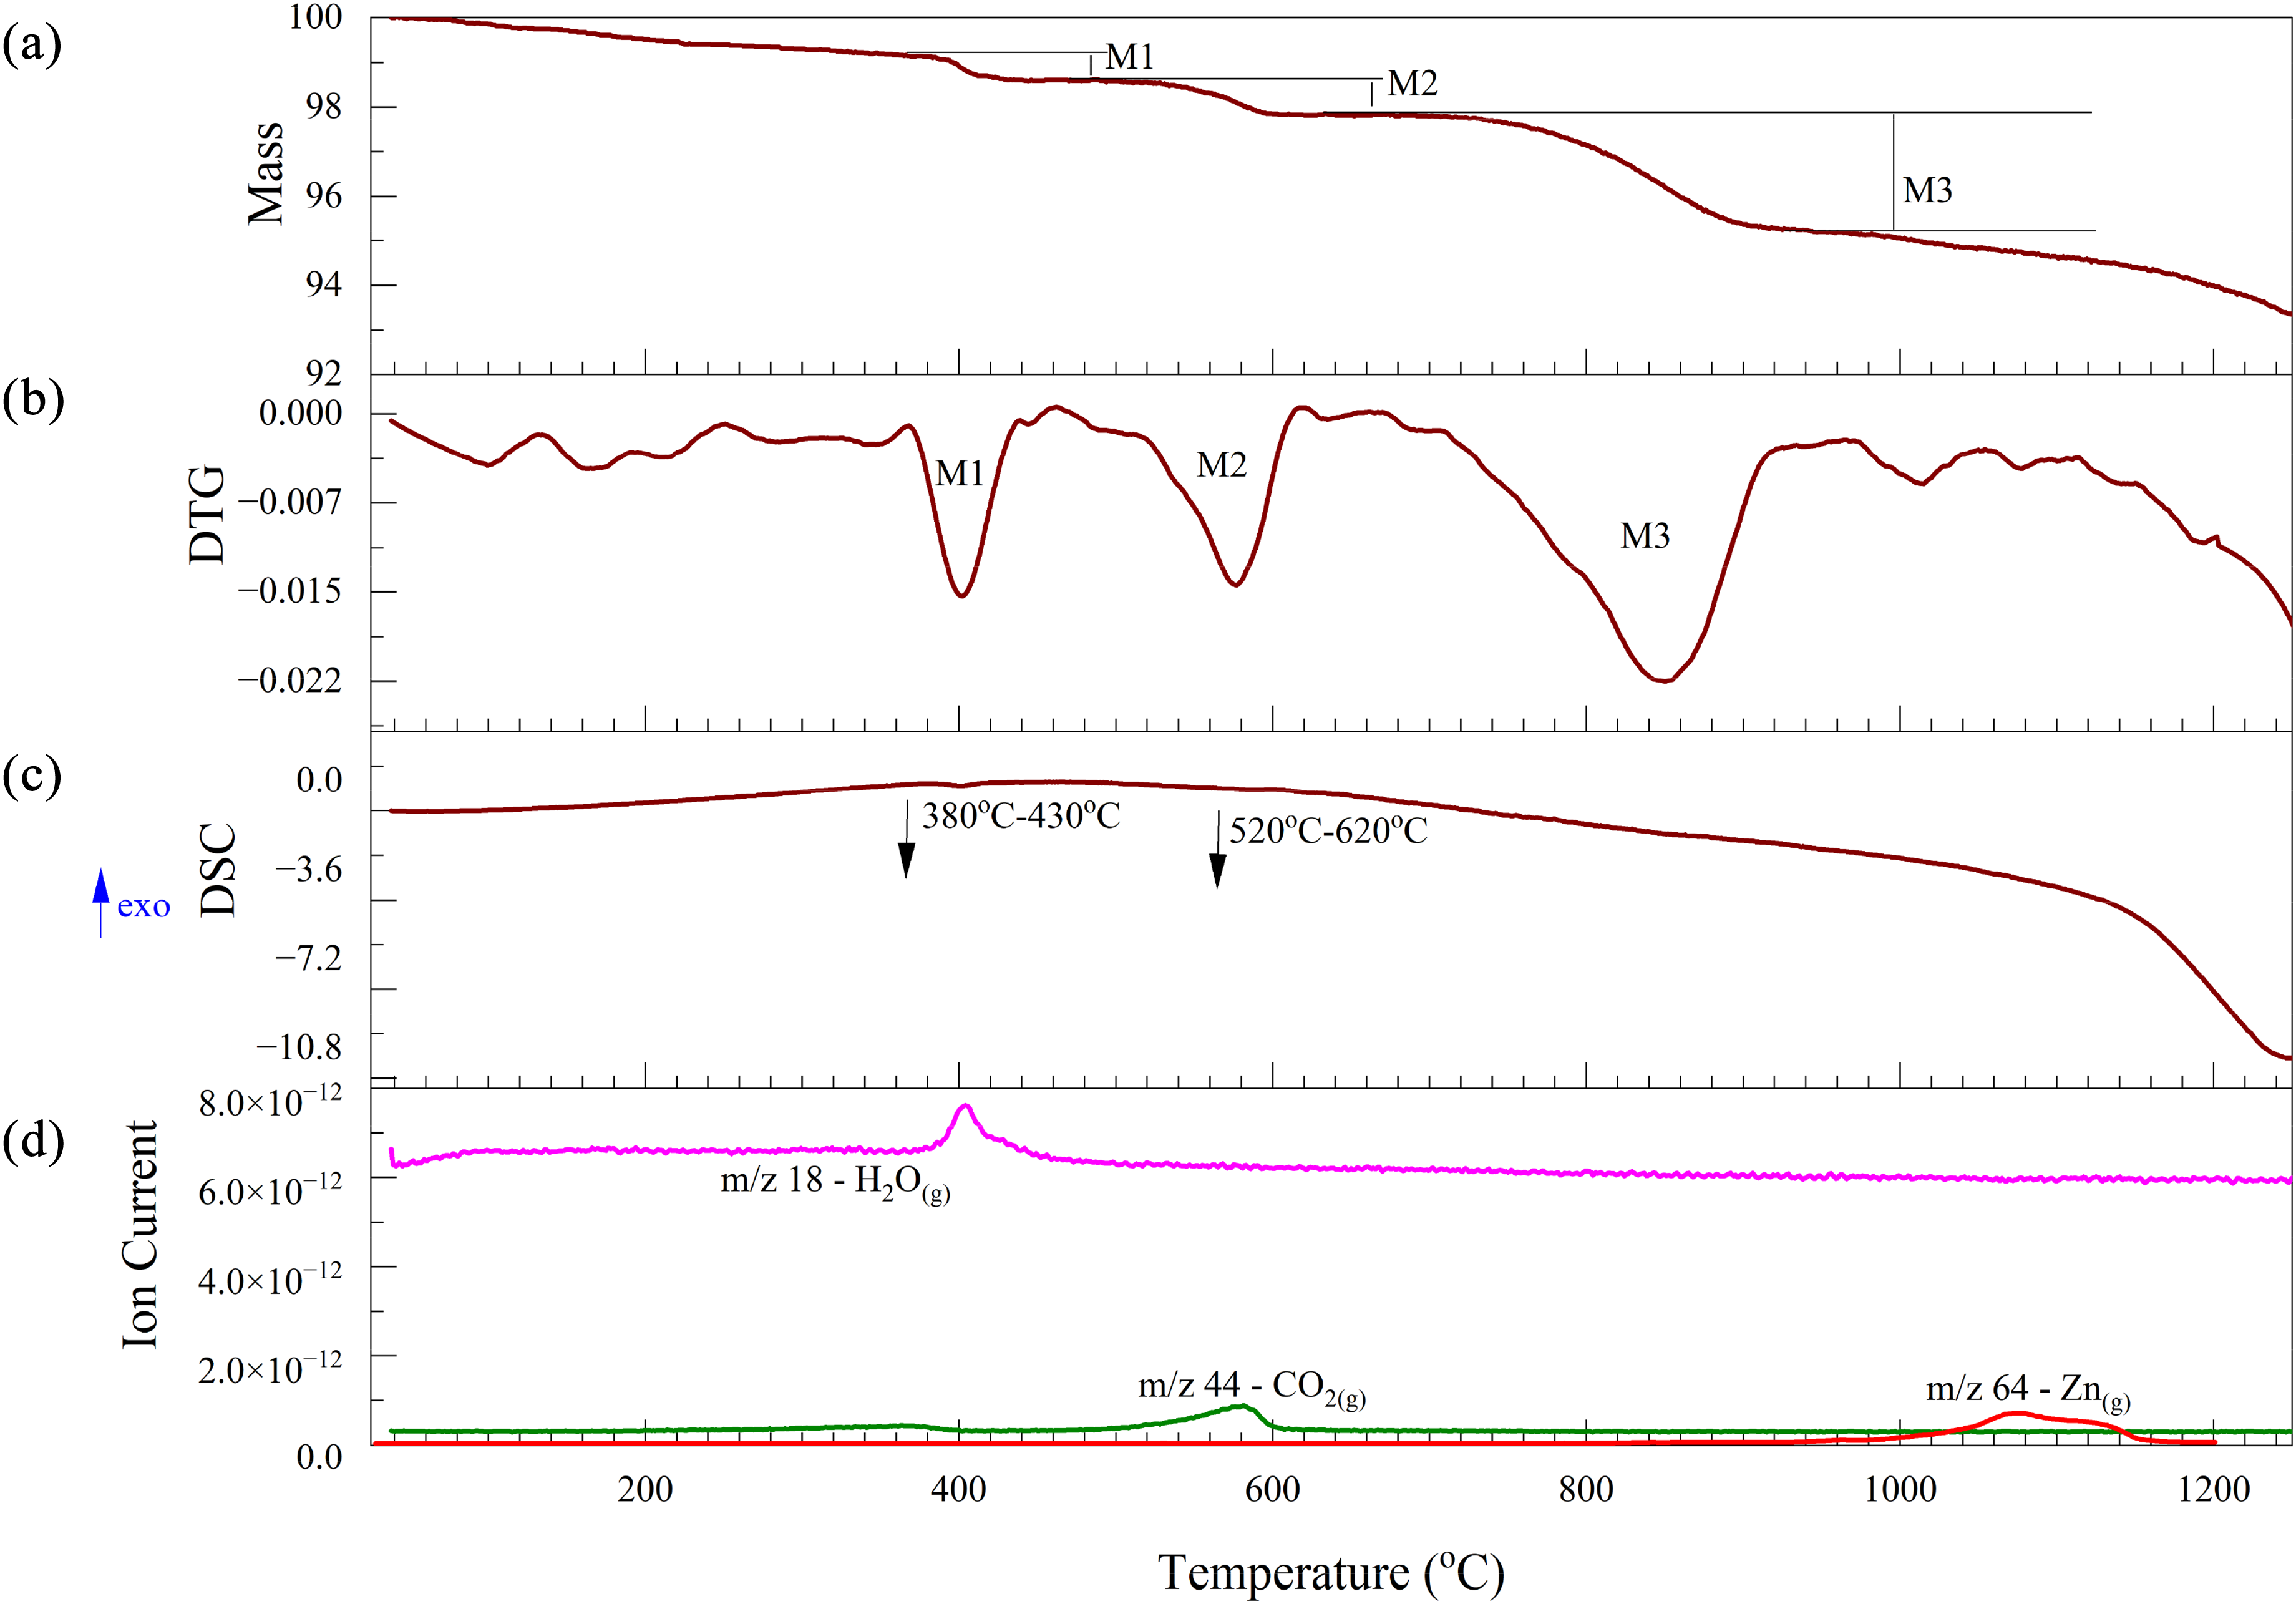
Thermal analysis of EAFSS dust under a nitrogen atmosphere: (a) TG; (b) DTG; (c) DSC and (d) Mass spectrum. EAFSS: electric arc furnace stainless steel; TG: thermogravimetric; DSC: differential scanning calorimetry.
The second mass loss between 520 and 620 °C is due to the release of CO2(g), corresponding to the decomposition of carbonates (equation (16)). Although two additional small mass losses are observed after 620 °C, there are no notable variations in the DSC and MS curves to suggest any additional reactions at higher temperatures. At about 900 °C, a decrease in mass loss was observed, and this was associated with the ionic current curve of Zn vapour, indicating some of the zinc oxide contained in the dust was reduced, perhaps by in situ carbon.
The permittivities of the EAFSS dust are shown as a function of temperature in Figure 8. Both the real and imaginary permittivities of the EAFSS dust exhibited relatively high permittivity values across all frequency bands, particularly at higher temperatures. The lowest frequency band at 397 MHz has been eliminated from the data set due to some erroneous results that occurred at high temperatures. Low-frequency signals are more susceptible to interference from surrounding electromagnetic noise, leading to distorted permittivity readings.
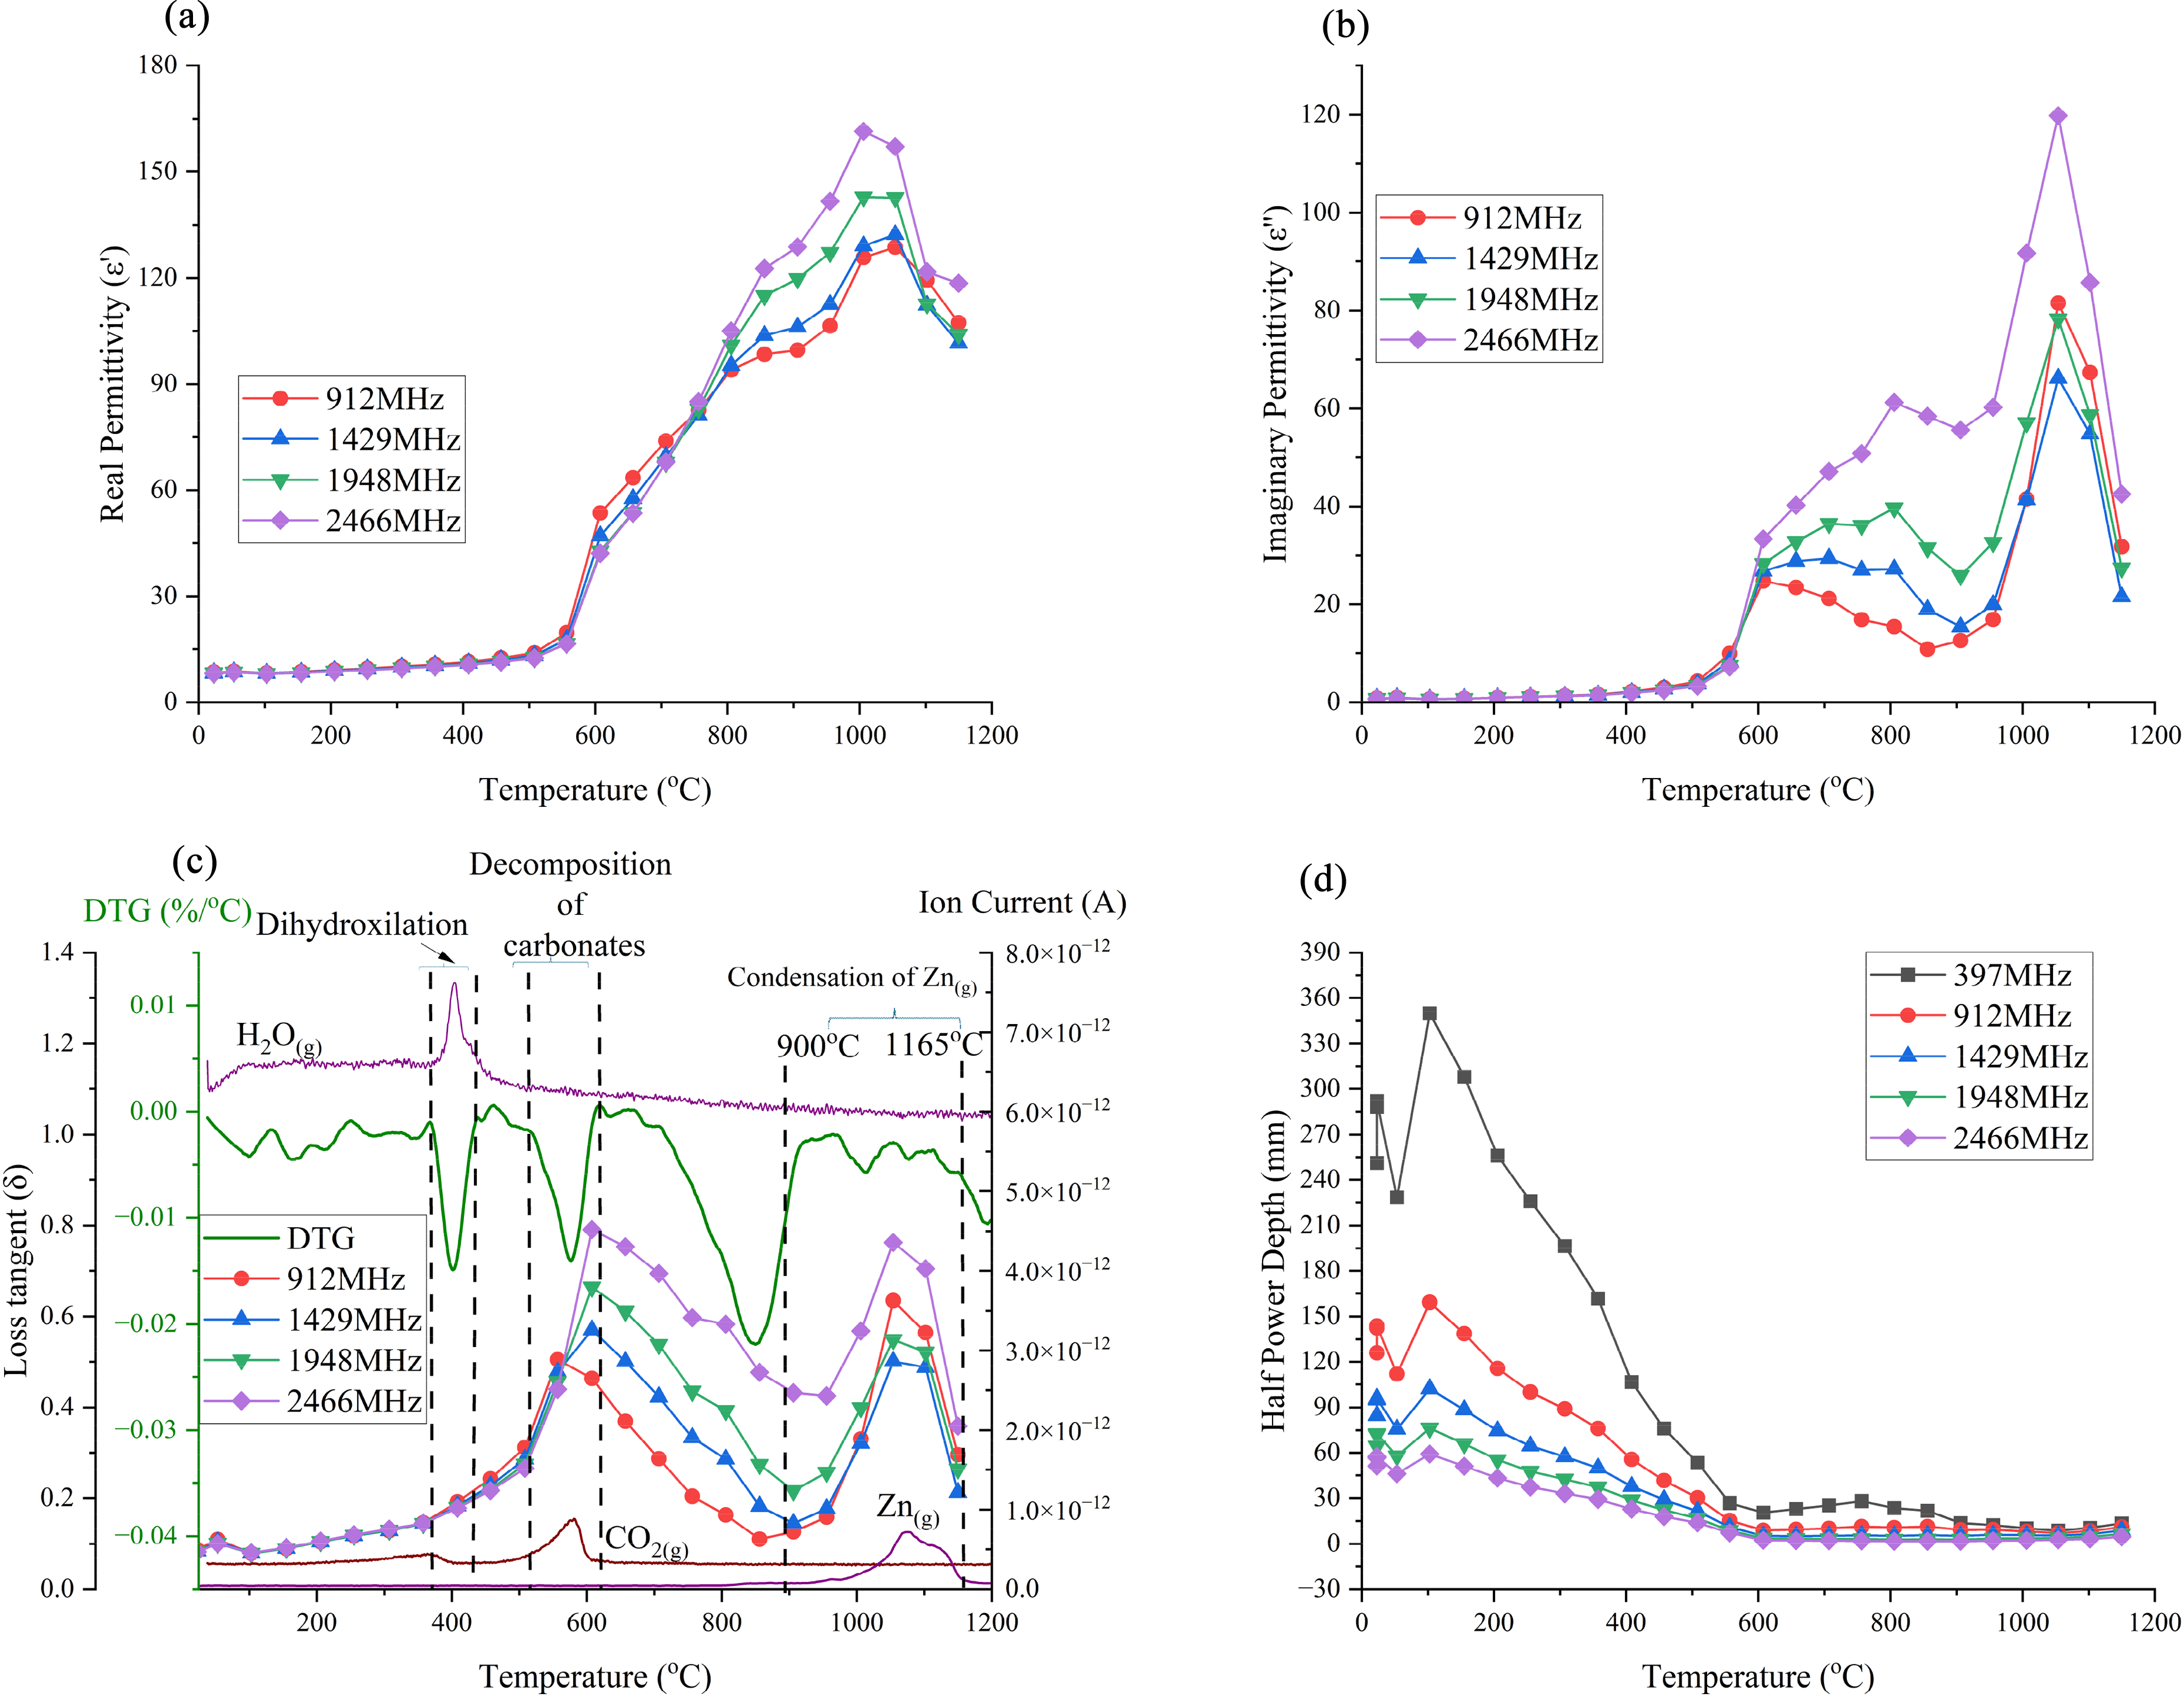
Permittivities, loss tangent and half-power depth of EAFSS dust: (a) real permittivity; (b) imaginary permittivity; (c) loss tangent; DTG and MS curves and (d) half-power depth (initial density: 2.94 g cm−3). EAFSS: electric arc furnace stainless steel; MS: mass spectrometry.
Here, the real and imaginary permittivities remain relatively constant, resulting in a plateau until the temperature reaches 575 °C. For the real permittivities, from 575 to 750 °C, they increased with decreasing frequency as predicted for compounds with a dipole behaviour. 19 However, at higher temperatures, the free ions and moving ions/electrons play an increasingly important role since the permittivities increase with increasing frequency as shown in Figure 8(a). This transition over this temperature range is due to the calcination process, where the decomposition of CaCO3(s) to CaO(s) reduced the overall polarisability of the sample while simultaneously increasing the ionic conduction. These trends are related to the loss tangent behaviour as shown in Figure 8(c), where after calcination, the values significantly decreased until reaching the temperature at which zinc evaporation and condensation occurred. Furthermore, Omran et al. 56 have shown that the ionic conduction behaviour increased over this temperature range due to the melting of the EAFSS sample. The imaginary permittivity results in Figure 8(b) support this finding, with a steep upward gradient during the calcination stage. Following this, the loss mechanism exhibits a plateau or downward trend, due to the absence of carbonates in the system. However, the imaginary permittivities are still directly proportional to the frequency, suggesting that ionic polarisation remains the dominant loss mechanism up to 900 °C. After 900 °C the sharp increase in both permittivities is likely attributed to the evolution of zinc vapour and the condensation of a conductive layer on the surface of the holder, particularly near and just above the sample (shown in Figure 9(b)). This layer effectively enlarges the sample area beyond the compacted briquette on the quartz holder. To investigate the formation of zinc vapour, calculations were conducted using Factsage 8.3 for the EAFSS dust in an inert atmosphere. As shown in Figures 7(d) and 9(a), again zinc evaporation occurs around 900 °C probably due to the reduction of zincite by in situ carbon.
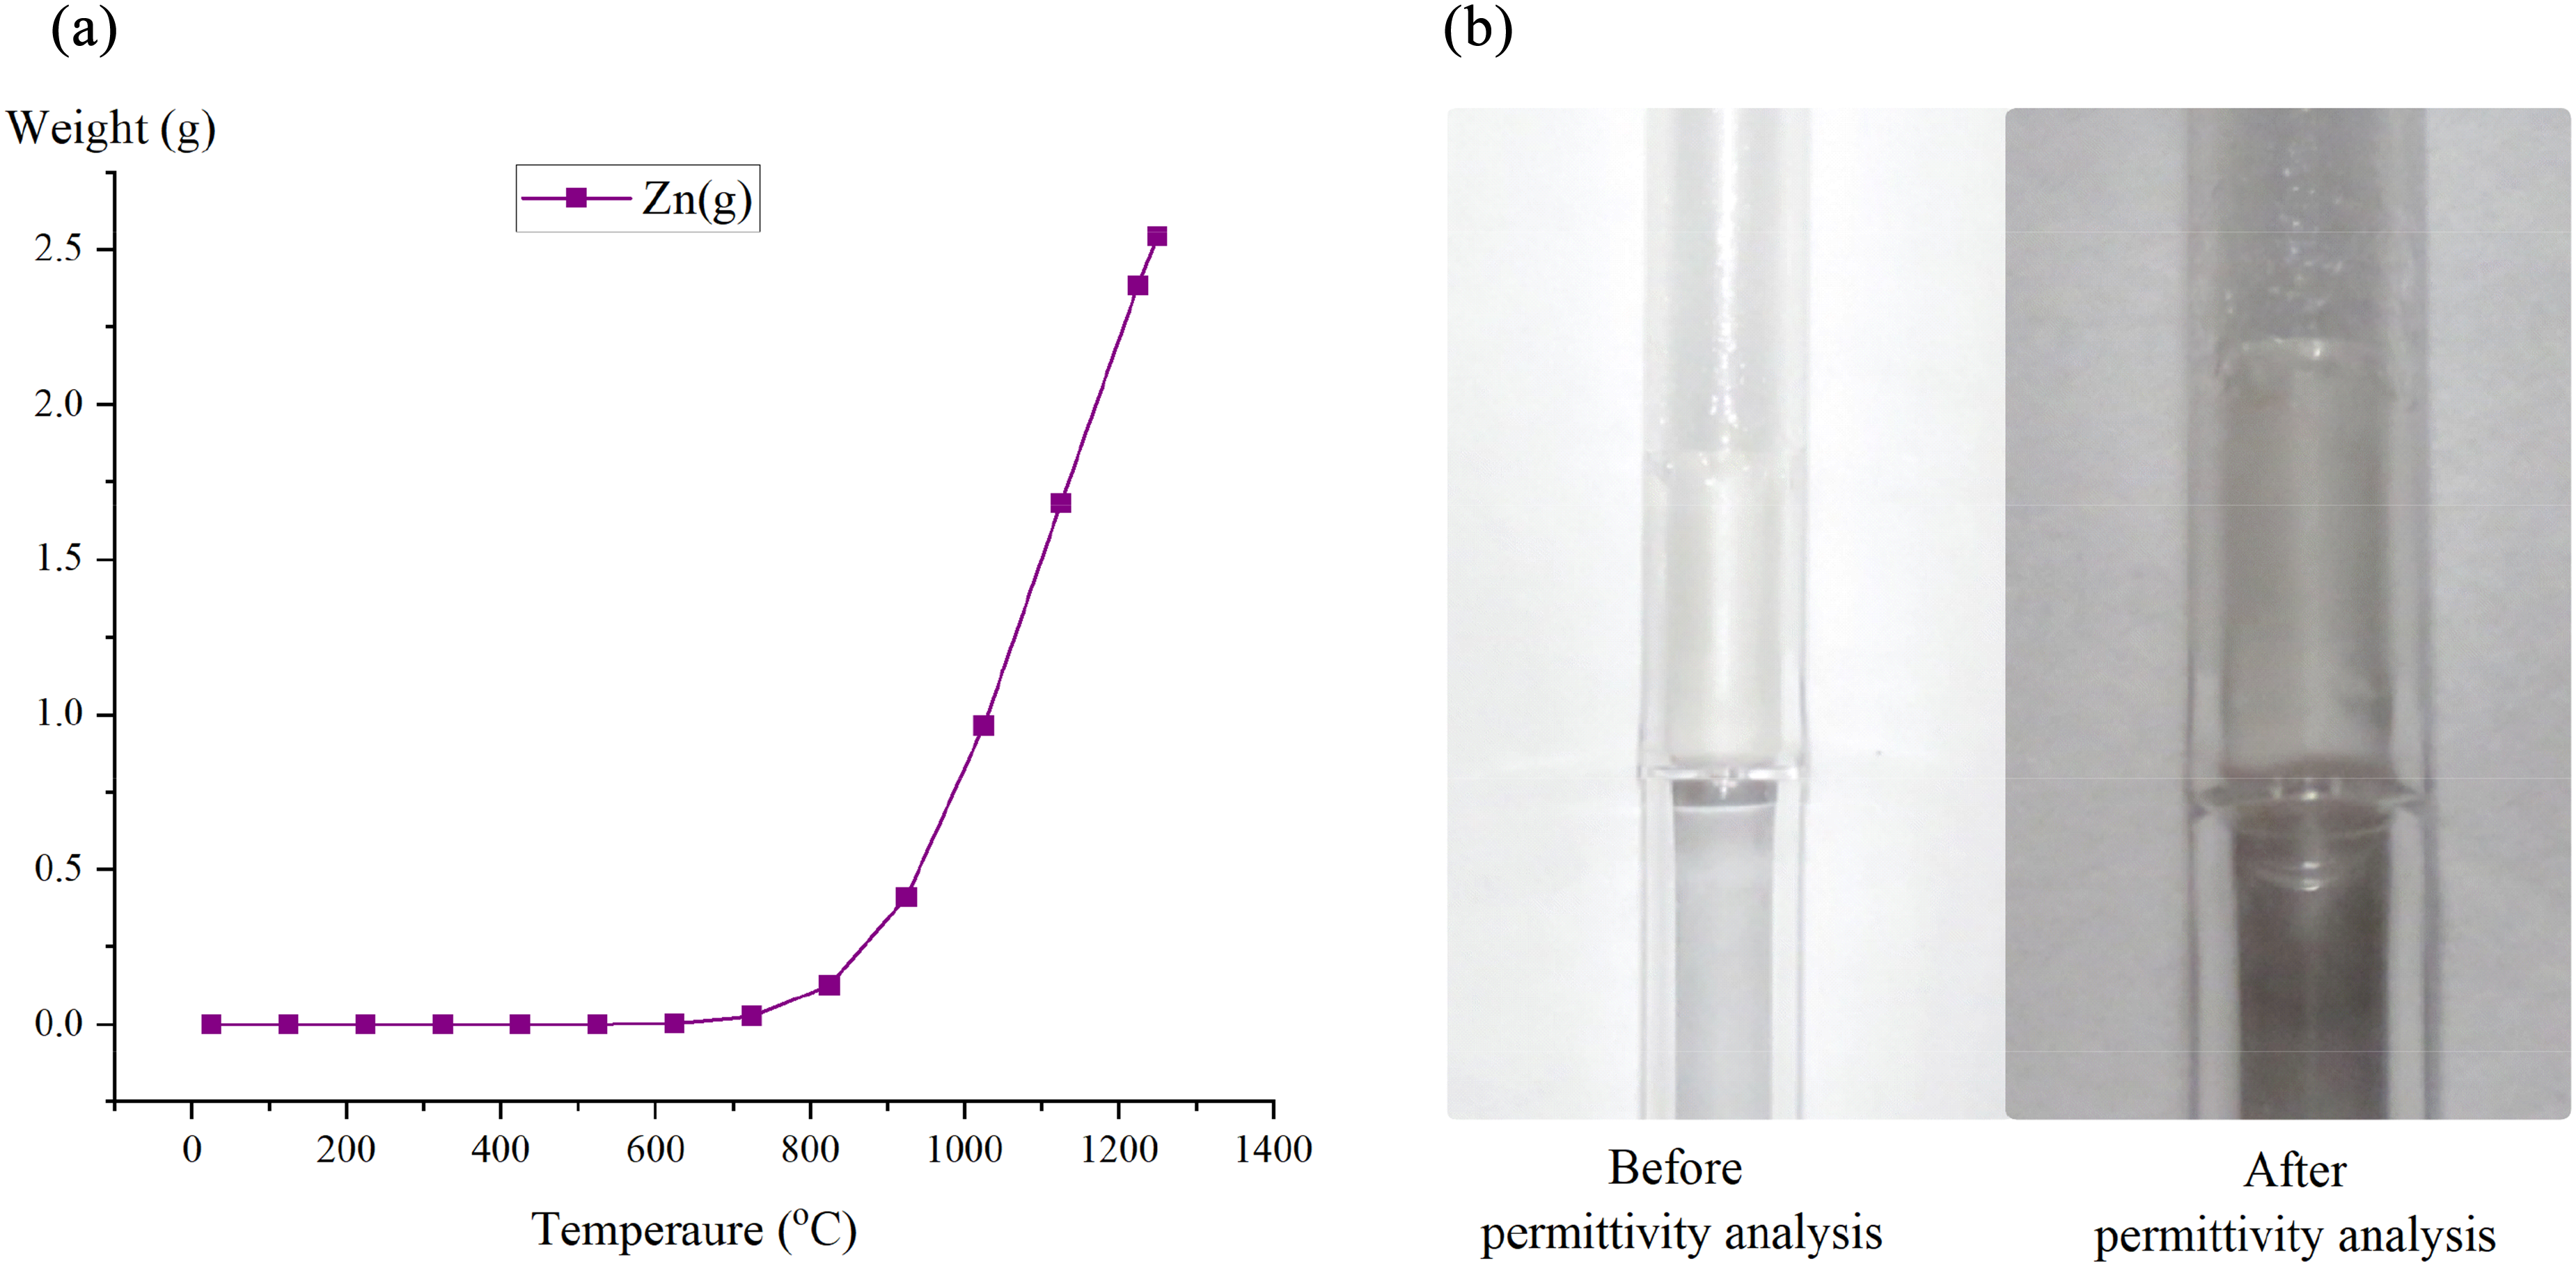
Zn vapour formation: (a) according to thermodynamic equilibrium calculation of Zn(g), and (b) whitish colour vapour deposited on the wall of the crucible during permittivity analysis.
The behaviours of the loss tangent of EAFSS dust, combined with the DTG and significant ionic current fluctuations, are shown in Figure 7(c). EAFSS dust exhibits a gradual increase in loss tangent up to 520 °C, suggesting that there would be an increase in the microwave heating rate. Beyond 520 °C, the loss tangent begins to increase rapidly until 620 °C. This increase correlates with the mass reduction of the EAFSS sample, which is directly linked to the decomposition processes as described in equation (16) and is further reflected in the pronounced fluctuations of the ionic current curve associated with the evolution of CO2(g). Between 620 and 900 °C, the loss tangent decreases slightly. After 900 °C, there is a sharp increase in the loss tangent due to the condensation of Zn(g). Furthermore, the loss tangent increases with frequency indicates that higher frequencies would lead to increased heating rates for EAFSS dust, particularly over the above-mentioned temperature ranges.
The HPD values initially fluctuate, likely due to the drying process, as shown in Figure 8(d). Following this, a steady reduction of HPD occurs with increasing temperature, dropping below 15 mm for all frequencies. Subsequently, the values reach a plateau, indicating that the HPD is independent of temperature above 600 °C. The HPD increased with decreasing frequency with the highest values occurring at 397 MHz.
BF sludge
The thermal analysis of BF sludge under a nitrogen atmosphere is shown in Figure 10. BF sludge mainly contains haematite (Fe2O3) and coke (C). The BF sludge was dried at 105 °C before the thermal analysis. From room temperature to approximately 500 °C, the mass remained essentially constant, however, above 500 °C, a significant mass loss occurred. Under a nitrogen atmosphere the reduction of haematite by coke can be clearly seen. This process occurs in three stages: first haematite is reduced to magnetite (Fe3O4) and then to wustite (FeO) and finally to metallic iron (Fe) as given in equations (17), (18) and (19). The removal of oxygen from the iron oxides results in a mass loss.
58
Carbon dioxide gas is evolved as a product of the reduction process. This stage-wise reduction process is confirmed by three endothermic peaks at 680, 770 and 1080 °C as shown in Figure 10(c). The highest mass reduction rate occurs at 770 °C as shown in the DTG curve in Figure 10(b):


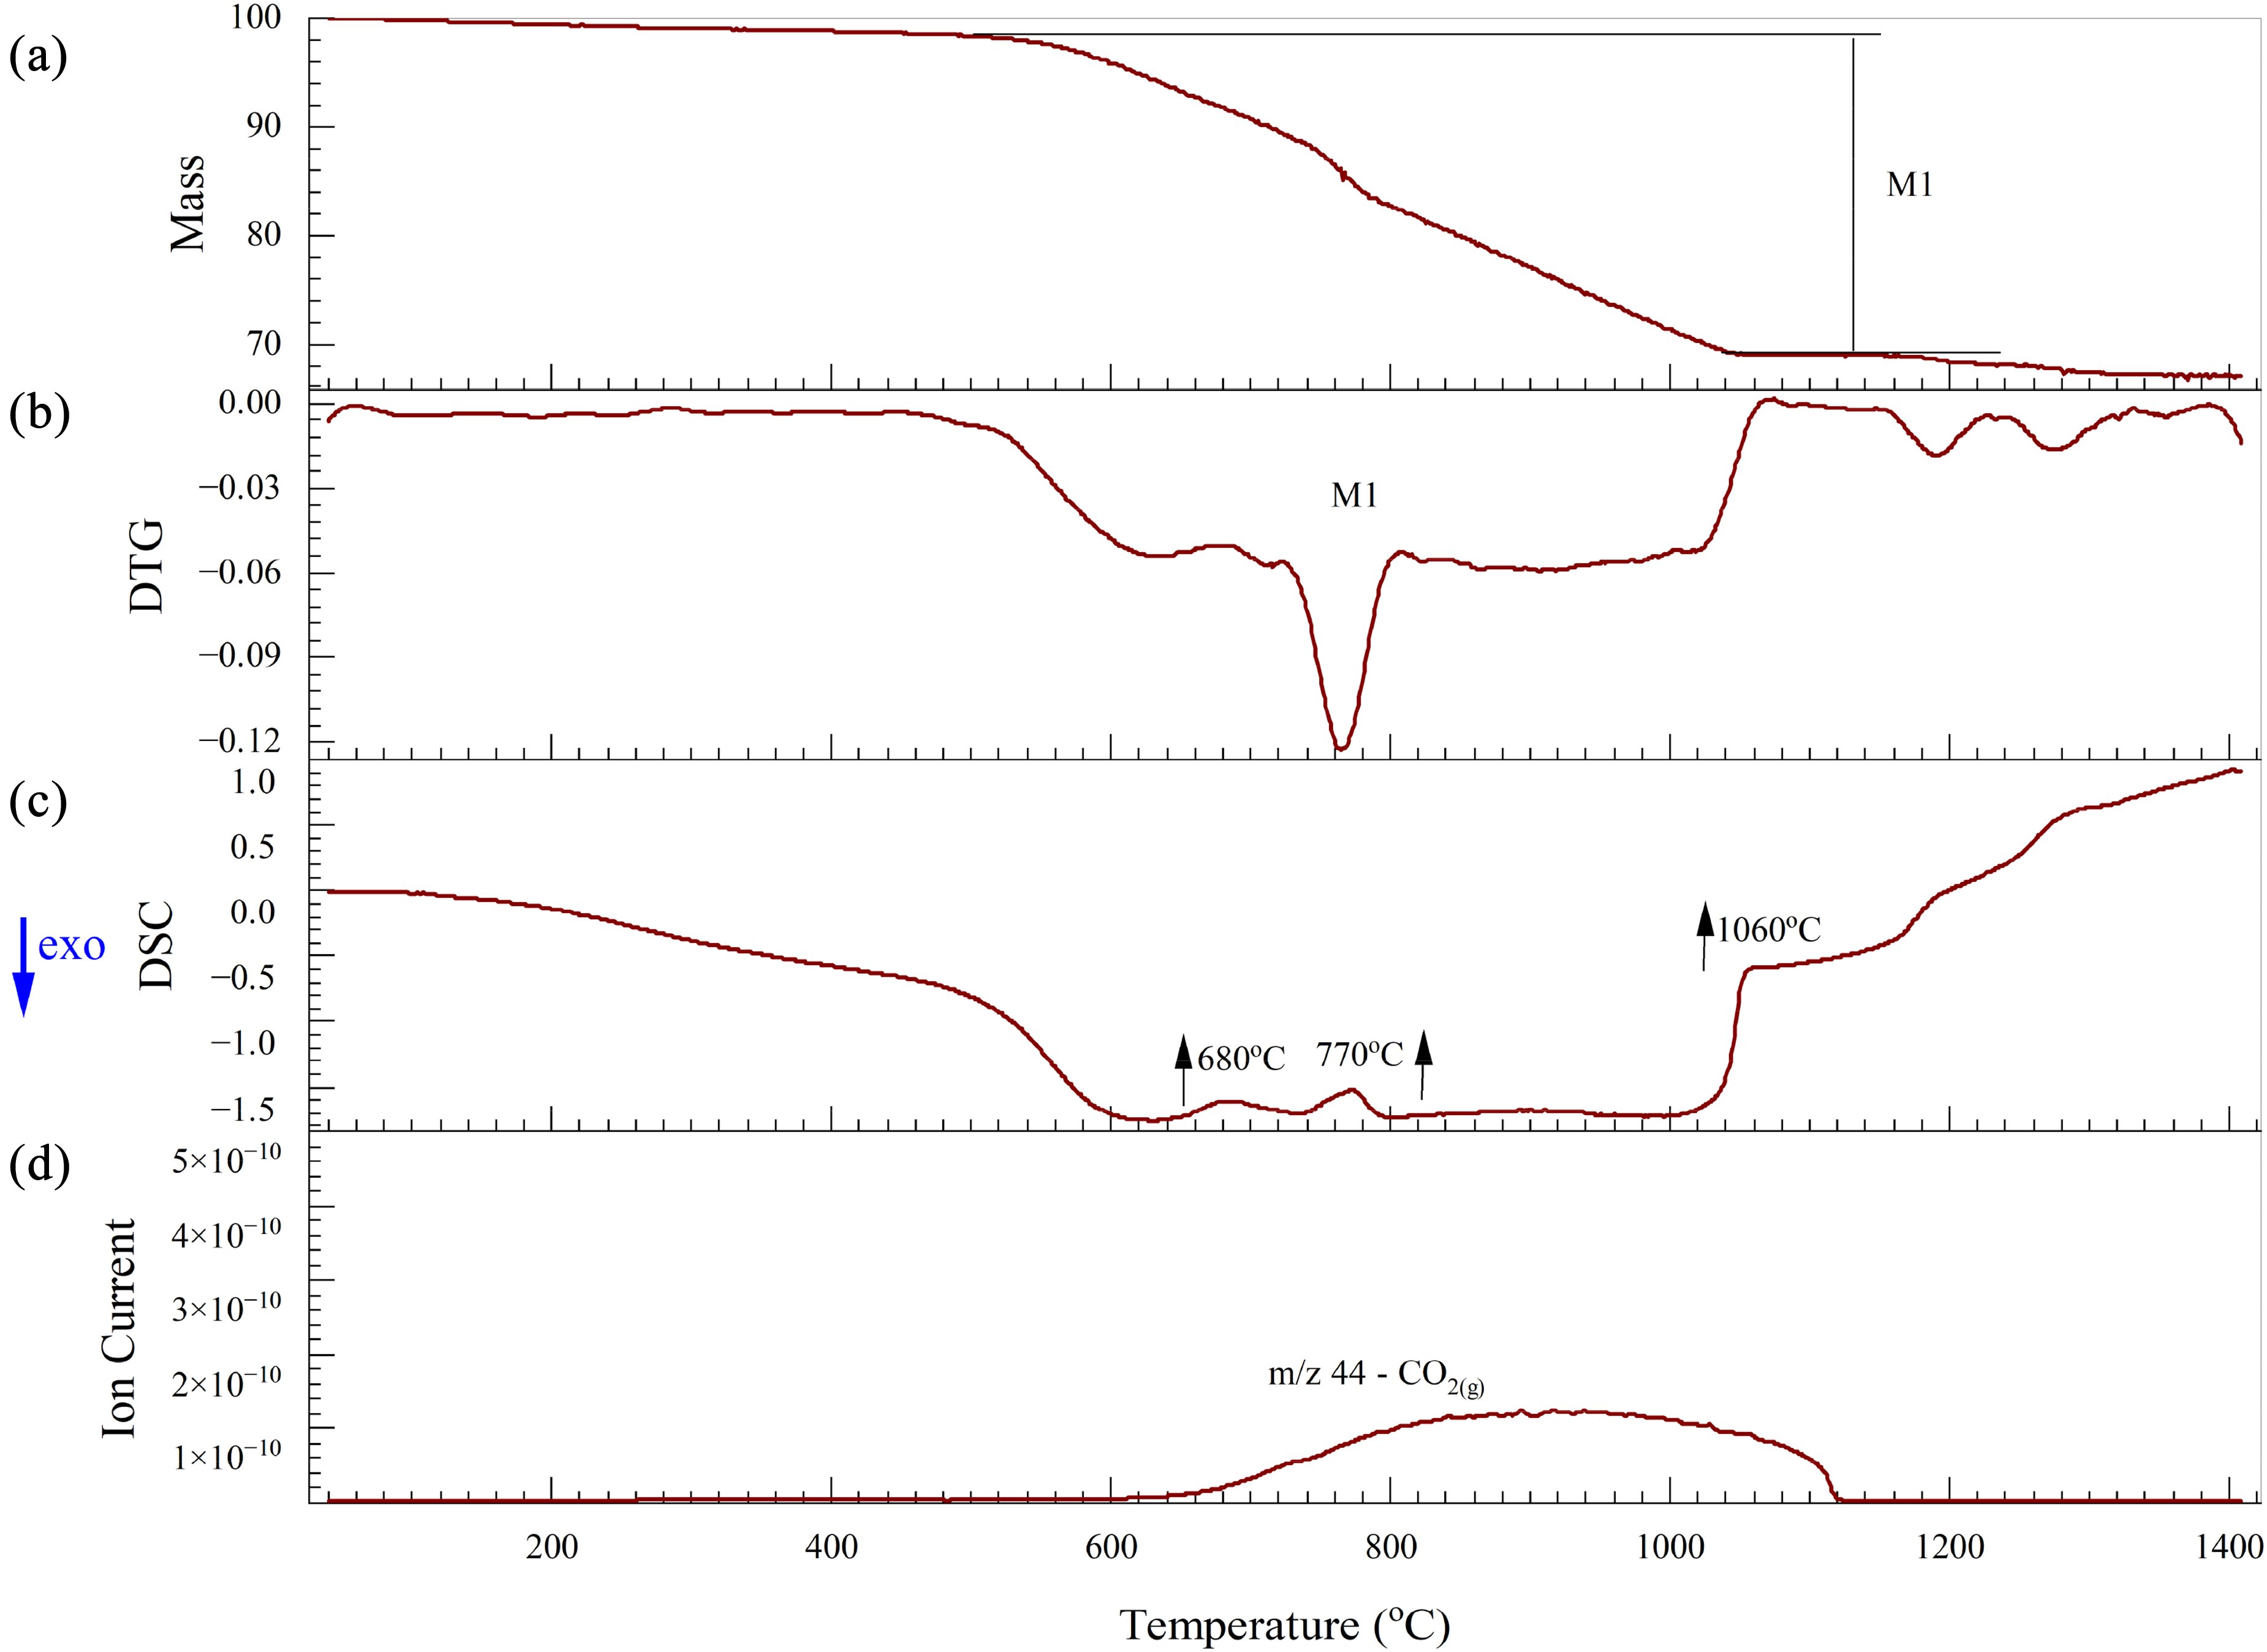
Thermal analysis of BF sludge under a nitrogen atmosphere: (a) TG; (b) DTG; (c) DSC and (d) Mass spectrum. BF: blast furnace; TG: thermogravimetric; DSC: differential scanning calorimetry.
The mass spectrum data in Figure 10(d) shows that CO2(g) is the major gas emitted over this temperature range. Additionally, the endothermic peak observed at 680 °C can be linked to the decomposition of carbonates, releasing CO2(g), as described in equation (16). 59
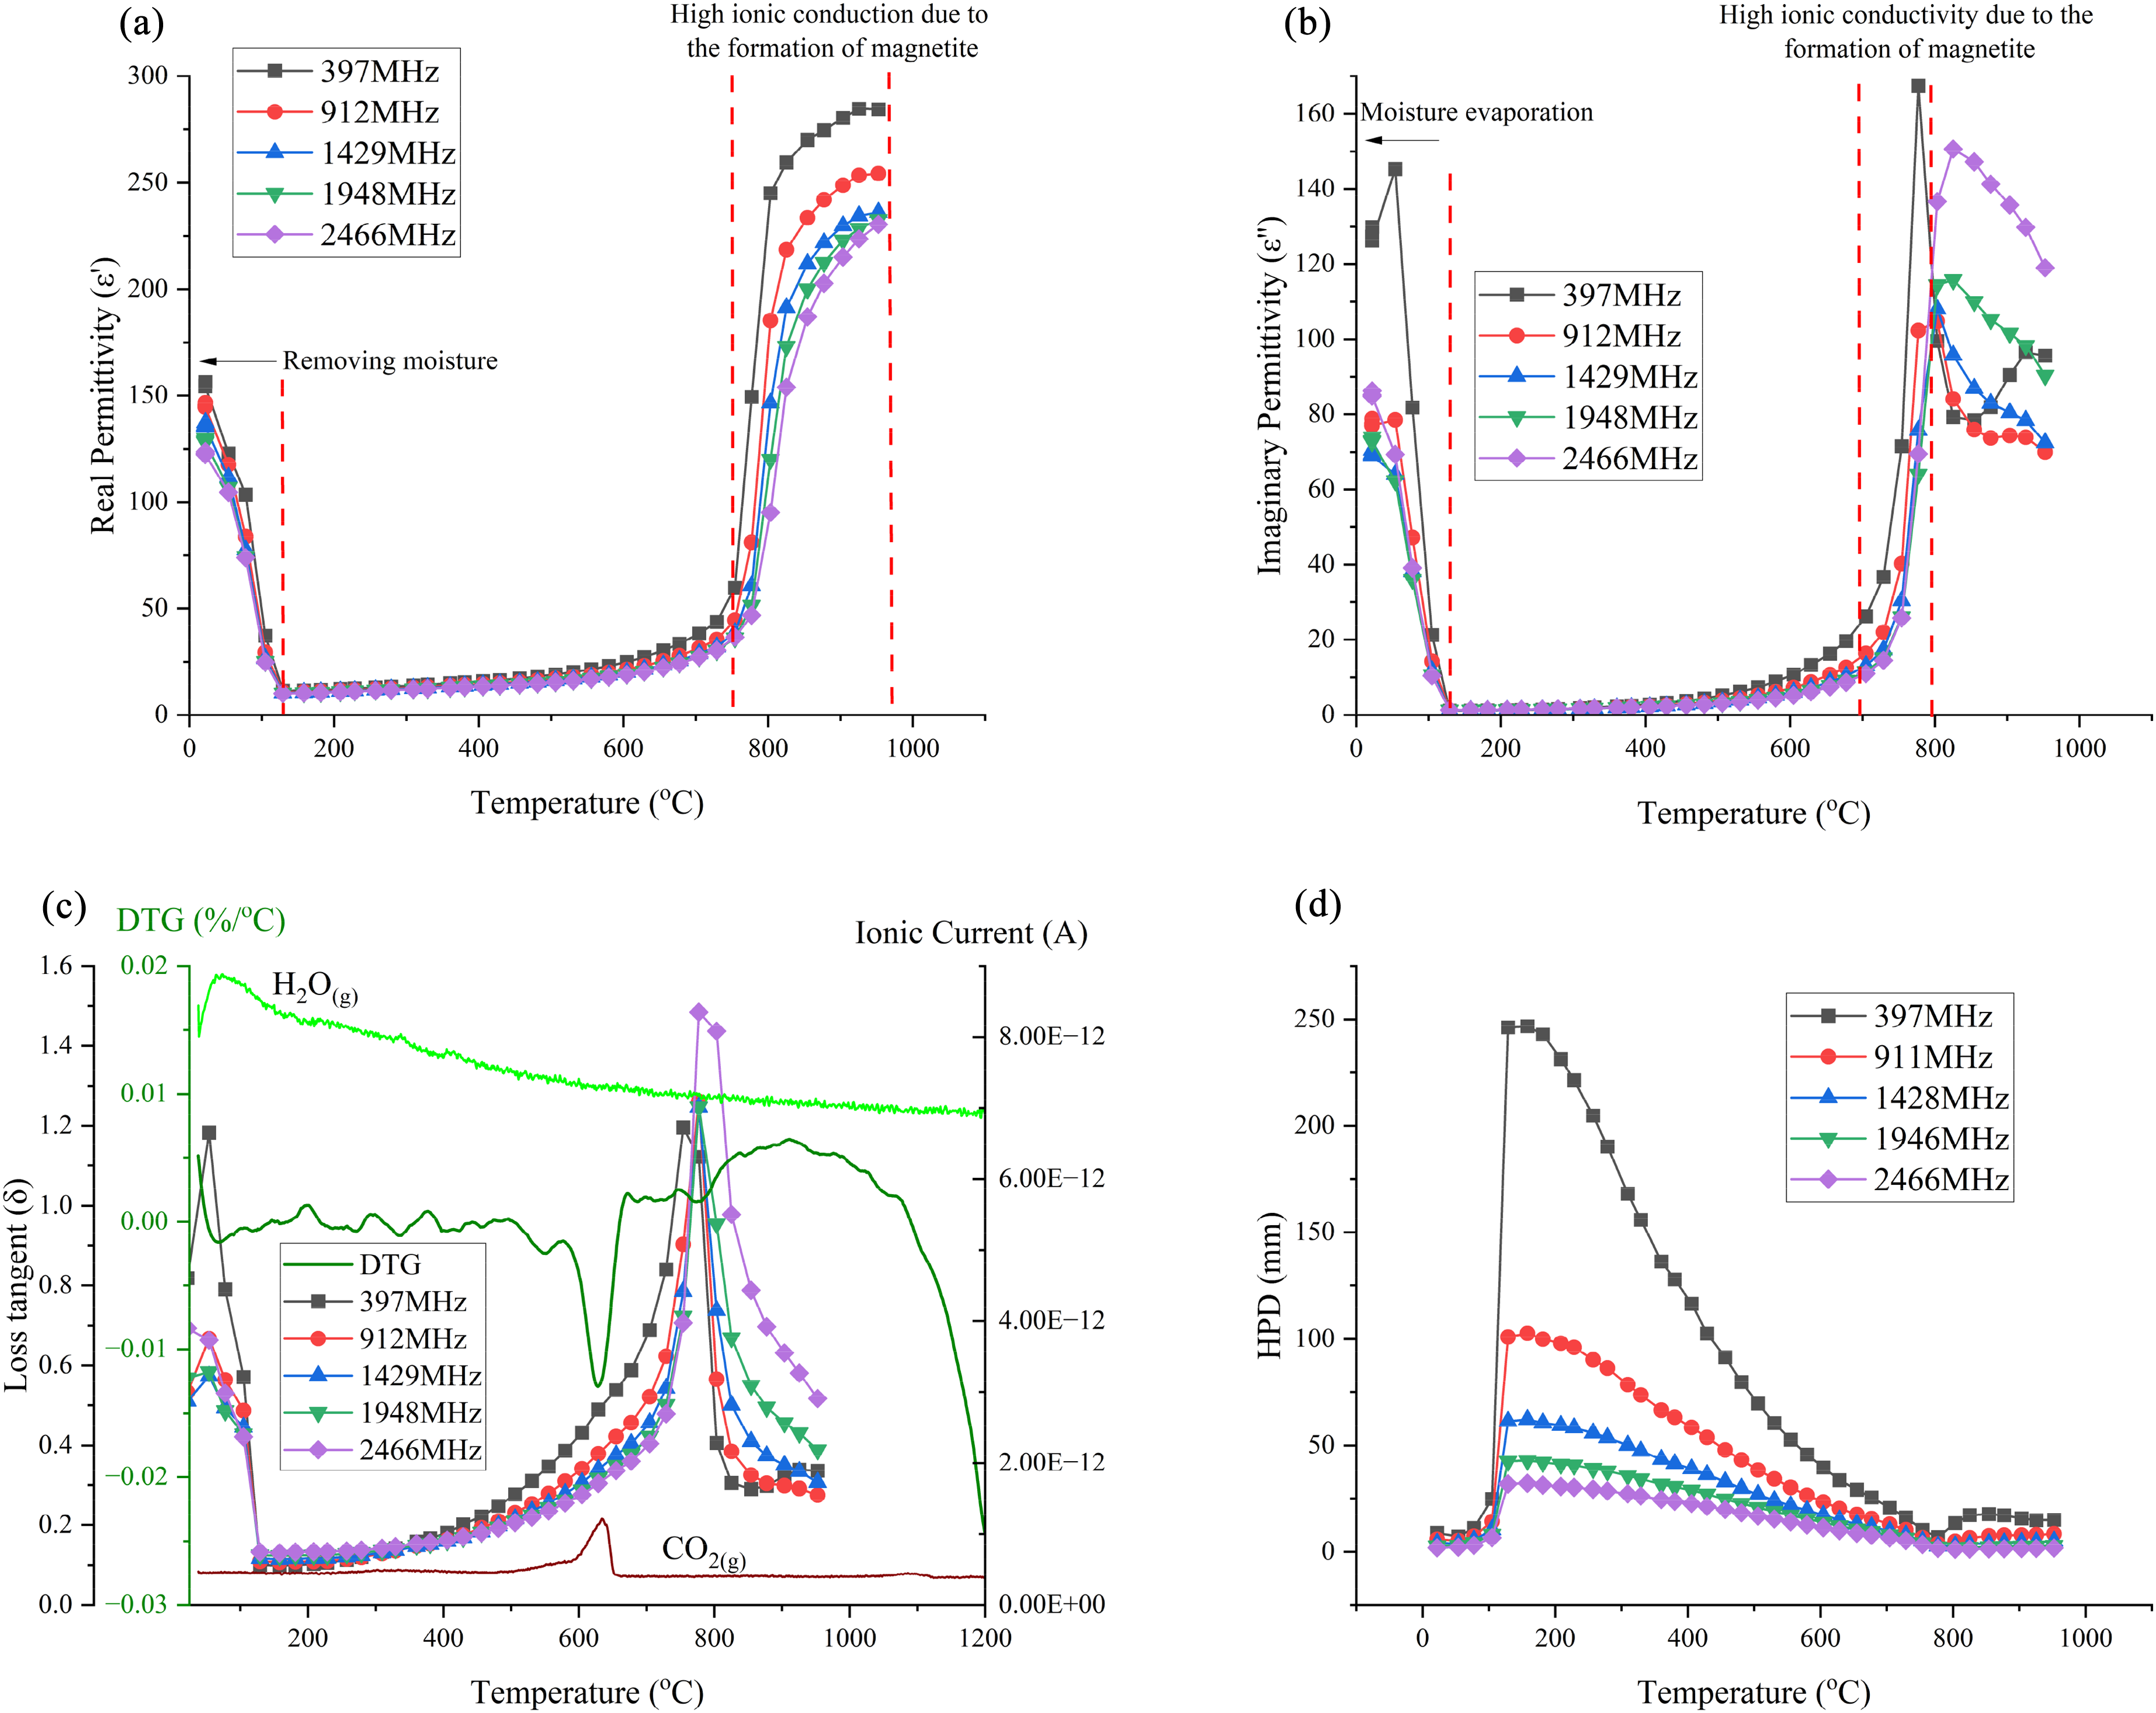
Figure 11 illustrates the changes in the permittivities of the BF sludge as a function of temperature. The permittivity values above 900 °C at 2466 MHz were removed from the data set as they were considered unreliable. Generally, BF sludge is considered to have high permittivities due to the high carbon and iron oxide contents. 60 As shown in Figure 11(a), below 500 °C the real permittivity is relatively high and slowly increases. Subsequently, the real permittivity increases rapidly and there is a peak in the permittivity at about 800 °C, with the lowest frequency exhibiting the highest peak at a real permittivity of 75 F m−1. This peak may correspond to both the decomposition of carbonate and to the reduction process as shown in Figure 10(b). From 800 to 975 °C, the real permittivity values increased significantly at all frequencies. Notably, at 975 °C for all frequencies, the permittivities reached a similar peak value of about 275. This peak was attributed to the iron oxide reduction process and the formation of new phases with high permittivities, such as magnetite and wustite, followed by a decrease after 975 °C due to the formation of metallic iron. As shown in Figure 11(b), in contrast to the real permittivities, the imaginary permittivities increased with increasing frequency during the reduction process. Magnetite has a spinel structure with both Fe2+ and Fe3+ ions. The presence of these mixed-valence ions allows for electron hopping especially at high frequencies. The polar nature of the Fe2+/Fe3+ sites results in enhanced induced polarisation in an external electric field. This increases the material's ability to store electrical energy61, 62 . Additionally, the reduction of magnetite to wustite and then to metallic iron increases the electrical conductivity. These two reduction processes contribute to the higher imaginary permittivity observed over this temperature range.
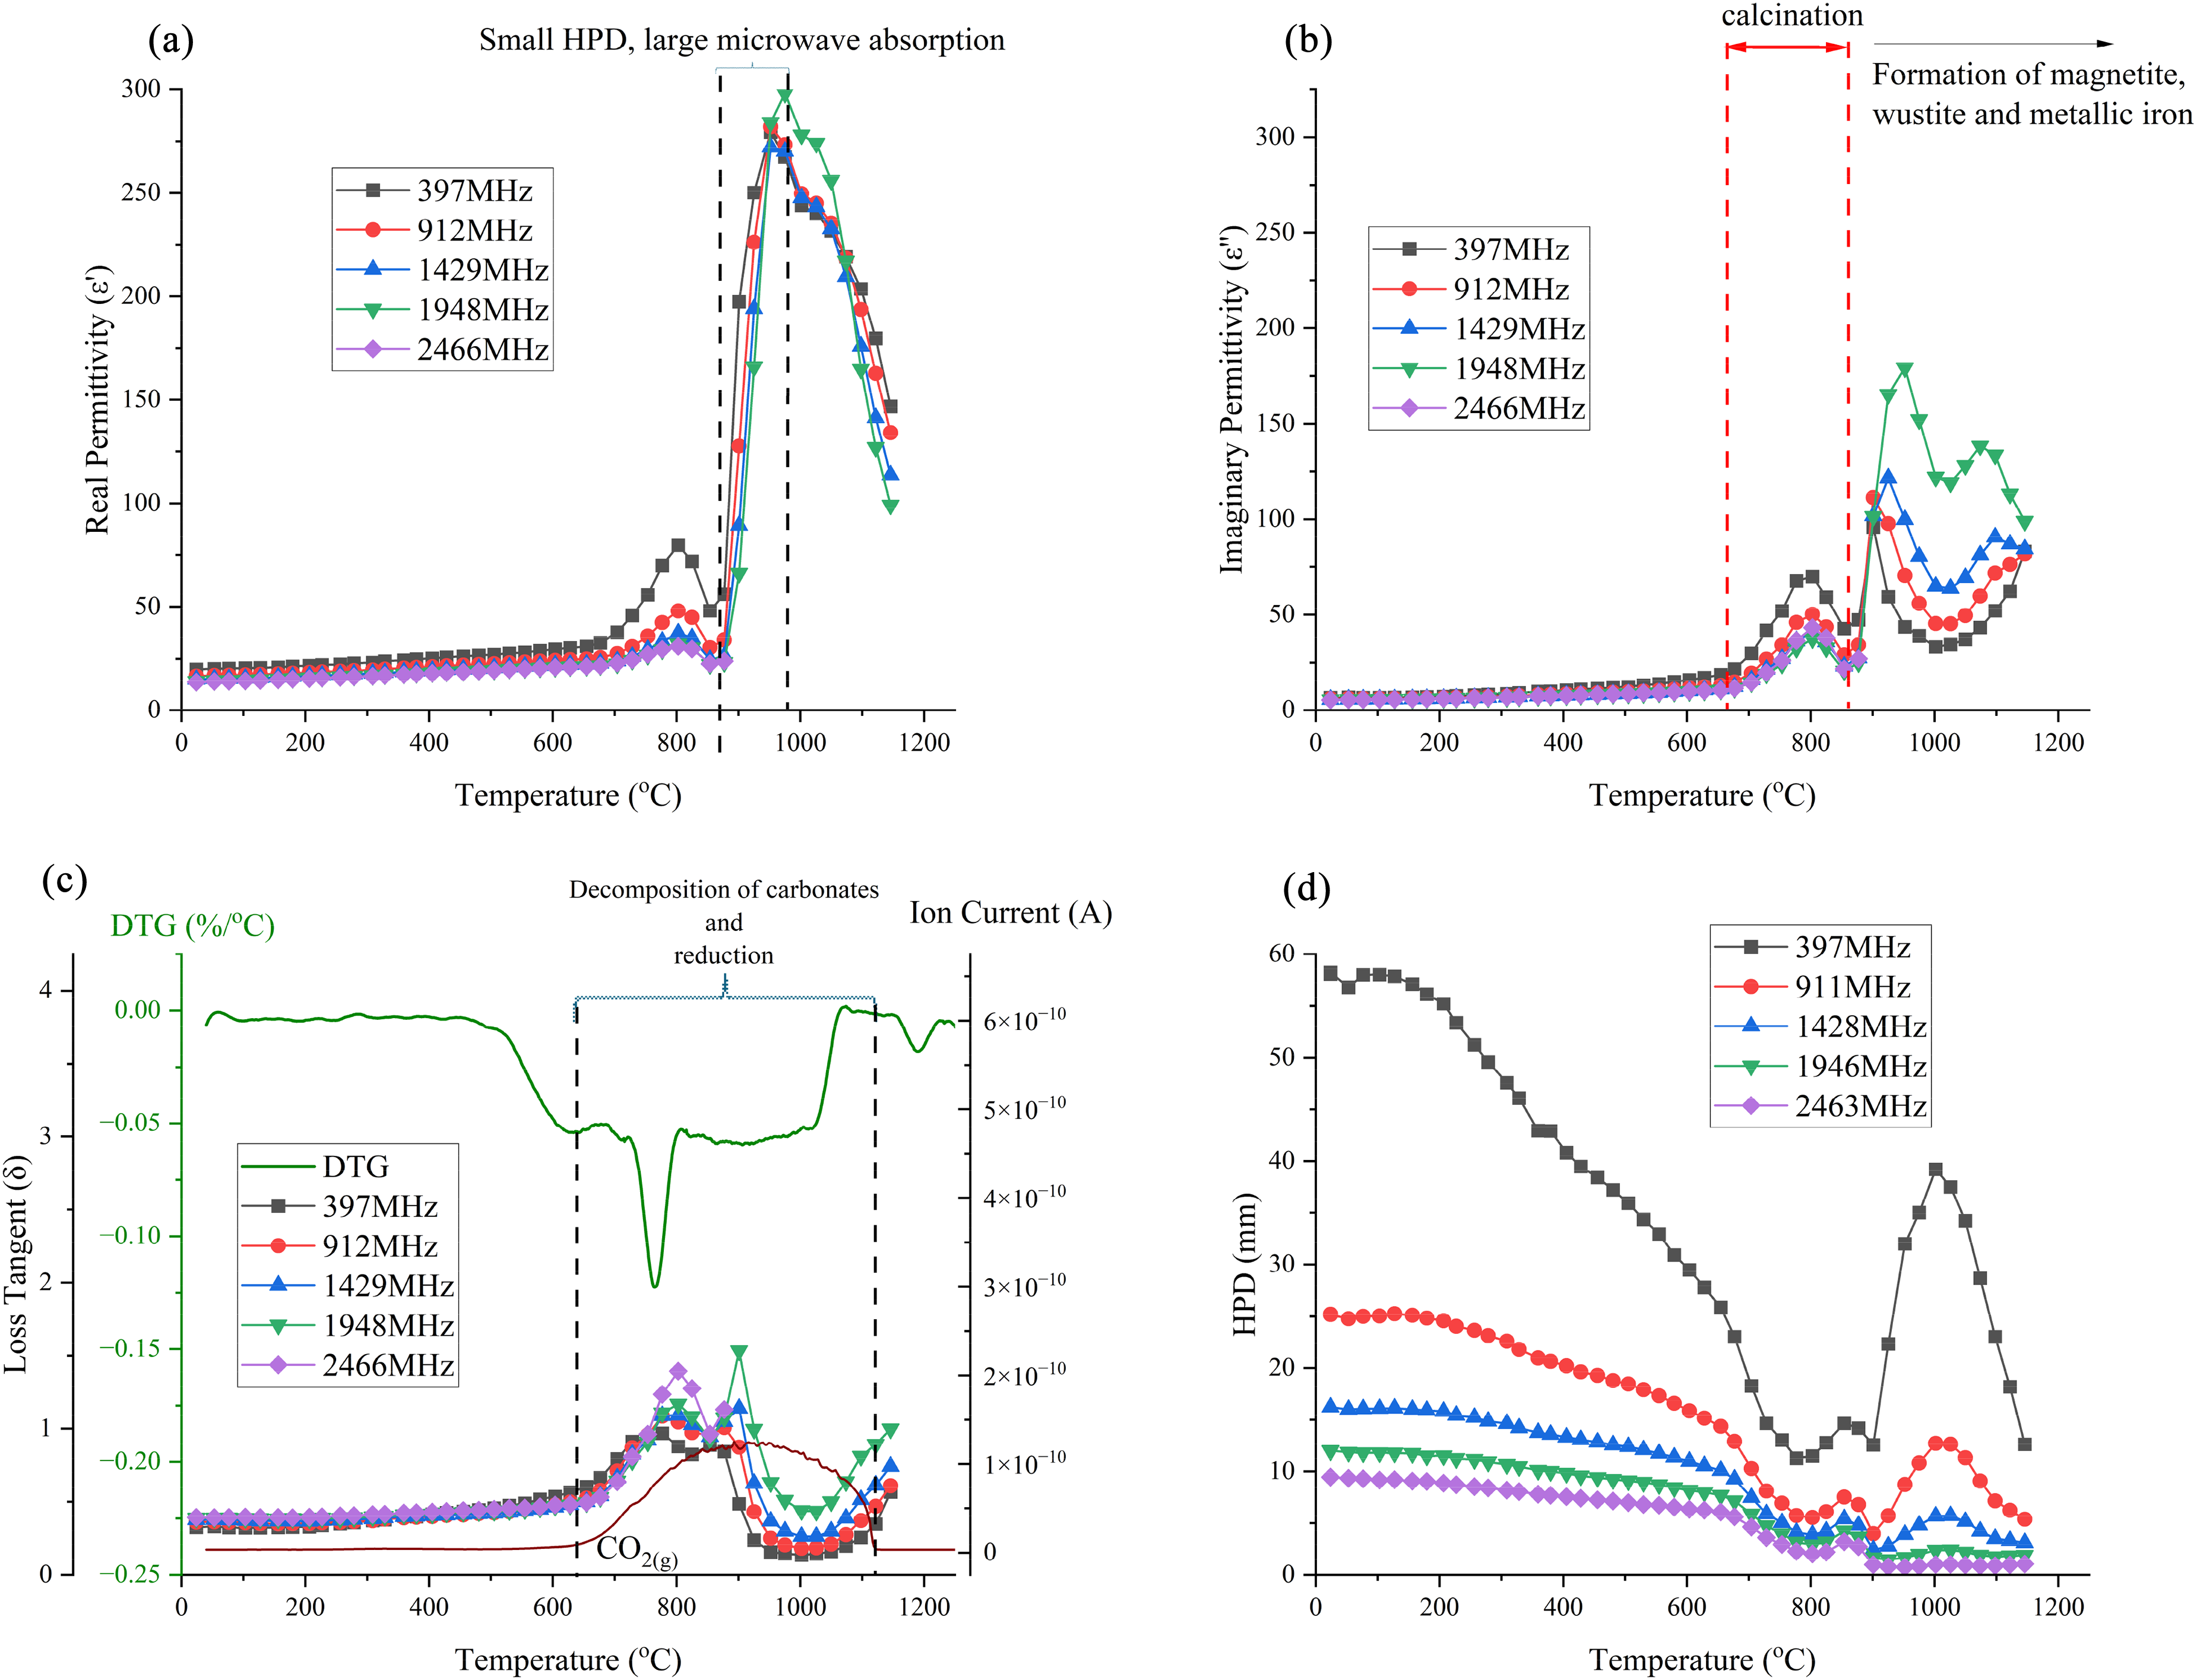
Permittivities, loss tangent and half-power depth of BF sludge: (a) real permittivity; (b) imaginary permittivity; (c) loss tangent; DTG and MS curves and (d) half-power depth (initial density: 1.7 g cm−3). BF: blast furnace; MS: mass spectrometry.
Figure 11(c) shows both the loss tangent and the DTG as a function of temperature. The highest mass loss and the first peak in the loss tangent both occur at 770 °C, primarily due to the calcination and the reduction processes. The next peak in the loss tangent is observed at 900 °C, where the ionic current of CO2(g) reaches its maximum value, as a result of the reduction processes up to 1000 °C. During both peaks, the loss tangent increases with frequency, indicating a higher microwave frequency would be better for the processing of the BF sludge.
The HPD is shown in Figure 11(d). The overall HPDs of the BF sludge at all frequencies are relatively low, ranging from 60 to 0 mm, and this is attributed to the high permittivities. Notably, around 875 °C, the HPD becomes very small, owing to the formation of a highly conductivity phase. This is likely metallic iron, which has a high conductivity and skin depth.
BOF slag
The thermal analysis of BOF slag is illustrated in Figure 12. Three distinct mass losses are observed in the DTG curve (Figure 12(b)), with the corresponding gas emissions shown in Figure 12(d). The first mass loss occurs between 0 and 200 °C due to the release of moisture. Here, the DSC curve shows no significant deviation (Figure 12(c)), indicating the absence of any major reactions. The second mass loss stage, which has the highest mass reduction rate occurs between 380 and 465 °C, accompanied by an endothermic peak in the DSC curve. Over this temperature range, the mass spectrum shows fluctuations in the ionic current of water vapour, indicating the dehydroxylation of minerals in the slag such as Ca(OH)2 (equation (15)). 63
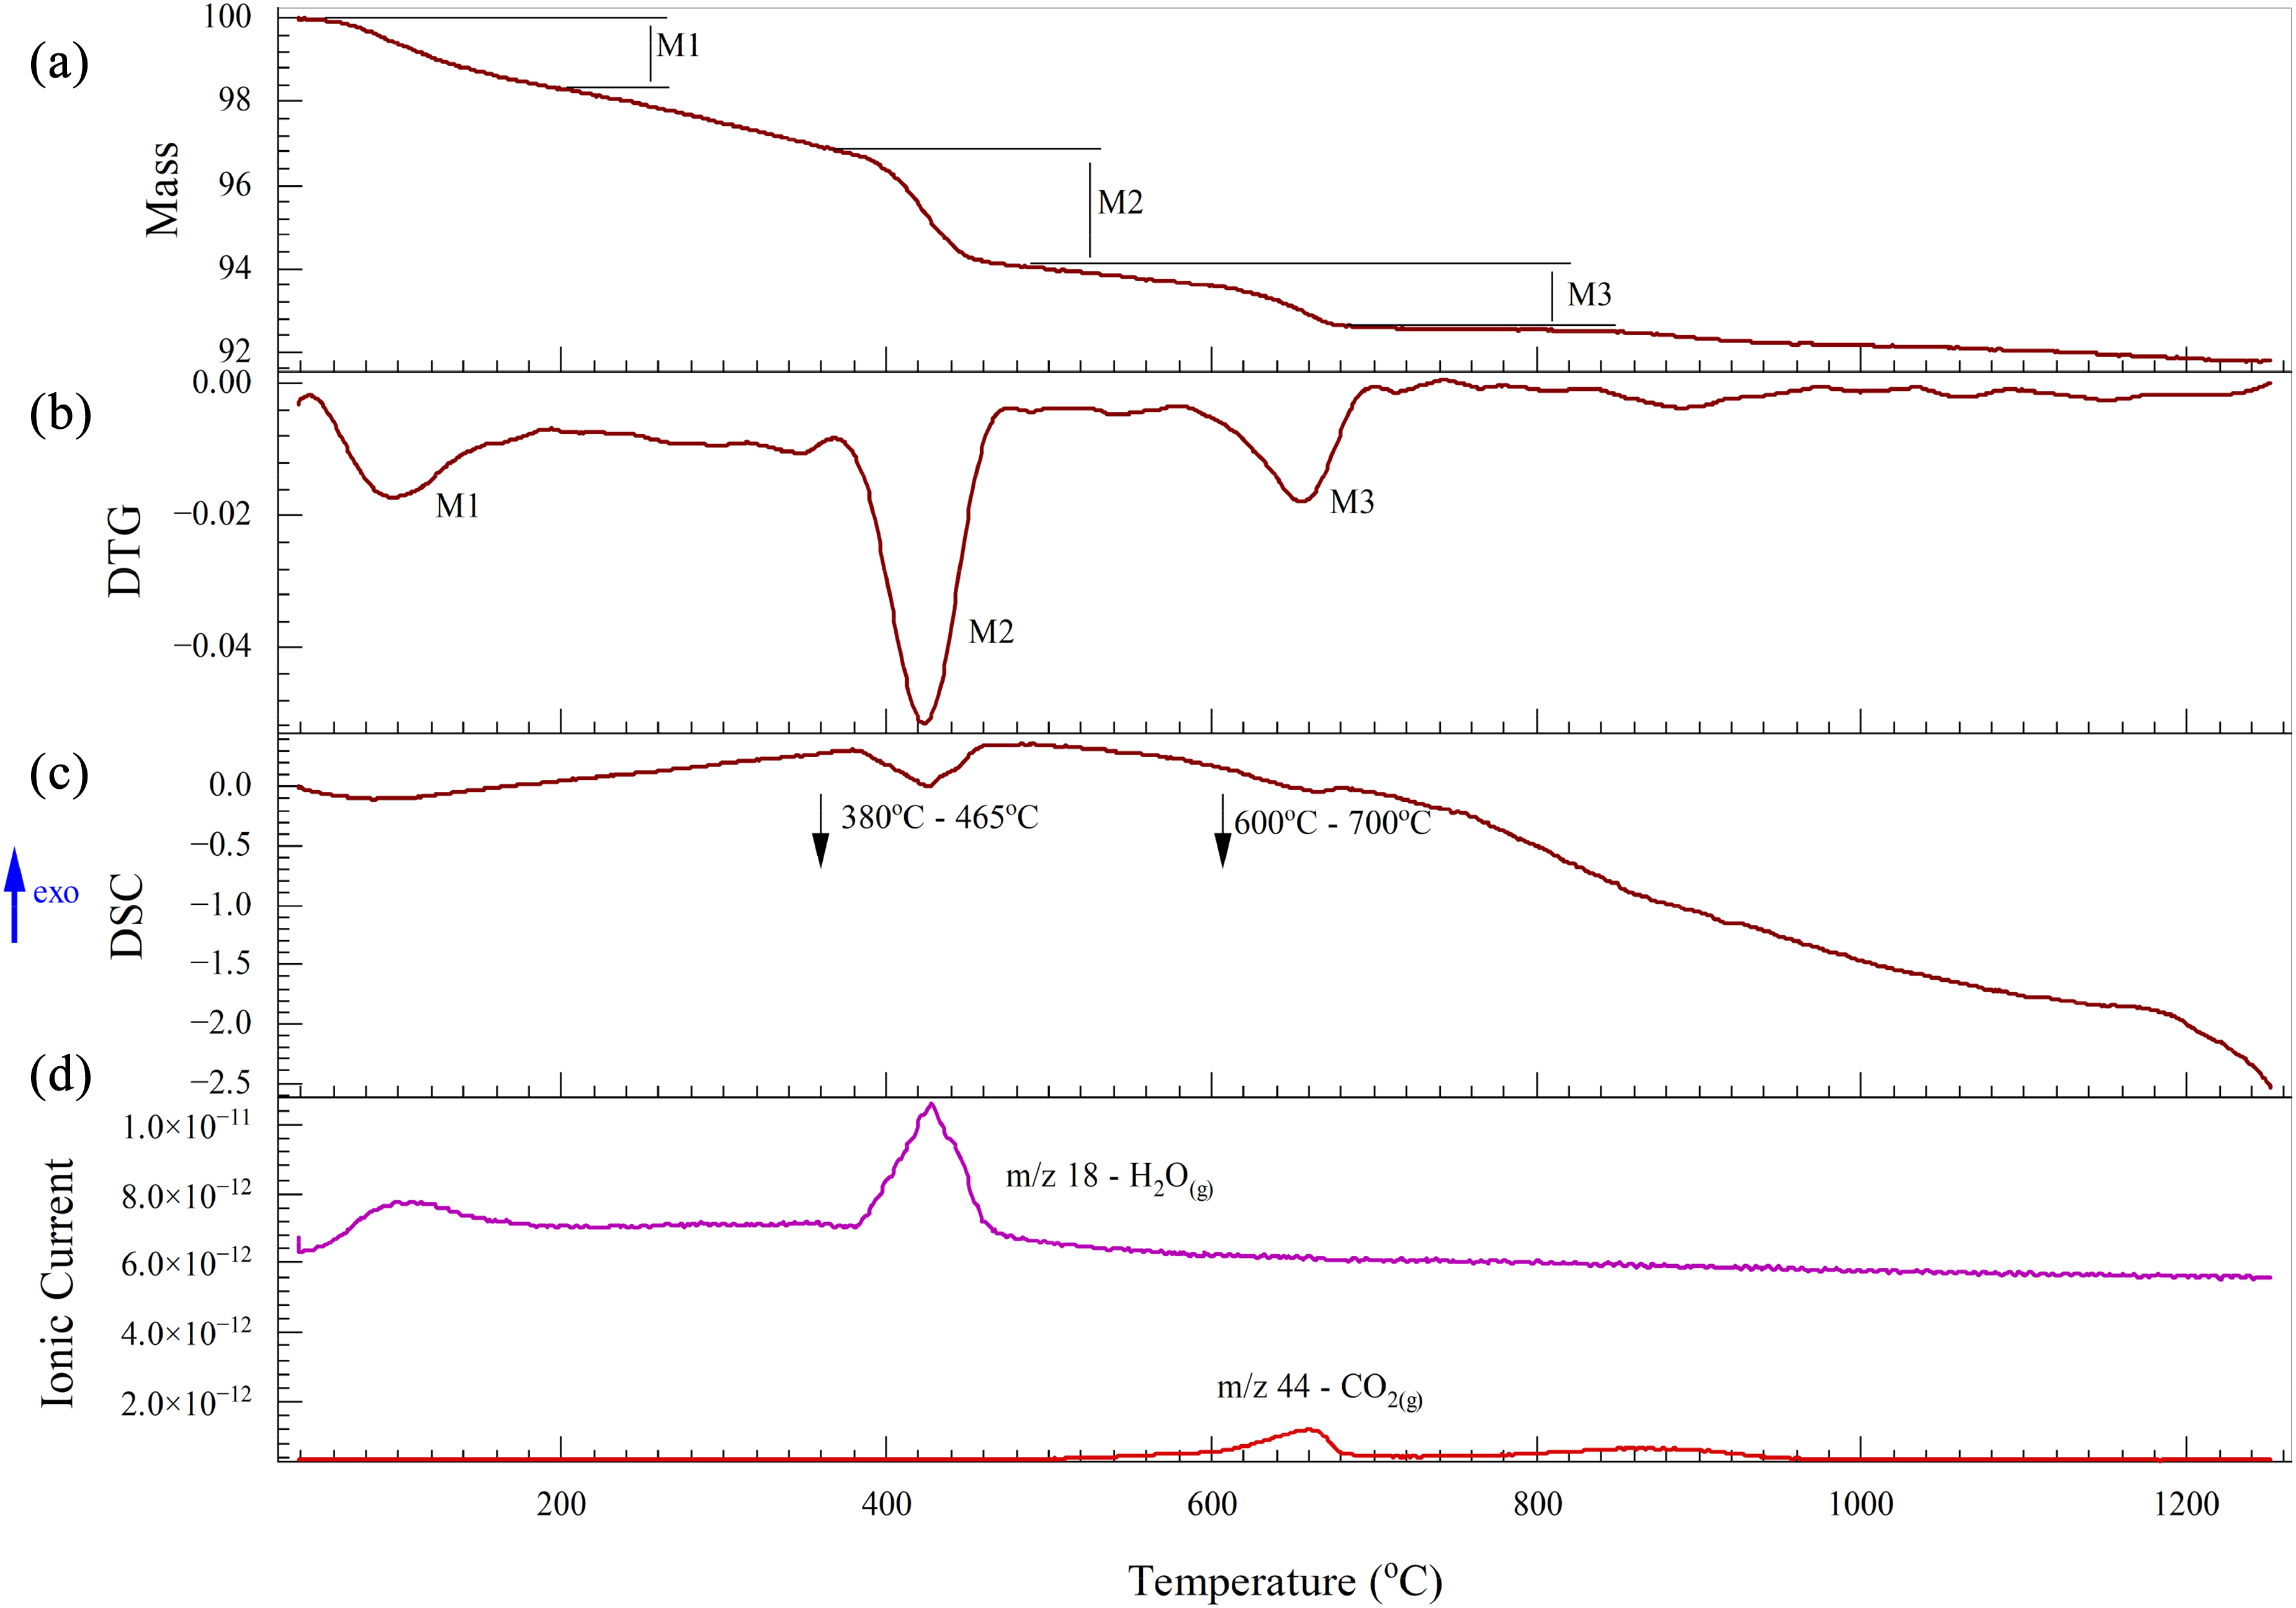
Thermal analysis of BOF slag under a nitrogen atmosphere: (a) TG; (b) DTG ; (c) DSC and (D) Mass spectrum. BOF: basic oxygen furnace; TG: thermogravimetric; DSC: differential scanning calorimetry.
From 600 to 700 °C, mass loss occurred, and this was associated with an endothermic peak and a CO2(g) mass spectrum peak indicating the decomposition of carbonates (equation (16)).
The permittivities of BOF slag as a function of temperature and frequency are illustrated in Figure 13. As shown in Figure 13(a), the real permittivity gradually increases until 1100 °C, where it exhibits a sharp rise due to the sintering and melting processes. Similarly, the imaginary permittivities (Figure 13(b)) remain relatively constant until 1100 °C, after which they show a sudden increase, though with lower values than the real permittivities. Both the real and imaginary permittivities are higher at lower frequencies, although the variation is small.
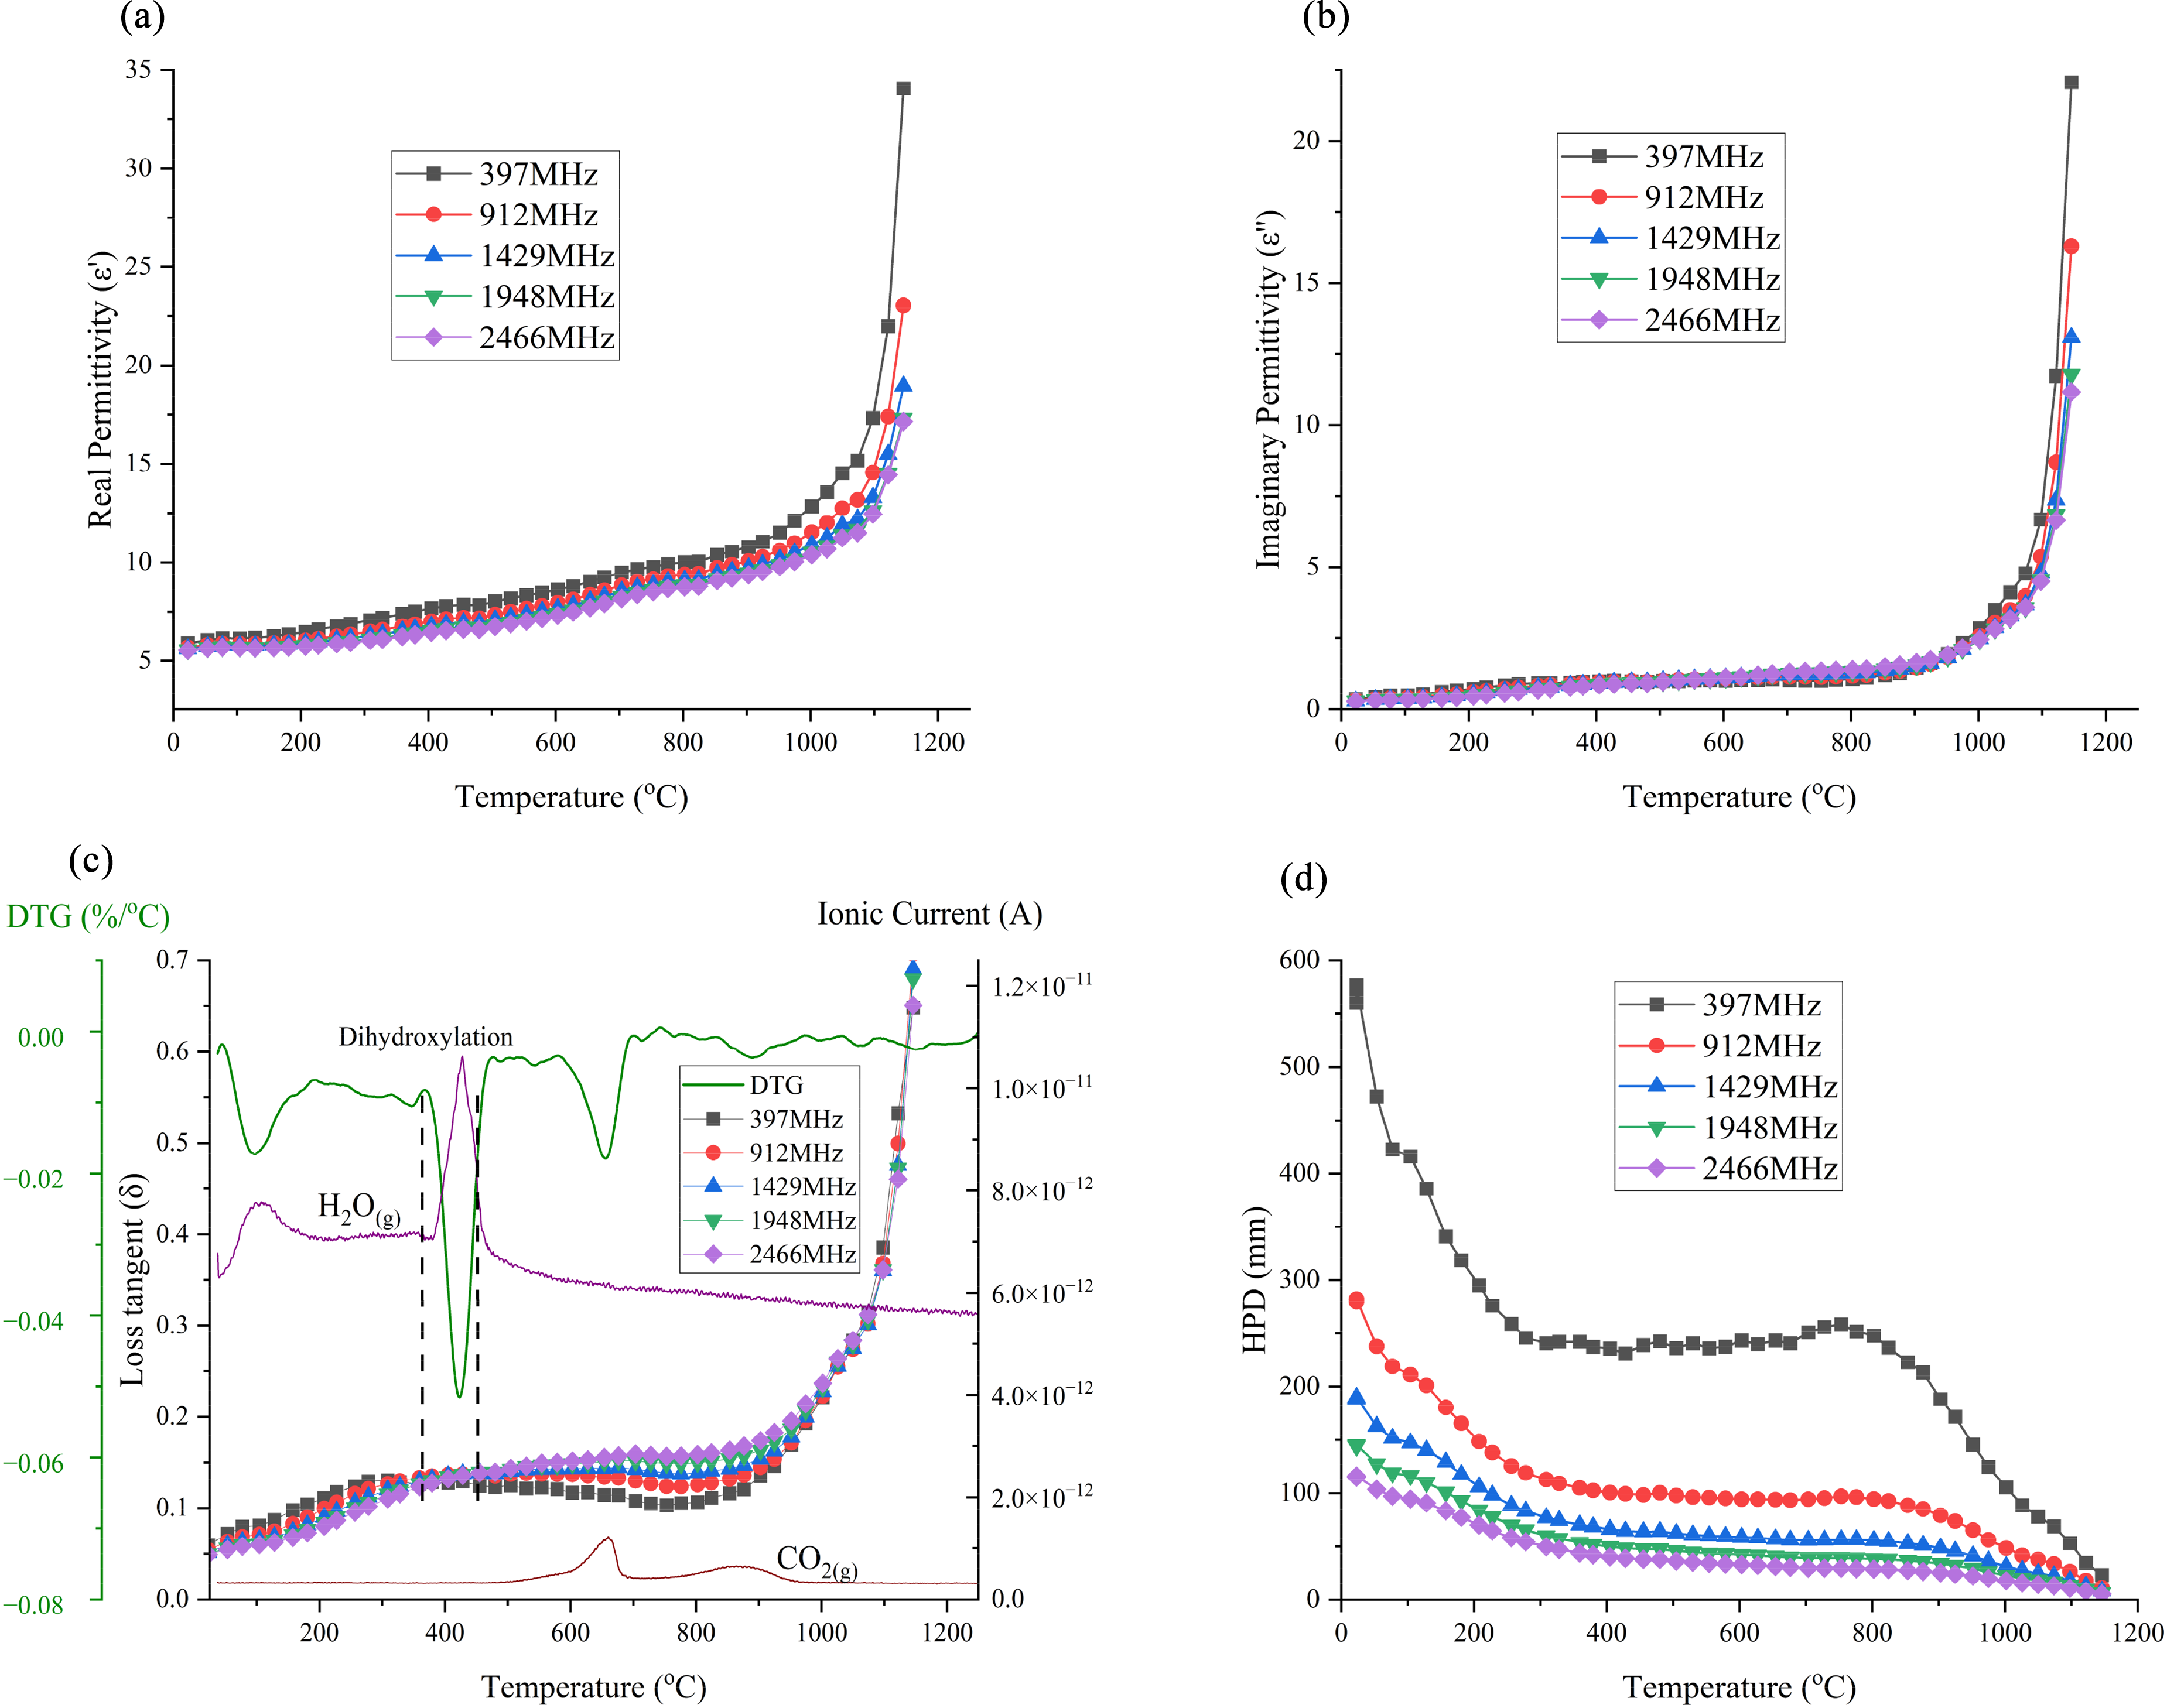
Permittivities, loss tangent and half-power depth of BOF slag: (a) real permittivity; (b) imaginary permittivity; (c) loss tangent; DTG and MS curves and (d) half-power depth (initial density: 1.95 g cm−3). BOF: basic oxygen furnace; MS: mass spectrometry.
The loss tangents are shown in Figure 13(c), and a notable feature before dehydroxylation is that the lower frequencies exhibit higher loss tangents, likely due to the dominant mechanism being dipolar relaxation of hydroxyl groups. However, after dehydroxylation, the higher frequencies had higher loss tangent values, possibly due to enhanced electronic or vibrational polarisation at these frequencies, as the molecular structure becomes more rigid and less flexible. 19 Overall, the loss tangent remains relatively low, ranging from 0.05 to 0.15 up to 1000 °C. After 1000 °C, the loss tangent curve shows a sharp increase.
As shown in Figure 13(d), the HPD values were relatively high, particularly at lower frequencies, suggesting the potential for uniform heating with microwaves, even for thick samples. Up to 800 °C, the HPD remained high, reaching 250 mm at 397 MHz, while for other frequencies it ranged between 100 and 40 mm. Above 800 °C, the HPD decreased, eventually dropping to almost zero at 1100 °C.
BOF sludge
The thermal analysis of BOF sludge is illustrated in Figure 14. A mass loss is noted between 600 and 660 °C, accompanied by a small endothermic peak and the release of CO2(g), due to calcination (equation (16)). Even though the XRD results do not show calcite in the sample, Siedlecka 64 has revealed in his study, that there can be significant amounts of calcite in the BOF sludge. There was an unexpected small mass gain from 750 to 1100 °C, which is likely oxidation. There could be some oxygen in the system as it can exist as an impurity in the N2(g) or it could trapped within the sample.
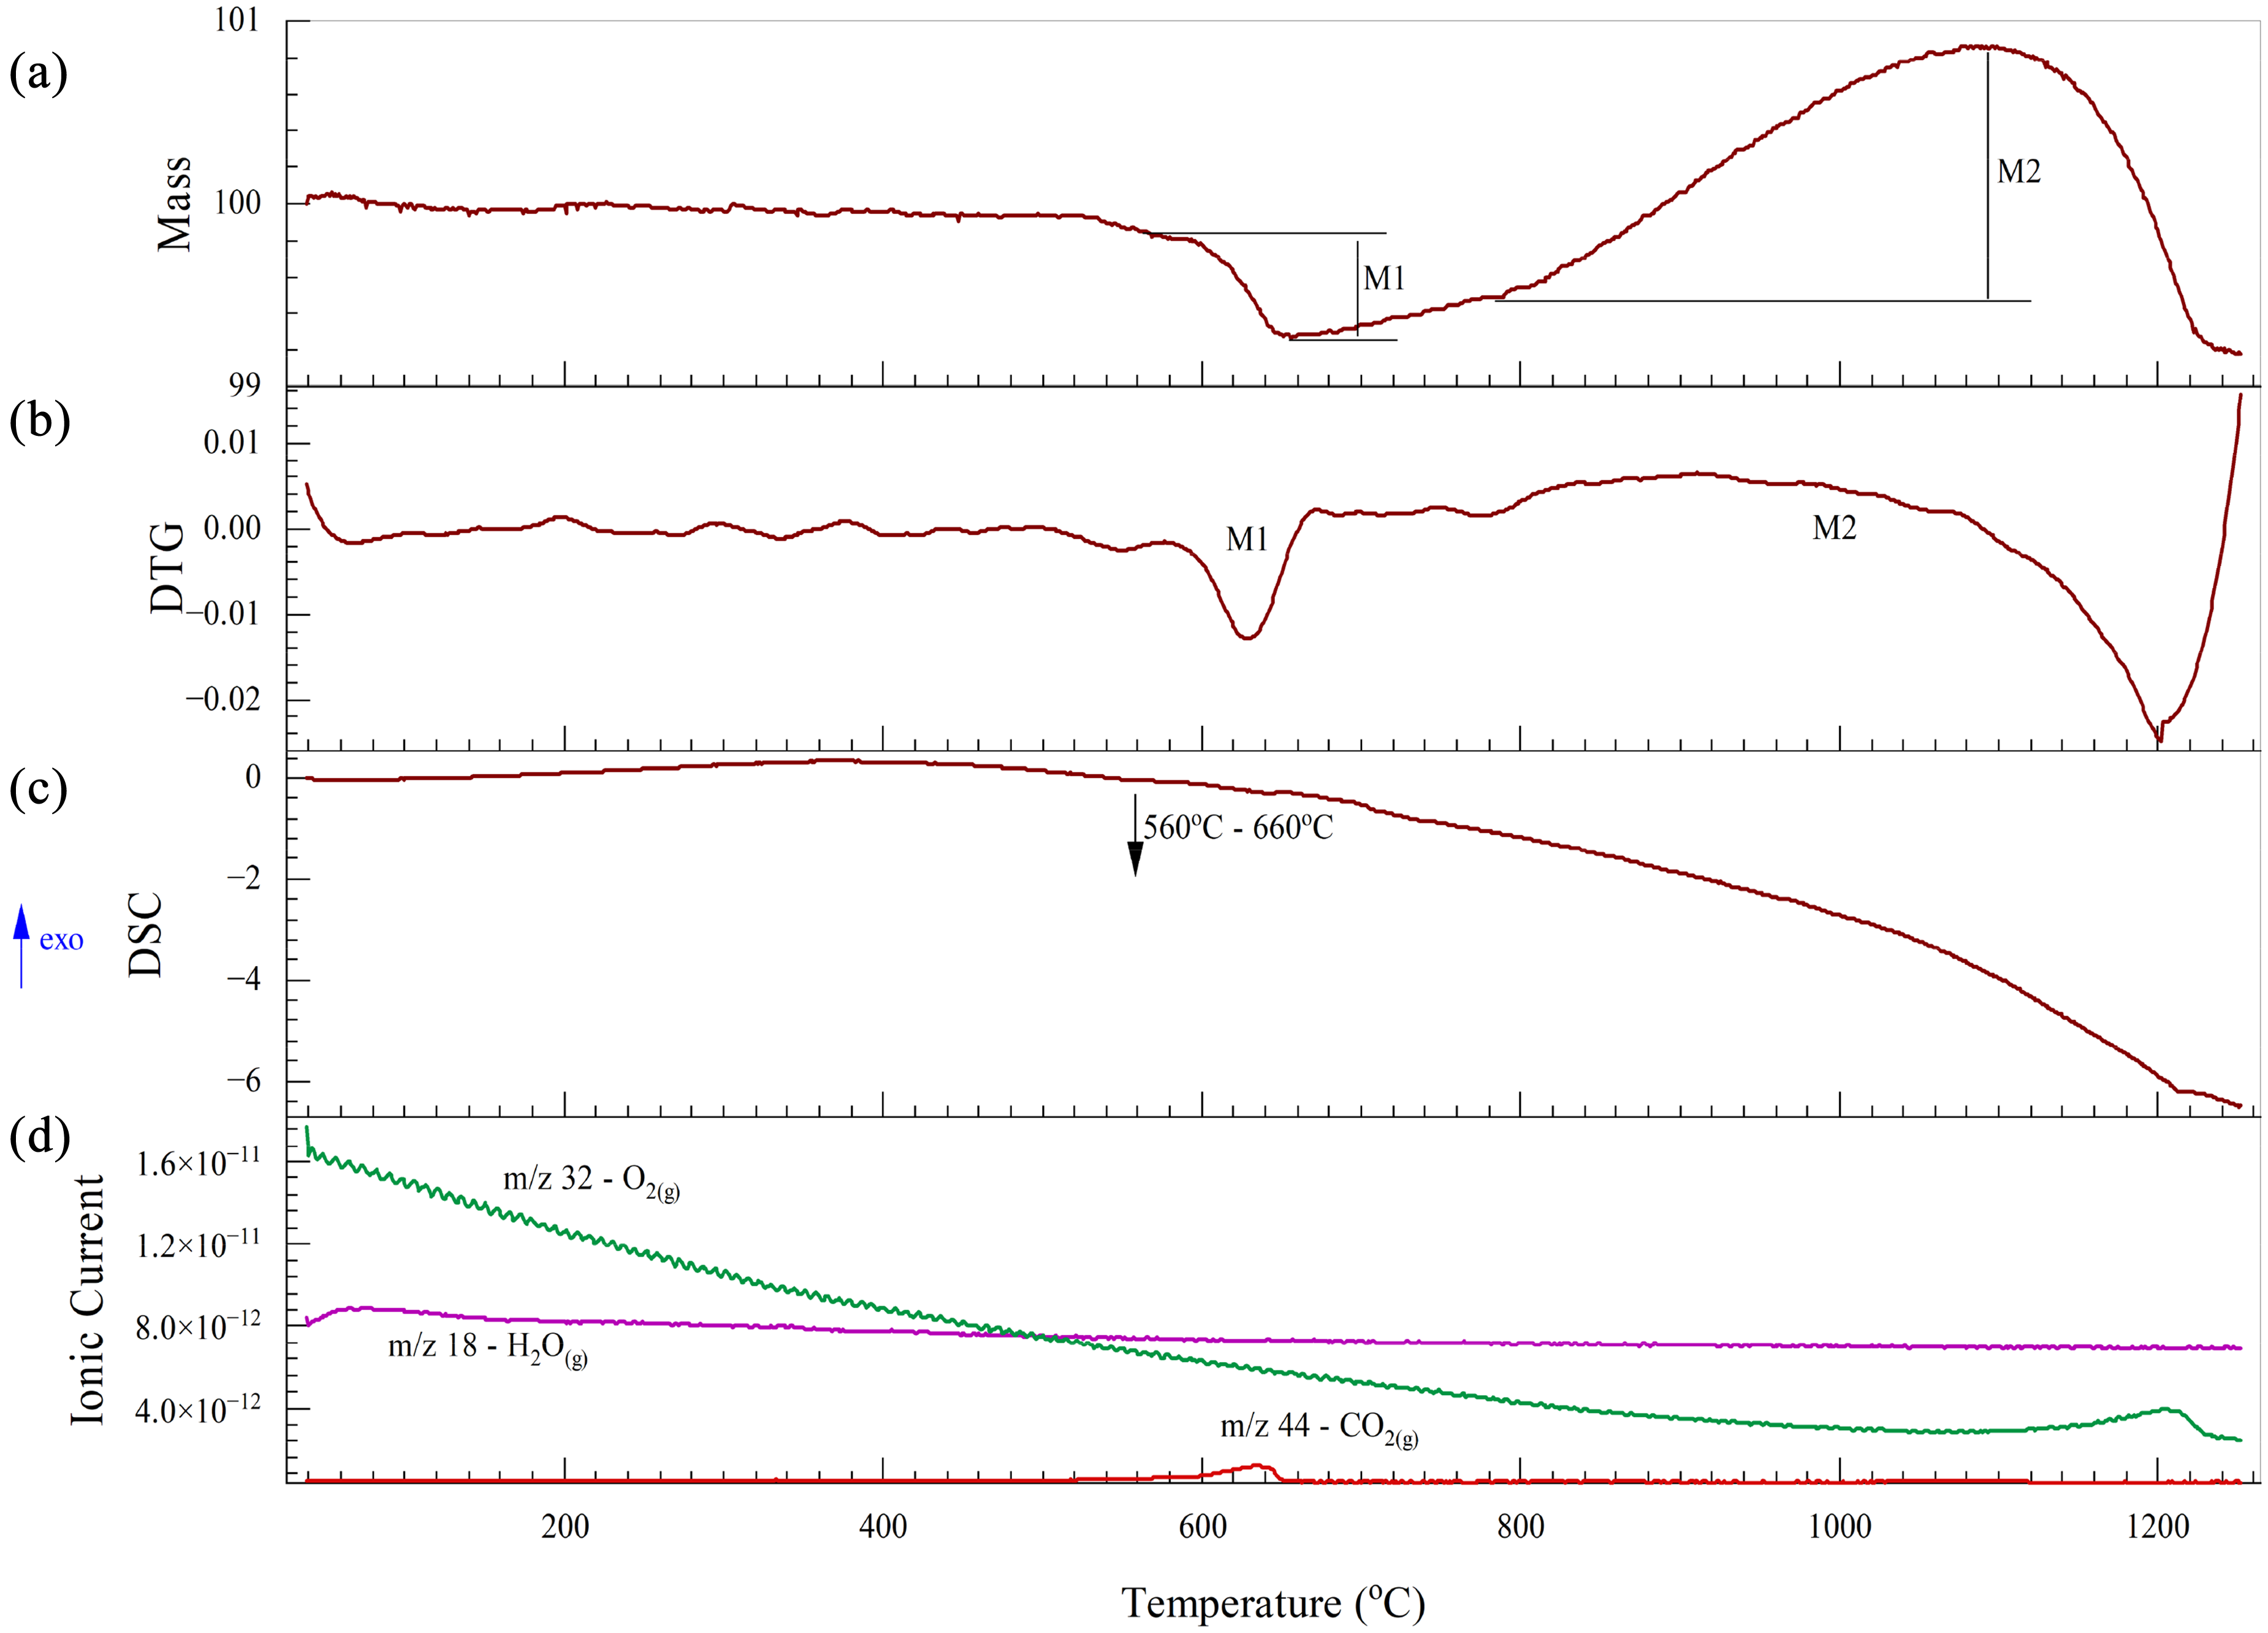
Thermal analysis of BOF sludge under a nitrogen atmosphere: (a) TG; (b) DTG; (C) DSC and (D) mass spectrum. BOF: basic oxygen furnace; TG: thermogravimetric; DSC: differential scanning calorimetry.
BOF sludge contains some metallic iron. Therefore, to account for the mass gain, the possible iron oxidation reactions were analysed using thermodynamic data from HSC 10 software. As shown in Figure 15, a Kellogg diagram for the Fe–O–N system was developed, assuming a fixed nitrogen pressure of 1 atm. Within the temperature range of 800 to 1100 °C, wustite is the most likely oxidation product (equation (20)), as it requires the lowest driving force and the lowest partial pressure of oxygen. However, wustite occupies a very narrow region on the diagram. Furthermore, the oxygen partial pressure needed for the formation of magnetite is also very low. Therefore, it is also possible for metallic iron to oxidise to magnetite (equation (21)) within this temperature range:

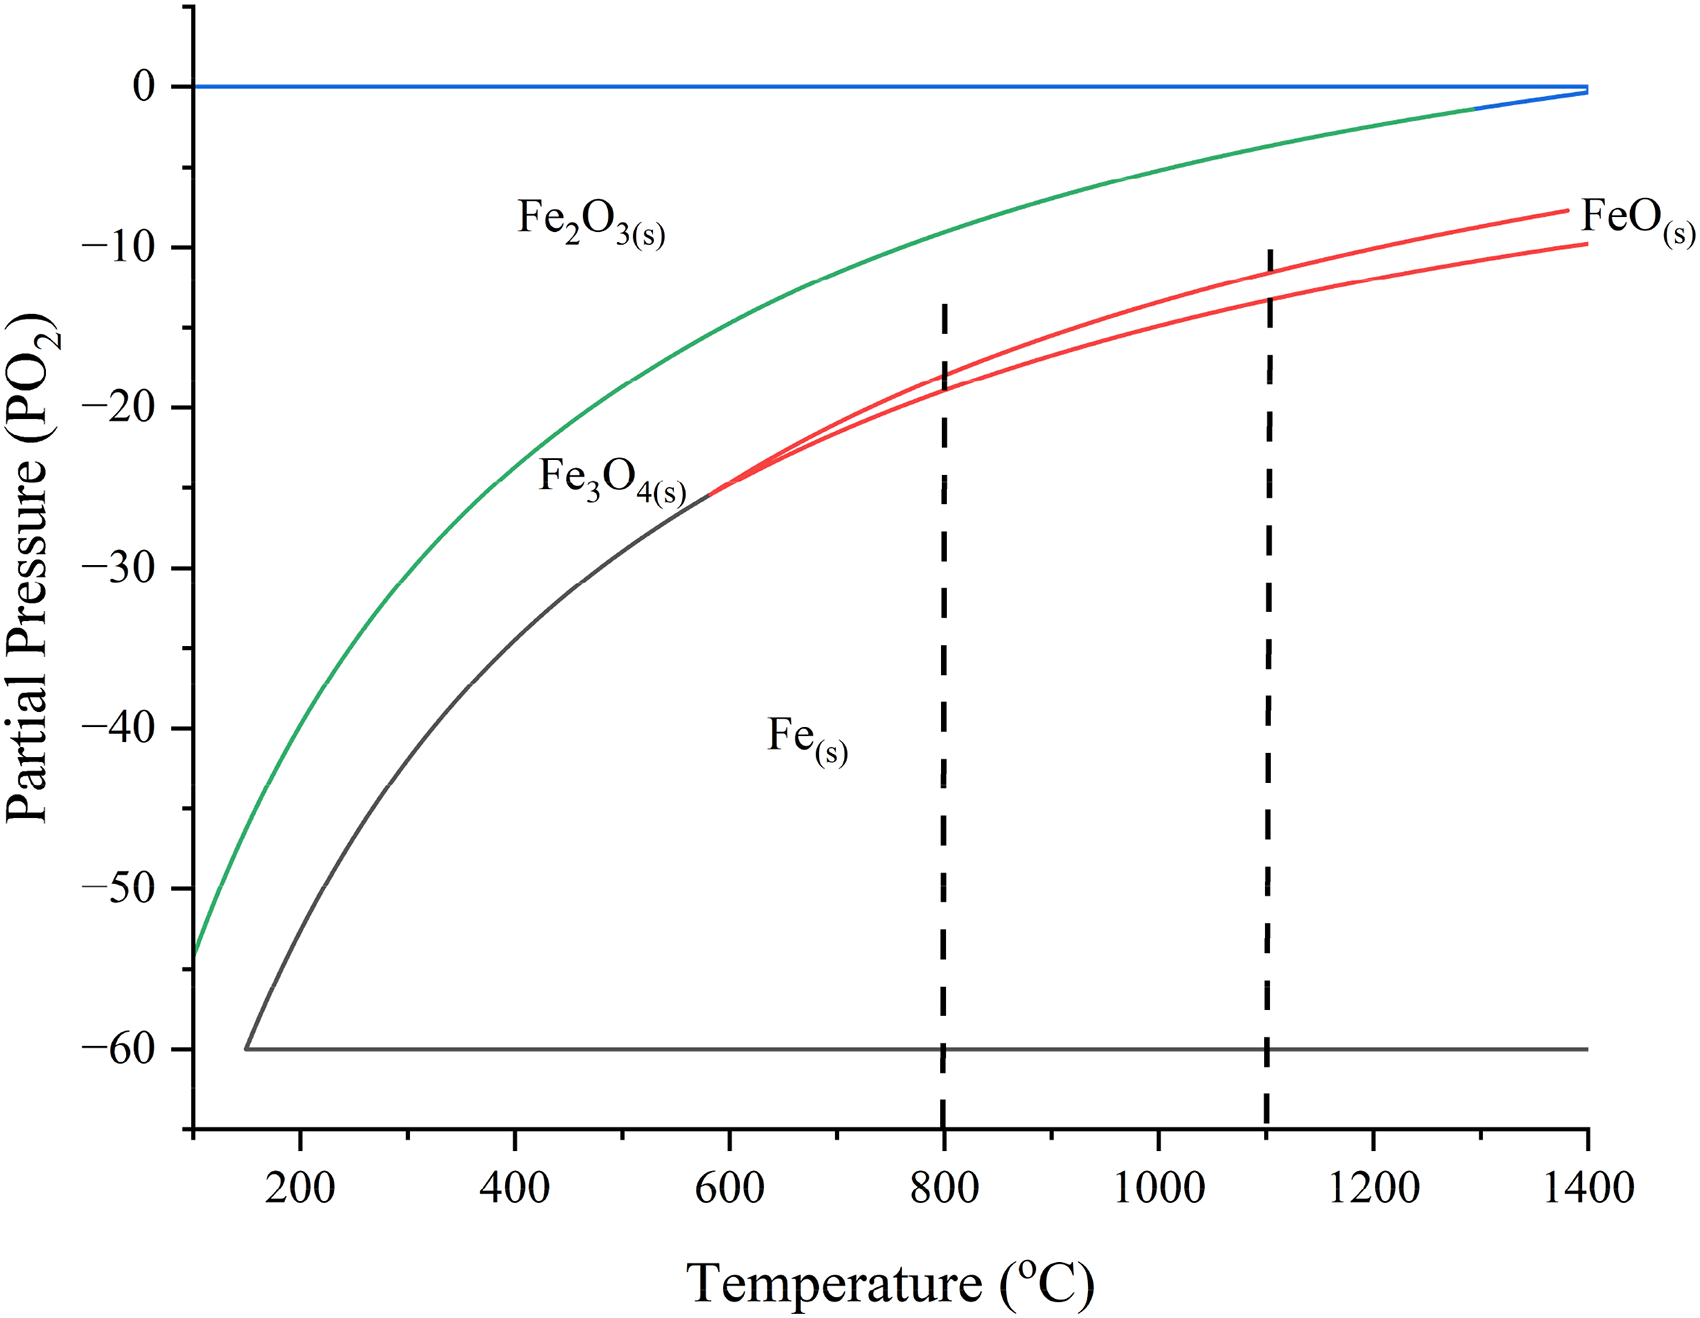
Kellogg diagram for Fe–O–N system under a nitrogen atmosphere.
The permittivities of BOF sludge as a function of temperature and frequency are shown in Figure 16. The BOF sludge was not pre-dried and thus had a very high moisture content of 32.5%. Therefore, as shown in Figure 16(a) and (b), both the room temperature real and imaginary permittivities were very high, but then decreased rapidly as the temperature increased and the moisture was removed up to 130 °C. The high permittivities at low temperatures suggest that if an initial high temperature is required in a processing step, then adding moisture could be beneficial to surpass the critical moisture threshold, enhancing thermal efficiency during ages. 19
Permittivities, loss tangent and half-power depth of BOF sludge: (a) real permittivity; (b) imaginary permittivity; (c) loss tangent; DTG and MS curves and (d) half-power depth (initial density: 2.71 g cm−3). BOF: basic oxygen furnace; MS: mass spectrometry.
Between 750 and 975 °C, a significant increase in real permittivities was observed, likely due to the formation of magnetite as a result of the oxidation of metallic iron and wustite. Here the real permittivities increased with decreasing frequency and also the increase was larger at lower frequencies. As discussed previously, the presence of magnetite enhances ionic conduction. A similar trend was observed for the imaginary permittivities, with a slight shift in the temperature range down to 700 to 800 °C. The loss tangent in Figure 16(c) follows a similar pattern to the permittivity curves with high values at both low and high temperatures. Therefore, there should be efficient generation of heat over the temperature ranges where the loss tangent is high. As illustrated in Figure 16(d), the HPD is high at both low and high temperatures but decreases significantly beyond 800 °C. As expected, the HPD decreases with increasing frequency. The density values have been reduced significantly after 700 °C making less accuracy of the permittivity results after this temperature.
Mechanism of microwave interaction with iron- and steelmaking side stream
Through the measurement of the permittivities of each iron- and steelmaking by-product as a function of temperature and frequency, the optimum conditions to achieve efficient microwave heating were determined. The two major microwave heating mechanisms are dipolar rotation and ionic conduction. Additionally, in solid materials, induced polarisation can also contribute to heat dissipation due to the phase lag between the applied electric field and the material's polarisation response. Many of the by-products contain carbonates and hydroxyl species as shown in the thermal data and this should result in heating up to 600 °C due to the polarised structure of these compounds as shown in Figure 17.
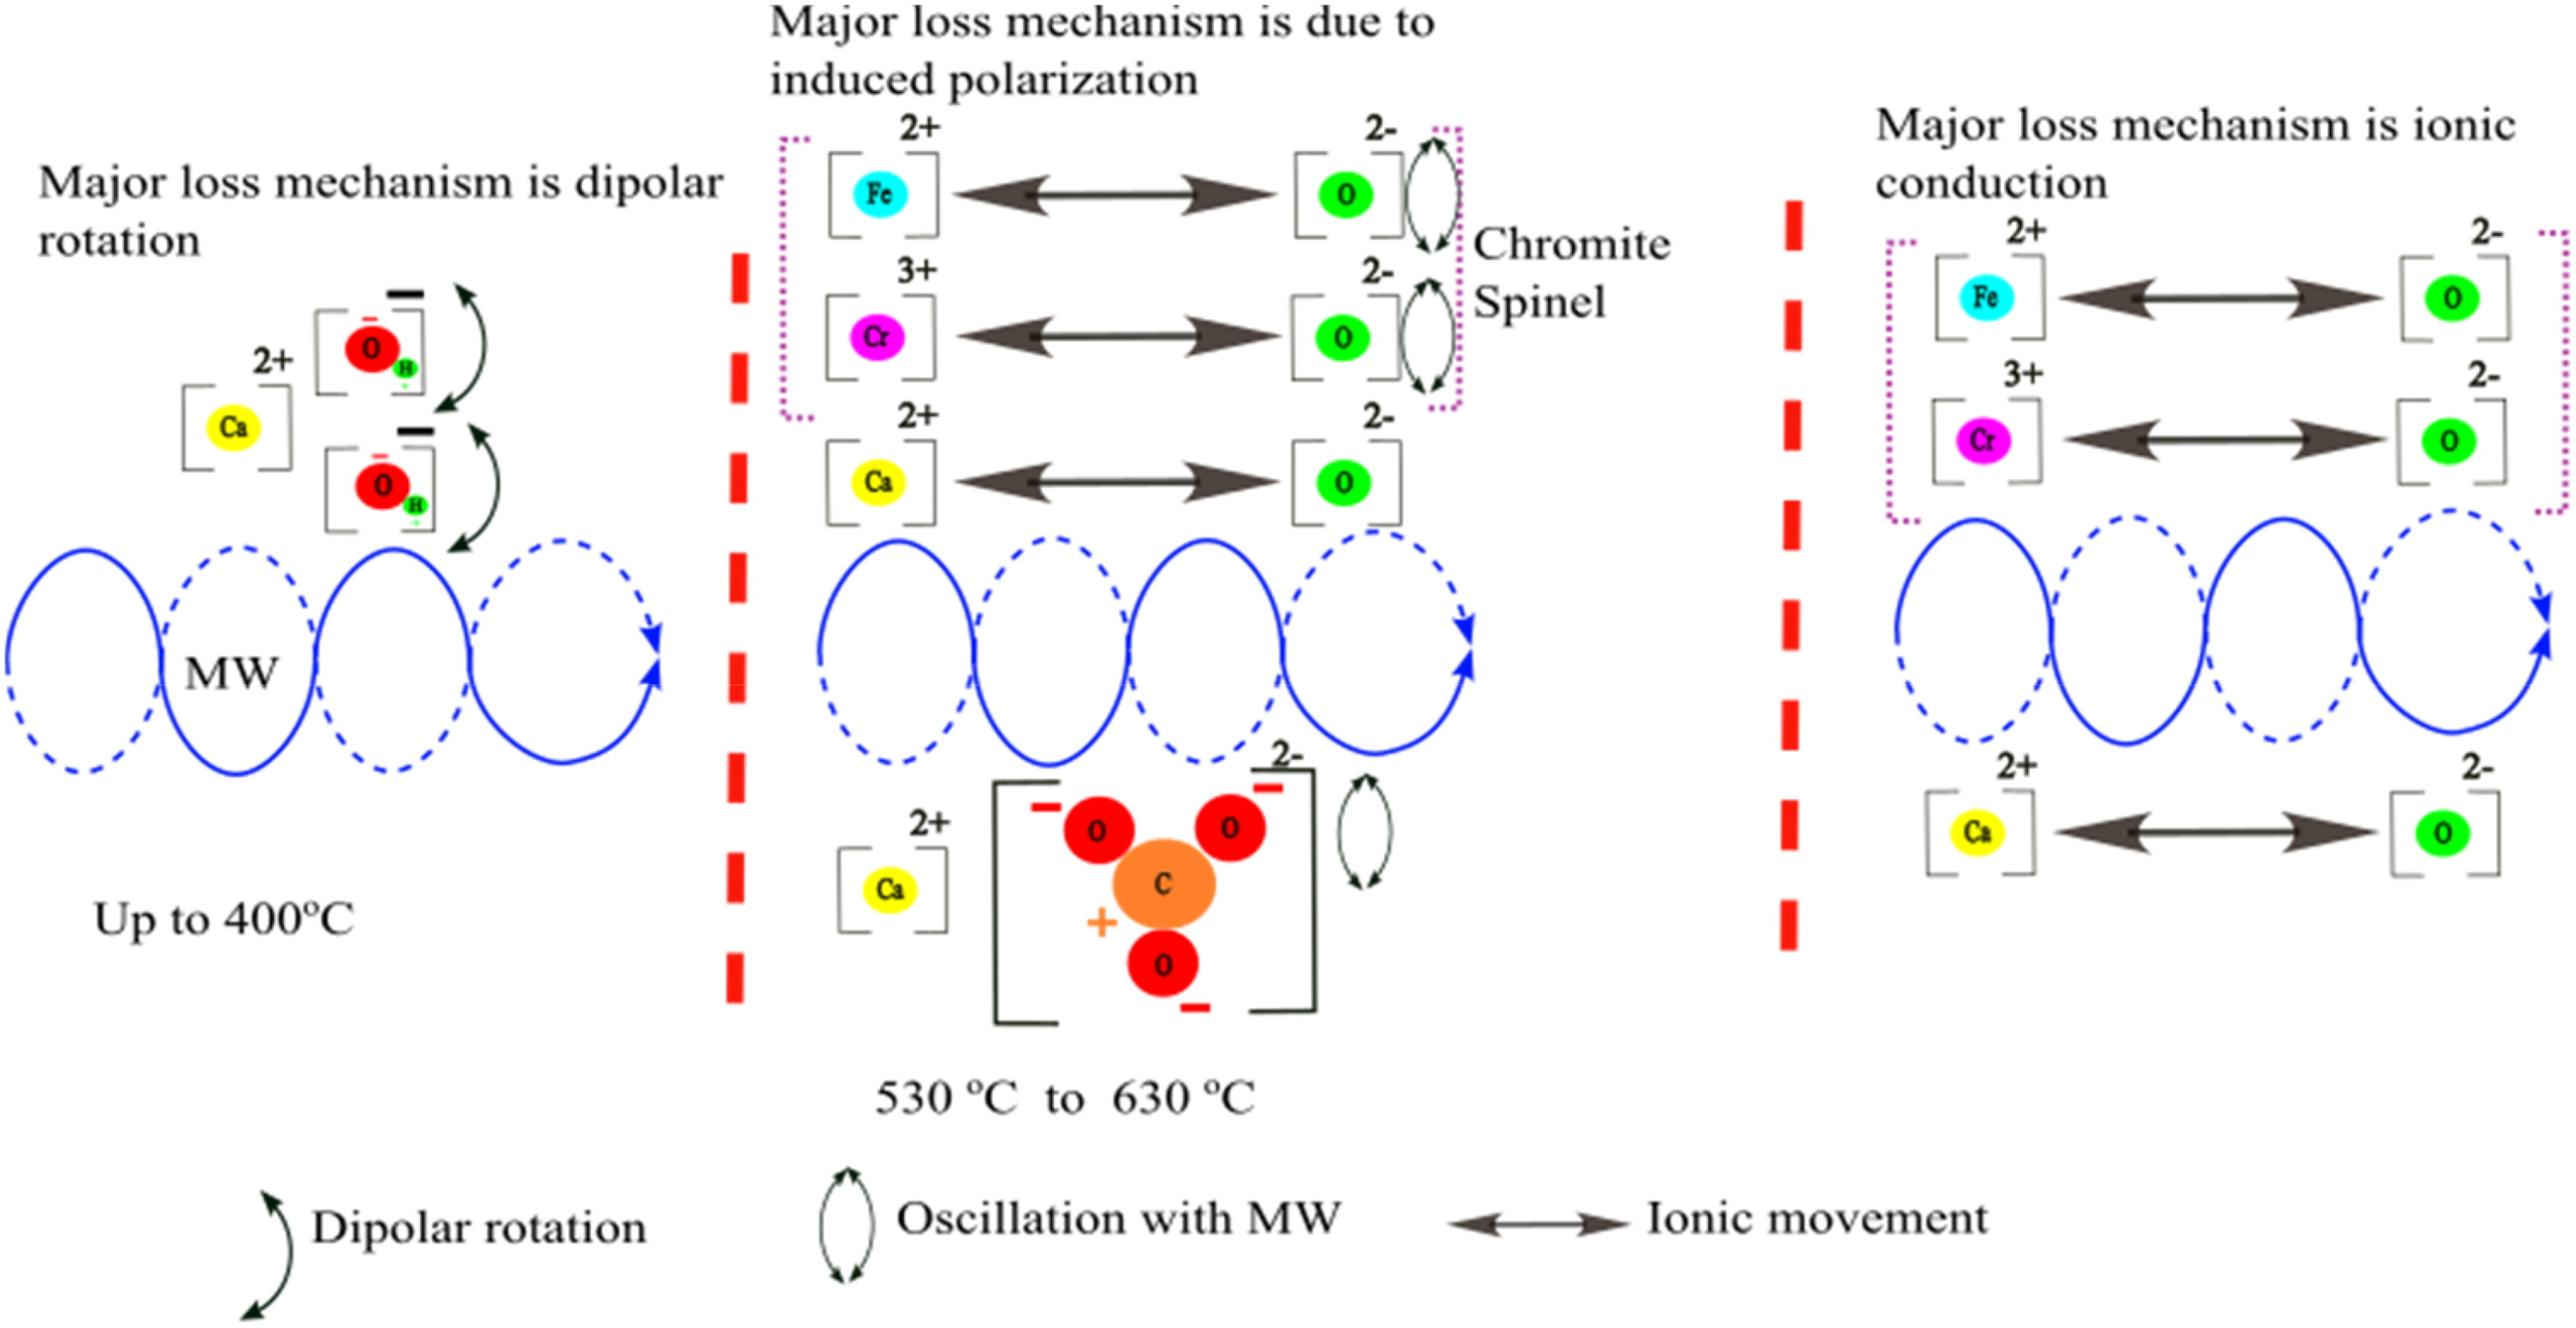
Microwave interaction with carbonates and hydroxyl ions in different temperature ranges.
However, in addition to carboxyl and hydroxyl ions, each by-product contains other compounds, which may contribute to their loss behaviours. For example, in the CRC dust, the iron chromite phase shows ionic polarisation up to 630 °C, with phase lag as the primary loss mechanism. Beyond 630 °C, iron oxide and chromium oxide within the iron chromite become fully conductive, exhibiting high ionic conduction at elevated temperatures as shown in Figure 17.
In the EAFSS dust, up to 575 °C, the carboxyl and hydroxyl ions are the primary contributors to the dipolar loss mechanism, with zinc oxide and franklinite in the material further adding to this effect, especially at lower temperatures. Franklinite has a spinel structure with a dielectric behaviour similar to iron chromite, and the mechanisms involve induced polarisation followed by ionic conduction at temperatures beyond 900 °C. Furthermore, at this temperature, sample sintering occurs 56 which increases the conductivity, and part of the zinc oxide is reduced and condenses on the quartz tube as zinc vapour.
In BF sludge at room temperature, carbon and haematite are the major components, with calcium carbonate present as a minor component. When considering the loss factor, two significant changes are observed in the temperature ranges of 640 to 800 °C and 800 to 975 °C. As shown in Figure 18, the 640 to 800 °C range corresponds primarily to the calcination process, during which calcium carbonate transforms into calcium oxide, as indicated by the thermal analysis of the BF sludge. In this range, haematite and calcite become the dominant contributors to the loss mechanism, and here the induced polarisation is the primary loss process. Meanwhile, coke (carbon) exhibits delocalisation of electrons within its lattice structure and these free or loosely bound electrons can move easily across the layers, enabling coke to be a good conductor. 65 Therefor ionic conduction is the minor loss mechanism.
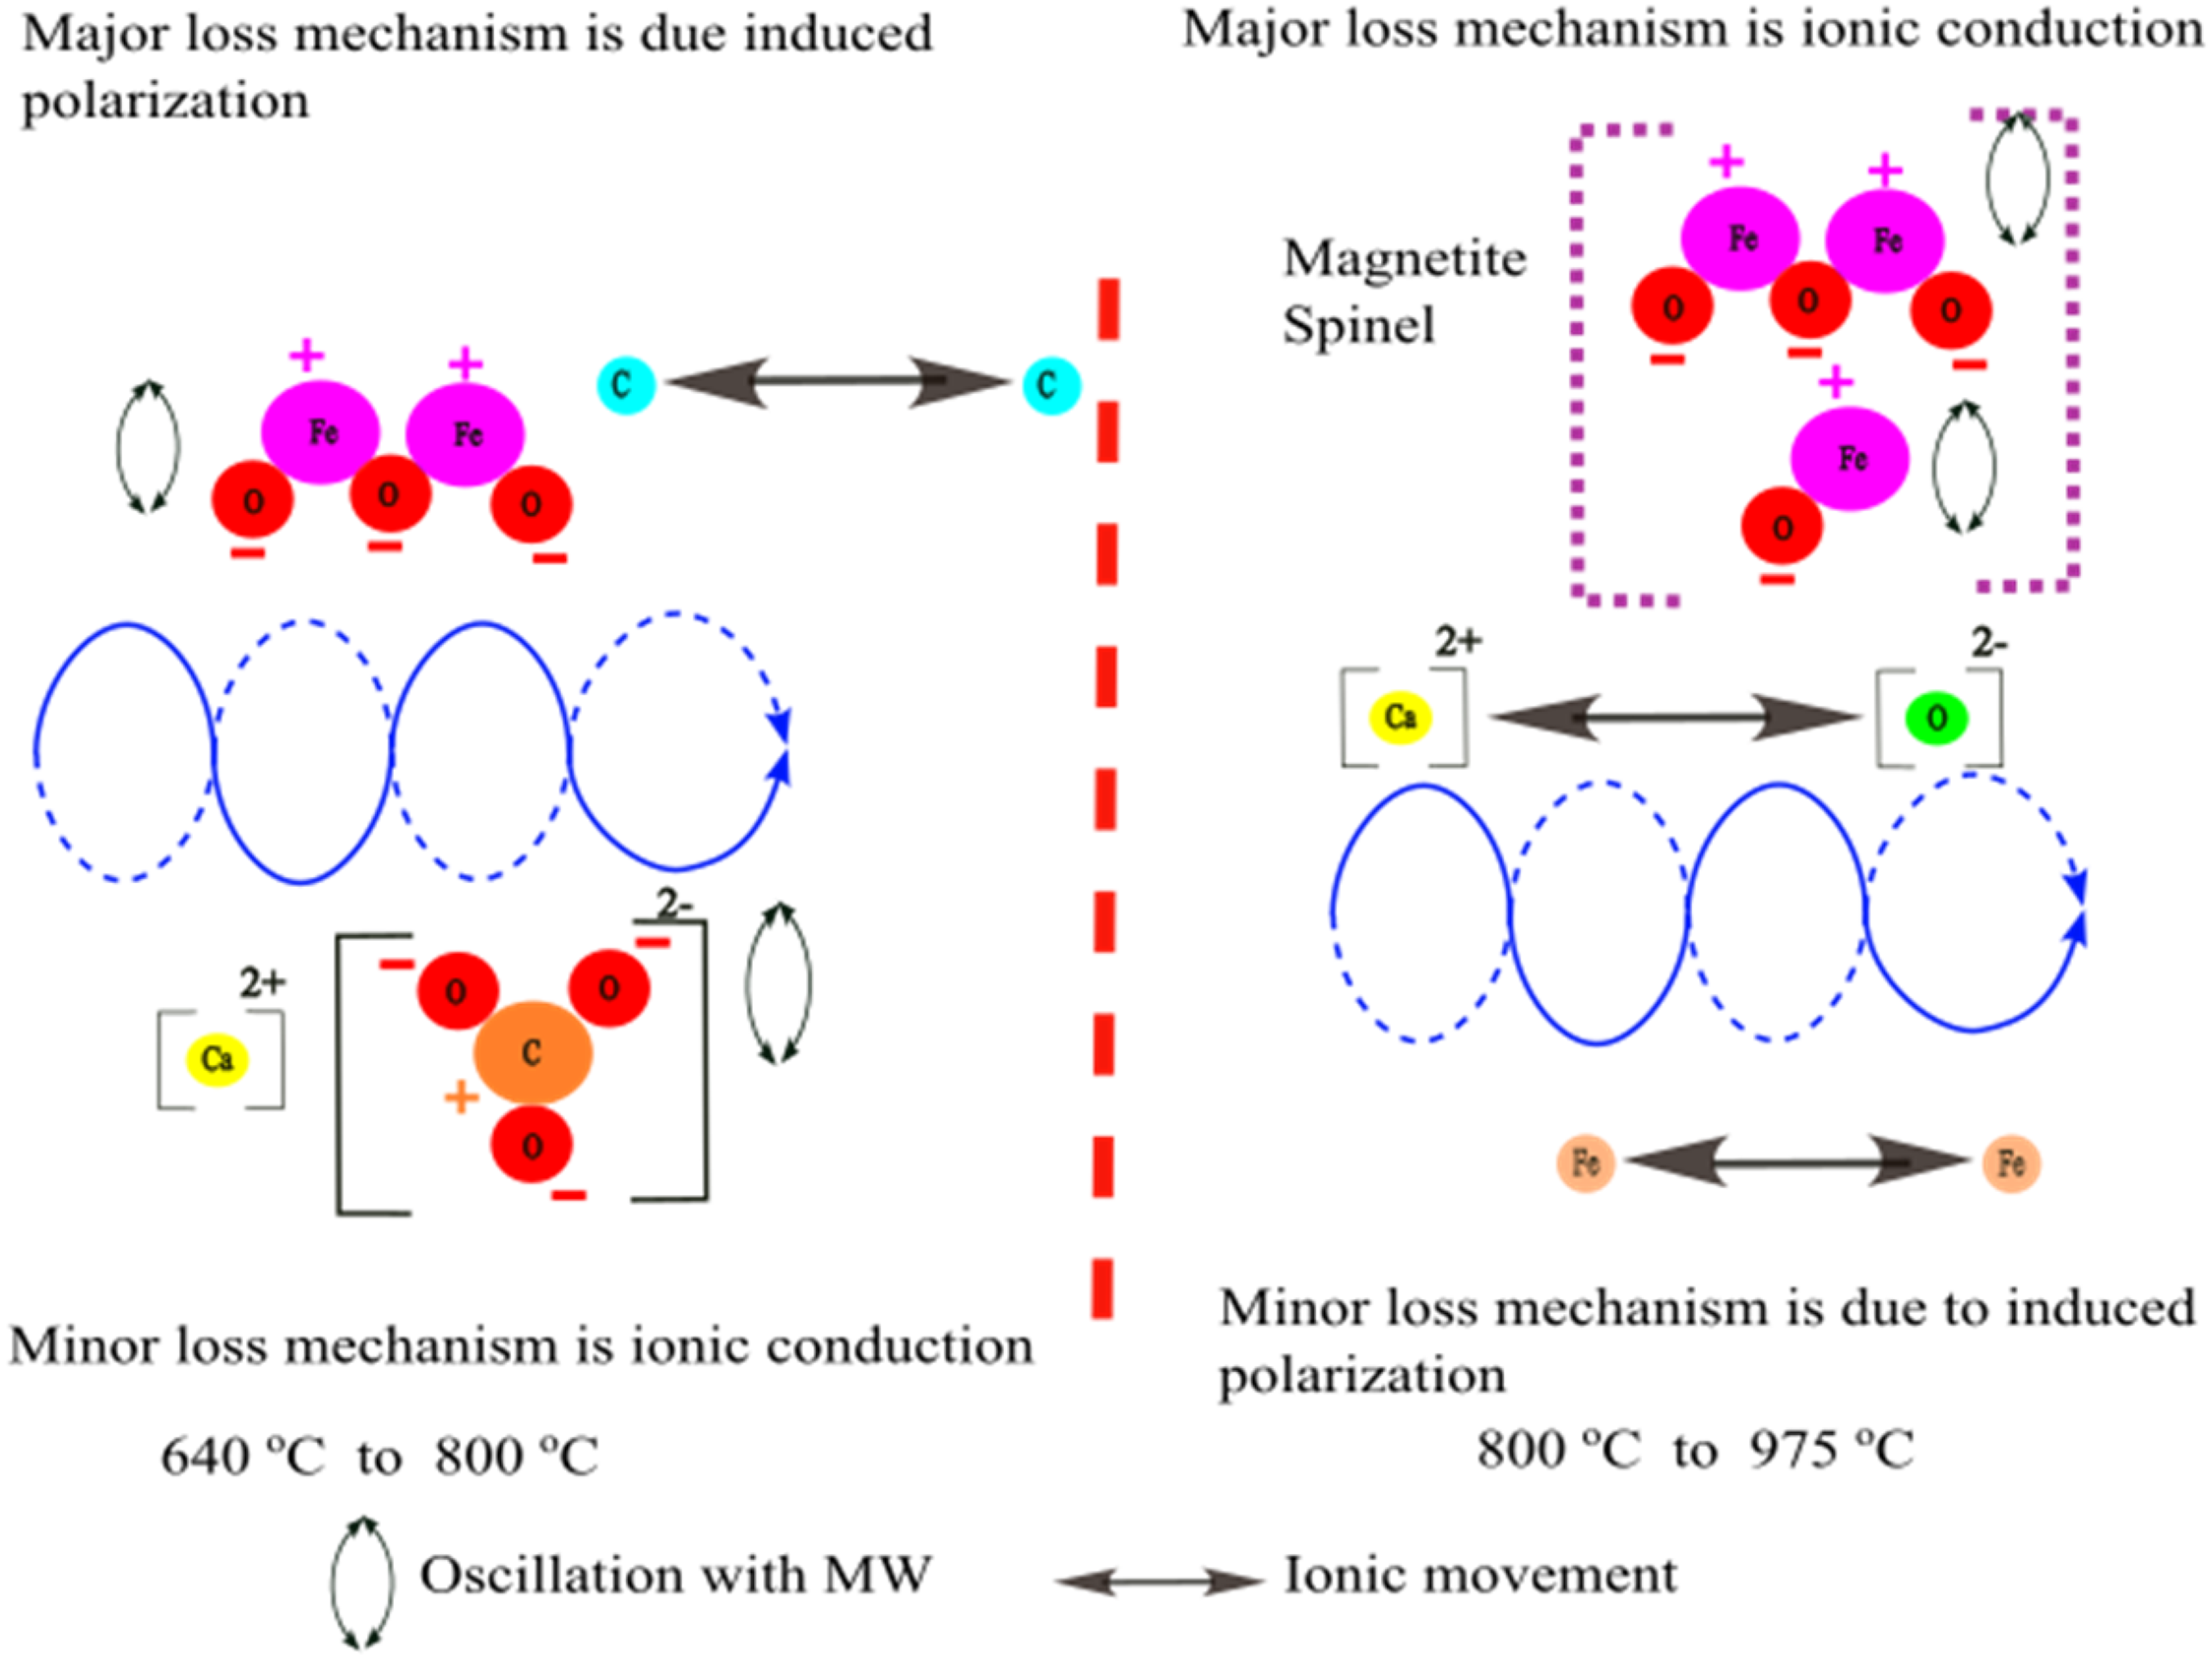
Microwave interaction with BF sludge over different temperature ranges. BF: blast furnace.
Between 800 and 975 °C, the thermal analysis reveals a reduction process in which haematite is reduced to magnetite and metallic iron through the consumption of coke. The formation of magnetite would accelerate the heating process due to its highly polar spinel structure, magnetic properties and also the electrical conductivity due to the presence of Fe2+ and Fe3+. This results in a rapid increase in the imaginary part of the permittivities over this temperature range. Simultaneously, the formation of metallic iron results in conductivity being a minor loss mechanism.
The primary crystalline phases in typical BOF slags are calcium-bearing compounds, with calcium oxide (CaO) comprising more than 30% of the slag's composition. 66 Based on the permittivity results, BOF slag has a lower capacity for microwave absorption and heat generation as compared to the other by-products. An interesting observation is that these materials exhibit a relatively high HPD, particularly at lower frequencies. This suggests the potential for uniform heating under microwave radiation, even for thick samples up to 250 mm, especially at lower frequencies, until the temperature reaches 800 °C.
The BOF sludge has a high moisture content (approximately 32.5%), which results in initially high real and imaginary permittivities. These values decrease sharply between 0 and 130 °C as the loosely bonded water molecules evaporate as shown in Figure 19. This would cause rapid initial microwave heating due to the high polarisation of water molecules. Subsequently, significant changes in the permittivities are observed between 800 and 975 °C, corresponding to a slight mass increase in thermal analysis.
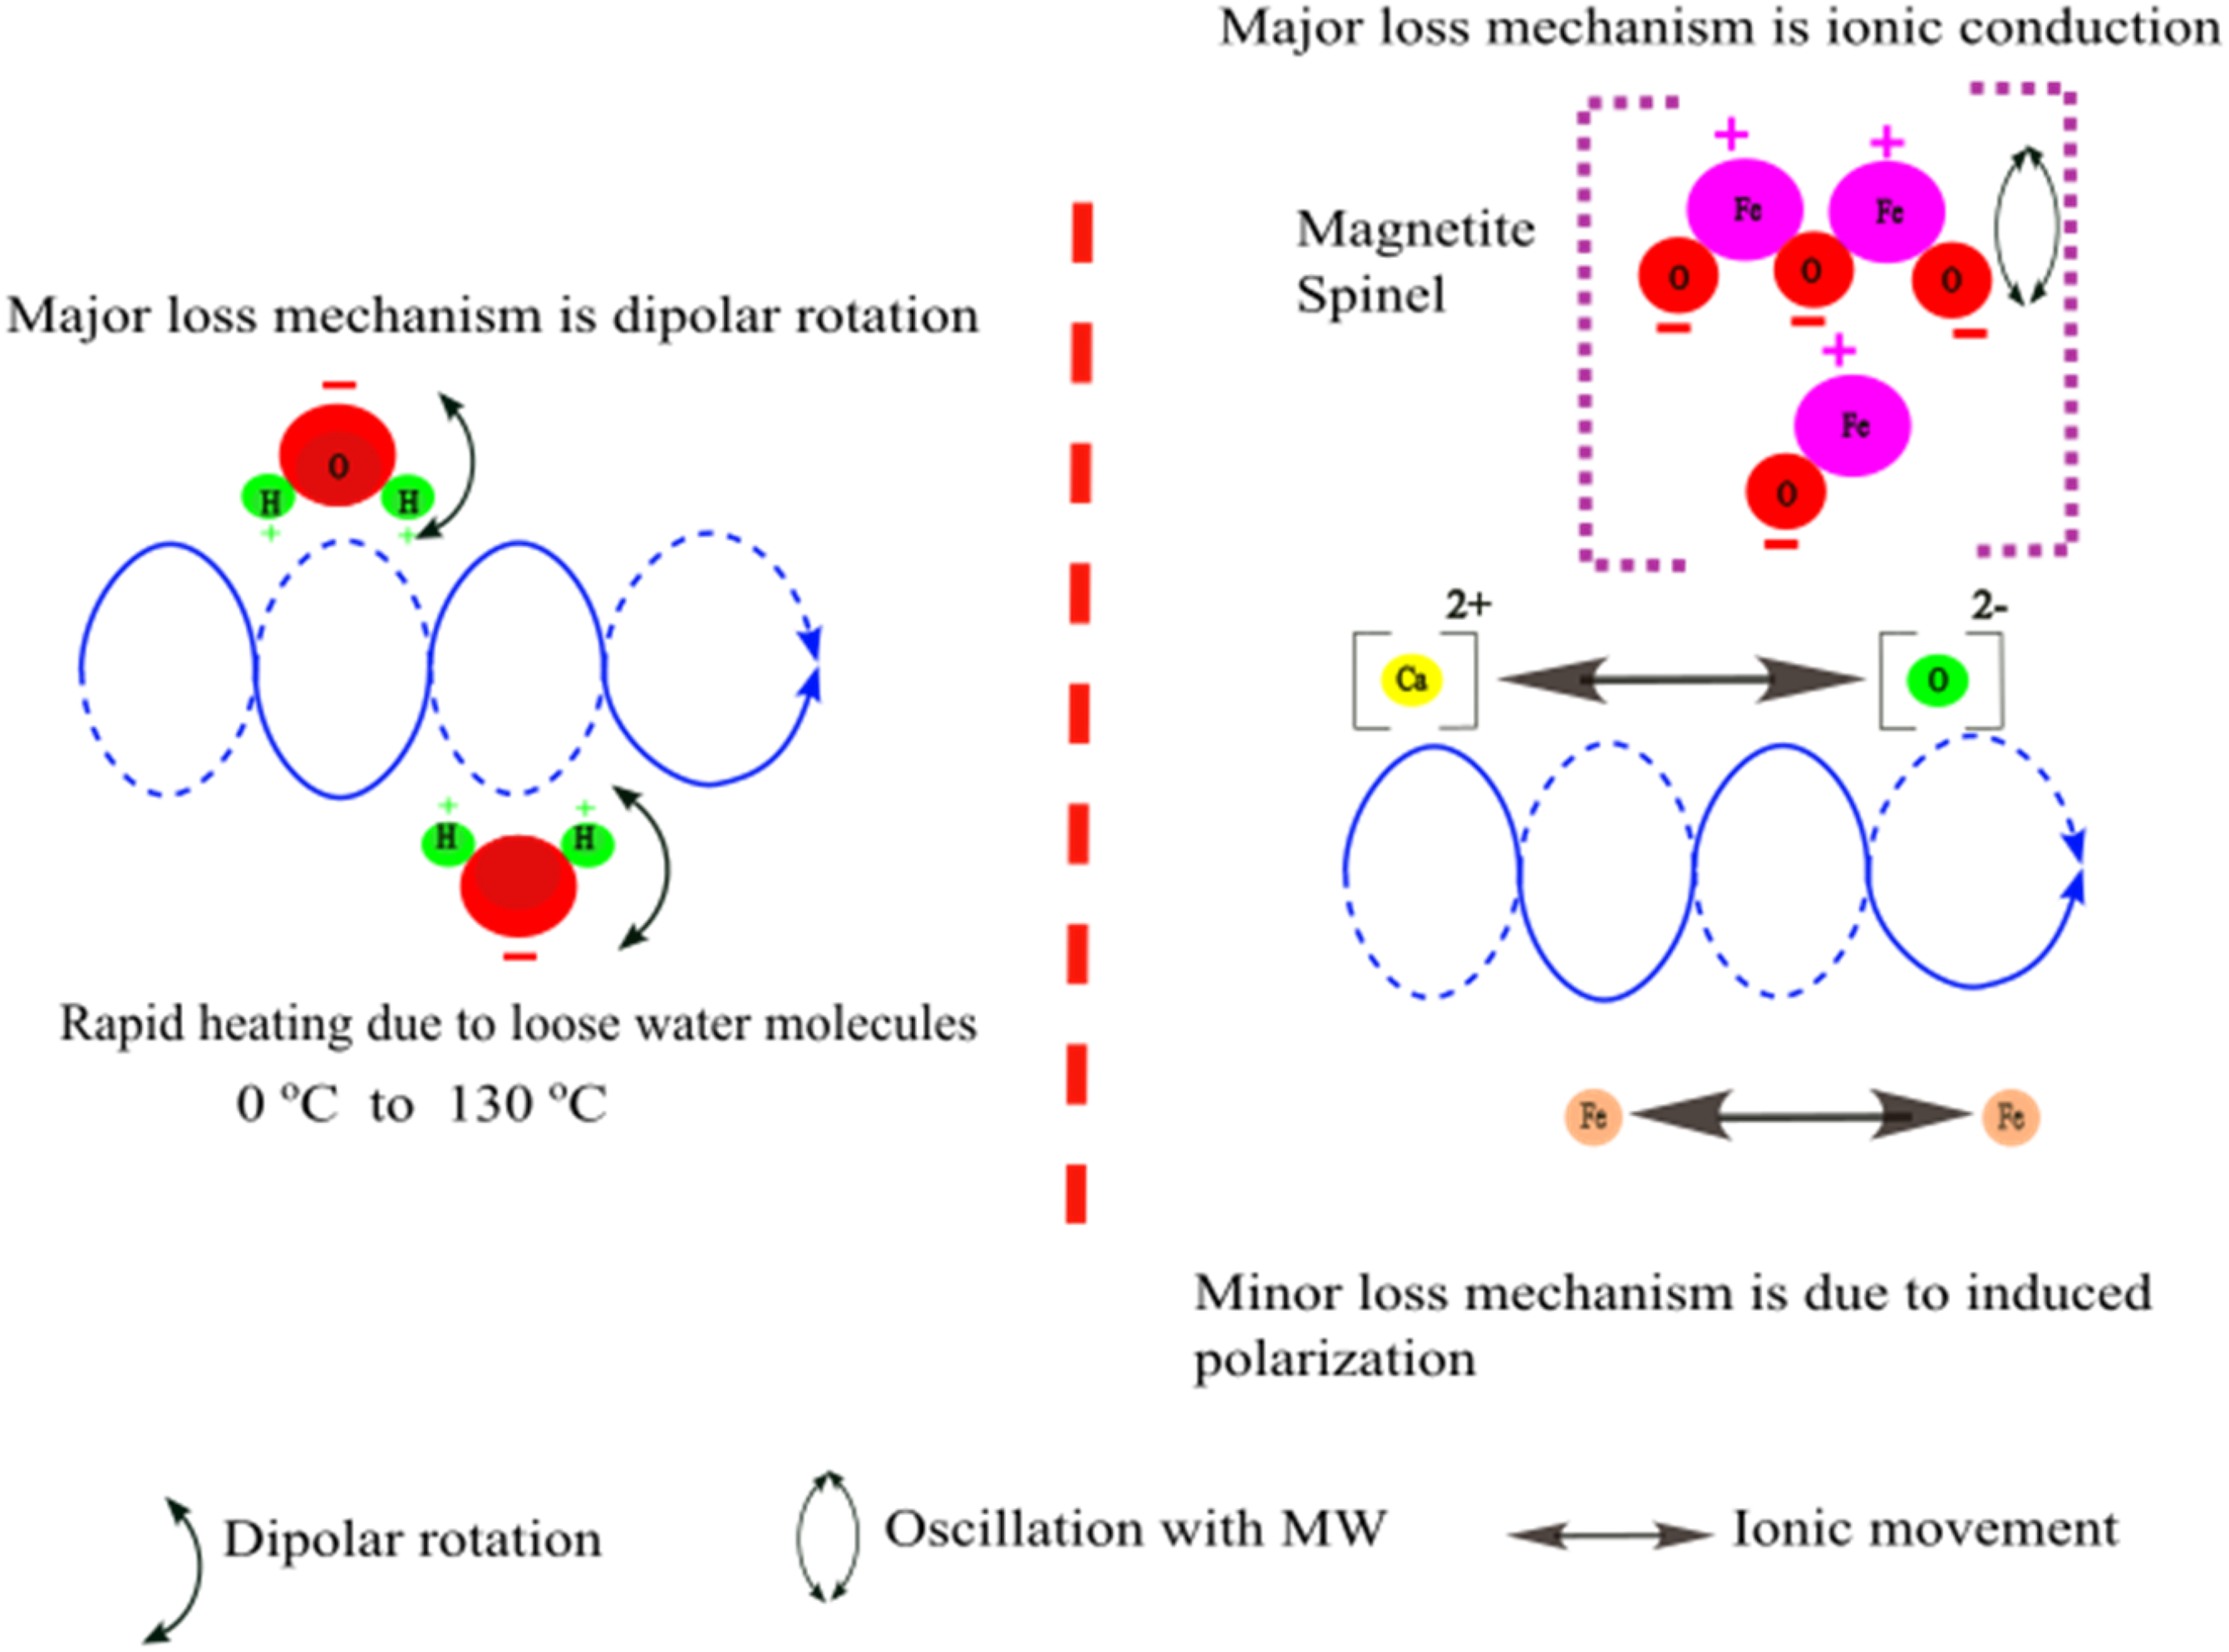
Microwave interaction with BOF sludge in different temperature ranges. BOF: basic oxygen furnace.
This mass gain is attributed to the oxidation of metallic iron to magnetite. The primary loss mechanism during this period is ionic conduction, driven by the presence of calcium oxide (CaO), and the iron ions within the magnetite spinel structure.
Conclusion
In this study the permittivities of different iron- and steelmaking by-products were investigated as a function of temperature and frequency. The main conclusions are:
In CRC dust, the main mineral phases include iron chromite, zincite, lime and periclase. The thermal analysis showed two main mass losses corresponding to dehydroxylation and calcination, with associated endothermic peaks. Analysis of the permittivity results show that the microwave heating mechanism shifts from dipolar rotation to ionic conduction at about 400 °C, resulting in initial rapid heating, followed by more moderate heating. The HPD results suggest that the heating would be uniform up to about 800 °C. In the EAFSS dust, the main mineral phases are franklinite, zincite and lime. The thermal analysis revealed dehydroxylation and calcination reactions, in addition to a little zinc evaporation occurring at about 900 °C. With dipolar rotation as the dominant loss mechanism, this would facilitate efficient and rapid heating under microwave radiation, especially at higher frequencies. However, the HPD shows slightly lower values at higher temperatures of about 900 °C and thus it would become more challenging to achieve uniform heating beyond this point. In BF sludge, a by-product of the BF, the main constituents are haematite, coke and lime. A significant mass loss occurs between 500 and 1000 °C, due to the reduction of haematite to metallic iron. The permittivities increase dramatically during the reduction process, owing to the formation of magnetite. The formation of magnetite enhances the induced polarisation at lower temperatures and ionic conduction in higher temperatures, while the formation of metallic iron increases conductivity. As a result, ionic conduction becomes the dominant loss mechanism at higher temperatures. This should lead to a rapid heating after 500 °C. However, the major challenge with BF sludge is the low HPD, which hinders uniform heating above 875 °C. The BOF slag is mainly composed of calcium-bearing phases, such as calcium carbonate, calcium hydroxide, calcium ferrite and calcium phosphate. The BOF slag showed the lowest permittivities among the materials tested owing to its poor microwave absorbing constituents. However, at high temperatures the permittivities increased due to sintering. The BOF slag has a high HPD up to 800 °C. These results indicate that even though BOF slag would heat slowly under microwaves, uniform heating could be maintained for large sample masses at higher temperatures. For the BOF sludge, the main mineral phase is magnetite, in addition to minor haematite and metallic iron, which resulted in high permittivities and this should lead to high microwave absorption and heating rates. The microwave heating mechanism of BOF sludge at elevated temperatures shifts from dipolar rotation to conduction due to the high concentration of metallic iron in the sludge. This material has a comparatively high HPD up to 1100 °C, indicating the potential for uniform heat generation. In summary, this study provided valuable data on the permittivities and microwave heating behaviours of various steelmaking by-products, and this data can be used for modelling and for designing large-scale microwave systems.
Supplemental Material
sj-docx-1-ist-10.1177_03019233251377246 - Supplemental material for Temperature and frequency dependencies of the permittivities of iron- and steelmaking by-products
Supplemental material, sj-docx-1-ist-10.1177_03019233251377246 for Temperature and frequency dependencies of the permittivities of iron- and steelmaking by-products by Danuka Maduranga Wawita Widanalage Don, Chris Pickles, Omid Marzoughi, Ron Hutcheon, Timo Fabritius, Eetu-Pekka Heikkinen and Mamdouh Omran in Ironmaking & Steelmaking
Footnotes
Acknowledgements
This work was funded by the Research Council of Finland (formerly Academy of Finland), grant number (349833). The authors are indebted to Microwave Properties North for their permittivity measurements. The authors thank Riku Mattila and Tommi Kokkonen for their technical support throughout this work. Furthermore, the authors are grateful to Outokumpu and Ovako-Imatra companies for providing raw materials for this work.
Declaration of conflicting interests
The authors declared no potential conflicts of interest with respect to the research, authorship and/or publication of this article.
Funding
The authors disclosed receipt of the following financial support for the research, authorship, and/or publication of this article: This work was supported by the Research Council of Finland (grant number 349833).
Supplemental material
Supplemental material for this article is available online.
References
Supplementary Material
Please find the following supplemental material available below.
For Open Access articles published under a Creative Commons License, all supplemental material carries the same license as the article it is associated with.
For non-Open Access articles published, all supplemental material carries a non-exclusive license, and permission requests for re-use of supplemental material or any part of supplemental material shall be sent directly to the copyright owner as specified in the copyright notice associated with the article.