
Abstract
The control of slag foaming is important for optimising basic oxygen furnace (BOF) performance. Acoustics systems monitoring wide frequency bandwidths have been applied to BOF monitoring for the purpose of understanding slag foam height and density but there is limited information about their accuracy and repeatability. Improved understanding of the fundamental behaviour of sound in slag foam could help resolve these issues. In this cold physical model study using, aqueous foams generated in a cylindrical vessel were used to study the attenuation of sound in large samples of foam. Sound pulses over the range of 201 to 1801 Hz were transmitted through varying aqueous foam heights of 100 to 250 mm and acoustic signals detected via a measurement microphone were analysed. The results indicated aqueous foams consisting of smaller bubbles in the range of 0.4 to 0.75 mm with visibly thicker outer films displayed a stronger correlation between the attenuated sound and the stationary foam heights. It was also observed that frequencies above 1009 Hz were more sensitive in terms of their attenuation in varying foam heights and the time-dependant drainage of bubbles compared to lower frequencies. These frequencies were generally higher than those used for industrial slag foam monitoring systems.
Introduction
Slag foaming in the basic oxygen furnace (BOF) is an important attribute in the process of oxygen steelmaking. The foamy texture of slag floating above the hot metal bath is essential for its role in increasing the surface area for chemical reactions, improvements in heat retention within the furnace and importantly, for being the media which accommodates the majority of the decarburisation reactions in the BOF.1,2 In the drive to optimise the BOF, increased slag foam production is often preferred to maximise the surface area available for chemical reactions taking place within the BOF furnace. However, the accurate control of slag foam height within the furnace is essential. The failure to control slag foam height results in ‘slopping’ due to the overflowing of the BOF vessel. Therefore, an optimum heat of the BOF would generate the maximum amount of slag foam promoting the high rates of decarburisation, improved energy efficiency, reduced carbon emissions, improved rate of production in the plant and better furnace lining life, while avoiding the overflowing of the BOF vessel. This has been a topic of significant research conducted using various approaches ranging from mathematical modelling to the utilisation of various direct and indirect sensors.3–15 Acoustic analysis has been an established method used for the control of slag foaming in the BOF since the 1970s. Its mechanism is based on the attenuation of sound generated largely due to the supersonic jet of oxygen blown into the metal bath via the lance.15–17 The technique relies on observing the intensity of low frequency, band filtered signals to predict slopping events. Another method for predicting slopping events is to use a minimum threshold level of the sound intensity, below which a slopping event is predicted.17,18 The predominant use of these sonic systems or any slag foam control system available is to warn the operator of an imminent slopping event and enable them to make process changes to avoid a ‘slop’ while maintaining the optimum amount of slag foam within the vessel. There are concerns about the repeatability and accuracy of existing systems. An extensive review on the existing acoustic systems for the control of slag foaming in the BOF was previously published by the authors. 19
An aqueous foam can be described as a multiphase material consisting of both liquid and gas. The existence of aqueous foams requires the presence of ‘surface-active elements’ also known as surfactants.20–23 The stability of foams depends on factors such as drainage due to gravity, coalescence of bubbles, diffusion of gases between bubbles due to Ostwald ripening and their rate of rupture.21,24,25 This makes aqueous foams of any composition very dynamic and difficult to control. Their shapes and sizes tend to evolve with time and are based on the amount of liquid on the surrounding films of individual bubbles. The liquid composition of the foam is generally denoted by a ratio between the composition of gas and liquid within the foam known as the void fraction. 24
Steelmaking foams may contain droplets of metals and entrained solids, many features of their behaviour can be understood by studying aqueous foams. The foaming of slags in the BOF occur mainly due to the decarburisation of metal droplets ejected into the slag foam due to the supersonic jet of top blown oxygen in the furnace. These reactions are known to produce smaller bubbles that increase the stability of the slag foam.4,26 Sulphur is a known surfactant and its presence in the slag increases the stability of the foam generated during the blowing process and influences the bubble size. 4 Experimental studies by Zhang and Fruehan 4 concluded that slag foams with smaller bubbles were more stable compared to foams with larger bubbles which agrees with existing literature on aqueous foams. Recent studies by Martinsson et al. investigated the effect of viscosity and bubble size of slag foams using laboratory experiments and concluded that lower viscosity slags produced smaller bubbles while higher viscosity slags produced larger ‘channel’ like bubbles. 27 These results agreed with the observations of Jung and Fruehan's work concluding that CaO–SiO2 slags do not foam without the addition of FeO due to the high viscosity that creates ‘channels’ of gases. 28 The time dependent slag chemistry can be influential in dictating the slag properties and characteristics of the slag foam in the BOF which makes the control of slag foaming a difficult task.
Acoustics of aqueous foams have been explored through controlled experiments based on small foam samples possessing high homogeneity.29–31 This will not be the case in a large BOF even with the exclusion of the top blown jet of oxygen. Studies on the acoustics of aqueous foams showed that the level of attenuation of the acoustic signal depended on the frequency, bubble size and the void fraction of the foam.29–33 Speed of sound in aqueous foams was said to be much lower than the speed of sound in air. Studies done by Pierre et al. concluded that the speed of sound in aqueous foams varied between Wood's model predictions of 30 m/s to around 220 m/s and was dependent on aqueous foam characteristics. 29
The present study is focused on understanding the fundamental behaviour of sound propagation through aqueous foam heights and the effect of bubble size and frequency. This study was conducted based on a cold-water model as a controlled means of observing the interaction of sound through aqueous foam. The study does not intend to replicate slag foaming in the BOF, but use detergent generated aqueous foams for understanding the fundamentals of acoustic attenuation which would relate to a BOF. Slag foam configurations within the BOF vessel would be transient dependent on the slag property changes dictated by the transient chemical composition during the blow and other mechanical factors such as the lance position. The effect of foam configurations was studied based on two distinct bubble size distributions. This work investigated if the current acoustic monitoring systems could be enhanced through selection of specific frequencies that might provide a more accurate and reliable measure of slag foam throughout the BOF oxygen blowing process.
Experimental methodology
Two configurations of aqueous foams differentiated by their average bubble size were investigated using a cylindrical vessel. A wireless speaker was positioned at the interface of the water and aqueous foam to generate sound through the foam. This was to understand the attenuation of sound through the increasing foam height. The experiment served as a controlled method of understanding the attenuation of sound generated by the BOF lance through increasing slag foam heights during the blowing process. A series of acoustic frequency pulses within the bandwidths used for industrial monitoring systems discussed in previous literature and beyond were tested.16,19 The results were analysed and used to understand the effect of frequency, bubble size and change in foam height on the attenuation of the signal.
Set up of cold model rig
A cylindrical vessel made up of 10 mm thick acrylic with a diameter of 300 mm and height of 770 mm was used with a ¼ inch BSP screw outlet tapped on its base. Figure 1 shows an image of the experimental setup with a foam height generated. A clamp was used to position the measurement microphone perpendicular to the vessel at a height of 550 mm and remained constant for all experiments. A compressed air flow was connected to a pressure regulator and to a flow meter which was later connected to the screw outlet on the bottom of the vessel using a BSP fitting. A measurement ruler was attached to the side of the cylinder to mark the heights of aqueous foam used and to measure the average bubble sizes used in the experiments via image analysis.
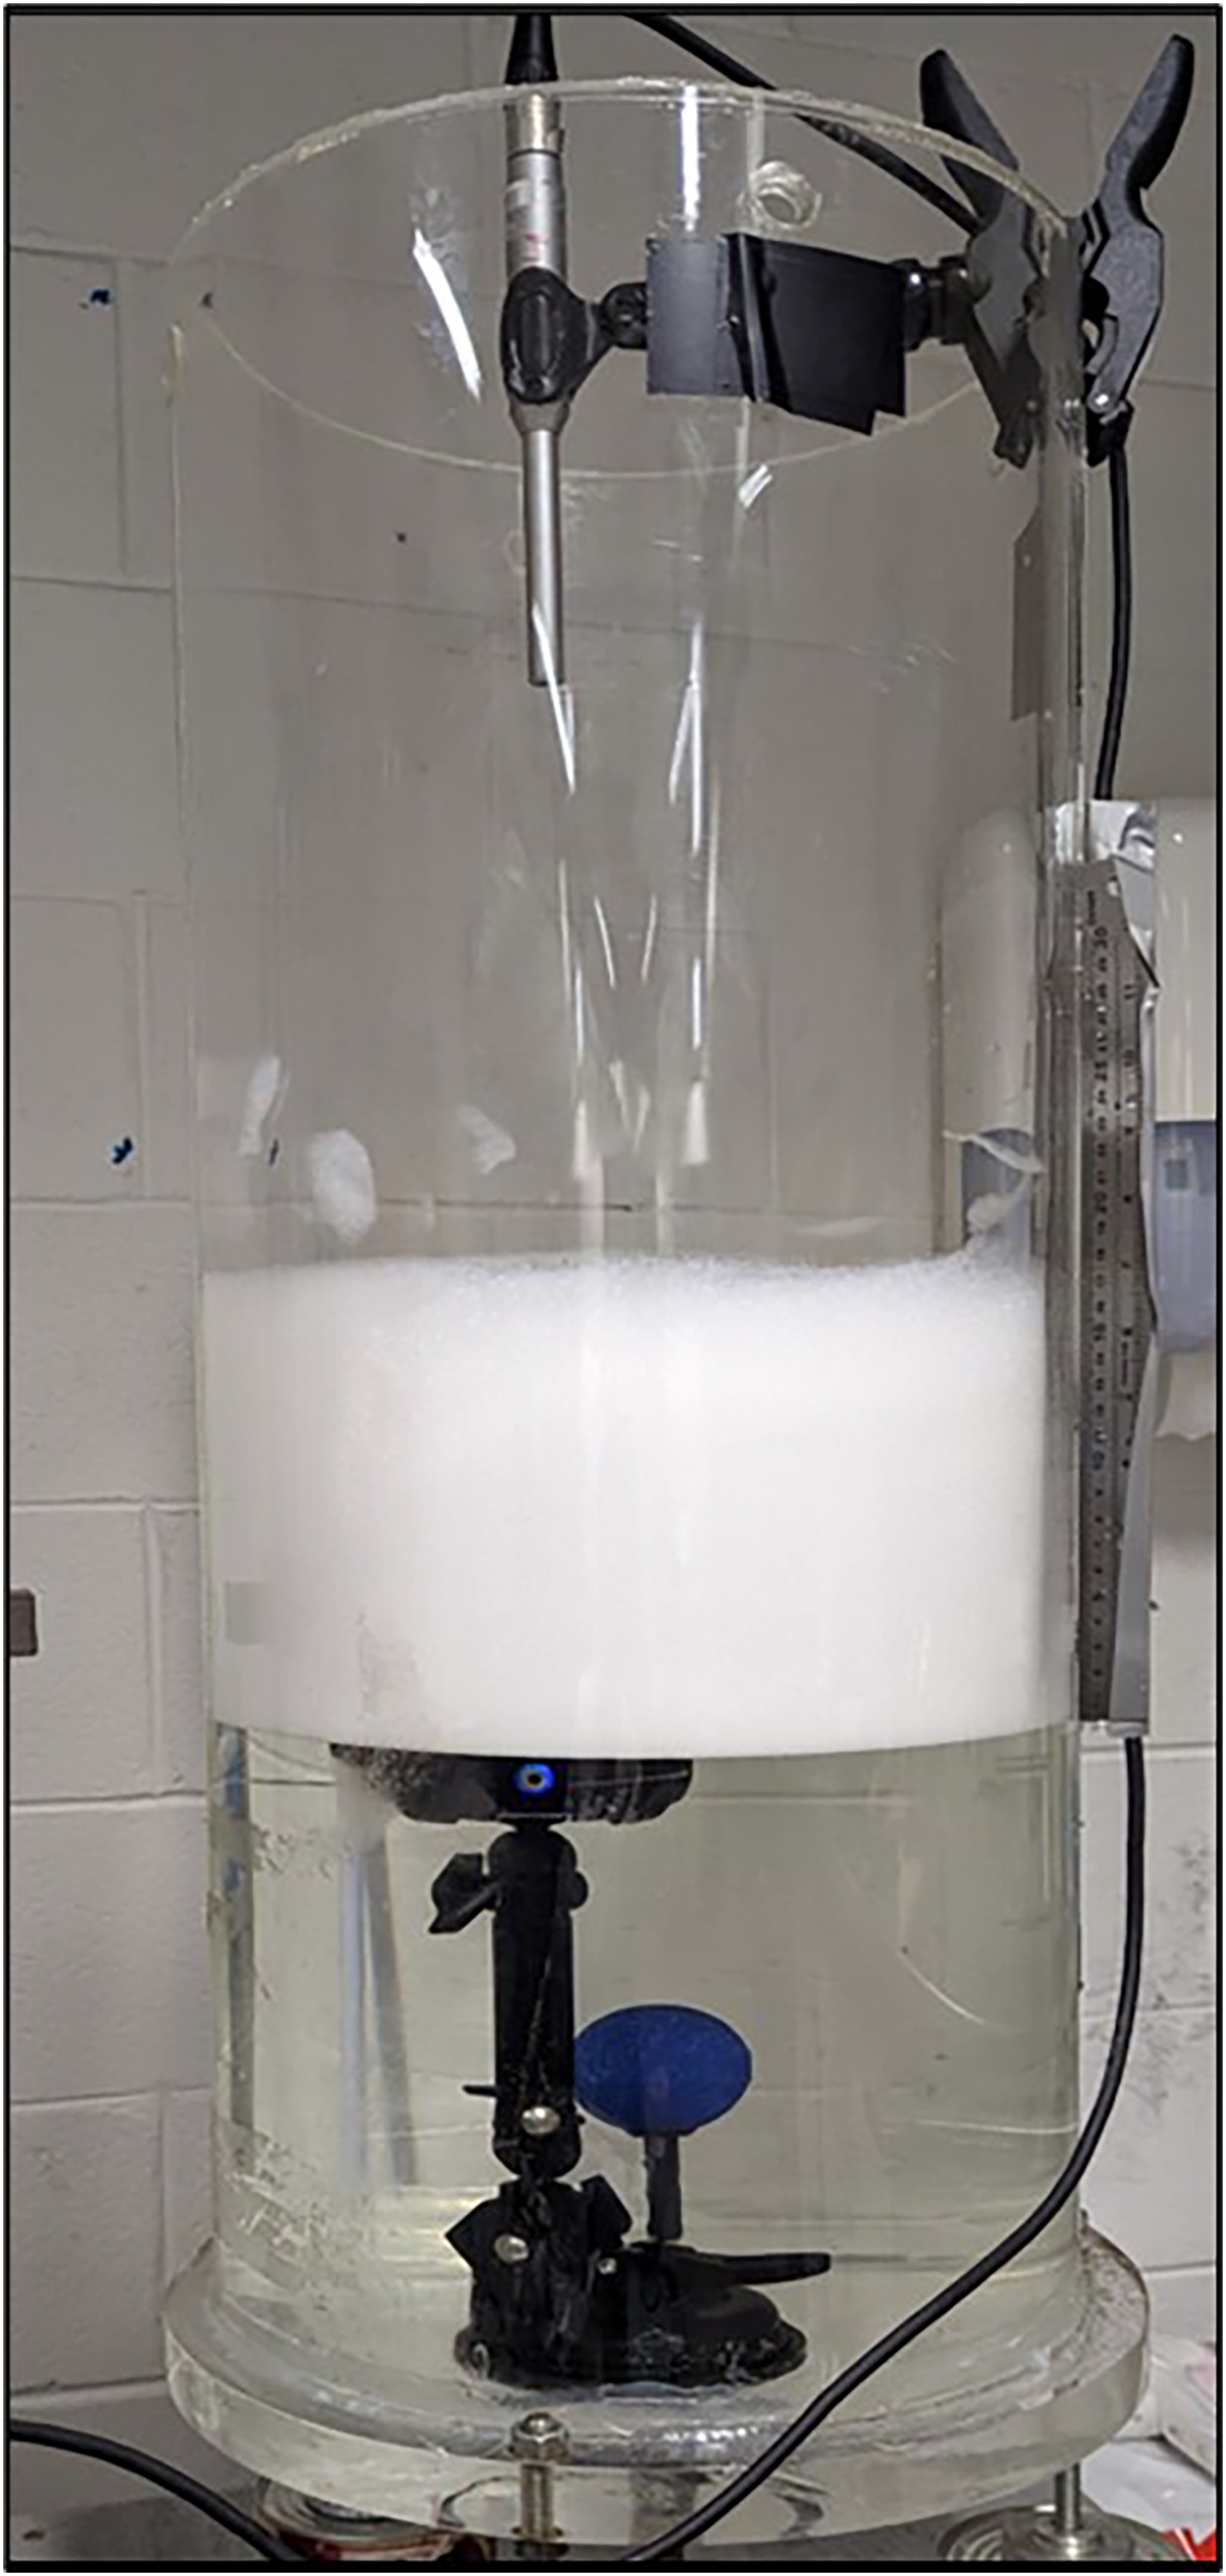
Experimental rig used for the study with a foam generated.
The microphone used for the experiments was a Behringer ECM8000. It was important to use a measurement microphone with relatively flat frequency response when demonstrating experiments using acoustics. The microphone had a frequency response range of 15 Hz to 20 kHz, sensitivity of 15 mV/Pa and operates with phantom power of +15 to +48 V. An IPX8 rated waterproof Bluetooth speaker was used which had a diameter and a height of 90 mm and 52 mm, respectively. The speaker had a frequency response of 100 Hz to 20 kHz and an output power of 5 W. The speaker was fixed onto the bottom surface of the vessel using a standard mount with a suction cup on one end and a ¼ inch screw on the other. It was at a height of 200 mm above the base of the cylinder. A Casella CEL-120/1 acoustic calibrator was used to produce a 1 kHz test signal in both 94 and 114 decibels sound pressure level (dB SPL). A PreSonus Studio 1824 audio interface was used for the digital conversion of the audio signal. The audio interface could handle multiple microphone inputs and provided a phantom power of 48 V. It had a conversion resolution of 24 bits and sampling rates of 44.1, 48, 88.2, 96, 176.4 and 192 kHz. The Bluetooth speaker and the audio interface were both connected to a HP Spectre x360 laptop with a core–i7 7th generation processor, 16 GB of RAM and had the operational software Windows 10 home edition. A Quest SoundPro class 1 sound level meter was used for cross checking readings and obtaining background noise levels during the selection of appropriate locations for the experiments to be conducted.
A selection of two orifice fittings were used for generating the two different configurations of foam with different ranges of bubble sizes. The small bubble configurations were created using a commercially available air stone used for aquariums. The air stone was spherical shaped with a diameter of 50 mm. The air stone generated a bubble configuration within a range of 0.4 to 0.75 mm. The large bubble configurations were created using a custom-built bubbler. The custom-made fitting had two parts: an air distribution open top cube and a top surface with an array of equivalent punched holes. The open top cube of 25 × 25 × 25 mm was 3D printed with its bottom surface having a 10-mm diameter opening connected to a screw fitting that could be fixed at the bottom surface of the vessel. The top surface 3 mm thick acrylic sheet had an array of 12 × 12 holes, each with a diameter of 1.5 mm, and laser cut onto the sheet. The diameter range for the large bubble distribution was 3 to 8 mm which was significantly larger than the air stone described earlier and provided a definite contrast to allow assessment of the effect of bubble size. Figure 2 displays an image of the two fittings used for the generation of foam.
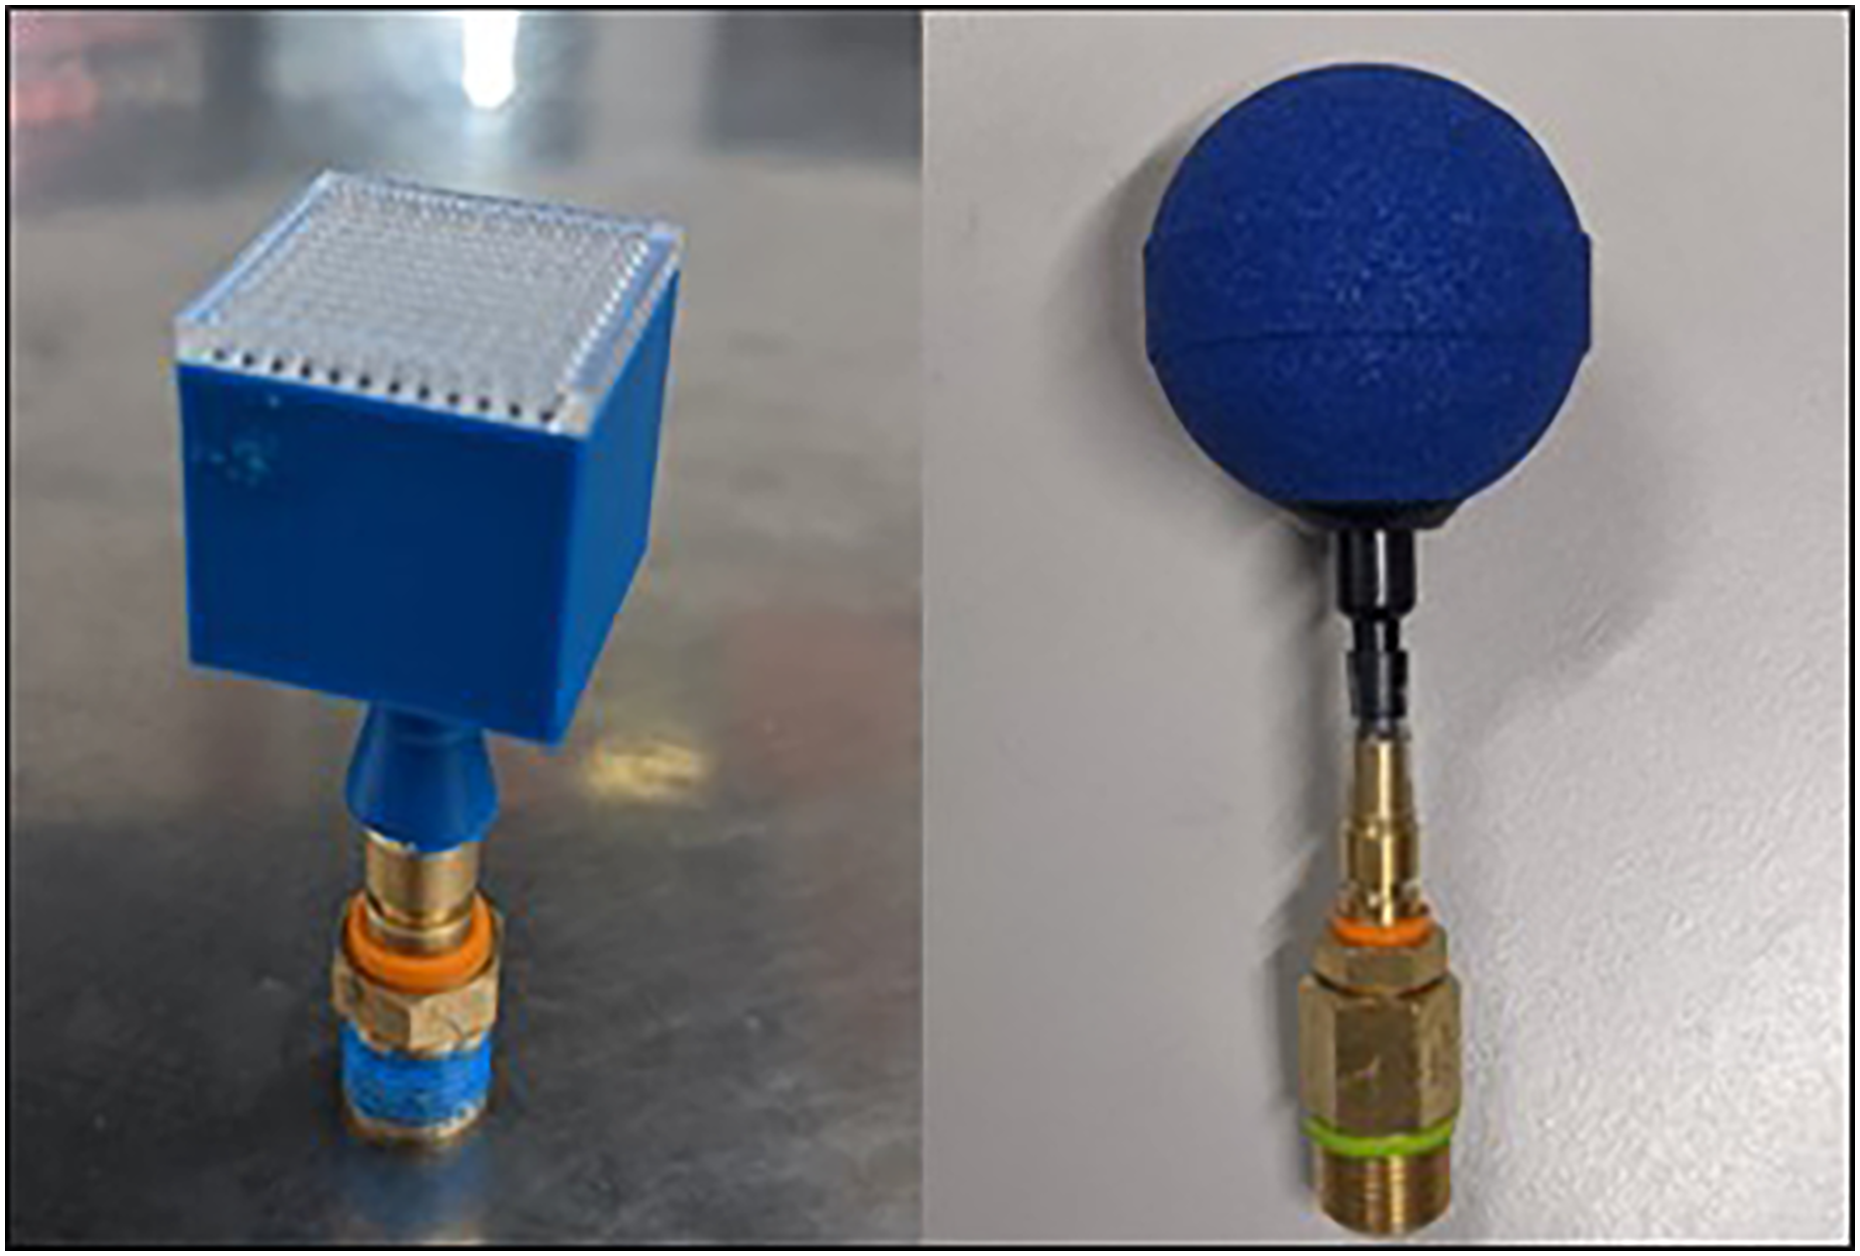
Fitting used for large bubble configuration (left) and small bubble configurations (right).
Once the experimental rig was set up, the vessel was filled with water to create the medium for foam to be generated. An ideal height for water in the vessel was found to be 235 mm where the speaker's diaphragm did not have water above it. After the vessel was filled with water a fixed volume of a surfactant solution was added. The surfactant used was household grade detergent liquid. The large bubble foaming required 50 mL of the surfactant, while the small bubble configurations used 30 mL. Once the surfactant was added to the water, compressed gas was passed through the respective bubbler fitting at a fixed pressure of 2 bar. The flow rate of compressed air for the small bubbles was 4 litres per minute (L/min) while the flow rate for the larger bubbles was 5 L/min. A higher flow rate was required to achieve an even foam distribution for larger bubbles. Once the foam reached the desired height, the air flow was shut off and a round shaped synthetic sponge was used to carefully take out excess foam and create an even top surface of the foam corresponding to a specific height above the speaker. This was completed within 35 s to ensure all experiments were conducted at a fixed age of the generated foam. Experiments were performed for five foam heights of 0, 100, 150, 200 and 250 mm. There were practical limitations on the range of foam heights used for the experiments. The high instability of the larger bubble configurations restricted the foam height at 250 mm.
Sound generation, acquisition and analysis procedure
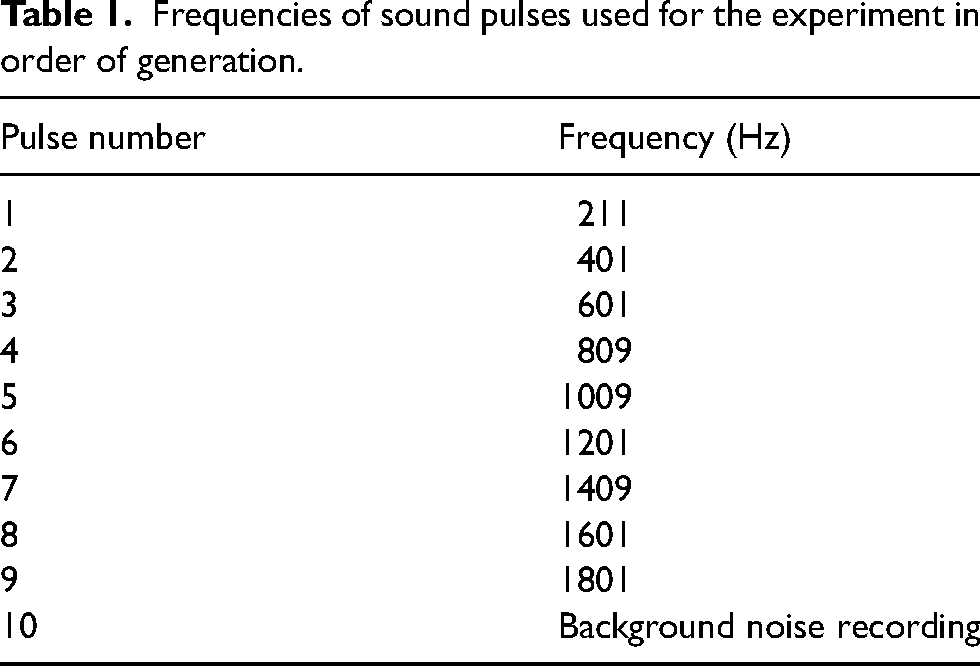
The next step following the establishment of the foam was to generate sound pulses to be recorded. Before the sound pulses were generated, the microphone was calibrated using an external calibrator. The external calibrator was connected to the measurement microphone as shown in Figure 3 and switched on to produce a 1-kHz tone at 114 dB SPL. This was done while the microphone was connected to the sound card and custom MATLAB code which computed a calibration factor that was used during signal analysis to scale the data acquired in the experiment. Thereafter, 1-s pulses of pure sine waves of specific frequencies listed in Table 1 were generated with a 1-s delay between pulses using custom MATLAB code. The series of pulses were generated with a sample rate of 44.1 kHz and 16 bits in a single channel. Simultaneously, the generated sound pulses were recorded using the same MATLAB code in the .WAV file format. The frequencies used were all prime values to factor in the presence of harmonics. The recording of sound was repeated five consecutive times using each sample of foam generated with a specific height. The experiments were repeated for the same foam height after emptying, drying the vessel, and repeating the procedure discussed.
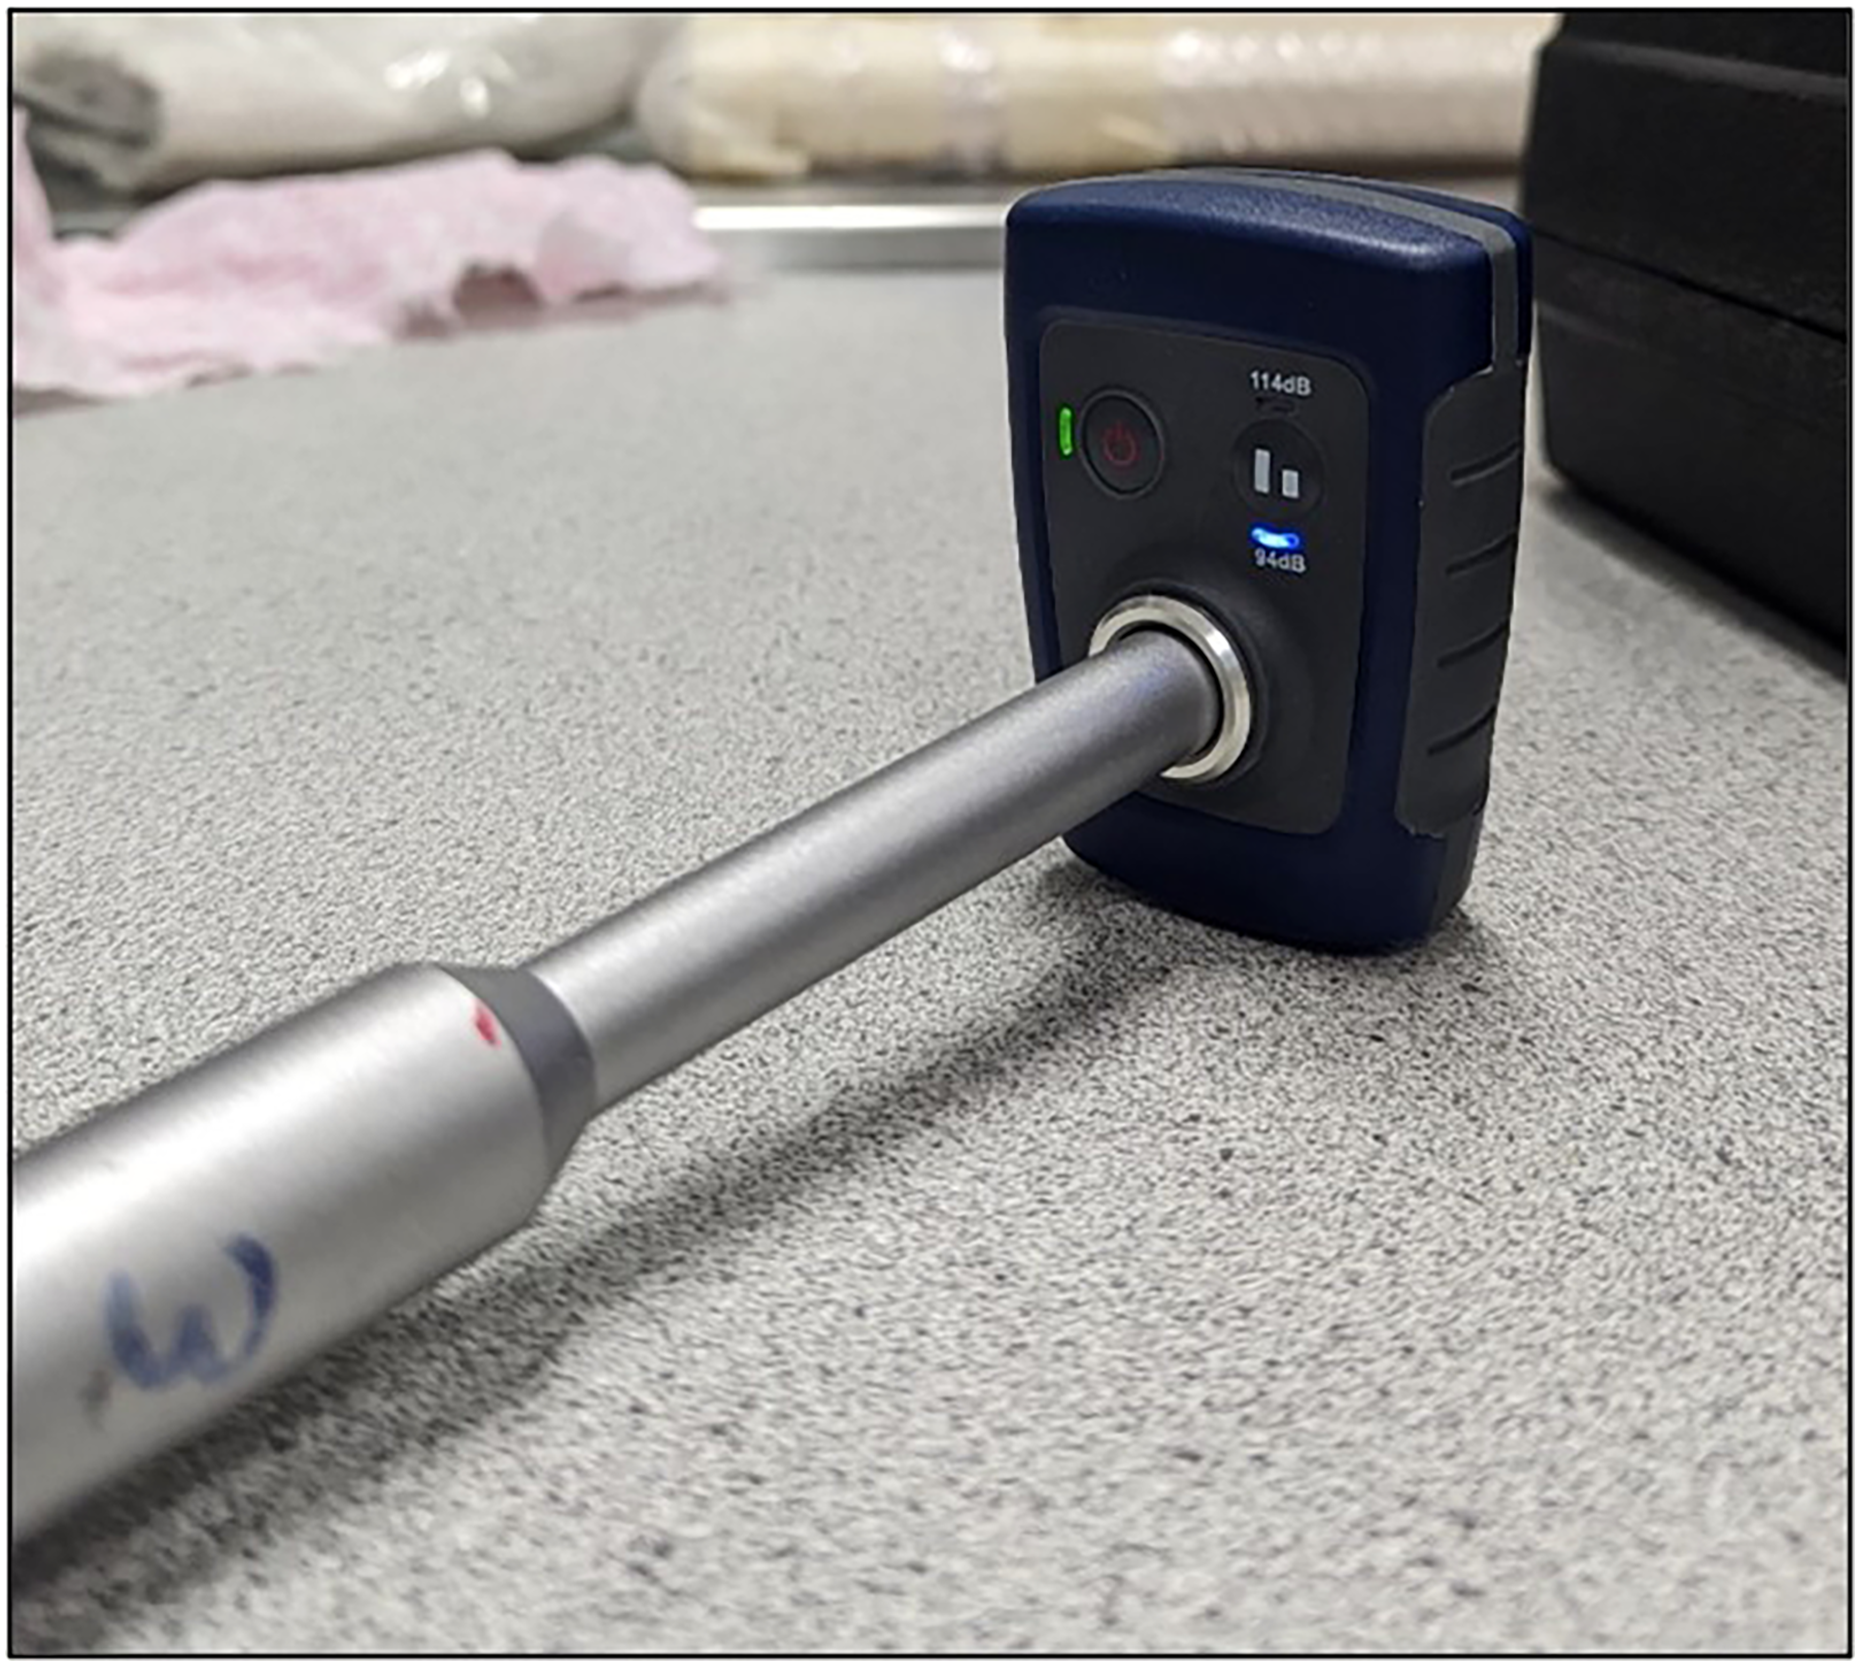
Image of the measurement microphone seated inside the acoustic calibrator.
Frequencies of sound pulses used for the experiment in order of generation.
The recorded signal was split into the respective frequency pulses in the time domain using custom MATLAB code, instead of using the entire recording of all pulses. Pulses were split into 0.5 s segments of the original 1 s pulses skewed away from start of the pulse to avoid any possible acoustic transients by the speaker produced during the initial burst of sound. A visual plot of the signal in the time domain was accessed individually to ensure the split segment was not influenced by external noise. The split signals were later pre-processed using a 1024 size Hanning window and fast Fourier transform (FFT) analysis was performed using the same MATLAB code. All frequencies studied were well ahead of the minimum frequency, thus, providing high frequency resolution. The FFT amplitude axis was converted to dB SPL format using the calibration factor computed prior to each set of experiments. The FFT spectrum in the dB SPL scale was plotted and the peak amplitudes were recorded for each respective frequency. The analysis was repeated for all experimental data acquired in each experiment. Figure 4 shows a snapshot of the FFT spectrum subplots of all frequency pulses in a single experiment with 0 mm foam height. An average of the peak amplitude for each experiment was computed from the five repeated trials. Three sets of independent experiments for each foam height were performed as described above.
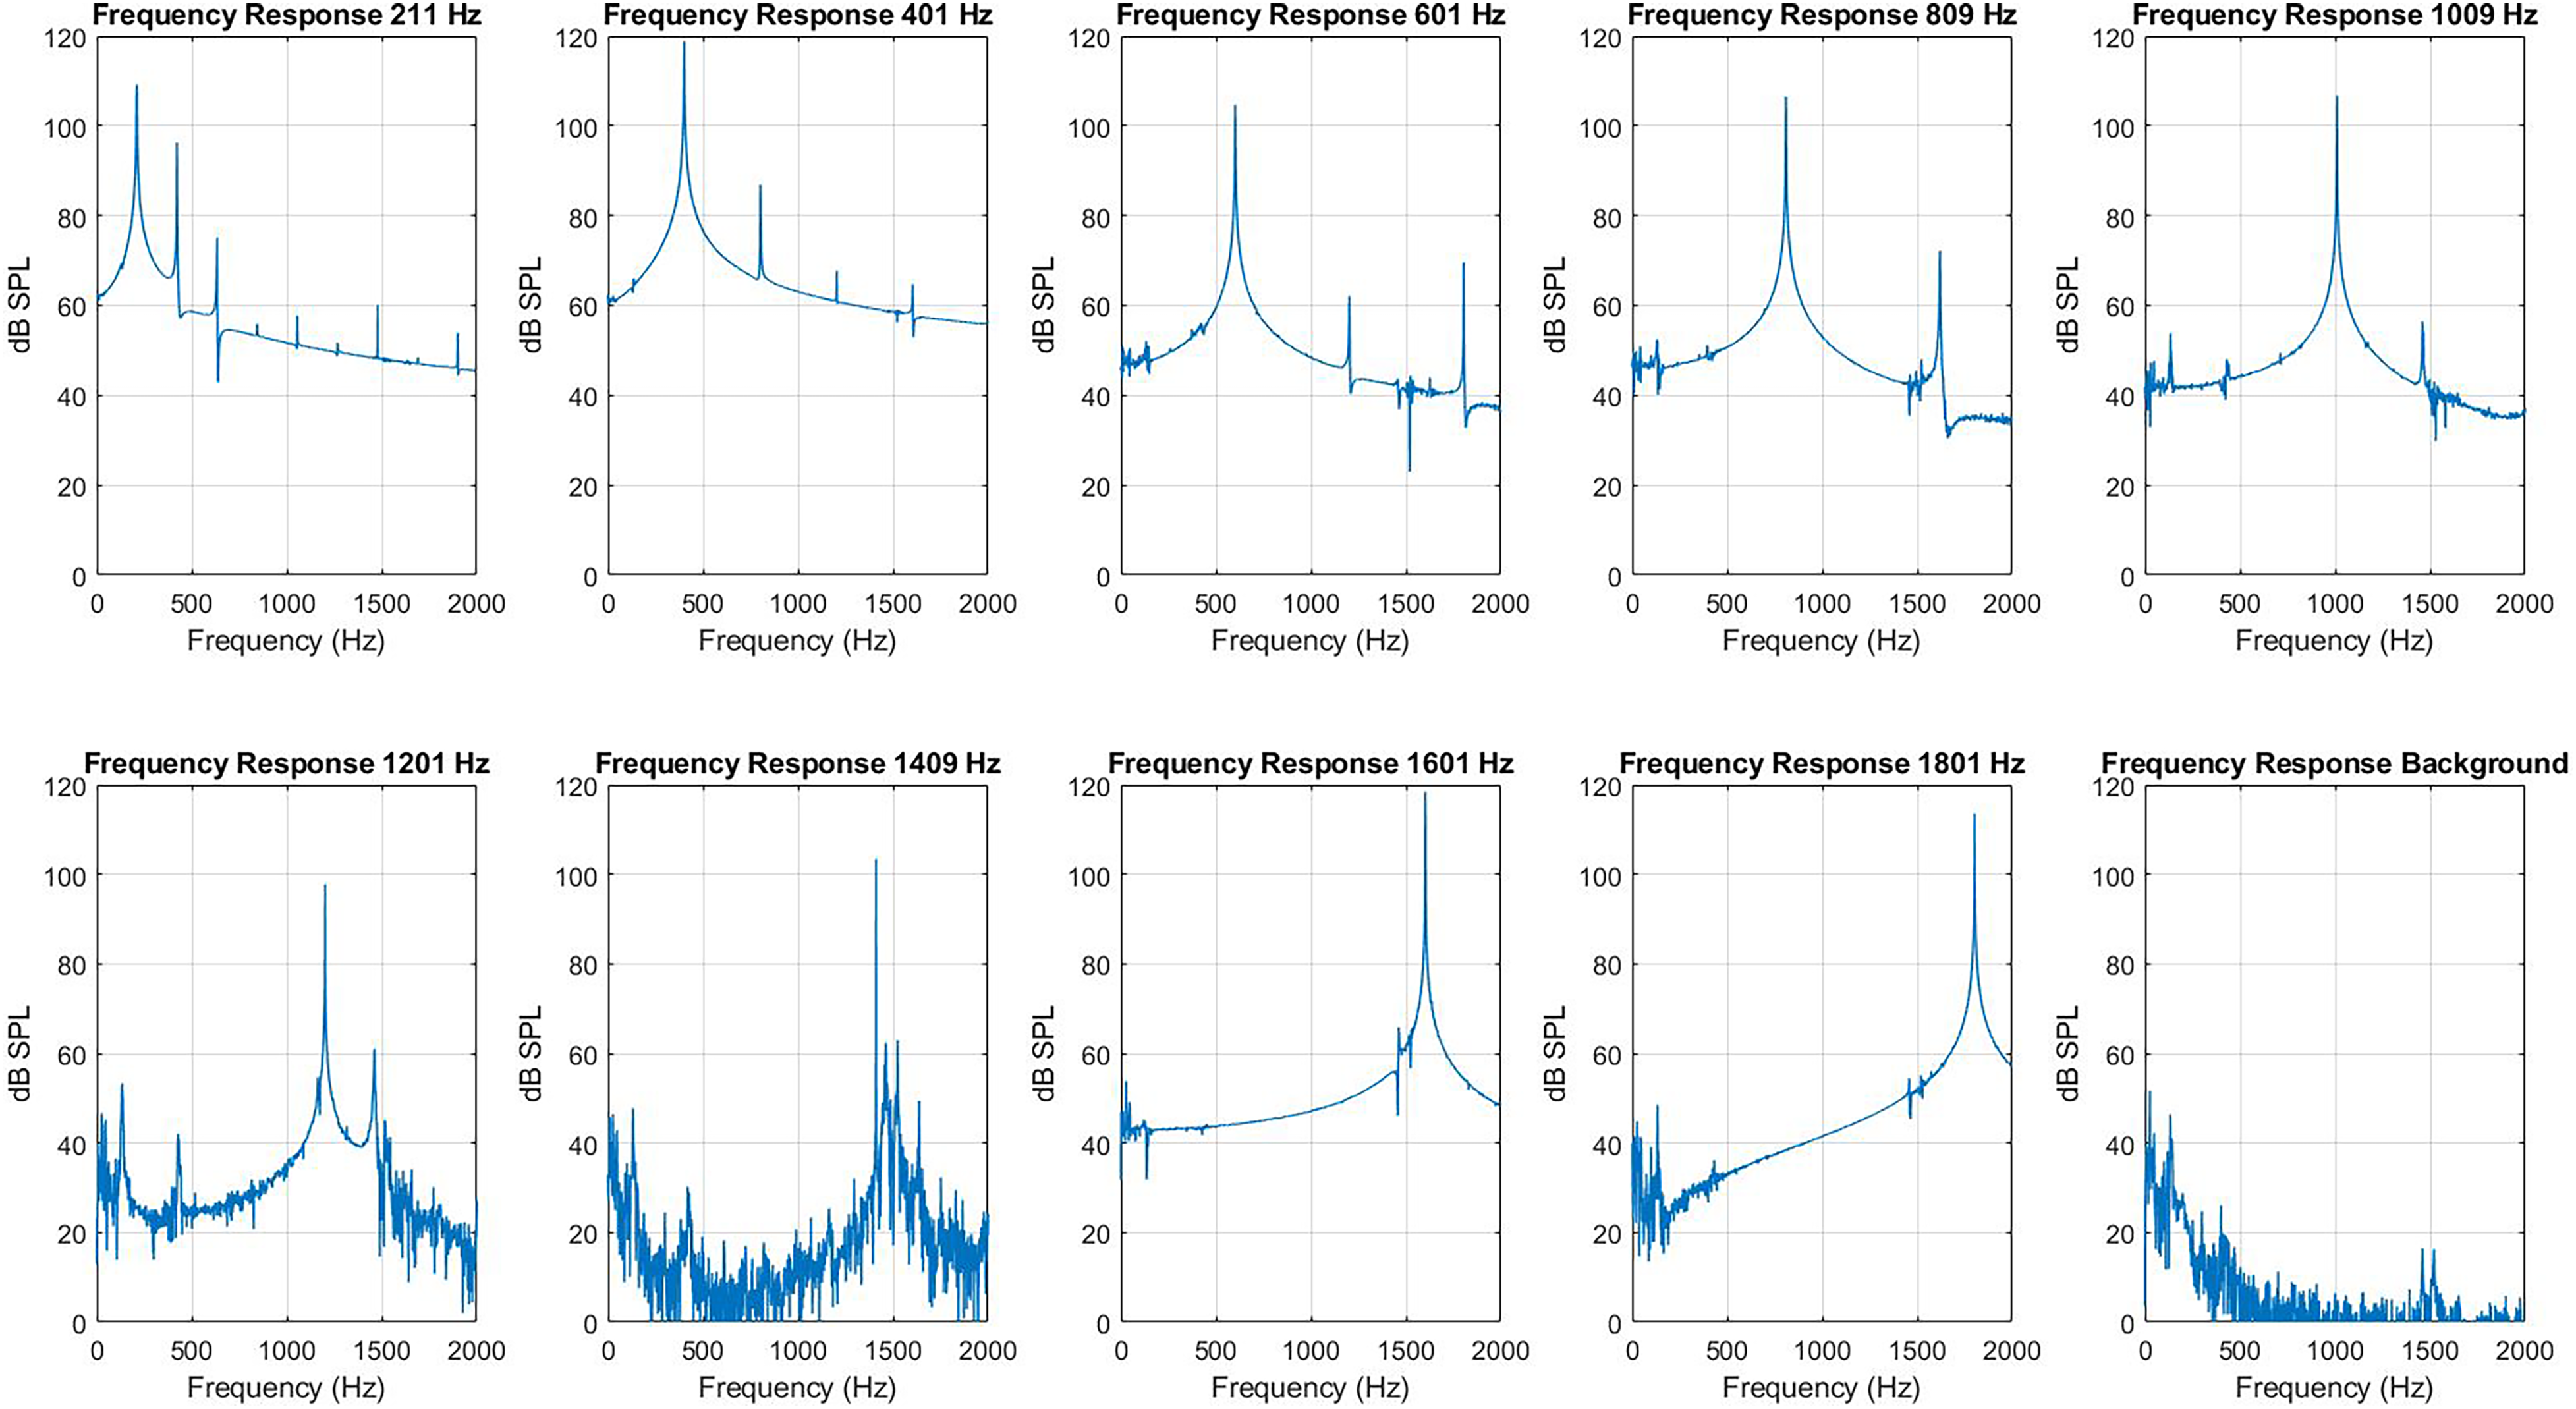
Acoustic frequency response to sounds played through a submersed speaker in the cold model rig. Data shown is for a zero-foam height and for sounds played through the speaker between 211 and 1801 Hz. Also shown at bottom left is a recording of the background.
Bubble size distribution
The average bubble sizes for the aqueous foam samples generated for the experiments were calculated using an image analysis approach, noting that the images captured were the bubbles attached to the walls of the acrylic cylinder used for the experiments. The software ImageJ was used to obtain size distributions. Figure 5 displays two images obtained for the small and large bubble configurations (not to scale). Extraction of a localised sample of the foam would require multiple samples from different heights of the foam, which was difficult to accomplish practically, especially obtaining samples towards the bottom of the sample. This made it impossible to obtain a sample that could be dispersed in a surfactant solution to obtain a monolayer of the bubbles to have an accurate measurement of the bubble distribution as done in studies on much smaller samples of foam.29,32,34 It should be acknowledged that the images obtained from the vessel wall were not an accurate representation of the bubble size distribution of the entire foam. However, it should be highlighted that the motive behind the study was to observe and study the behaviour of sound through aqueous foam of two discernible foam configurations based on their difference in bubbles sizes. This was executed in the study by the distinct difference in the average bubble sizes used. The images were individually transformed to 8-bit images, picture settings adjusted, and a threshold applied. The most detailed sections of the image were cropped and used for the measurements of the bubble diameters.
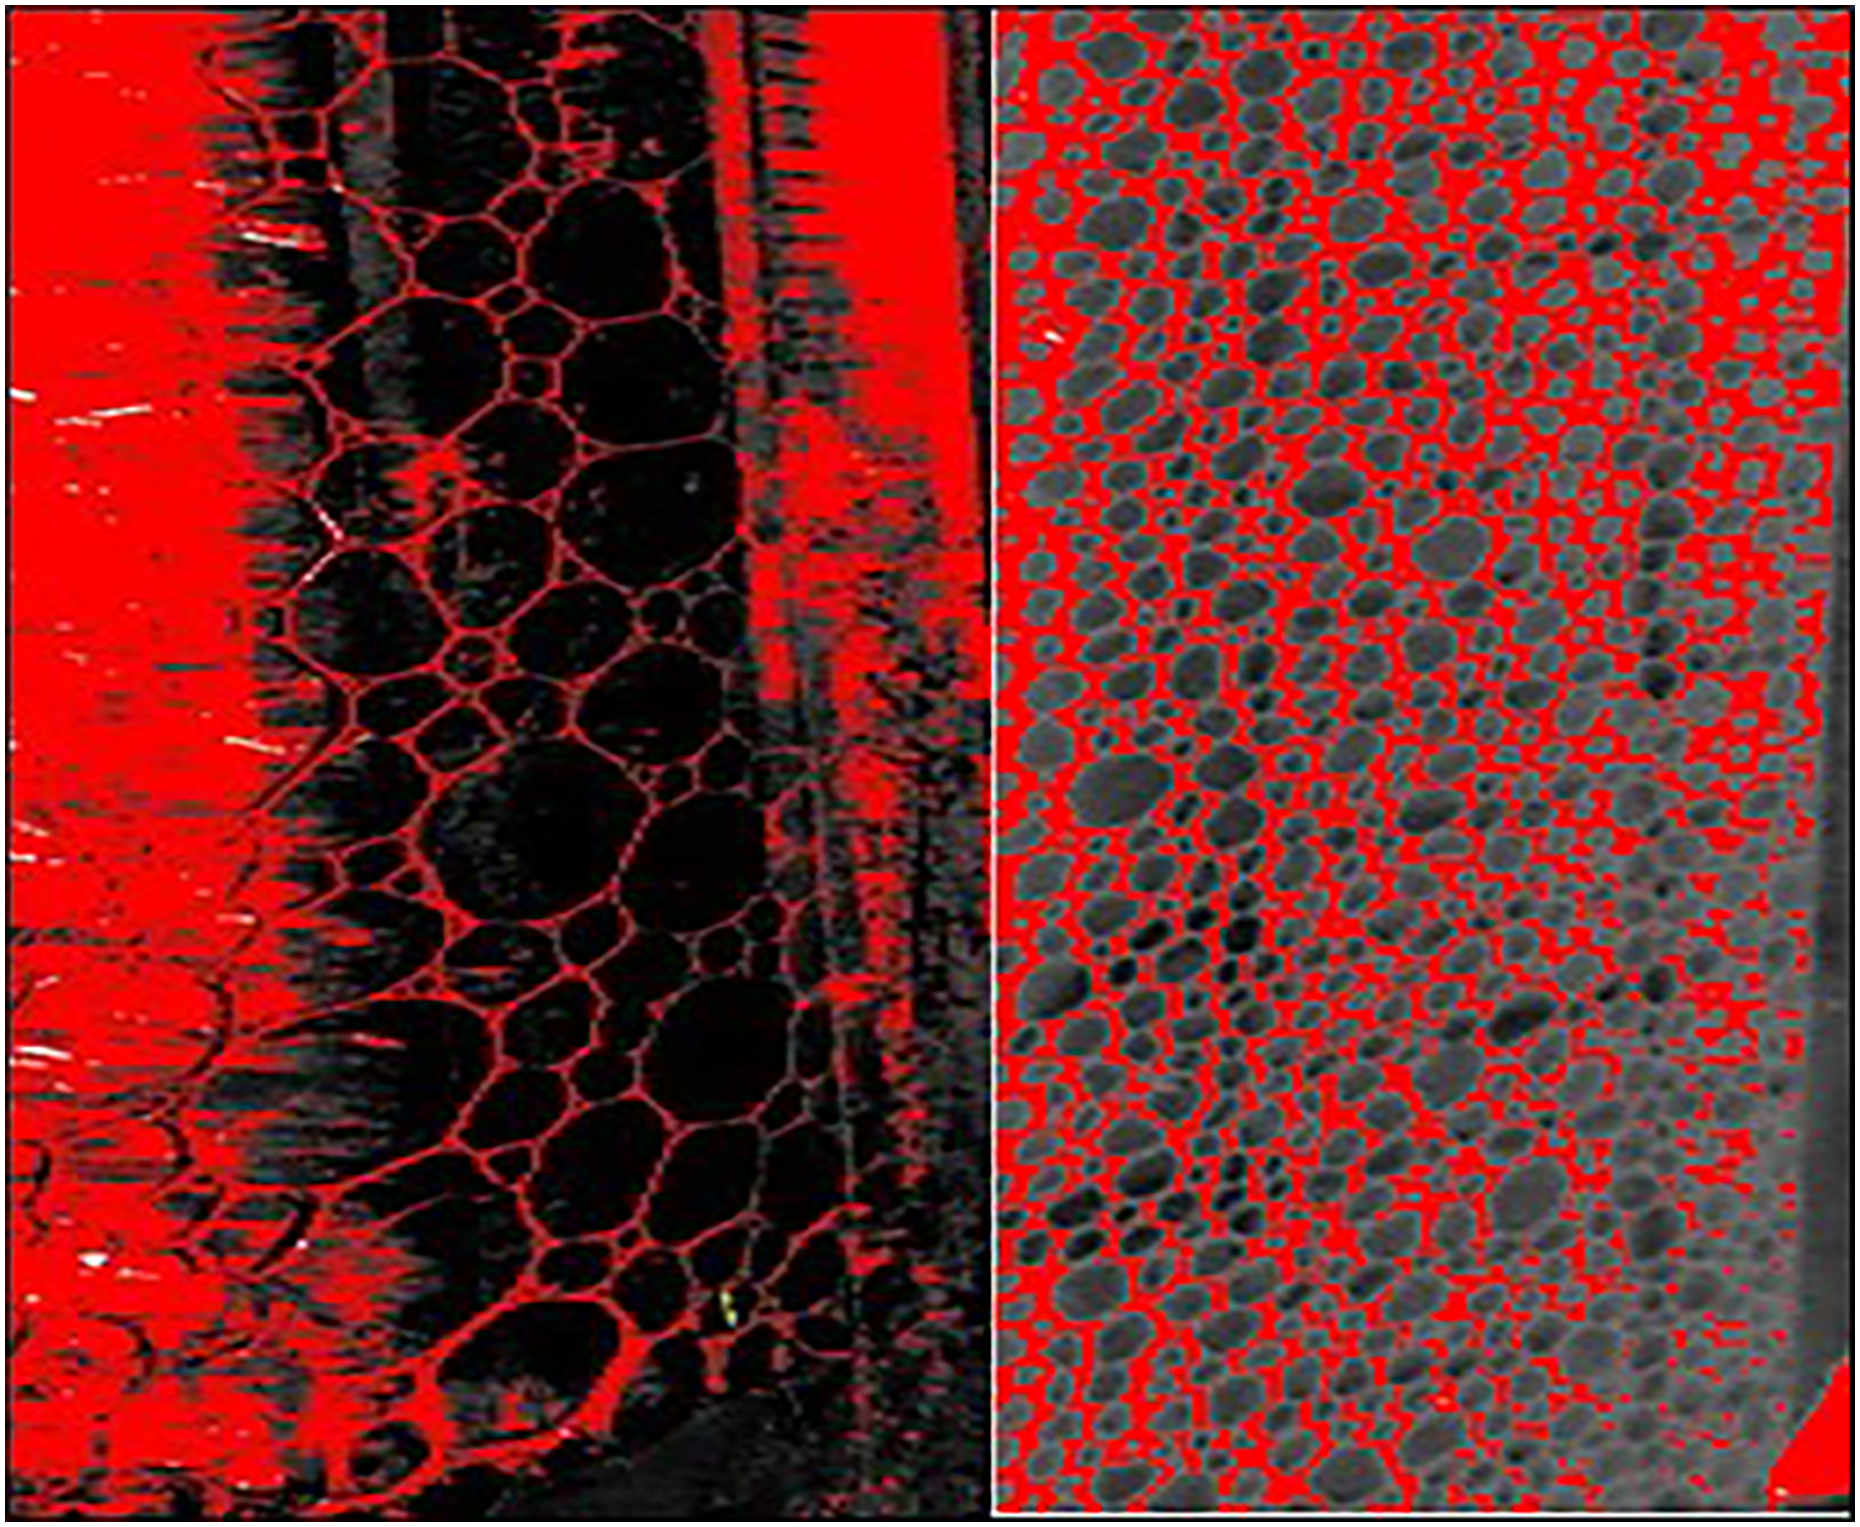
Images of the large bubble configuration (left) and small bubble configuration (right) used for image analysis. Red overlay is from the thresholding function applied to highlight bubble structures.
Results
Acoustic signal detected as a function of foam height
The average peak amplitudes of the respective frequencies for each independent experiment were plotted against the foam height for the relevant bubble configurations. Four of the tested frequencies of 401, 1009, 1601 and 1801 Hz are represented in Figures 6 to 9. The sound amplitude reduced in a linear manner with increasing foam heights. A regression analysis was performed for the trendlines plotted to quantify the degree of deviation from the linear behaviour. The repeatability of the experiments was frequency dependent, the 1601 and 1801 Hz signal tested with 25 cm of small bubble configuration foam showed a percentage difference of 2.6% and 16.9%, respectively, between the lowest and highest measurements of the three independent experiments.
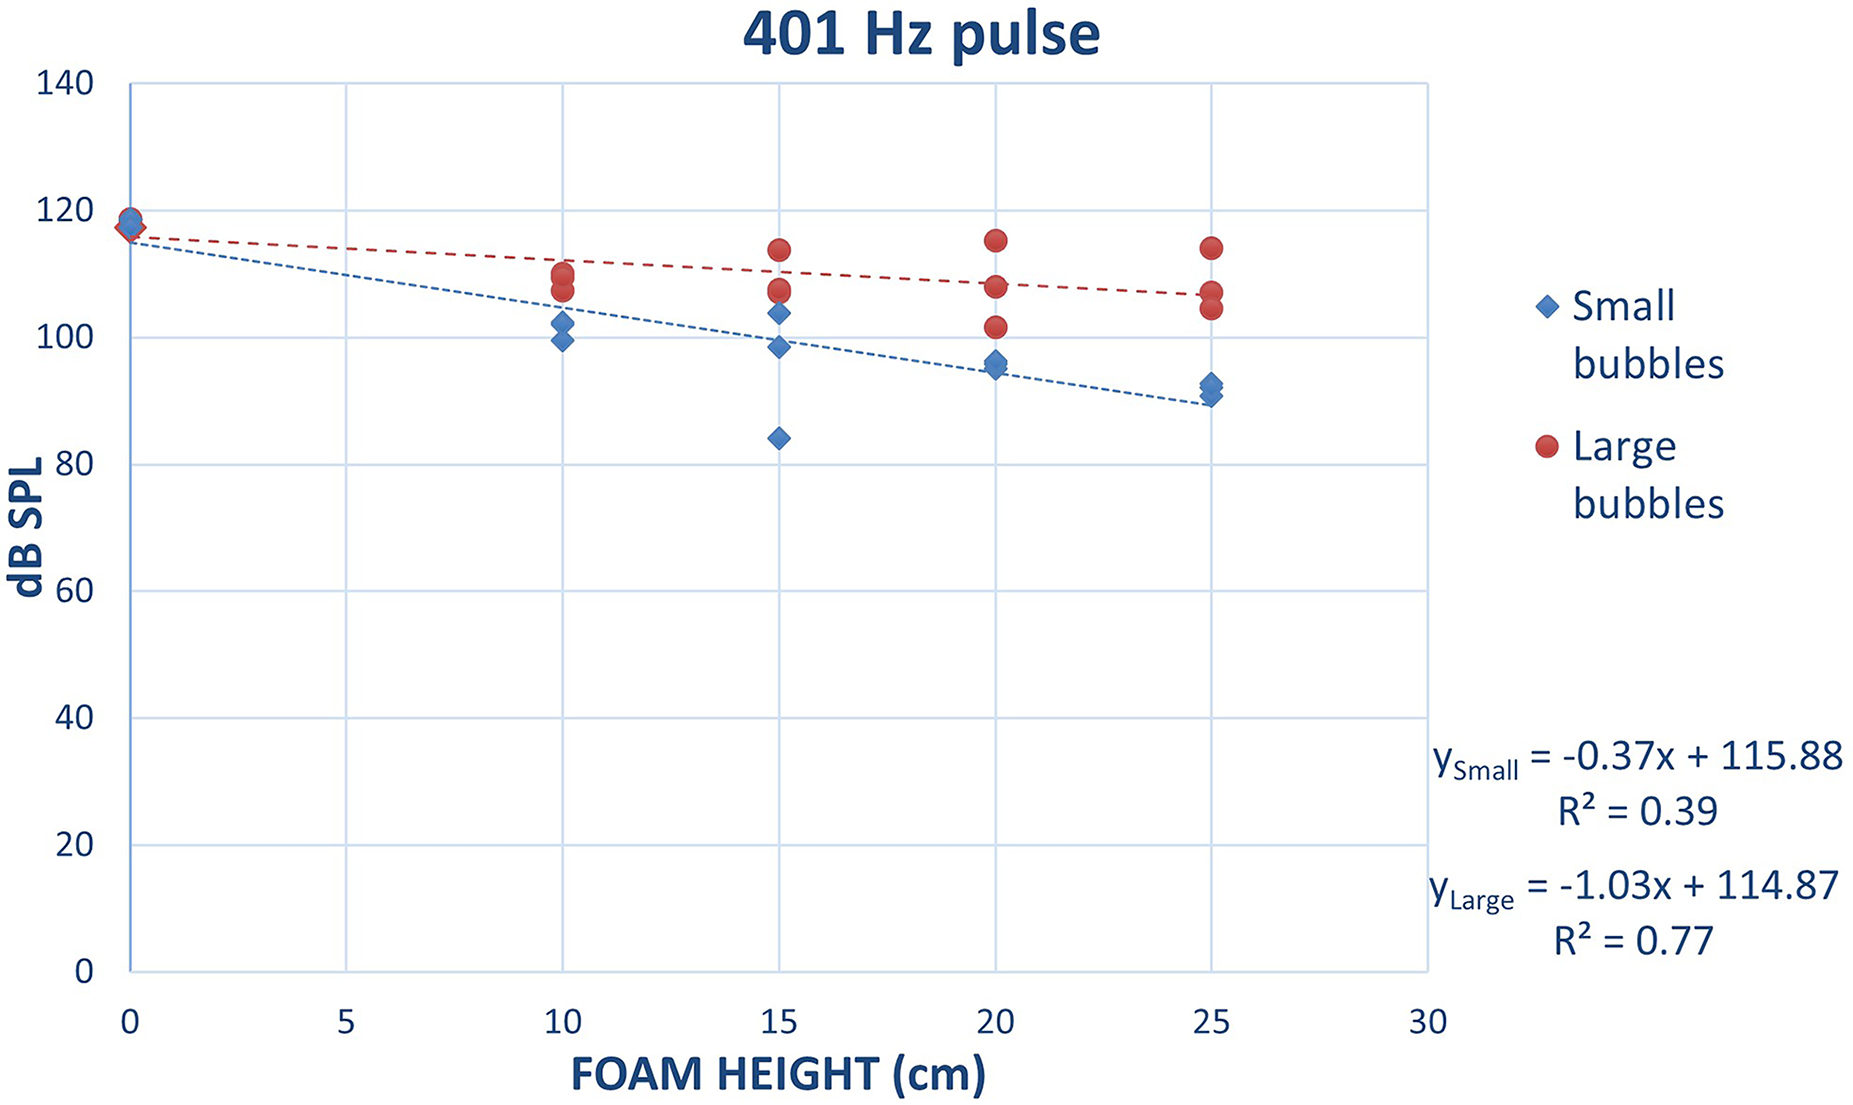
Acoustic measurement (dB SPL) as a function of foam height (cm) for the 401 Hz pulse.
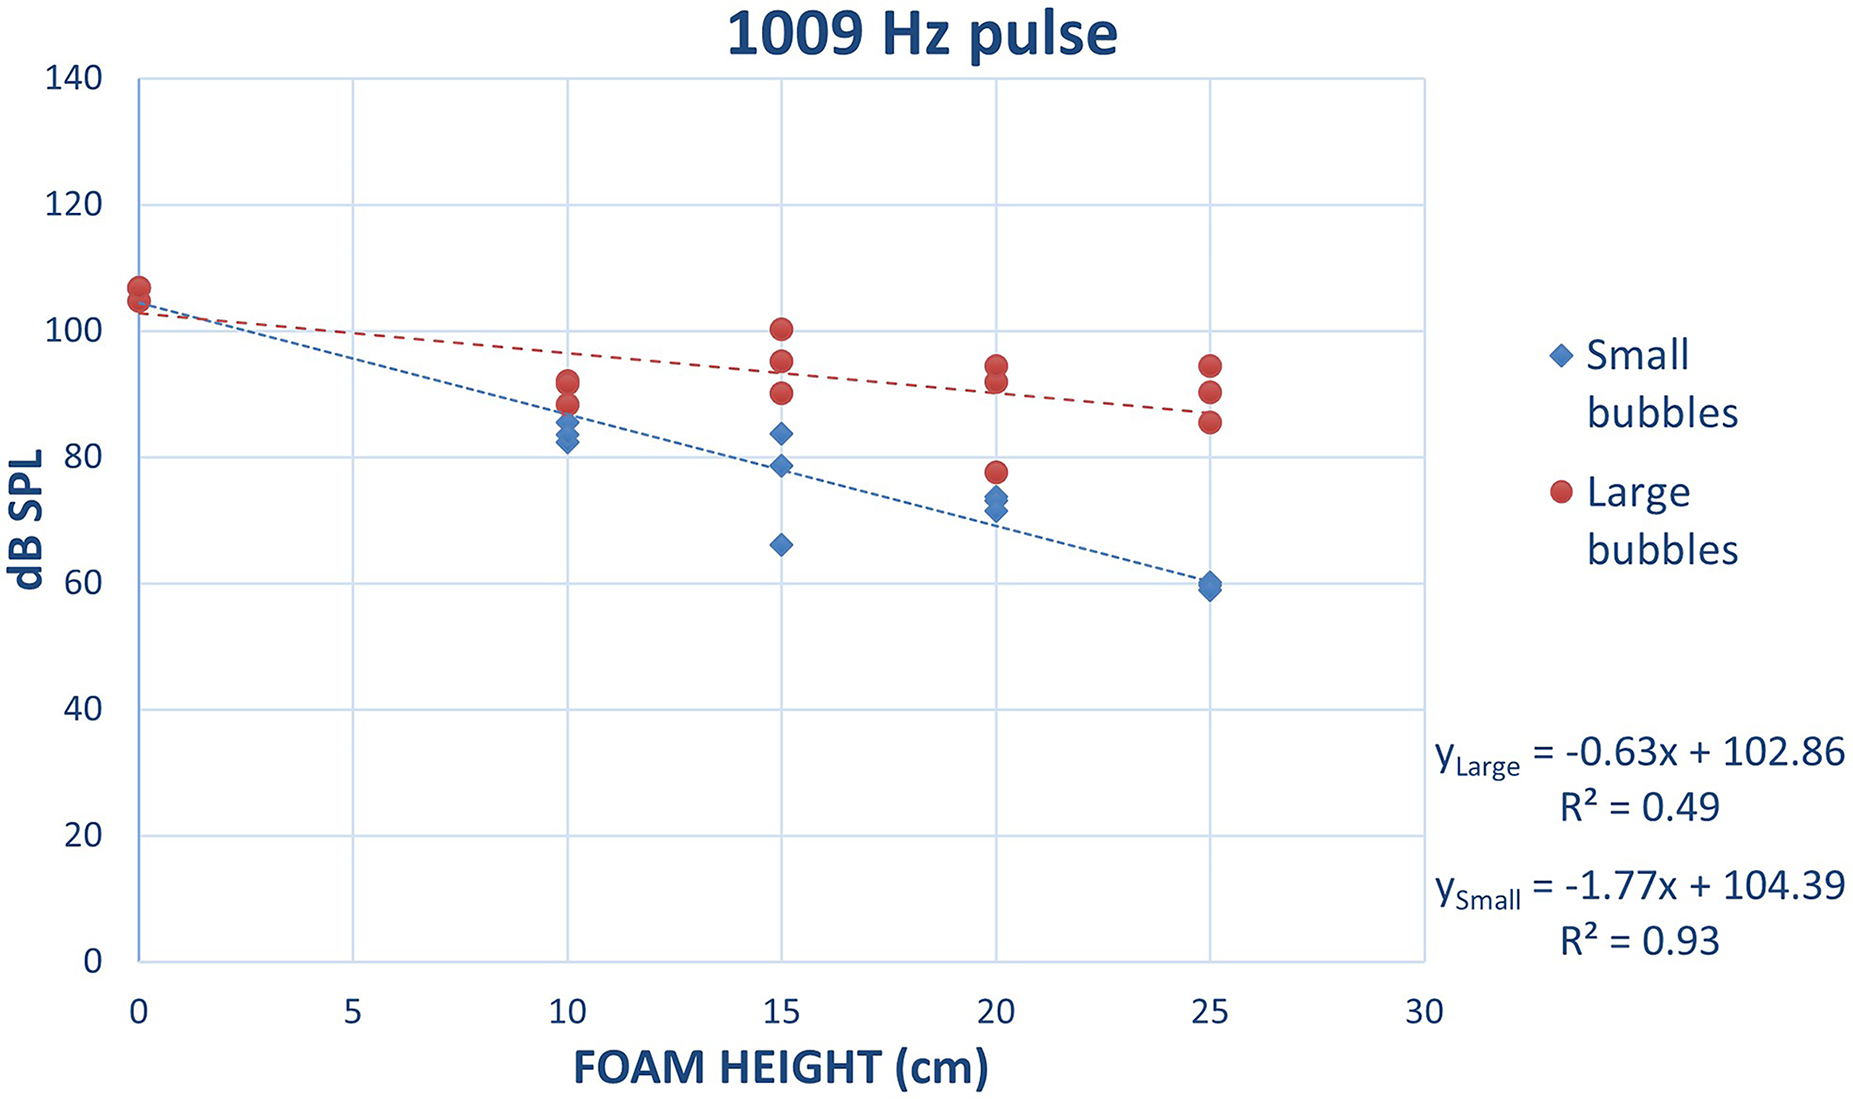
Acoustic measurement (dB SPL) as a function of foam height (cm) for the 1009 Hz pulse.
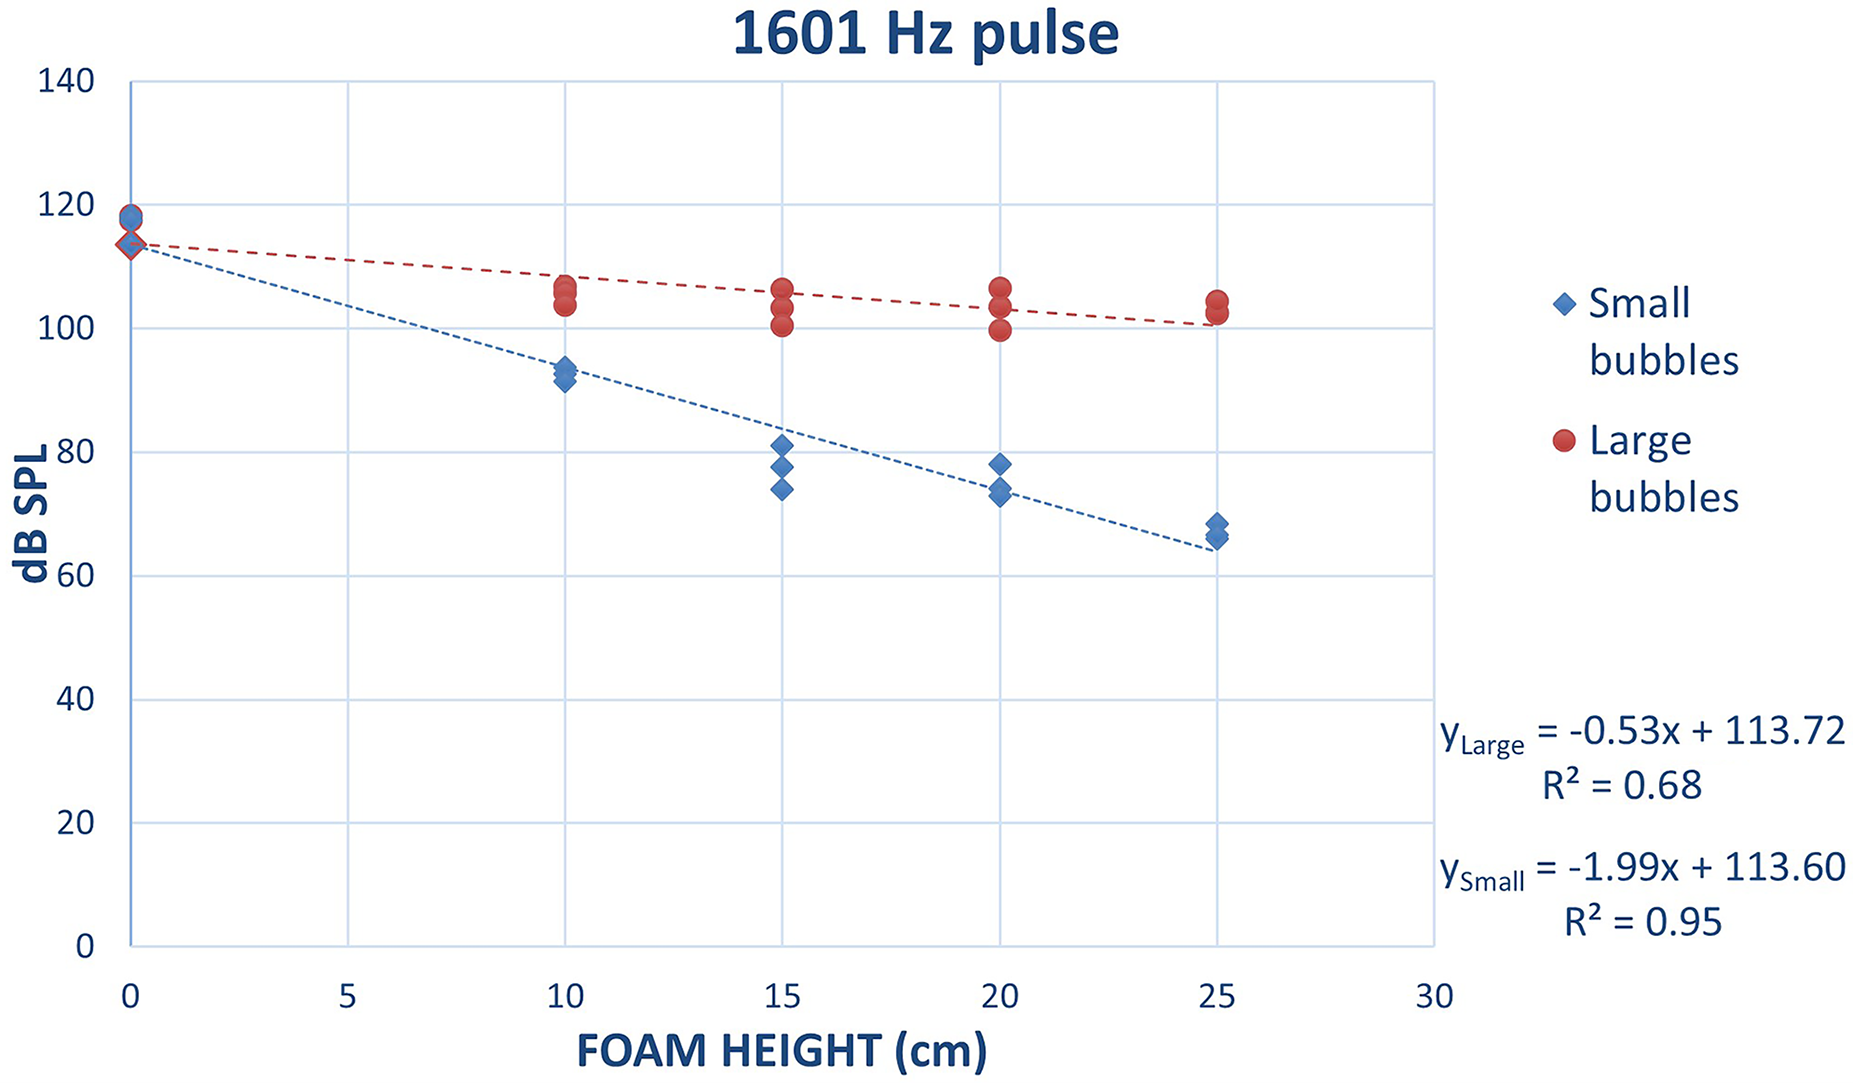
Acoustic measurement (dB SPL) as a function of foam height (cm) for the 1601 Hz pulse.
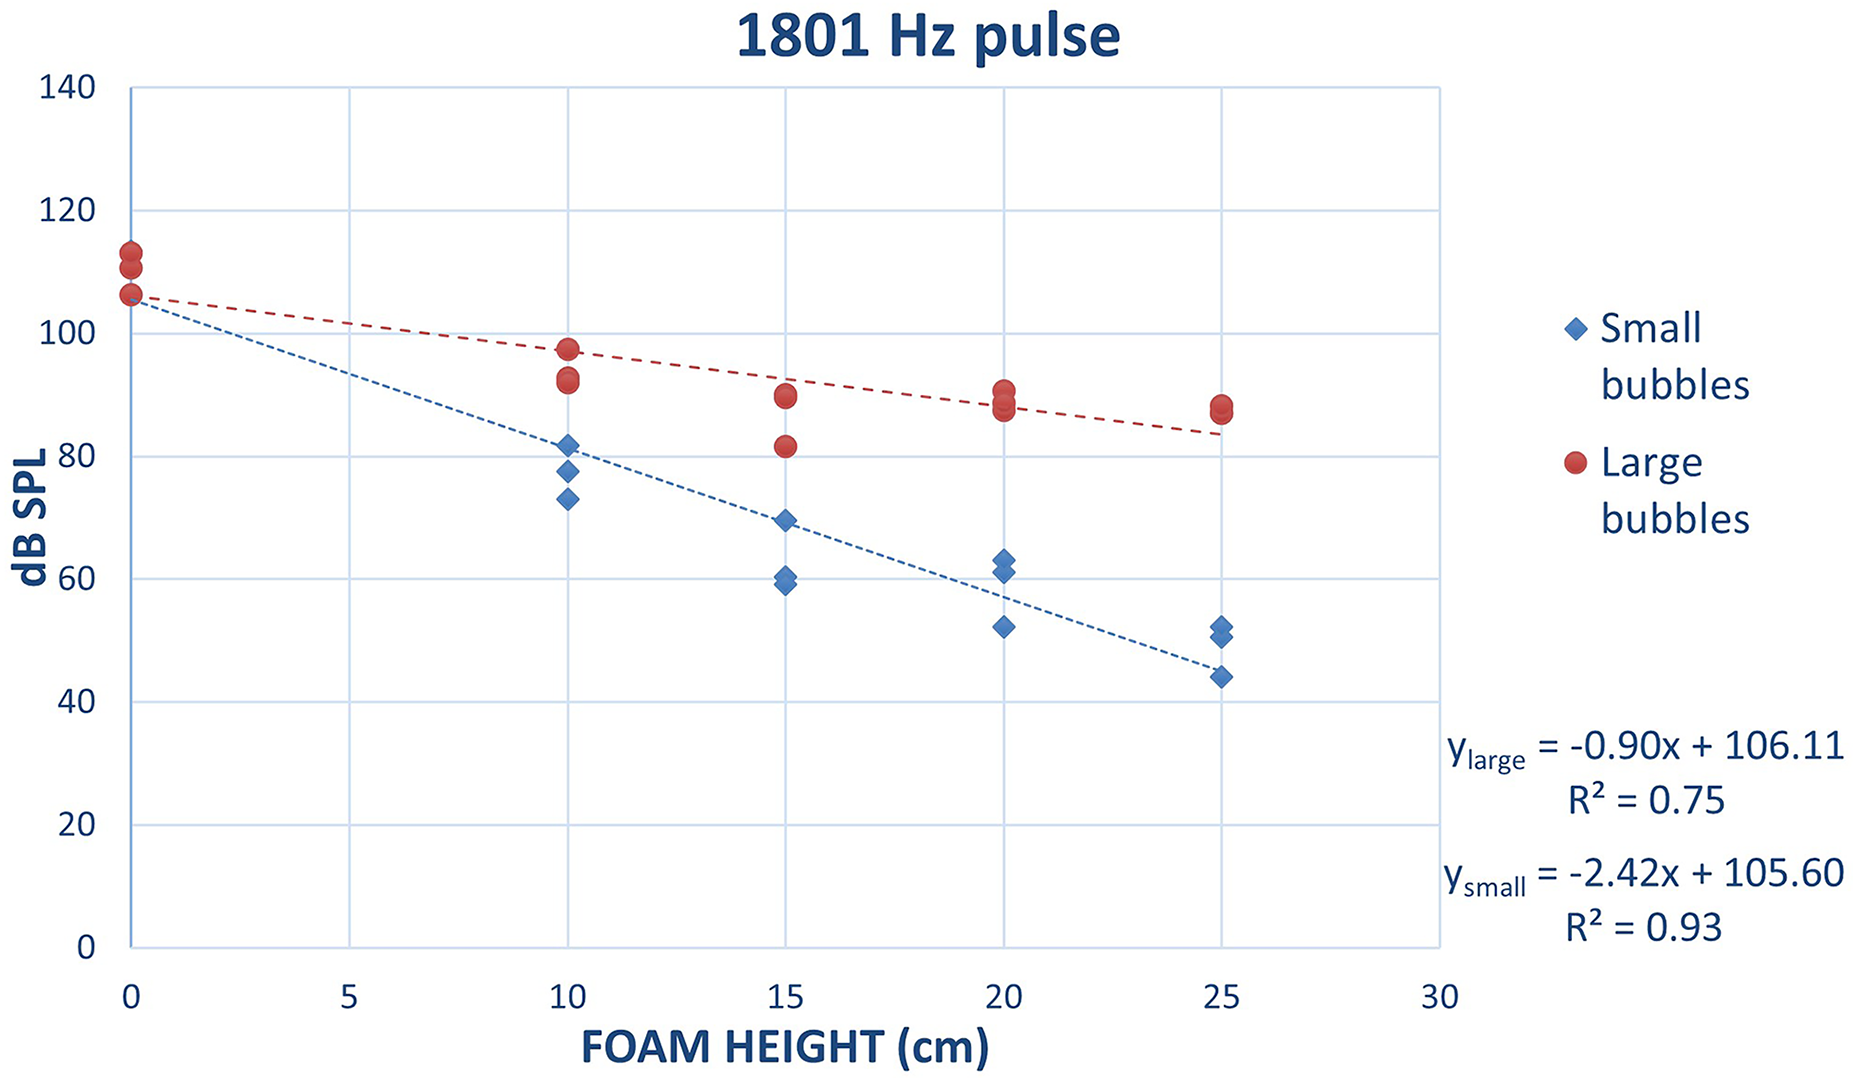
Acoustic measurement (dB SPL) as a function of foam height (cm) for the 1801 Hz pulse.
The results demonstrated that foams consisting of the smaller bubbles attenuated sound more so compared to the larger bubble configurations over all frequencies. Higher frequencies such as the 1801 Hz pulse displayed the greatest attenuation with the peak amplitude declining by an average of 61 dB SPL over 0 to 250 mm of foam. Whereas lower frequencies such as the 401 Hz pulse reduced from an average of 118 dB SPL without foam to just 91 dB SPL with 250 mm of foam. The gradient of reduction of the signal per unit height of aqueous foam or the coefficient of attenuation was seen to increase with higher frequencies and was more apparent with smaller bubble foams as graphically shown in Figure 10. However, both sets of data from the large and small bubble configurations demonstrate a general increasing trend of attenuation coefficients with frequency. The respective R-squared values confirmed a better relationship between the acoustic signal and foam height for higher frequencies compared to the lower frequencies for both foam configurations.
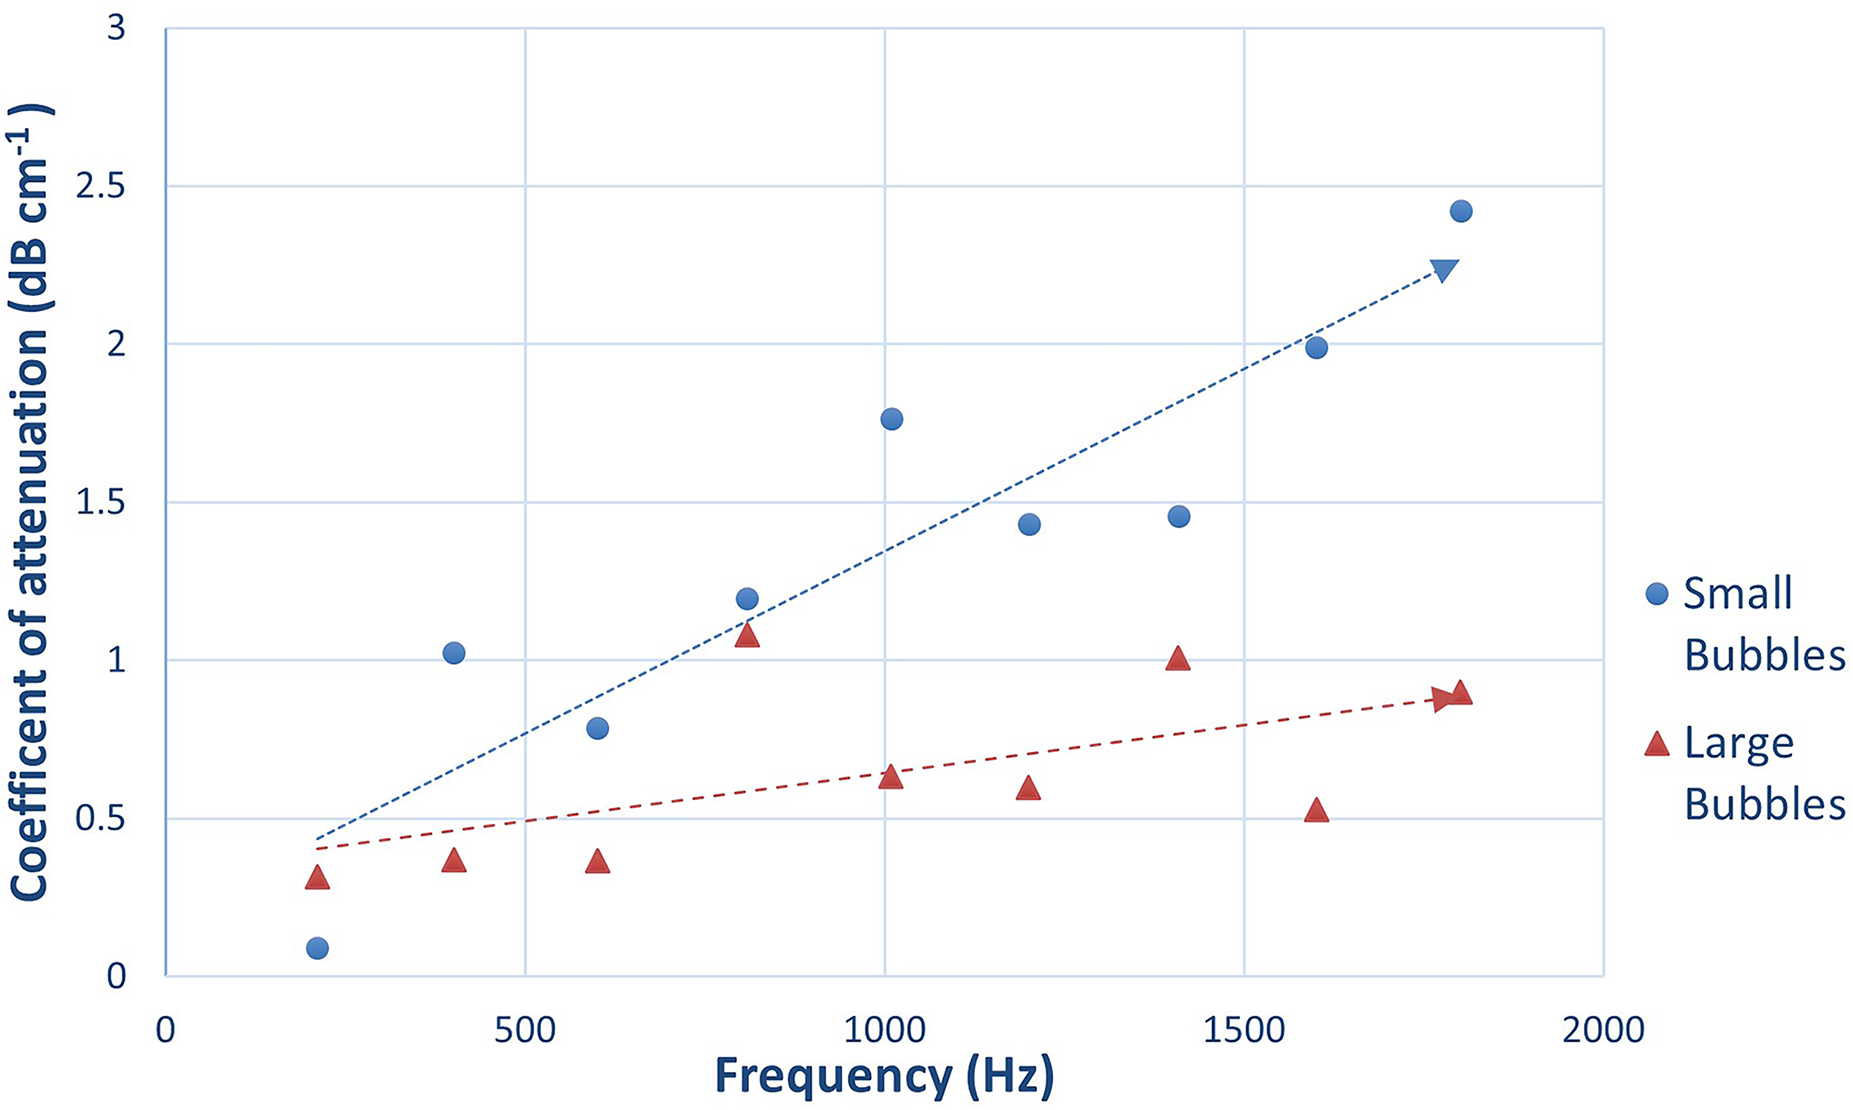
Attenuation coefficient of the acoustic signal as a function of frequency pulse tested.
Time dependant behaviour of acoustic signal
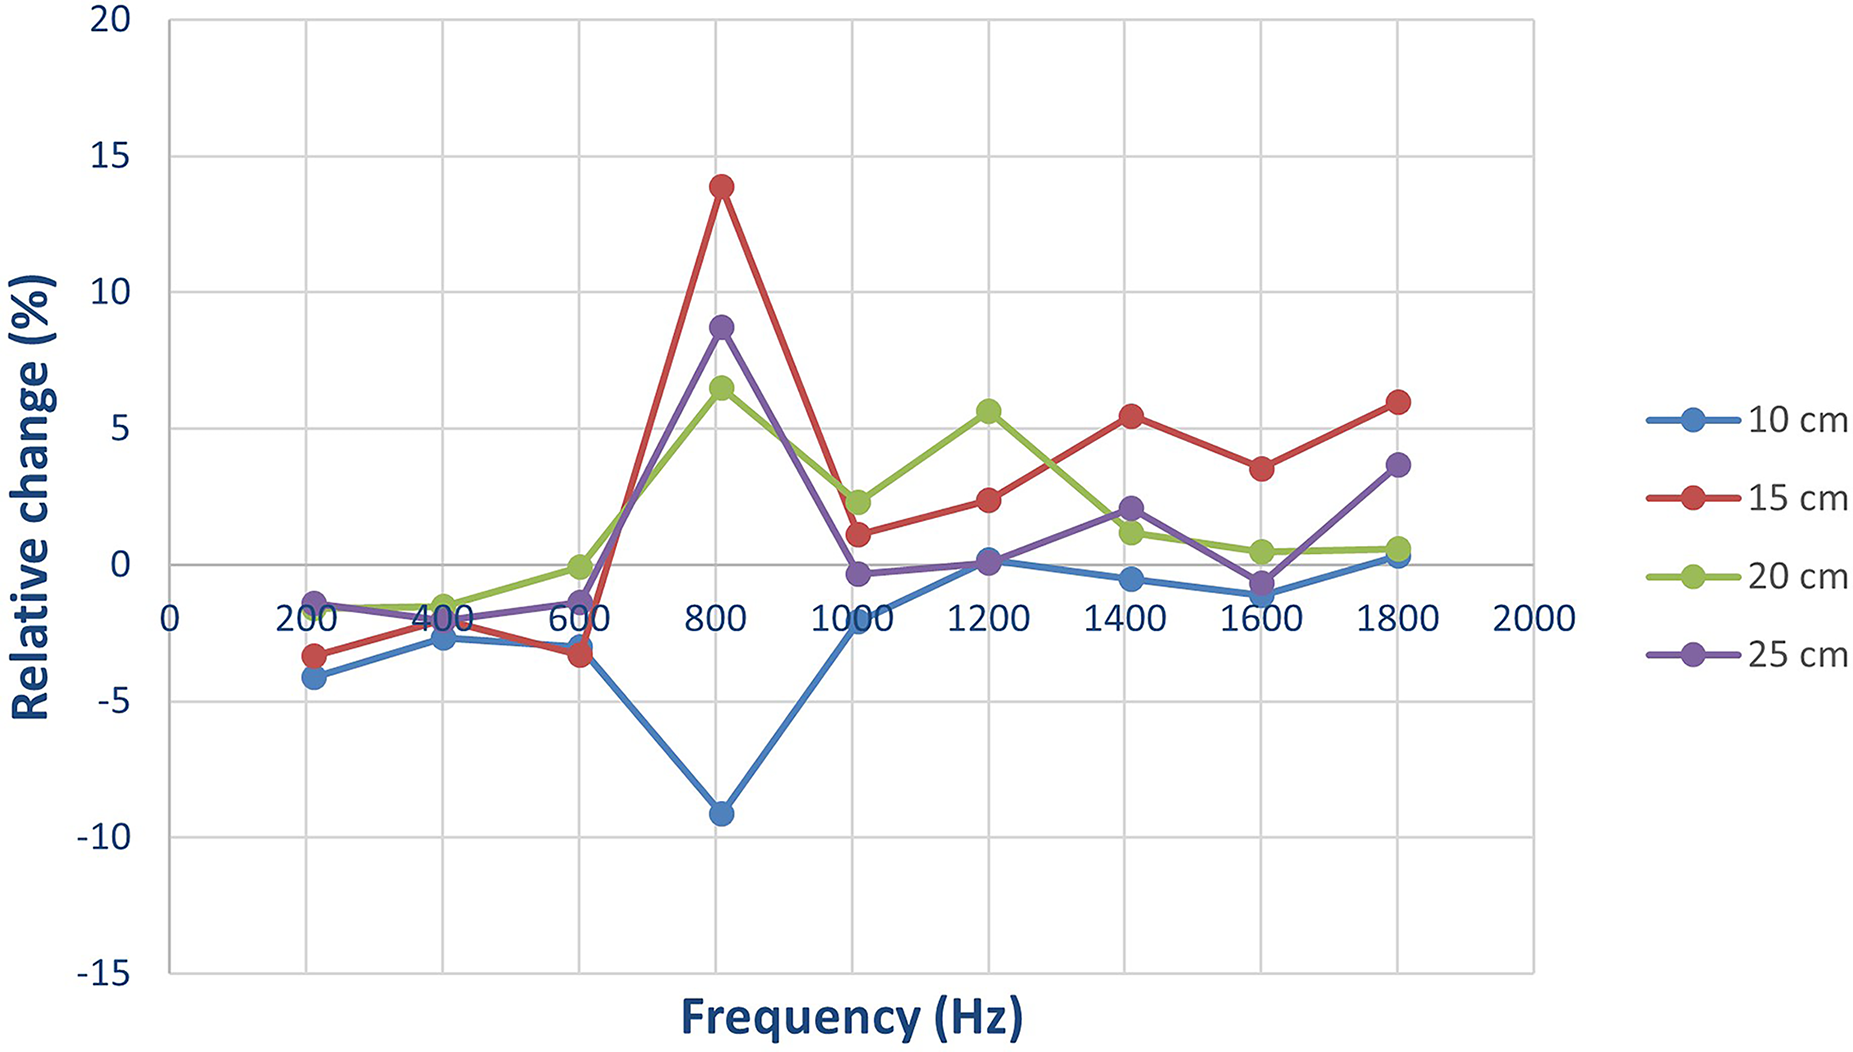
The acoustic signals recorded within the five consecutive trials from a single foam sample exhibited time-dependent behaviour. Similar to that observed with the attenuation coefficient, the time-dependent behaviour was more apparent in foams consisting of small bubbles. The relative change in percentages between the fifth and first recorded signal was calculated for each frequency pulse for both foam configurations and are displayed in Figures 11 and 12. Higher frequency acoustic signals recorded an increase in amplitude over time with percentage relative change as large as 16.6% in the case of small bubble foams (see Figure 12). However, the reduction of the sound level with time for certain low frequency pulses denoted by the negative relative change was unclear. This signifies that the amplitude recorded for higher frequencies is more sensitive to bubble size and/or the void faction of the aqueous foam.
Relative change in percentage of the acoustic signal amplitude between the first and fifth recording for foam with large bubbles.
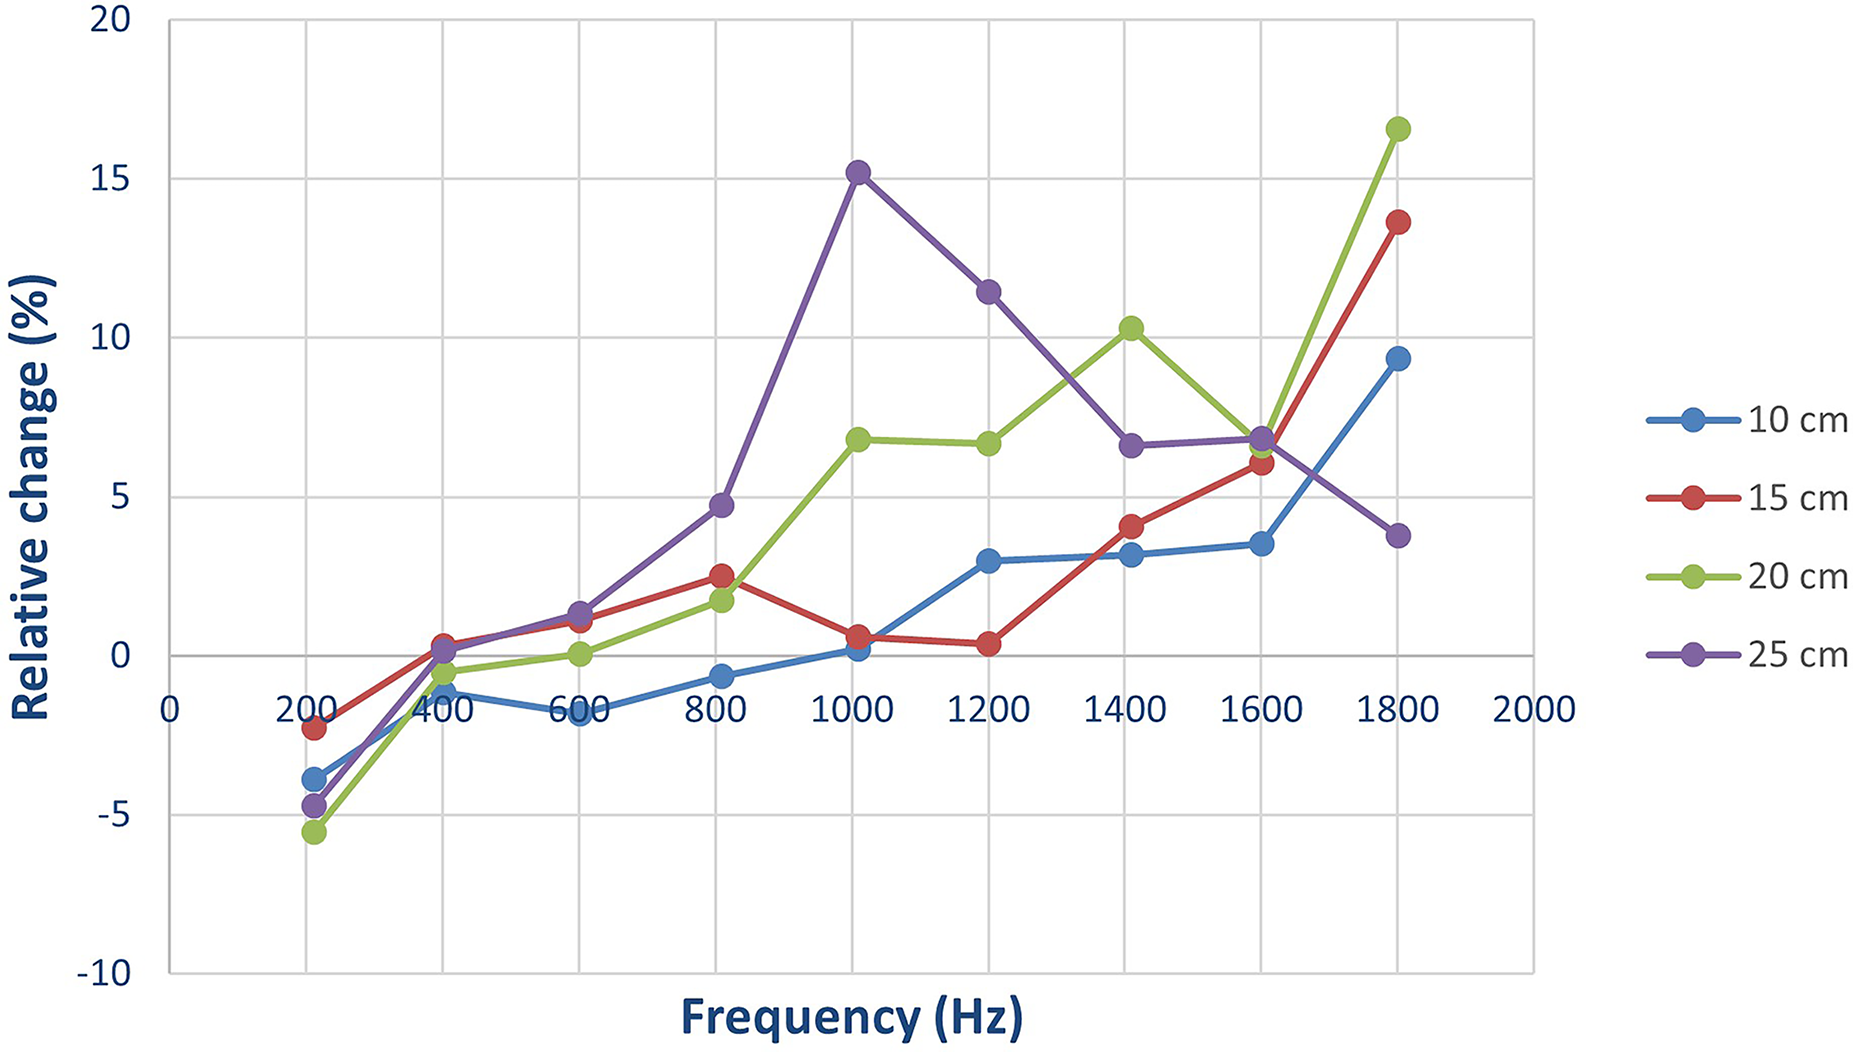
Relative change in percentage of the acoustic signal amplitude between the first and fifth recording for foam with small bubbles.
Discussion
The attenuation of sound when propagating through the aqueous foam agreed with the literature reported on solid foams or porous media. The effect of several factors such as time, bubble size and the frequency of the sound signal on the attenuation was observed to be in consensus with previous literature.20,29,31–34 However, the results discussed above confirmed deviations and complications of the attenuation of sound through larger samples of foam produced in less controlled environments.
The linear attenuation of the sound signal with increasing foam height as opposed to the exponential decay of sound through solid porous media described by Ingard 35 was attributed to the decibel logarithmic scale used for the sound measurements, therefore results obtained in this study follow a similar relationship on a linear scale of sound. Ingard's 35 relationship of the attenuation of sound through solid porous media was later adopted by Birk et al. 13 with respect to the control of slag foaming in the BOF. While Birk et al. highlighted the sensitivity of factors such as the bubble size and frequency on the coefficient of attenuation, a least squares method was adopted for obtaining a general coefficient over the frequency bandwidth and was used to correlate the foam height and the amplitude of the acoustic signal. An important observation can be found in Figure 10 where the coefficient of attenuation for small bubble configurations itself displayed significant increments between two pulses that were merely 200 Hz apart. The general trend of the coefficient was also seen to increase with frequency, therefore even with a single configuration of foam, a wider bandwidth of frequencies would result in a calculated coefficient having high variance.
The foam configurations with smaller bubbles will have more individual bubbles in a given foam height compared to the large bubble configurations of foams, therefore the higher attenuation of the acoustic signal can also be due to the energy losses, due to the greater impedance. 36 The attenuation of the sound signal was seen to correlate better with increasing foam heights for aqueous foams consisting of smaller bubbles, demonstrating a stronger distinction between smaller height intervals compared to the foams with larger bubbles. Individual bubbles contained within foams with larger bubble sizes were observed to have significantly thinner outer films that can be related to lower liquid fraction of the foam, similar to ‘drier’ slag foam generated in the BOF. This could lead to a lower level of accuracy of an acoustic monitoring system of slag foaming in the BOF with a ‘drier’ slag foam. This can be one of the major complications of correlating slag foam heights to the attenuating sound signal, due to the transient nature of slag foam dynamics during the blowing process. Previous studies on the control of slopping due to slag foam in the BOF do not directly take the instantaneous liquid void fraction or the bubble distribution into account when relating the foam heights to the sound signal, due to practical difficulties in obtaining these measurements.13,15,17,18 However, it would be interesting to investigate if this could be solved by interpretation of the approximate transient void fraction and bubble size made based on the slag viscosity or surface tension based on previous research.27,28
Fundamental acoustics explains that the attenuation of sound through a material increases with increasing frequencies due to the shorter wavelength. 36 This was observed in the results with the higher frequencies above 1000 Hz seen to be more attenuated and better related to the foam height compared to the lower frequencies in both foam configurations. This was an important observation since most industrial based studies using acoustics for the control of slag foaming identified a lower bandwidth of frequencies as the most effective spectrum.14,15 The higher frequencies also showed more sensitivity to foam height based on the high coefficients of attenuation. However, the high sensitivity at extremely high frequencies could also mean that sound level detected at higher foam heights in the BOF would risk being below the audible limit of the microphone positioned in the hood of the furnace.
The time-dependent behaviour of the sound signal observed was more prominent for the small bubbles with high liquid fraction which could be due to the significant drainage of the foam due to gravity and the interaction of the sound wave with the thinning bubble. Thicker outer films of the bubbles would result in a net increase in weight of the bubble compared to the thinner filmed larger bubbles. As a result, the smaller bubbles would experience drastic drainage, decreasing the attenuation of the sound signal and accentuating the signal with time. The data did not support a trend for the time-dependent change of the signal based with frequencies, which once again indicates the unique behaviour of each frequency that interacts with the aqueous foam. The behaviour of the signal with time for the lower frequencies was unclear. The low frequency signals showed a decrease of the signal's measured sound level with time, that is an increase in the attenuation of the signal. Previous studies on the effect of particles on the attenuation of sound through aqueous foams have shown that the presence of particles with the proper wetting conditions not only stabilises the bubbles resulting in less drainage but also increases the attenuation of sound. 34 Therefore, it is reasonable to assume that in an industrial BOF the time-dependent behaviour could be significantly affected by the presence of undissolved flux particles within the slag. This is an aspect of slag foaming not currently addressed in the present investigation, however, this work does highlight the importance of selecting the frequency range and the size of the bandwidth used for detecting foam heights in the BOF.
Conclusion
A cold model study was conducted using a cylindrical acrylic vessel to investigate the behaviour of sound through increasing heights of aqueous foam. This study was aimed at improving the fundamental understanding in utilising sound to provide a real time measurement of slag foam height in the BOF. The accurate and reliable control of the slag foam height within the BOF furnace directly influences the increase in efficiency of the BOF process. The effect of frequency and bubble size of the foam on relating the sound signal to the stationary foam height were investigated in this experimental study.
The results indicated that sound attenuated similar to that observed in previous studies. Foams with larger bubbles had a lower attenuation coefficient of the sound wave compared to the smaller bubbles. The coefficient of attenuation also increased with higher frequencies for both foam configurations, signifying those higher frequencies being more sensitive to foam height. The coefficients displayed unpredictable fluctuations across frequencies for a single foam height. This indicates the importance of narrow frequency bandwidth selection for industrial acoustic systems to avoid the adverse effects of the fluctuating coefficients of attenuation on mathematical estimates used for monitoring systems. It is important to conduct further studies to investigate if this relationship would hold true when tested with a geometrically similar scale model of the BOF and identify frequencies with better repeatability and, observe if these identified frequencies would exist when a top blown lance is introduced to the cold model. The higher frequencies with high sensitivity to foam height needs to be studied based on plant trials with consideration on the audible limit of the microphones positioned at a significant distance away from the BOF furnace.
The slag chemistry of the BOF is known to be dynamic, influencing factors such as the slag viscosity and surface tension that directly influence the foamability of the slag, the bubble distribution, and the liquid volume fraction of the foam. Further studies into linking theoretical models of instantaneous slag chemistry during the blow to the acoustic system in utilising the appropriate attenuation coefficients can be used to advance our knowledge of the steelmaking process.
Footnotes
Acknowledgments
The authors wish to acknowledge funding through the Australian Research Council Industrial Transformation Research Hubs Scheme (Project Number IH200100005) and BlueScope Pty Ltd.
Declaration of conflicting interests
The authors declared no potential conflicts of interest with respect to the research, authorship, and/or publication of this article.
Funding
The authors disclosed receipt of the following financial support for the research, authorship, and/or publication of this article: This work was supported by the Australian Research Council Industrial Transformation Research Hubs Scheme (grant number IH200100005).