
Abstract
Aim:
Temporary anchorage devices (TADs) have become the preferred method of skeletal anchorage in new-age orthodontics. Despite the remarkable success of mini implants in orthodontic treatment results, mini implants’ stability remains a vital issue that has to be resolved, due to the fact that failure rates are broadly variable and might be up to 25%.
Objectives:
To evaluate the effect of the diameter, implant bone surface contact, thickness of cortical bone, and implant insertion sites on mini implant stability using resonance frequency analysis (RFA).
Materials and Method:
CBCT of the dry skull was obtained. Buccal and lingual cortical plates of the maxillary and mandibular jaws were measured at 6 mm from the coronal part of the alveolar bone. After placing the implants, the stability was measured using resonance frequency analysis.
Results:
In the maxillary arch, Pearson correlation showed significant correlation of instability of the implant with the width of the buccal cortical plate and lingual cortical plate and implant contact surface area. In mandibular arch, Pearson correlation showed no significant effect of buccal/lingual cortical plate width, and implant surface contact area in primary stability of varied sized, mini implants.
Conclusion:
Statistically significant increases in the primary stability of mini implants with an increase in the implant bone contact surface area were found in the maxilla. In the mandible, no significant increase in mini implant stability was found with an increase in the implant contact surface area.
Keywords
Introduction
Mini implants do not osseointegrate, and their stability is a mechanical phenomenon, also known as primary implant stability. Features that may have an effect on stability retention are bone types, that is, width of cortical plates, preparation of implant site, that is, self-tapping or self-drilling, diameter, insertion angle, and insertion torque. Stability of the anchorage unit is of paramount importance for the successful culmination of orthodontic mechanics.
Stability of the implant can be measured by either the non detrimental means or like Histomorphologic investigation, tensile testing, push-in/pull-out evaluation and torque test while removing the implant. Non-detrimental methods of measurement include percussion and radiographic examination, cutting torque test during insertion of implants, Periotest measurement, and resonance frequency analysis (RFA), 1 which has been proved to be a satisfactory method in humans due to its noninvasive and noncontact measurement technique. 2 To measure the vibration of the implant in the bone, a small magnet that is encased in an aluminum cover, that is, a smart peg, is required to generate electromagnetic pulses of 5 to 15 kHz, attached onto the implant head. The device perceives the resonant rate of the smart peg implant component in the bone. Prosthetic implant stability has been assessed effectively with RFA. Dense bone encompassing the implant has a higher vibration frequency. Bone density around the implant, cortical plate width, and percussion examination results are similar to the resonant frequencies of mini implants.
A literature search shows many experimental studies that evaluated mini implants’ stability.3-5 However, in these studies, animal or artificial bone was utilized, and thus the difference in the bone physiologies of animals and humans acted as a limiting factor in the researches documented. In order to eliminate the limiting factor of differences in bone physiology, the current research was designed to assess the stability of a mini implant in dried human skull, and to obtain accurate results, RFA was used, as it is considered to be one of the established means to evaluate implant stability. Various other relevant factors that affect stability, such as the diameter, implant bone contact surface area, thickness of cortical bone, and implant insertion site, have also been studied to present competent data regarding mini-implant stability.
Aims and Objectives
To evaluate and compare the initial stability of mini implants, with dimensions 1.3 mm ´ 8 mm and 2 mm ´ 8 mm, using RFA, at various anatomic sites in the maxillary and mandibular arches.
To assess the bone contact surface area of the mini implants (1.3 mm ´ 8 mm and 2 mm ´ 8 mm) and its effect on stability.
Materials and Method
The in-vitro study was conducted in the Department of Orthodontics and Dentofacial Orthopaedics, and an adult female human dried skull was obtained from the Department of General Human Anatomy and Embryology. Ethical clearance from the institutional review board was obtained before starting the study.
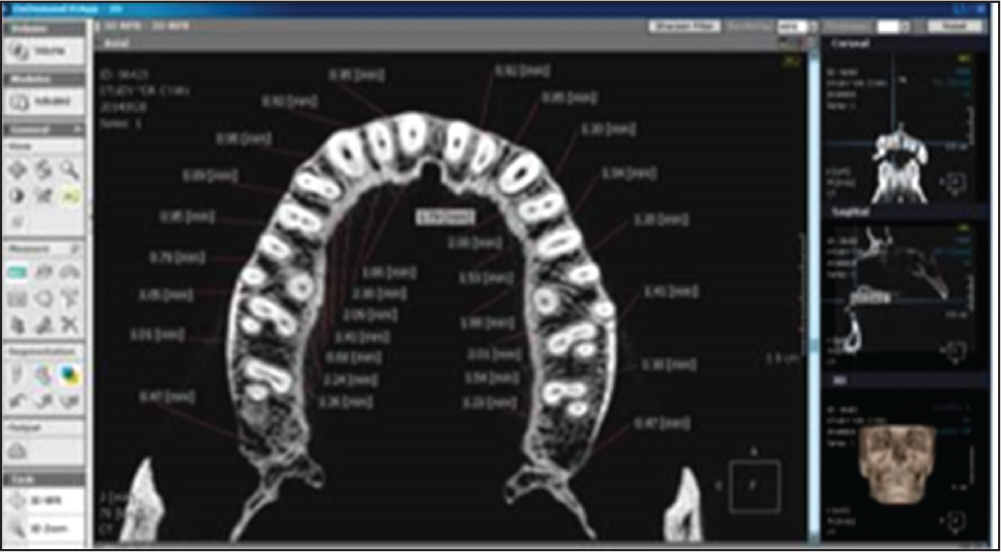
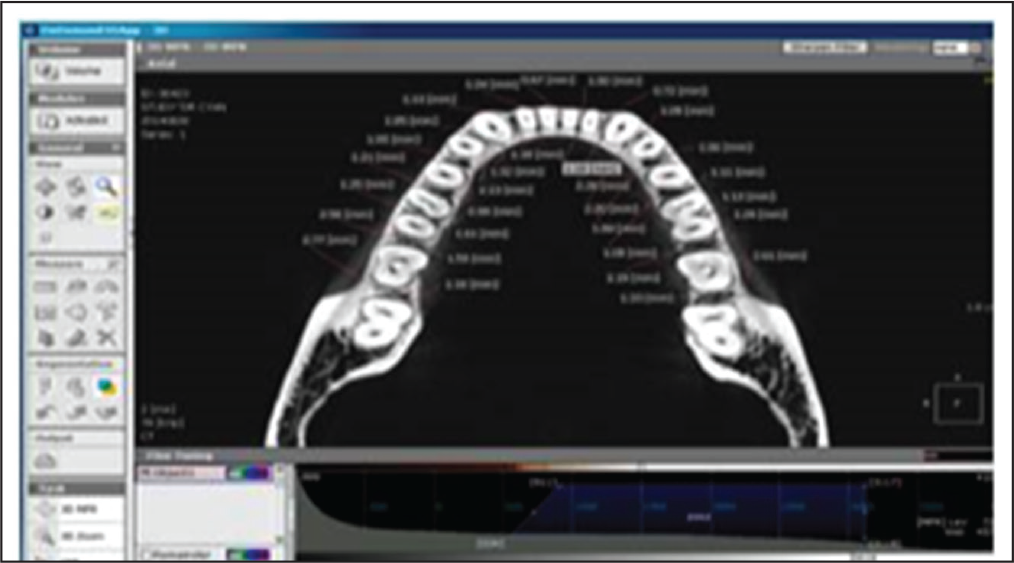
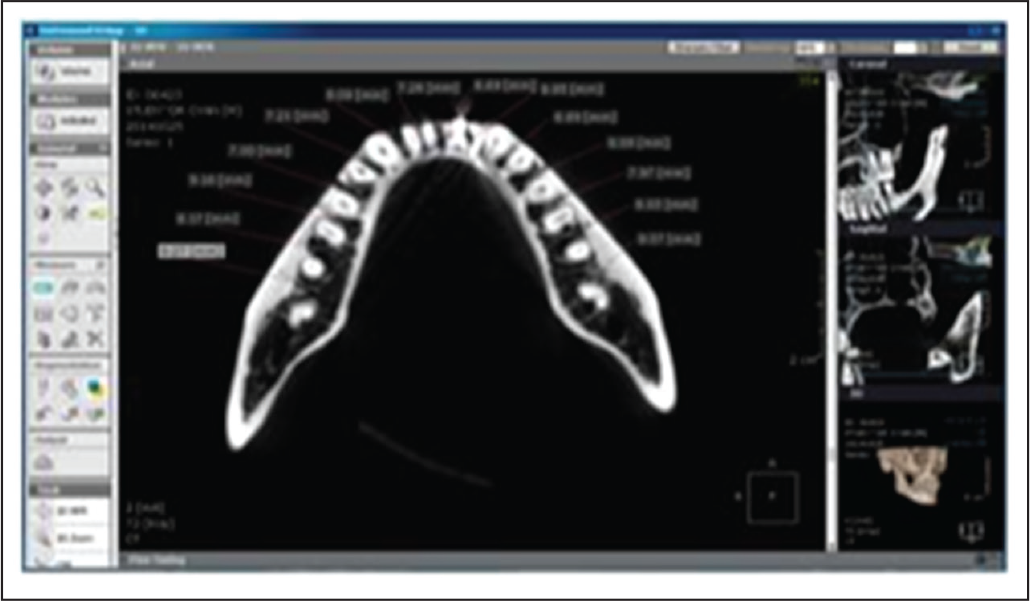
CBCT of the dry skull was obtained using CS 3000 (Care Stream 3000) hardware, and a standardized field of view (FOV) of 17 cm × 30 cm and voxel size of 300 mm were selected. Buccal and lingual cortical plate widths were measured at 6 mm from the coronal part of the alveolar bone in the maxillary (Figure 1) and mandibular jaws (Figure 2). On the dry skull, using a Vernier caliper, 6 mm measurements from the coronal part of the alveolar bone were marked on the maxillary and mandibular jaws of the dry skull.
Buccal and lingual stainless-steel mini implants of sizes 1.3 mm ´ 8 mm and 2 mm ´ 8 mm, manufactured by S.K. Surgicals, Pune, India, were selected for the study. In the present study, 72 stainless-steel mini implants were used, out of which 36 stainless-steel mini implants were of the dimensions 1.3 mm ´ 8 mm and 36 stainless-steel mini implants were of the dimensions 2 mm ´ 8 mm. Eighteen mini implants with the dimensions 1.3 mm ´ 8 mm were placed in the maxilla, and 18 mini implants with the dimensions 1.3 mm ´ 8 mm were placed in the mandible.
CBCT Image With an Axial View of the Maxilla Depicting the Thickness of the Cortical Plate as 6 mm From the Coronal Portion of the Alveolar Bone
CBCT Image With an Axial View of the Mandible Depicting the Thickness of the Cortical Plate as 6 mm From the Coronal Portion of the Alveolar Bone
According to the placement sites in the maxilla and the mandible, the following groups were made:
Between the canine and premolar, buccally on the right and left sides. Between the lateral incisor and canine, buccally on the right and left sides. Between the central incisor and lateral incisor, buccally on the right and left sides.
Between the mesiobuccal and distobuccal roots of the first molar, on the right and left sides. Between the first molar and second premolar, buccally on the right and left sides. Between the first premolar and second premolar, buccally on the right and left sides.
Maxillary tuberosity/retromolar region. Between the third molar and second molar, buccally on the right and left sides. Between the second molar and first molar, buccally on the right and left sides.
Mx I, Mx II, and Mx III indicate anterior, middle, and posterior maxillary implant sites, respectively, whereas Md I, Md II, and Md III indicate anterior, middle, and posterior mandibular implant sites, respectively.
a = 1.3 mm ´ 8 mm mini implant.
b = 2 mm ´ 8 mm mini implant.
Mx indicates the maxillary jaw, and Md indicates the mandibular jaw. I = anterior, II = middle, and III = posterior. Mx Ia, Mx IIa, and Mx IIIa represent the 3 groups in the maxilla with 1.3 mm ´ 8 mm mini implants. Mx Ib, Mx IIb, and Mx IIIb represent the 3 groups in the maxilla with 2 mm ´ 8 mm mini implants. Md Ia, Md IIa, and Md IIIa represent the 3 groups in the mandible with 1.3 mm x 8 mm mini implants. Md Ib, Md IIb, and Md IIIb represent the 3 groups in the mandible with 2 mm ´ 8 mm mini implants.
For example, Mx Ia denotes the maxillary anterior site with 1.3 mm ´ 8 mm implants, Md IIb denotes the mandibular middle site with 2 mm ´ 8 mm implants, and so forth.
A pilot drill was made at the marked sites with the customized implant positioner. Mini implants were modified by soldering the implant analogues on mini-implant head with silver solder after stabilizing with the help of a fixator. Mini implants were placed at 45 degrees and 90 degrees in the predetermined maxillary and mandibular sites until their active portions were inserted into the bone.
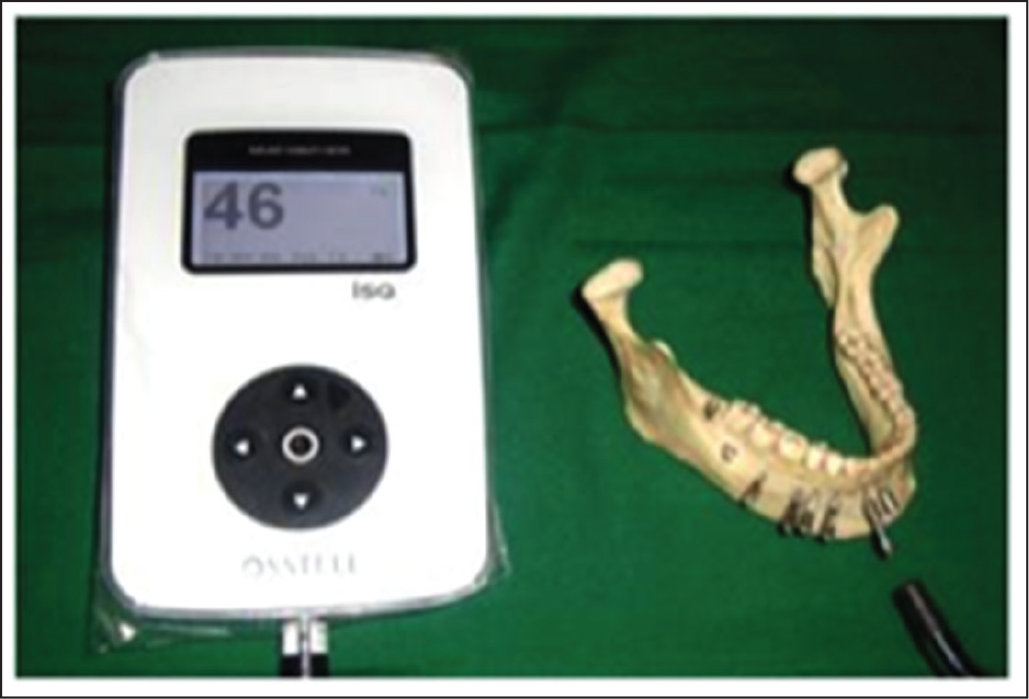
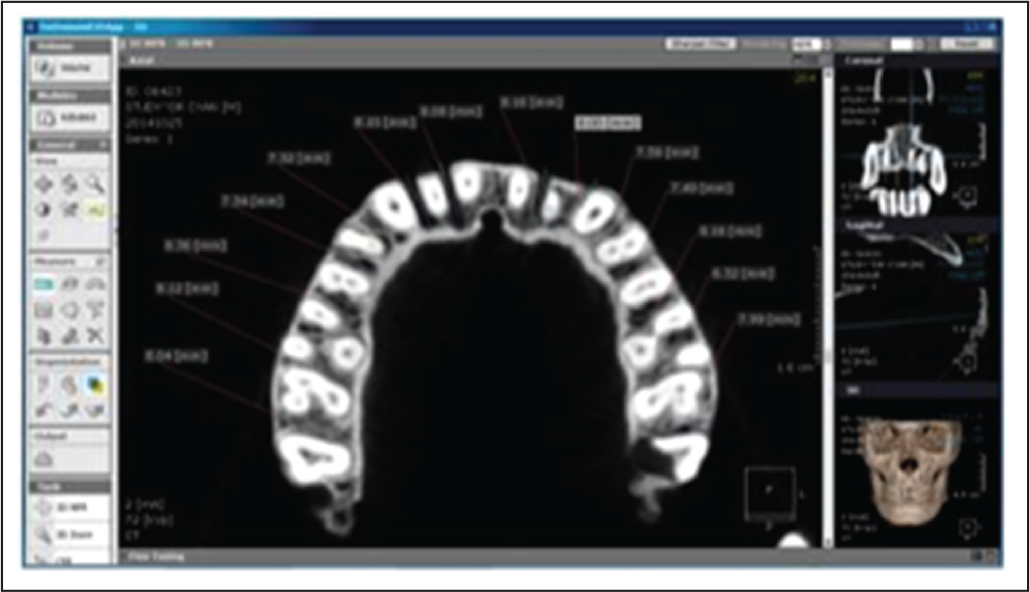
After placing the implants, their stability was measured by attaching the smart peg on the implant analogue. Readings were recorded using an RFA unit (Figure 3). After removing 1.3 ´ 8 mm mini-implants from the site, the contact area made by the implant appears radiolucent in the CBCT image. The 2 mm ´ 8 mm mini implants were inserted at an identical site. RFA was used to assess the mini implants’ stability. The contact surface area of the implants in the buccal and lingual cortical plates was measured using CBCT (Figures 4 and 5).
Primary Stability Measurement Using Resonance Frequency Analysis (RFA) of the Mandibular Jaw
CBCT Image With an Axial View of the Maxillary Jaw After Removal of Mini Implant From the Site
CBCT Image With an Axial View of the Mandibular Jaw After Removal of Mini Implant From the Site
Statistical Analysis
The statistics were gathered and tabulated for statistical analysis using the Statistical Package for Social Sciences (SPSS) program (version 19). The Shapiro–Wilk test was used to check the normality of the data.
Descriptive statistics, such as mean, standard deviation, and mode, were calculated for the buccal cortical plate width, lingual cortical plate width, and implant contact surface area.
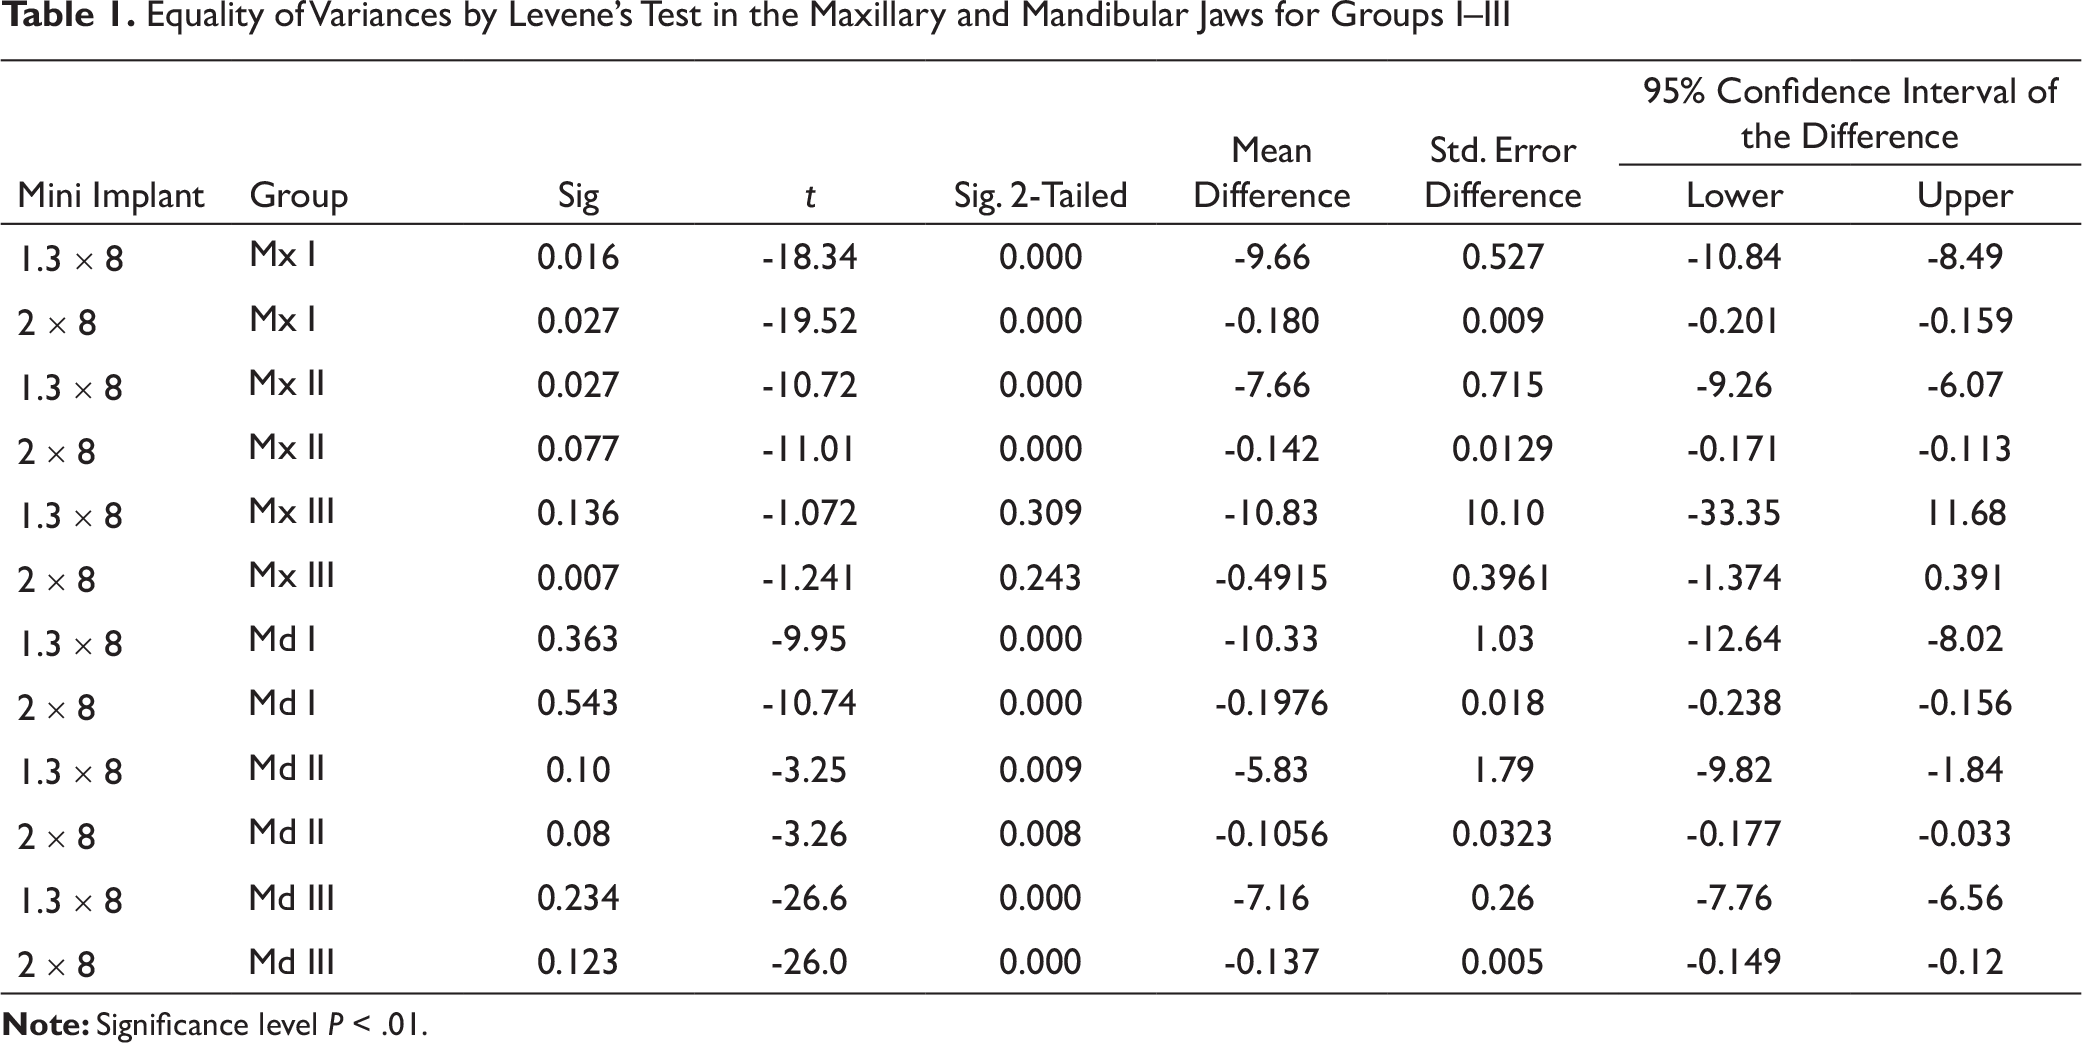
Equality of variances was calculated using Levene’s test for the right and left sides of both the maxillary and mandibular jaws and for the 2 sizes of the mini implants.
The right and left quadrants of both the jaws were merged, and both the jaws were divided into 3 segments: incisor, premolar, and molar. Maximum stability was determined using descriptive statistics for the 2 types of implants.
Intergroup comparisons of mini-implant stability were made using the one-way ANOVA test.
Equality of variances was calculated using Levene’s test for the comparison of 1.3 mm ´ 8 mm and 2 mm analysis of v 8 mm mini implants in both the jaws.
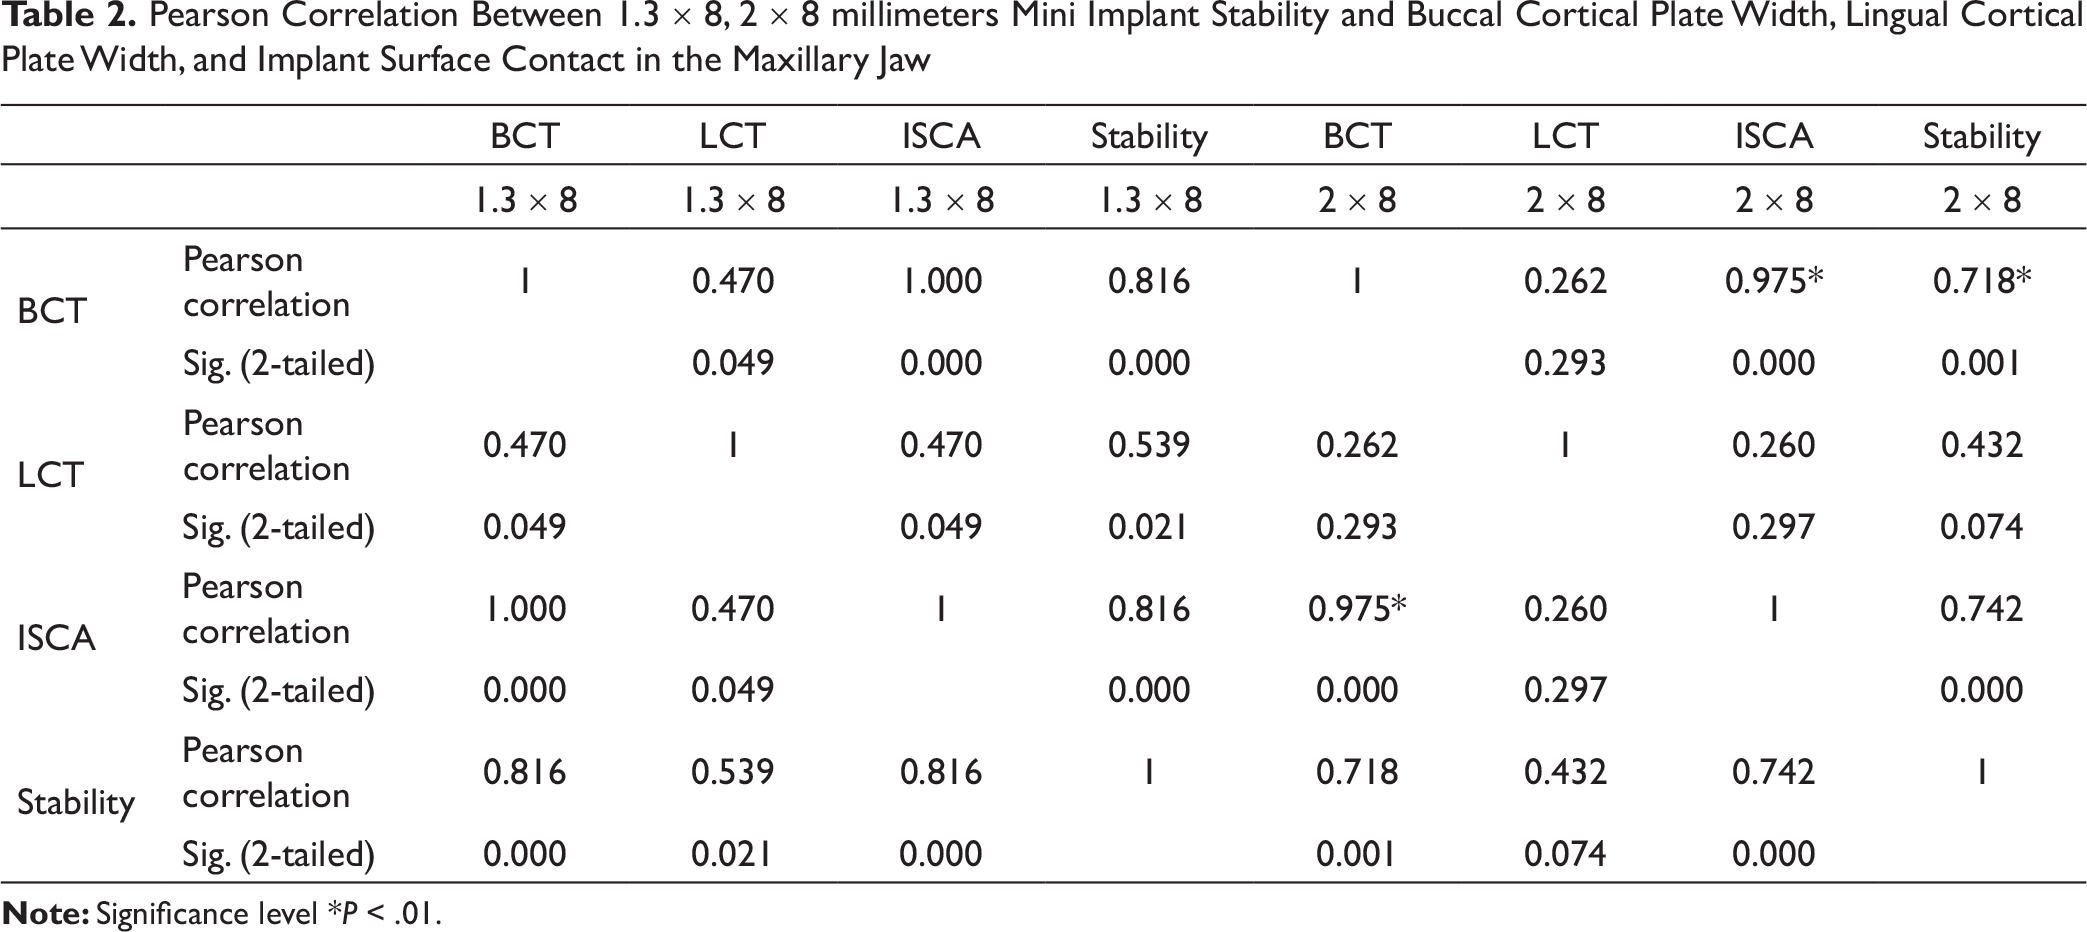
Pearson’s correlation was done to evaluate the correlation between the mini implant contact surface area and stability for both the jaws and the 2 different mini implant sizes.
Results
The mean thicknesses of the buccal cortical bone on the left and right sides of the maxilla were 1.040 ± 0.2702 and 1.038 ± 0.2715, respectively, and for the lingual cortical bone, they were 1.717 ± 0.3539 (left) and 1.751 ± 0.3865 (right). The implant contact surface areas for the mini implants of dimensions 1.3 mm ´ 8 mm were 1.038 ± 0.2702 (left) and 1.038 ± 0.2710 (right), and for the 2 mm ´ 8 mm mini implants, they were 1.038 ± 0.2702 (left) and 1.038 ± 0.2714 (right).
The mean thicknesses of the buccal cortical bone on the left and right sides of the mandible were 1.9289 ± 0.812 and 1.8822 ± 0.775, respectively, and for the lingual cortical bone, they were 1.458 ± 0.444 (left) and 1.543 ± 0.3914 (right). The implant contact surface areas for the mini implants of dimensions 1.3 mm ´ 8 mm were 2.352 ± 0.5040 (left) and 2.396 ± 0.5105 (right), and for the 2 mm ´ 8 mm mini implants, they were 2.352 ± 0.5040 (left) and 2.396 ± 0.5105 (right).
Equality of variances, which was calculated using Levene’s test, confirmed no statistically significant difference between the right quadrant and left quadrant of the maxillary and mandibular mini implant insertion sites in the width of the buccal and lingual cortical plates and the implant contact surface area for the 2 different kinds of mini implants used. The right quadrant and left quadrant of both the jaws were thus combined for further statistical analysis.
One-way ANOVA test was used to make intergroup comparisons in the maxillary arch for the 1.3 mm ´ 8 mm mini implants. It was seen that group II, that is, the middle or premolar segment, showed maximum stability: 50.00, with a 95% confidence level in the interval 49.06–50.94. On the other hand, for the 2 mm ´ 8 mm mini implants, maximum stability was seen in group I, that is, the maxillary anterior or incisor segment. The maximum stability was 58.50, with a 95% confidence level in the interval 57.21 to 59.79.
One-way ANOVA test was used to make intergroup comparisons in the mandibular arch for the 1.3 mm ´ 8 mm mini implants. It was seen that group II, that is, the middle or premolar segment, showed maximum stability: 53.33, with a 95% confidence level in the interval 49.15 to 57.51. For the 2 mm ´ 8 mm mini implants, group II, that is, the middle or premolar segment, showed maximum stability: 59.17, with a 95% confidence level in the interval 57.24 to 61.09.
Levene’s test was done in the 3 groups in the maxillary arch and showed a significant difference between the 1.3 mm ´ 8 mm and the 2 mm ´ 8 mm mini implants in groups I and II, with a P-value less than .05. In group III, there was no statistically significant difference in stability between the 1.3 mm ´ 8 mm and 2 mm ´ 8 mm mini implants, but clinically, there was an increase in stability in the 2 kinds of mini implants.
Levene’s test was done in the 3 groups in the mandibular arch and showed a significant difference between the 1.3 mm ´ 8 mm and 2 mm ´ 8 mm mini implants, with a P-value less than .05. In group I, the anterior segment 2 mm ´ 8 mm mini implants showed maximum stability: 57.50. In group II, the middle segment 2 mm ´ 8 mm mini implants showed maximum stability: 59.17. In group III, the posterior segment 2 mm ´ 8 mm mini implants showed maximum stability: 55.83 (Table 1).
In the maxillary arch, Pearson correlation showed a significant increase in the primary stability of the 1.3 mm ´ 8 mm mini implants with an increase in the buccal cortical plate width, lingual cortical plate width, and implant contact surface area. A similar correlation was seen with the 2 mm ´ 8 mm mini implants (Table 2).
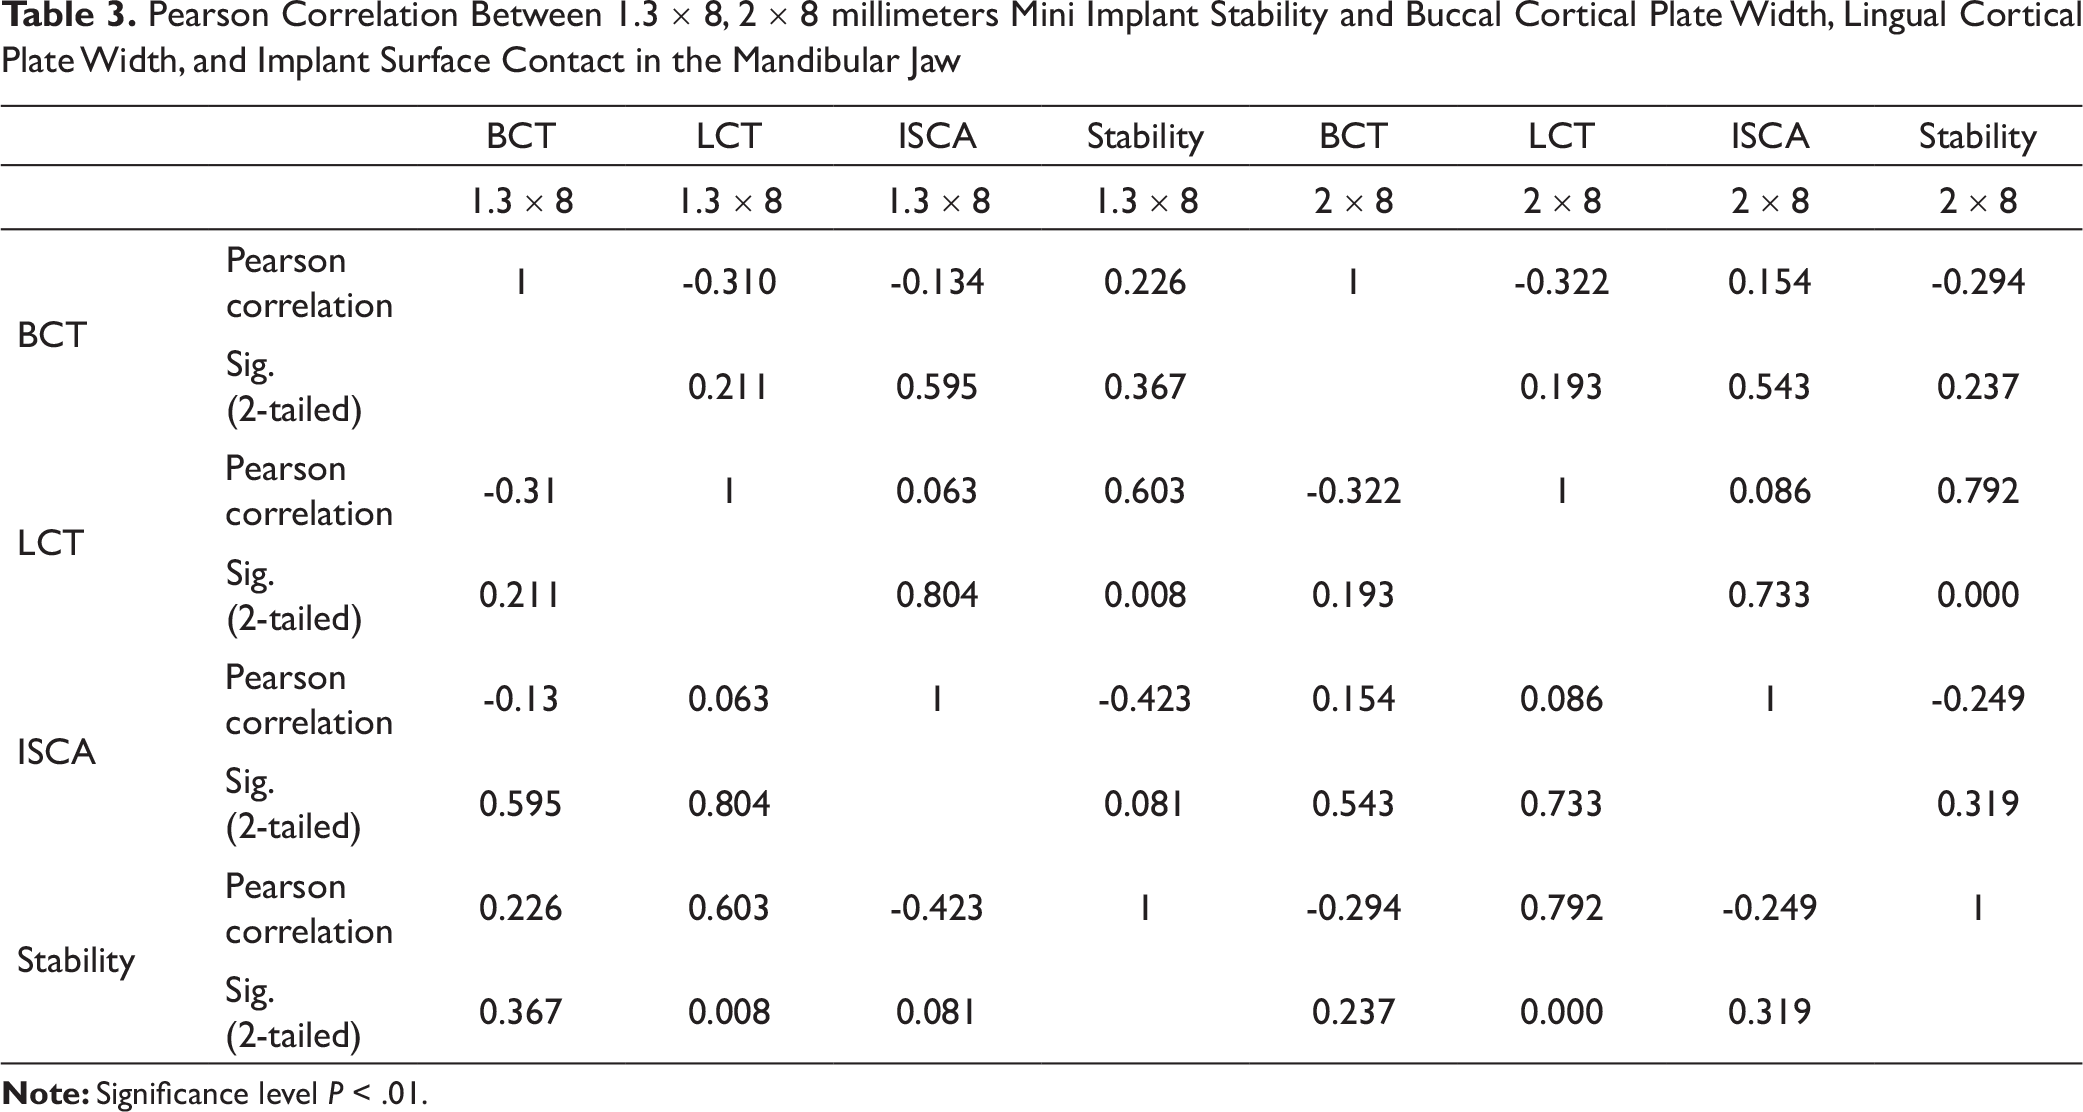
In the mandibular arch, Pearson correlation showed no significant increase in the stability of both types of mini implants with an increase in the buccal cortical plate width, lingual cortical plate width, and implant contact surface area (Table 3).
Discussion
Many studies have indicated the presence of correlation between PTVs (the values of Periotest) and ISQs (the values of OsstellTM and OsstellTM mentors). Lachmann et al 6 compared OsstellTM and Periotest in an in-vitro study and demonstrated that both methods are useful in the evaluation of implant stability, but the OsstellTM was found to be more precise than the Periotest in determining the actual dental implant stability at peri-implant defects. Further, OsstellTM can be used to assess implant stability any time after insertion. Winter et al 7 investigated the correlation between the 2 devices through a finite-element study and demonstrated that Periotest values had a good correlation with implant stability only in cases when there was no bone loss. Thus, in the present study, RFA was chosen as the method to evaluate mini-implant stability. However, Atieh et al 8 indicated the limitations of RFA measurements, which include uncertainty regarding biological parameters measured using RFA and their failure to reflect bone implant interface.
Equality of Variances by Levene’s Test in the Maxillary and Mandibular Jaws for Groups I–III
Pearson Correlation Between 1.3 ´ 8, 2 ´ 8 millimeters Mini Implant Stability and Buccal Cortical Plate Width, Lingual Cortical Plate Width, and Implant Surface Contact in the Maxillary Jaw
Pearson Correlation Between 1.3 ´ 8, 2 ´ 8 millimeters Mini Implant Stability and Buccal Cortical Plate Width, Lingual Cortical Plate Width, and Implant Surface Contact in the Mandibular Jaw
In the present study, the initial stability of mini implants of dimensions 1.3 mm ´ 8 mm and 2 mm ´ 8 mm were evaluated in various maxillary and mandibular sites. With the 1.3 mm ´ 8 mm mini implants, it was seen that in the maxillary and mandibular arches, IIa, that is, the premolar segment, showed the maximum primary stability, followed by Ia, that is, the anterior segment. The least primary stability was shown by IIIa, that is, the tuberosity/retromolar area. Maximum primary stability was seen in the premolar segment as maxillary and mandibular premolar segment exhibit D2 bone, which presents with dense to thick coronal cortical bone and an underlying coarse trabecular bone. 10 Park and Cho 11 concluded that in the mandible, the ideal site for mini-implant placement on the buccal cortical plate is extended from the roots of the first premolar to second molar. Heidemann et al 12 stated that there is a maximum space mesiodistally between the roots of the mandibular premolars.
The maximum primary stability of the mini implants (2 mm ´ 8 mm) was also assessed in both the jaws. The primary stability was found to be maximum in the maxillary anterior segment, followed by the premolar segment, but the difference between the anterior and premolar segments was not statistically significant. Both the anterior and premolar segments in the maxillary jaw exhibit the D2 bone and thus exhibit comparable stability of mini implants. In the mandible, it was found that the premolar segment exhibited maximum primary stability, which could be attributed to the D2 bone found in the mandibular premolar region. Researchers have concluded that as the diameter of a mini implant is increased, there is more surface contact between the mini implant and the bone, which results in improved stability of the implant. 13
In the current study, the effect of a mini implant’s diameter on its stability was evaluated, and it was found that an increase in diameter resulted in a statistically significant increase in primary stability in both the jaws except for the maxillary tuberosity region. In the maxillary tuberosity region, an increase in stability due to the increased diameter of the mini implants was observed, but it was statistically insignificant. Berens et al14 also concluded in their study that mini implants of 2 mm diameter had enhanced success as compared to smaller-diameter mini implants in the mandible. The posterior maxillary segment exhibits D4 bone features, including a thin cortical plate, less dense trabeculae and lower medullary strength. D-4 being a weaker bone has less surface contact area between an implant and bone, by increasing the implant diameter we can increase surface contact area which is similar to dense cortical bone and hence attain better stability. In this study, increase in the diameter of mini implants led to an increase in the implant stability quotient, but the difference seen in the primary stability of the mini implants of 2 different sizes placed in the maxillary tuberosity segment was not statistically significant. Kravitz et al 15 placed 8-mm-long mini implants of 1.3 mm and 2 mm diameters at 45-degree angulation in the D4 bone. They found a high failure rate of up to 50% and suggested that the tuberosity segment is not an ideal site for mini-implant placement, as clinically acceptable primary stability was not observed.
The effect of the contact surface area of bone on mini-implant stability was studied, and a statistically significant increase in the stability of the mini implants was observed with an increase in the implant bone contact surface area in the maxilla. Similar results was found with an increased diameter of 2×8 mm mini implants when compared to a 1.3 × 8mm mini implants. Retention of an implant in the bone is mechanical, which depends on the density of the bone and the interface of the mini implant and the bone. As the contact surface area between the mini implant and the bone increases, stress is distributed across a wider surface, and if the contact surface area is smaller, then stress will be concentrated in a smaller area; in the latter situation, retention of the mini implant will depend upon the bone density. Hedia 16 also observed that as the width or length of a mini implant is increased, the contact surface area between the implant and the bone also correspondingly increases, and this provides more functional area for stress distribution. Cancellous bone is scarce in the mandibular jaw in comparison to the maxillary jaw, and so, in the former, stresses are concentrated in the cortical bone with weak or no cancellous bone, which could be the probable reason for more failures of mini implants in the mandible compare to those in the maxilla.
In the present study, it was seen that in the mandible, no significant increase in mini-implant stability was found with an increase in the implant contact surface area for both kinds of mini implants, that is, the 1.3 mm ´ 8 mm and 2 mm ´ 8 mm mini implants. In mandibular anterior segment, buccal cortical plate width is less when compared to premolar and molar segment. Despite this fact we were able to achieve higher stability due to bicortical anchorage with 8mm mini implant. In the mandibular premolar segment, the thickness of the implant contact surface area was moderate, but the stability achieved was more. The mandibular premolar segment exhibits the D2 bone, in which the mini implants, during loading, show lower functional stress at the mini-implant–bone interfaces and enhanced anchorage. Misch and Kircos 17 compared the D2 and D3 bones and found that the D2 bone has approximately 47% more final compressive strength. Cortical bone thickness in the molar region was more compared to that in the anterior and premolar segments, but the stability achieved in the former was not as much, compared to that in the anterior and premolar segments. The mandibular posterior segment exhibits the D3 bone, which has lower compressive strength but greater cortical thickness than the mandibular anterior and premolar segments. When a mini implant is placed in the D3 bone, microfracture occurs due to the low compressive strength. Sowden and Schmitz 18 suggested that while placing mini implants in the mandibular jaw, which has high density or a wide cortical plate, the self-drilling procedure would reduce stability by inducing excessive stress on the outer surface of the cortical bone. Due to the increased bone thickness, the primary stability of mini implants was found comparable to that of mini implants in the mandibular premolar and anterior segments.
Limitations
The limitations of the study include the small sample size and it being an in-vitro study. Further, in-vivo studies evaluating more parameters, incorporating a larger sample size, and including clinical testing are suggested.
Conclusion
The increase in mini implant diameter from 1.3 mm to 2 mm resulted in increased primary stability.
A statistically significant increase in the primary stability of mini implants with an increase in the implant bone contact surface area was found in the maxilla. In the mandible, no significant increase in mini implant stability was found with an increase in the implant contact surface area.
In the maxillary and mandibular arches, maximum primary stability was observed in the premolar region.