
Abstract
Abstract
Objective: To assess and compare the tensions and deformations (stresses and strains) generated after application of two types of forces (traction and torsion) in miniscrews of two different materials (titanium and stainless steel) placed at five different angulations.
Materials and Methods: Three-dimensional models of the posterior maxillary area and the mini-implants were constructed using computer-aided design software program (CATIA P3 V5-6 R2015 B26 / 2016; Dassault Systèmes). Titanium and stainless steel materials were used for miniscrews. The area constructed was in between the maxillary second premolar and first molar. The models with mini-implants were inserted at five different angulations (30°, 45°, 60°, 75° and 90°). Torsional and tractional forces were applied on these implants, and the models were solved using ANSYS 10.0. Stress generated in implant and in the cortical and cancellous bones was evaluated and compared at all the five angulations.
Results: Stress generated in stainless steel mini-implant during torsional and linear force application was less when compared with titanium mini-implant. Also, stress generated in implants of both materials increased as the angle increased from 30° to 90°. Difference in stress generated by stainless steel implant in the cortical bone for both linear and torsional forces was less when compared with titanium implant, whereas for cancellous bone, the difference was insignificant at all the angles.
Conclusion: Irrespective of angles, difference in stress generated in stainless steel implants and titanium implants for both the forces was not significant, and hence, stainless steel implants can be used effectively in a clinical setting.
Introduction
Control of anchorage is a paramount factor in successful outcome of orthodontic treatment. 1 Louis Ottofy, in 1923, defined anchorage as “the base against which orthodontic force or reaction of orthodontic force is applied.” 2 The use of conventional dental anchorage might not be sufficient nor effective in terms of providing absolute dental anchorage. Extraoral appliances such as headgear require extensive patient cooperation, and anchorage loss is often observed despite the use of this appliance. Intraoral appliances such as lingual arch, Nance palatal button and transpalatal arch do not require any patient compliance, but they are deficient in providing absolute anchorage in all three planes of space. 3 This deficiency has led to increased interest and research in temporary anchorage devices (TADs) such as osseous dental implants, miniplates, mini-implants, or microscrews, which appeal to practitioners because they can provide absolute anchorage and do not depend on patient compliance. 4 Among all these TADs, minicrews have been used increasingly for the purpose of orthodontic anchorage because they do not osseointegrate, are easy to place and remove, have low cost and can be loaded immediately after placement.5, 6 The success rates of orthodontic mini implants have been reported differently because of several factors affecting their success rates.7-9 Researchers have suggested certain biomechanical factors, such as small diameter,10, 11 root proximity, 12 cortical bone thickness, 3 sight of implantation, 3 orthodontic force level, 12 high mandibular plane angle, 10 and orthodontic force level, 13 that might be related to failure of mini-implants.
As TADs are not osseointegrated, how various insertion parameters affect their ability to withstand these forces and the magnitude of forces they can withstand are not completely understood. The remodelling process in the bone, occurring at the implant bone interface, and mechanisms of screw mobilization are correlated with the structural response of the bony tissue to the miniscrew and then to the stress/strain field developing within the miniscrew itself and also within the surrounding bone, both cortical and cancellous. 14 The proper insertion angle of mini implant is significant for cortical anchorage, and various studies have shown that perpendicular implant placement to the long axis of tooth offers added stability to the orthodontic loading. The proper angle of micro-implant insertion is important for cortical anchorage, patient safety and biomechanical control. However, the actual impact of different insertion angulations on stability is unknown. Furthermore, comparative evaluation of biomechanical performance of titanium and stainless steel on application of both the torsional and linear force is unavailable. Liu et al. 3 suggested an oblique loading direction reduces stress on mini implant compared with the perpendicular direction of force. Lin et al. 15 suggested that the direction of orthodontic force had no significant effect on cortical bone stress.
Aim and Objectives
To assess and compare the tensions and deformations (stresses and strains) generated after application of two types of forces (traction and torsion) in miniscrews of two different materials (titanium and stainless steel) placed at five different angulations.
Materials and Methods
A CBCT (Cone Beam Computed Tomography) scan of whole maxilla was obtained using Kodak 9000 C 3D scanner. A total of 587 slices of the maxilla were obtained. Using a software, these images were then later sent to Osteo 3DTM for converting them into Standard Triangulation Language (.stl) format. From these images, a 3D model of maxilla was created, and also, the model was converted into a 3D printable format (.stl). 16 This 3D printable model was converted to Initial Graphic Exchange Specification format. This model was then imported into computer-aided design software program (CATIA P3 V5-6 R2015 B26 / 2016; Dassault Systèmes). Model boundaries were set after 3D models of the posterior right maxilla and corresponding maxillary dentition (second premolar and first molar) were generated. These were established at: the interproximal region between the maxillary right second premolar as the mesial boundary; the distal aspect of the maxillary first molar as the distal boundary; the complete coronal anatomy of second premolar and first molar teeth as the inferior boundary; and all maxillary structures up to 5 mm superior to tooth apices as the superior boundary. The cortical, trabecular bone interface was sequentially created by modelling a second surface offset 1.5 mm internal to the external cortical surface in order to define the cortical and trabecular bone boundary. Now, the modelling of teeth (maxillary first molar and second premolar of upper right side) was done. The model of teeth included lamina dura, PDL (Periodontal Ligament), dentine and enamel as suggested by Pollei. 17
Modelling of Implant
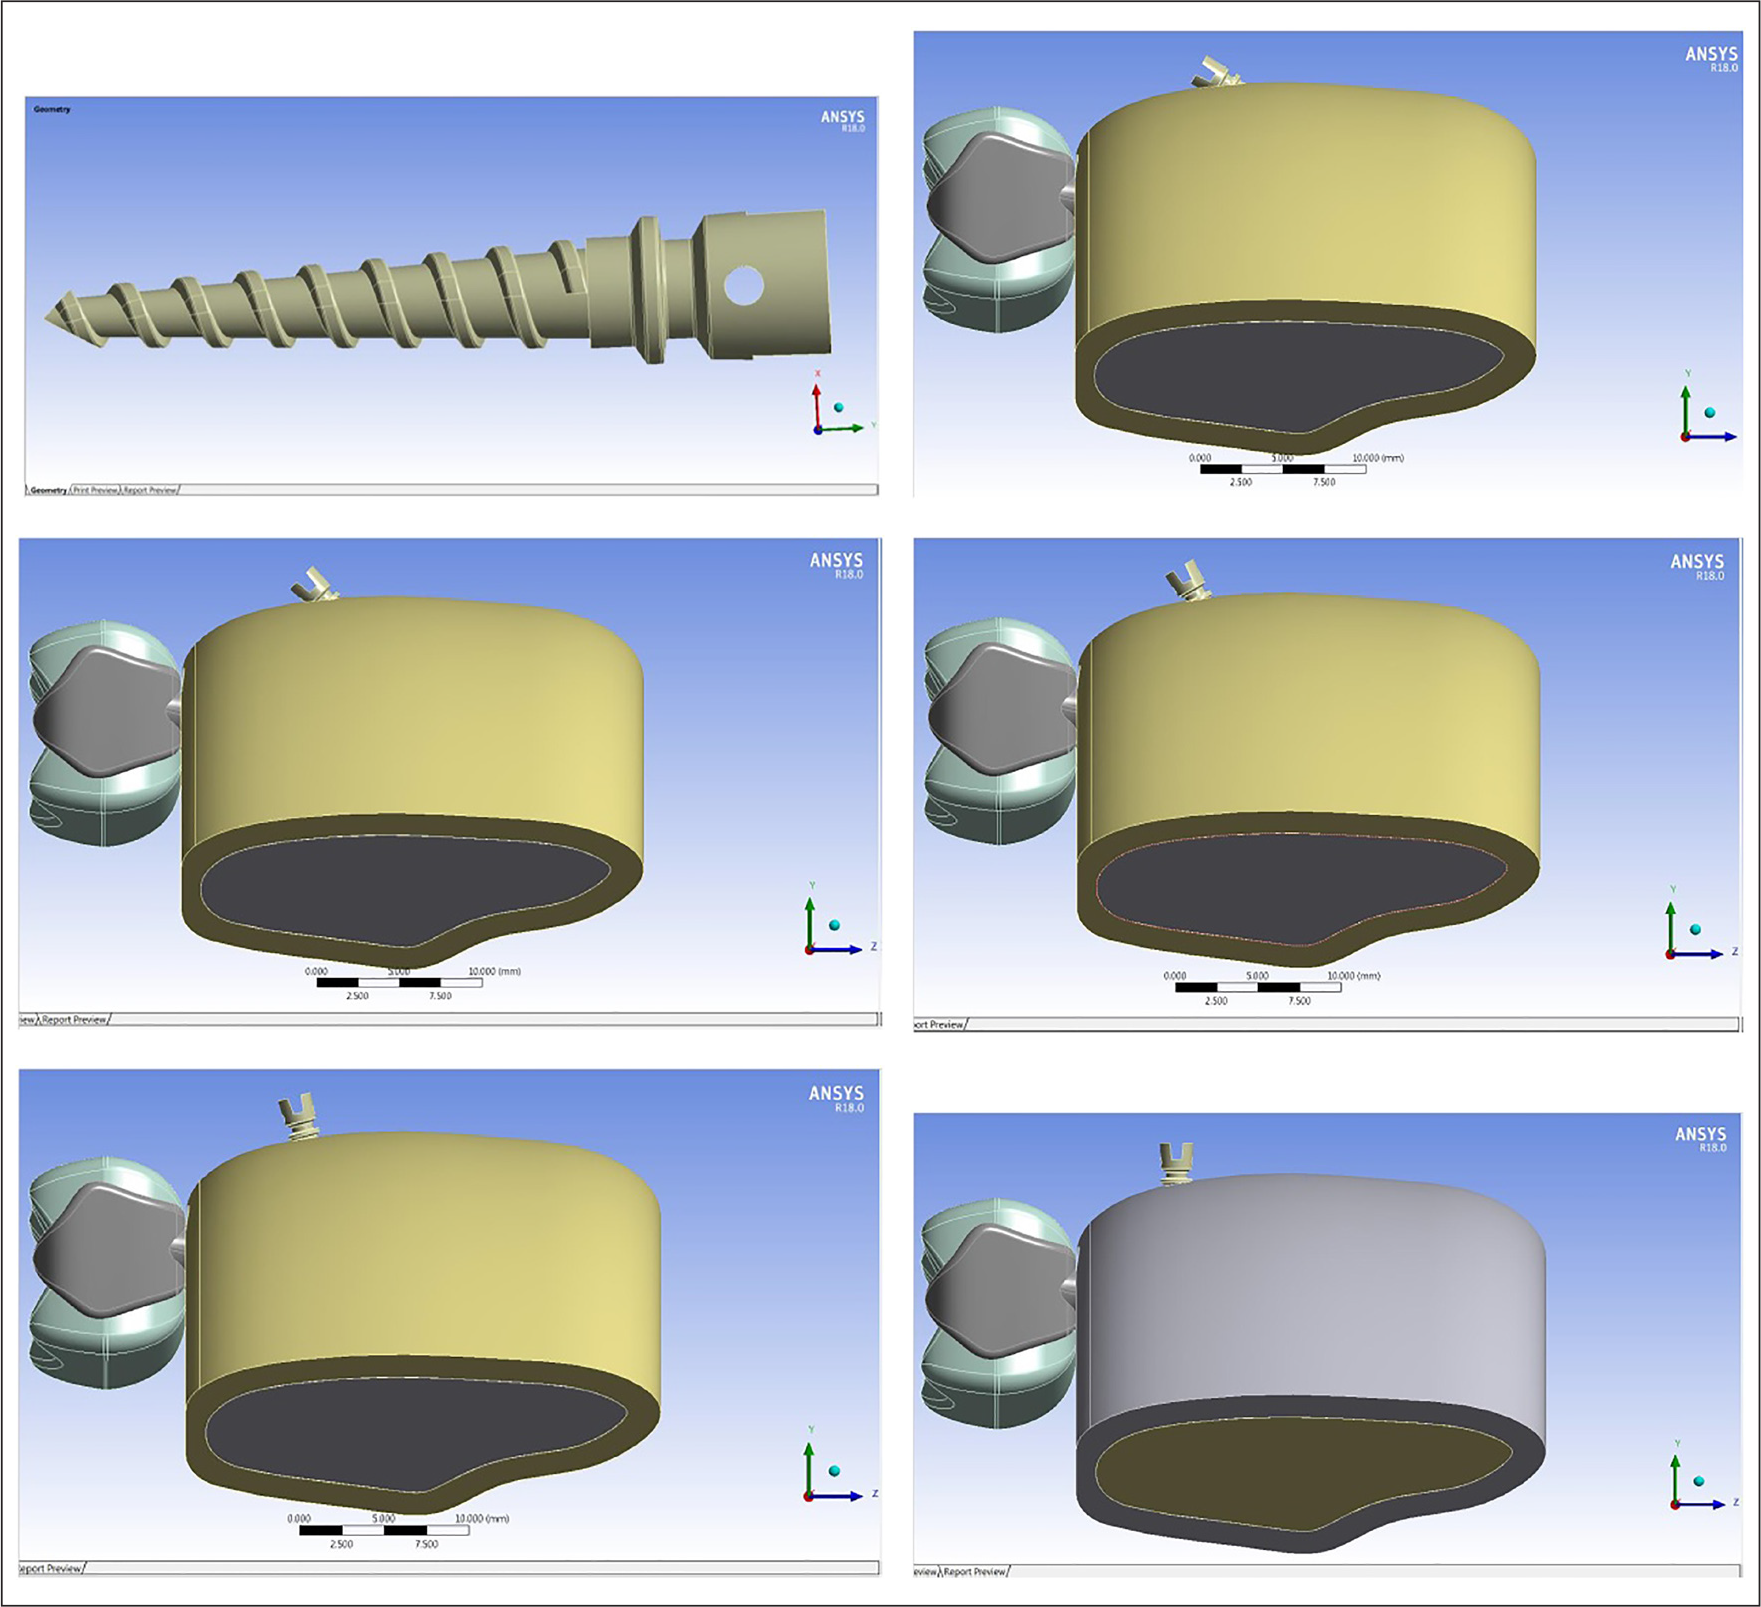
The implant used in this study was 7 mm in length, and the diameter was 1.3 mm. The surface anatomy of the implant was assessed using a contracer machine (Mahr Metrology, Germany). The contracer machine accurately measures the anatomy of any symmetrical object. These measurements are accurate to the level of one-thousandth part of a millimeter. Using the report generated by the contracer machine, the modelling of the implant was done in the CATIA software (Figure 1a). All the parts were assembled in the software, and the implant was inserted 8 mm apical to the interdental crest as this area has the greatest mesiodistal inter-radicular distance. 18 Five different models were created with the angulation of the implant at 30°,45°, 60°, 75° and 90°individually with respect to the long axis of the cortical bone (Figure 1b-f).
In our study, D3 type of bone was simulated as it is the most common type of bone that is found in this area. 19 The mechanical properties of the biological and implant components were put up in the software.20, 21
These models were then analyzed in the ANSYS software. Torsional force of 20 N and linear force of 150 g were applied onto the implant as used by Arantes et al. 22 In this study, an extensive 393,208 nodes and 157,138 elements were meshed.
The torsional force was applied considering the implant is in its place and not while inserting. The linear force was applied on the center of the implant head to simulate the situation when en masse retraction of anterior teeth is done using a coil spring.
After application of force, both the torsional and linear maximum stresses generated on the implant and in the bone (cancellous and cortical) at different angles were recorded.
(a–f) a- Modelling of the mini-implant done using CATIA software; b-f- Five different models were created with the angulation of the implant at 300,450, 600, 750, 900 individually, with respect to the long axis of the cortical bone.
Stress Generated in Implant on Application of Torsional and Linear Force at Different Angulations
Results
The statistical analysis was done using the Statistical Package for the Social Science (SPSS version 22, Armonk, NY: IBM Corp). Descriptive statistics of mean and standard deviation for the stress generated in the implant and bone on application of torsional and linear forces were calculated. Inferential statistics were applied to compare the stress generated between stainless steel and titanium implants using independent samples t-test.
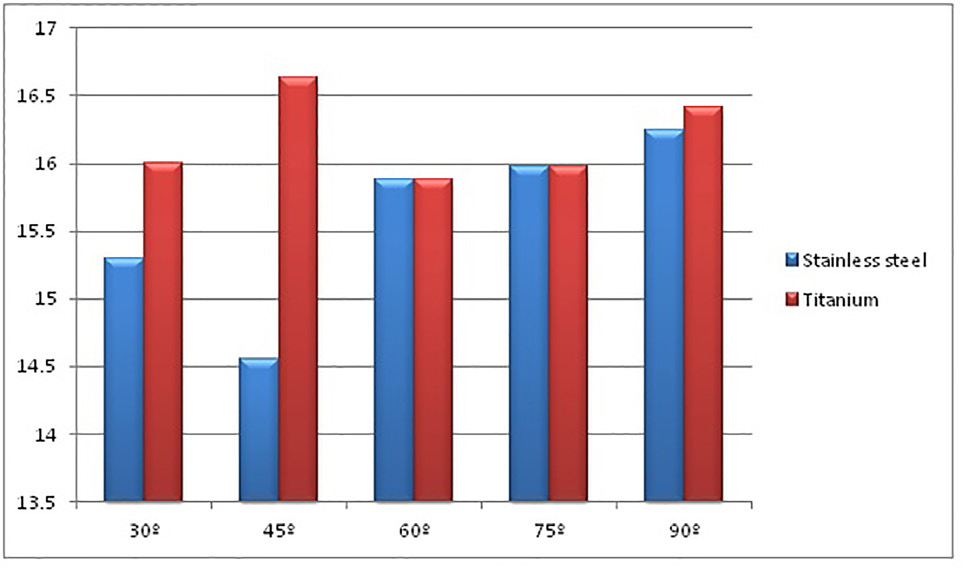
Table 1 depicts the stress generated in implants placed at different angulations on application of torsional and linear forces (Figures 2 and 3 respectively).
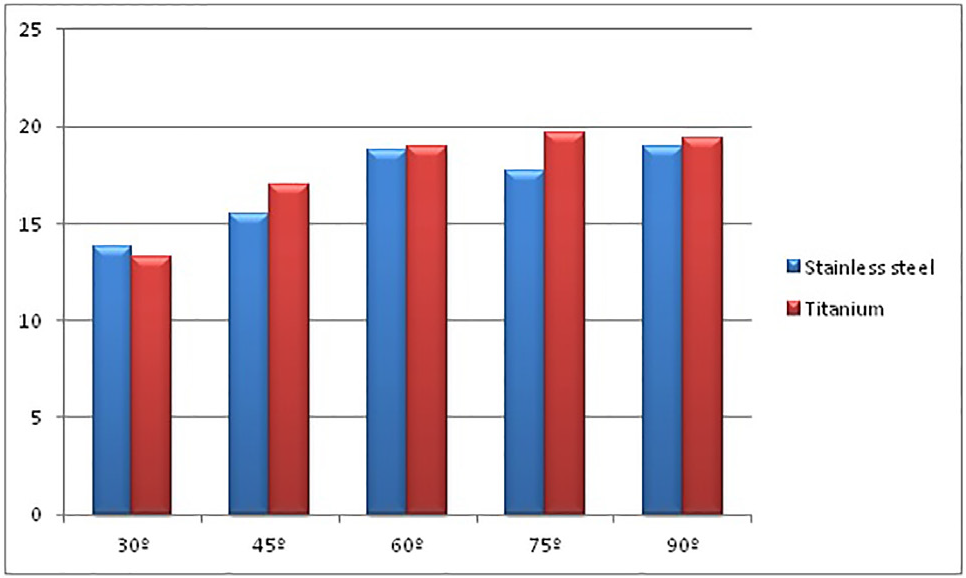
As the angle of implant placement increases from 30° to 90°, the stress generated in both the types of implants increases on application of torsional as well as linear force. The stress generated in stainless steel implant under torsional force at 30° was 15.3 MPa, while in titanium implant, it was 16.009 MPa. At 90°, it increased to 16.249 MPa in stainless steel implant, whereas in titanium implant, it increased to 16.416 MPa. On application of linear force at 30°, the stress generated in stainless steel implant was 13.781 MPa, while in titanium implant, it was 13.217 MPa. As the angle increased to 90°, the stress generated in stainless steel implant was 18.924 MPa and in titanium was 19.395 MPa. Thus, it was seen that the stress generated in stainless steel implant is less as compared with titanium implant. Table 2 shows the comparison of stress generated in both the types of implants on application of torsional and linear forces. This difference was not statistically significant. The p-value for comparison of stress under torsional force was p = 0.10, while for linear force, it was p = 0.66.
Graphical depiction of stress distribution in implants placed at different angulations on application of torsional forces
Graphical depiction of stress distribution in implants placed at different angulations on application of linear forces
Comparison of Stress Generated Between Both the Types of Implants on Application of Torsional and Linear Forces
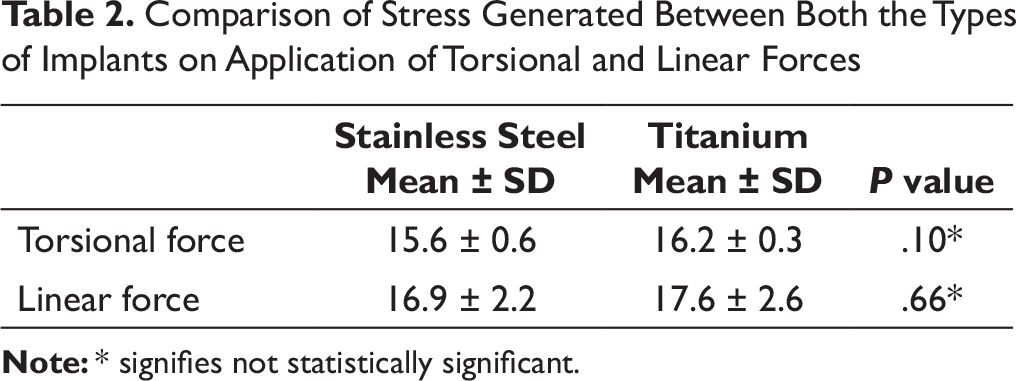
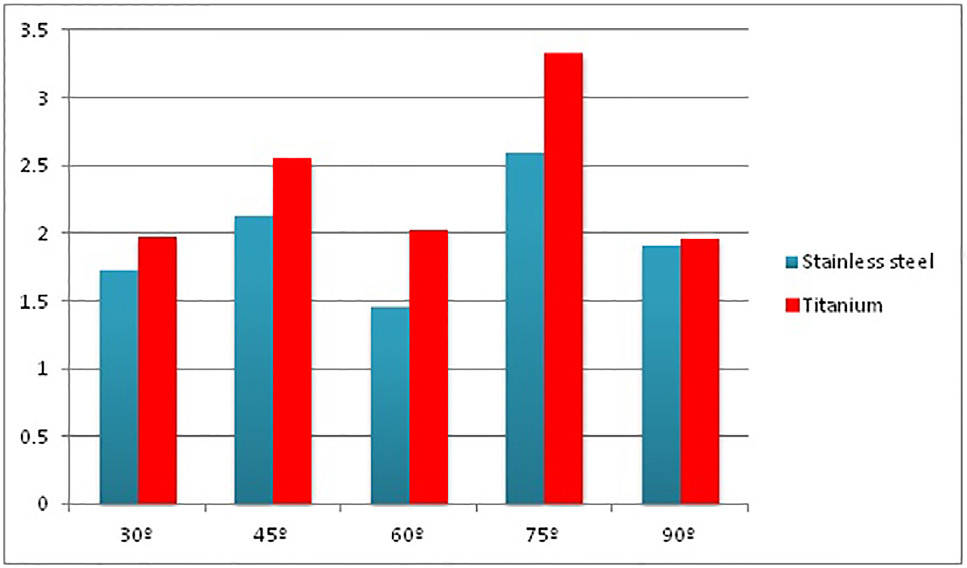
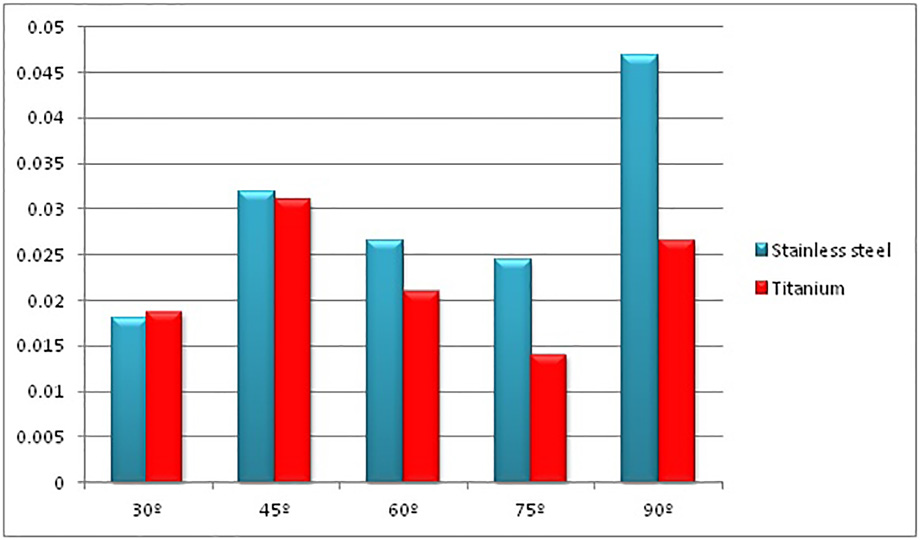
Table 3 shows the stress generated in a bone (cortical and cancellous) loaded with stainless steel and titanium implants on application of torsional force. At 30° implant insertion angle, the stress generated in cortical bone loaded with stainless steel implant was 1.72 MPa, whereas for titanium, it was 1.97 MPa. The stress increased at 45° to 2.12 MPa and 2.55 MPa in stainless steel and titanium implants, respectively. It reduced at 60°, while it increased at 75°. At 90°, the stress generated was the same, that is, 1.9 MPa in cortical bone loaded with both types of implants. The stress generated in cancellous bone loaded with stainless steel and titanium implants increased as the implant insertion angle increased, but there was no significant difference between the implants at different angles of insertion (Figures 4 and 5 respectively).
Torsional stresses generated in cortical bone loaded with stainless steel and titanium at different angulations
Torsional stresses generated in cancellous bone loaded with stainless steel and titanium at different angulations
Stress Generated in Bone on Application of Torsional Force at Various Angles
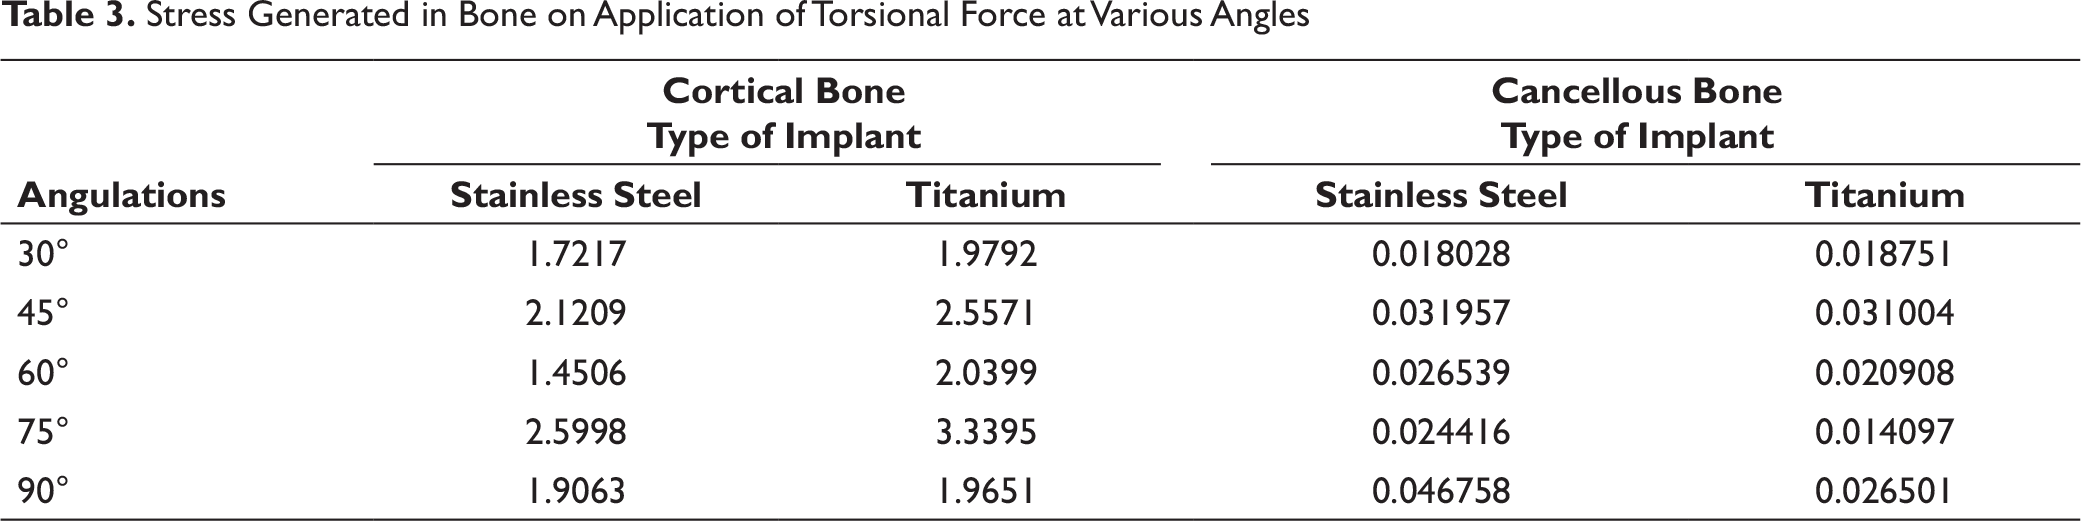
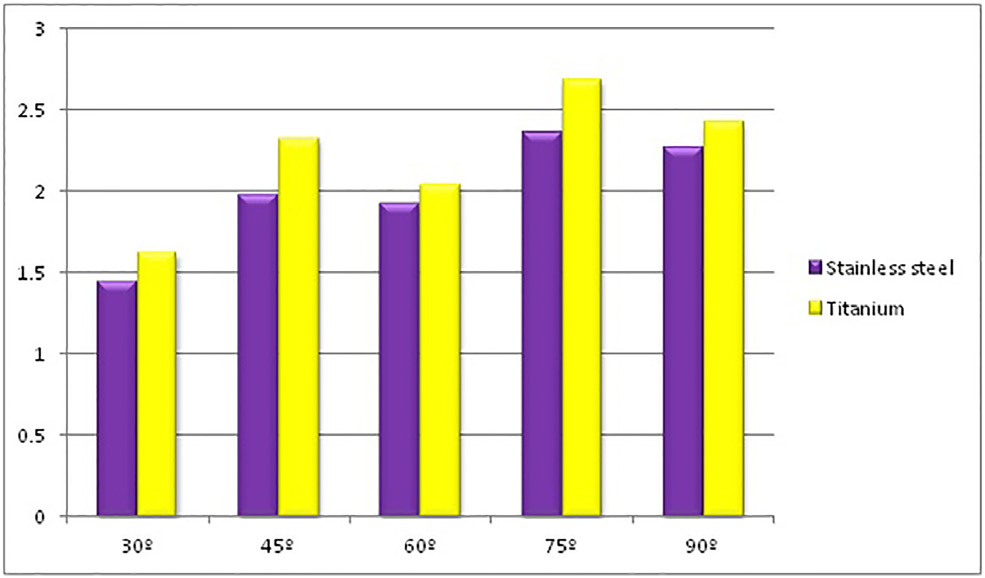
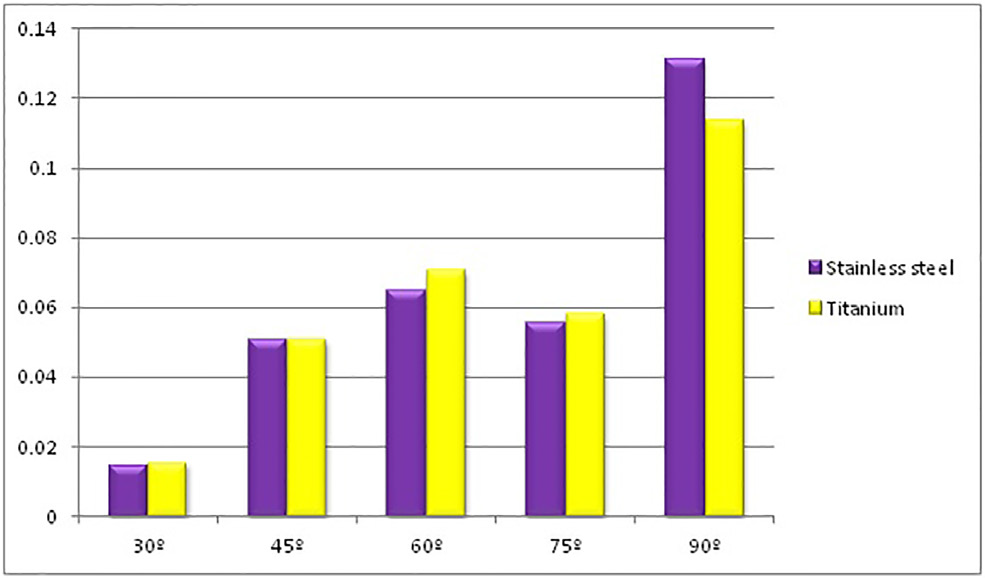
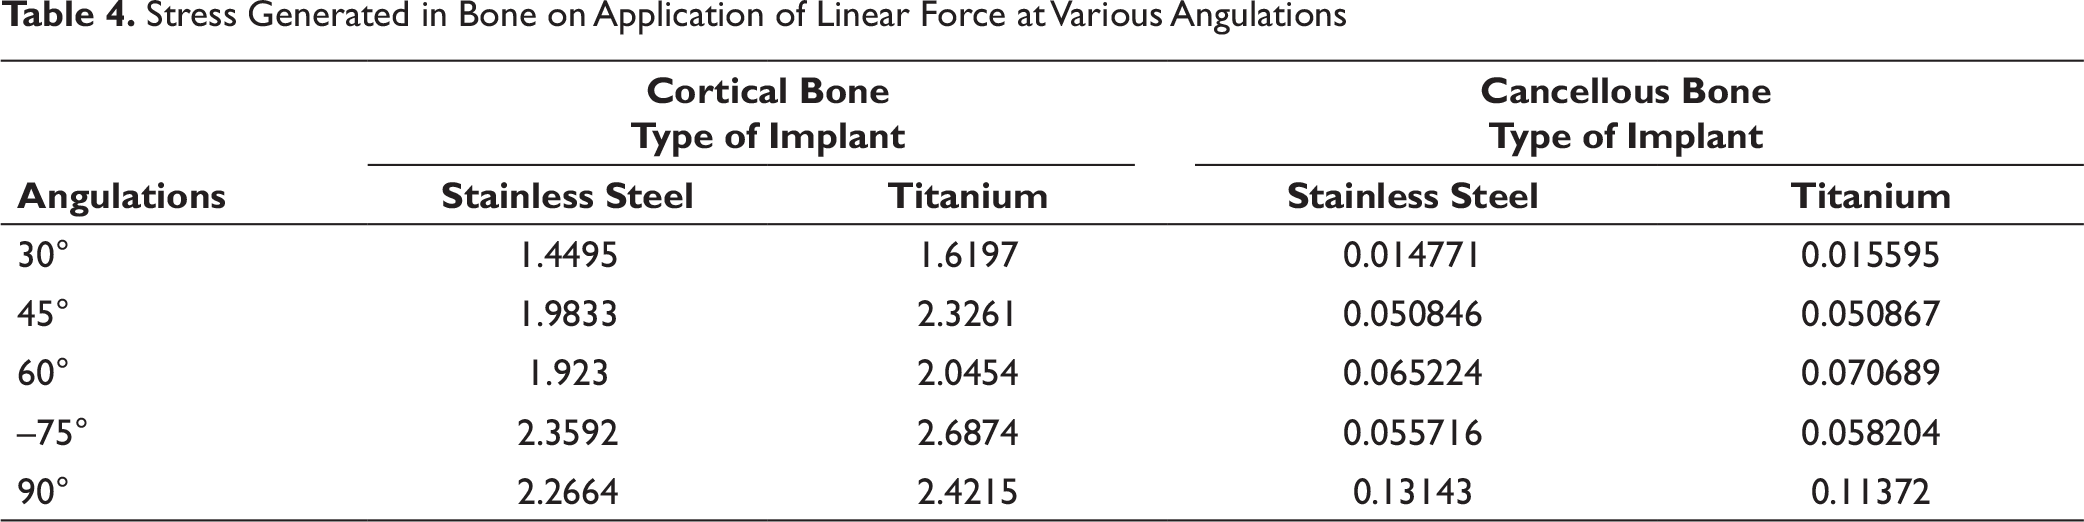
Table 4 depicts the stress generated in a bone (cortical and cancellous) loaded with stainless steel and titanium implants on application of linear force. At 30° implant insertion angle, the stress generated in the cortical bone loaded with stainless steel implant was 1.44 MPa, while with titanium implant, it was 1.62 MPa. At 45° angle, it increased to 1.98 MPa and 2.32 MPa in stainless steel and titanium, respectively. At 60° angle, there was no significant change in the stress generated in cortical bone with both types of implants. At 75°, it increased. At 90° angle, it increased to 2.26 MPa and 2.42 MPa in a bone loaded with stainless steel and titanium implants, respectively. The amount of stress generated in the cancellous bone loaded with stainless steel as well as titanium implant increased as the implant insertion angle increased from 30° to 90° (Figures 6 and 7 respectively).
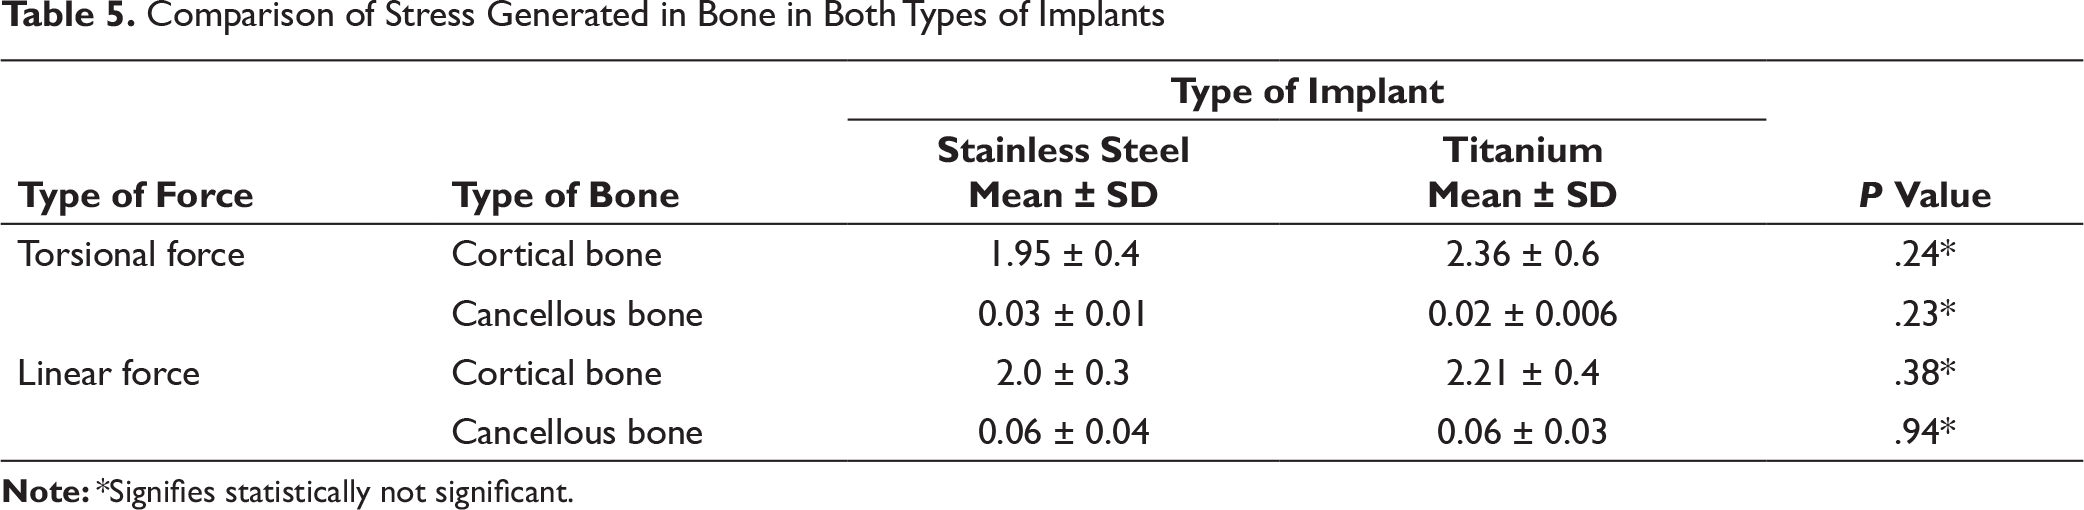
Table 5 shows the comparison of stress generated in a bone loaded with stainless steel and titanium implants on application of torsional and linear forces. Under both the forces, the amount of stress generated in cortical bone loaded with stainless steel implant was less as compared with titanium, although this difference was not statistically significant. The amount of stress generated in cancellous bone on application of both types of forces was almost equivalent in stainless steel and titanium implants.
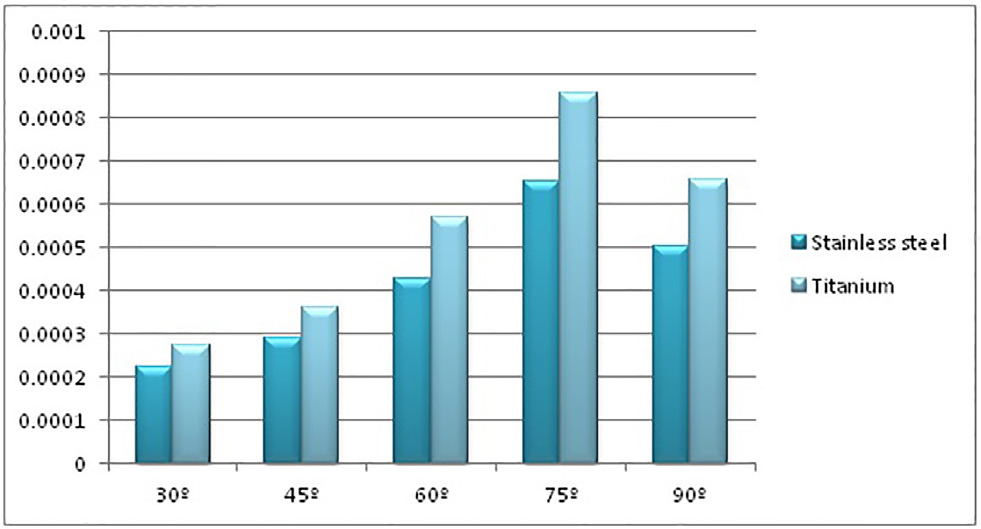
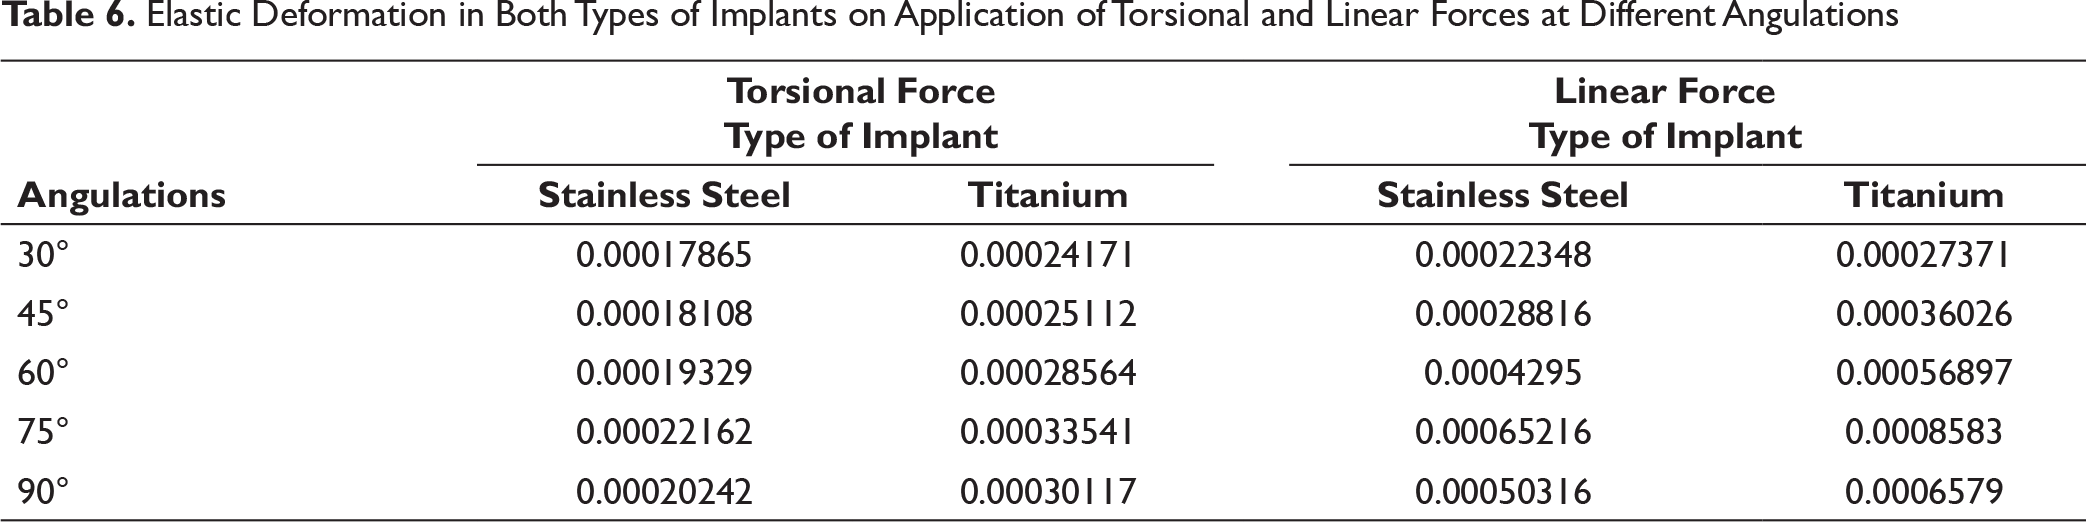
Table 6 depicts the elastic deformation in both types of implants on application of torsional and linear forces at different angulations of implant placement. The elastic deformation also increased in both, stainless steel and titanium implants, as the implant insertion angle increased from 30° to 90° on application of torsional and linear forces (Figures 8 and 9 respectively).
Linear stresses generated in cortical bone loaded with stainless steel and titanium at different angulations
Linear stresses generated in cancellous bone loaded with stainless steel and titanium at different angulations
Stress Generated in Bone on Application of Linear Force at Various Angulations
Elastic deformation in both types of implants on application of torsional forces at different angulations
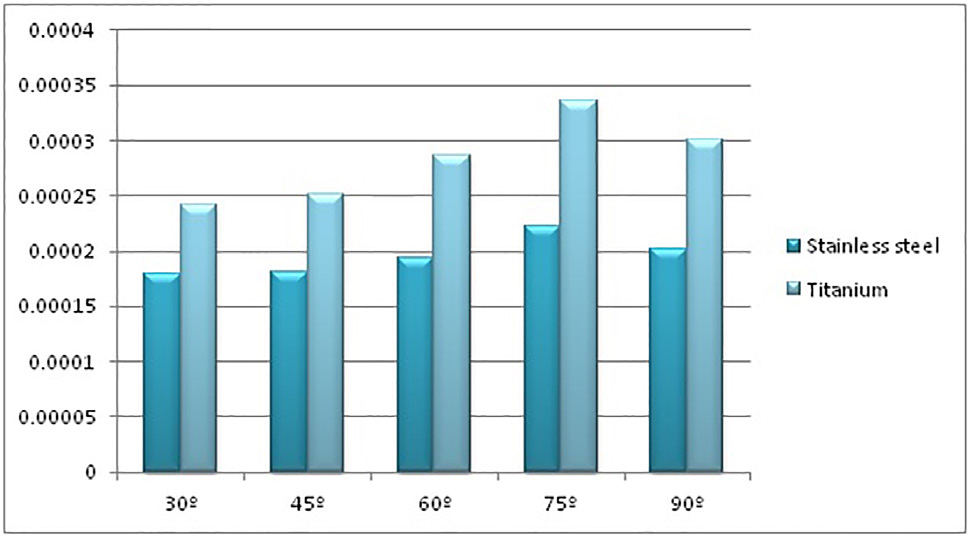
Elastic deformation in both types of implants on application of linear forces at different angulations
Comparison of Stress Generated in Bone in Both Types of Implants
Elastic Deformation in Both Types of Implants on Application of Torsional and Linear Forces at Different Angulations
Comparison of Elastic Deformation on Application of Torsional and Linear Forces
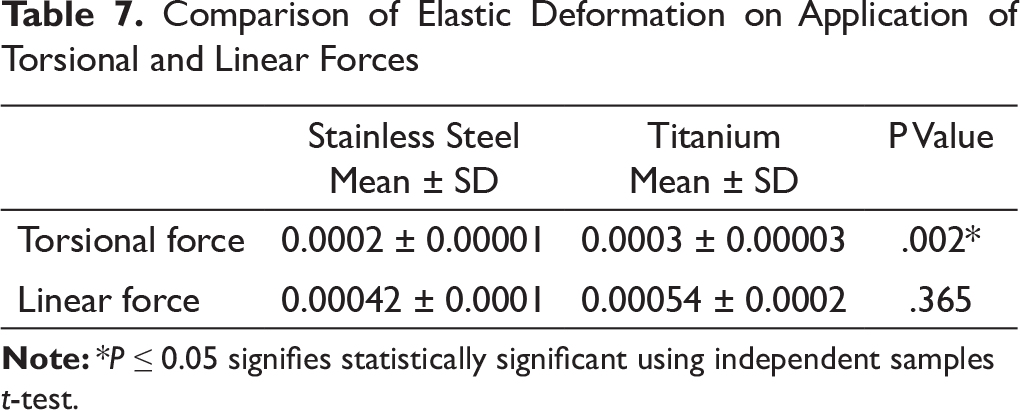
Table 7 shows the comparison of elastic deformation between the stainless steel and titanium implant on application of torsional and linear forces. The difference in the amount of elastic deformation between stainless steel and titanium implant was statistically significant (p = 0.002) under torsional force, whereas it was not significant under linear force at different angles of implant insertion.
Discussion
According to literature, the placement angle for the mini-implant may vary between 30° and 90° depending on the site of placement. In the present study, biomechanical performance of titanium and stainless steel implants at different angulations was studied so that more evidence can be gathered regarding the material of mini-implant in the bone, so that the least amount of stresses are generated in both the implant and bone and, thus, minimize the chances of failure.
It has been postulated that the insertion angle of 30° to 70° from the occlusal plane (ie, 20° to 60° to the cortical bone long axis) is optimal and it will allow sufficient bone engagement. This will increase the potential for maximal anchorage, while preventing miniscrew slippage along the surface of the bone during insertion.23, 24 Acutely angled implants may have more cortical bone contact; the chances of slippage of mini-implant are more as the acuteness of implant increases, especially if pilot hole is not used as a guide. 22
The implant angulation has a significant effect on the bone contact. The less is the angulation of implant to the long axis of buccal alveoli, the more is the contact between the implant and the cortical bone. 25
In the present study, when the comparative evaluation was done of stainless steel and titanium mini-implants at different angulations and two different forces, it was found that for both the titanium mini-implants, when linear force was applied, the stress generated in the implant increased as the angle increased from 30° to 90°. The maximum stress generated in the implant during application of linear force was in the range of 13.217-19.395 MPa. These findings are in accordance with the findings of Brar and Dua 26 in their finite element method, where it was seen that, as the angle of mini-implant increases from 45° to 90°, the maximum stress generated in the implant also increases.
Our findings are also in accordance with those of Sivamurthy et al., 27 which show that as the angle of implant insertion increases from 30° to 60°, stress generated in the implant also increases. In their study, they used a force of 2N to simulate the force of anterior en masse retraction.
Machado 28 had also found that, as the angle of implant insertion increased from 30° to 90°, stress induced in the implant also increased. They used a force of 200 g perpendicular to the long axis of miniscrew to simulate the reactionary force during en masse retraction.
On the contrary, Motoyoshi et al. 29 in their study, found that the maximum stress generated in the implant ranged from 9.43 to 15.13 MPa. They applied a 2N force to the head of the mini implant at 45° to the bone surface. In their study, six types of finite element models were designed to show various thread pitches from 0.5 to 1.5 mm. The difference in the maximum stresses generated in the implant may be attributed to the different pitch size and also to the different designs of the implant. The implants used in their study were cylindrical, whereas in our study, conical implants were used. Also, the force used in our study was 1.47 N, whereas in their study, force was used was 2 N.
In the present study, when linear force of 150 g was applied to both the mini-implants, the stress generated in the implant increased as the angle increased from 30° to 90°. On the contrary, Pollei 17 found that as the angle increased from 45° to 90°, the stress generated in the implant decreased. Our study showed that the greatest stress developed in stainless steel implant was at 90°, which was 18.924 MPa, and in titanium was 45°, which was 19.395 MPa. Whereas in Pollei’s study, the maximum stresses in the implant were greatest at 45° for both stainless steel and titanium, which were 89.3 and 82.75 MPa, respectively.
Also, contrary to our study, Suzuki et al. 30 had found that the greatest stress generated in their study was at 750° angle (75.2 MPa) for titanium implant. This great difference in the stress value of the mini-implant at that angulation may be attributed to increased value of force (2N) and material properties. In their study, they used pure titanium and not the surgical grade titanium.
The stress generated in stainless steel implant under torsional force at 30° was 15.3 MPa, while in Titanium implant, it was 16.009 MPa. At 90°, it increased to 16.249 MPa in stainless steel implant, whereas in titanium implant, it increased to 16.416 MPa. These findings are consistent with the finding of Maya et al. 31 who, in their study, found that as the angle of insertion of mini-implant increases, the torque required to insert the implant also increases. Though theirs was a cadaver-based study, it can be postulated that as the insertion torque is increasing with the increase in the insertion angle, stress generated in the implant is also increasing.
Stress generated in the bone (cortical and cancellous) was evaluated for both stainless steel and titanium mini-implants at all the five angulations for both types of forces. Stress was generated in a bone (cortical and cancellous) loaded with stainless steel and titanium implants on application of torsional force. At 30° implant insertion angle, the stress generated in cortical bone loaded with stainless steel implant was 1.72 MPa, whereas for titanium, it was 1.97 MPa. The stress increased at 45° to 2.12 MPa and 2.55 MPa in stainless steel and titanium implants, respectively. It reduced at 60°, while it increased at 75°. At 90°, the stress generated was the same, that is, 1.9 MPa in cortical bone loaded with both types of implants. The stress generated in cancellous bone loaded with stainless steel and titanium implants increased as the implant insertion angle increased, but there was no significant difference between the implants at different angulations. These findings are consistent with the finding of Arantes et al. 22 who compared the biomechanical performance of mini-implants of two different brands (SIN and RMO), when a torsional force of 20 N was applied when the implant was inserted at two angulations (45° and 90°). Both the implants were manufactured using the surgical grade titanium. They selected an implant of one SIN brand as superior over the other, and the stresses generated by that implant at 45° in cortical bone, cancellous bone and the implant itself were 245.65, 4.69 and 542.44 MPa (×10-3 mm/mm), respectively, and at 90°, stresses generated in cortical bone, cancellous bone and the implant were 93.69, 2.92 and 186.68 MPa (×10-3 mm/mm), respectively.
These findings are also in accordance with the findings of Maya et al. 31 who used two types of mini-implants (cylindrical and conical); the maximum insertion torque for cylindrical implants at 60° was 14.13 MPa and at 90° was 17.27 MPa. On the other hand, the maximum insertion torque values for the conical mini implants were 11.40 Ncm for the 60° angle and 14.40 Ncm for the 90° angle. It must be noted that their study was a split mouth study, and it was done on human cadavers.
In our study, stress generated in a bone (cortical and cancellous) loaded with stainless steel and titanium implants on application of linear force was evaluated. At 30° implant insertion angle, the stress generated in cortical bone loaded with stainless steel implant was 1.44 MPa, while in bone with titanium implant, it was 1.62 MPa. At 45° angle, it increased to 1.98 MPa and 2.32 MPa in stainless steel and titanium, respectively. At 60° angle, there was no significant change in the stress generated in cortical bone with both types of implants. At 75°, it increased. At 90°, it increased to 2.26 MPa and 2.42 MPa in the bone loaded with stainless steel and titanium implants, respectively. The amount of stress generated in the cancellous bone loaded with stainless steel as well as titanium implant increased as the implant insertion angle increased from 30° to 90°. These findings are in accordance with values obtained by Perillo et al. 32 when only 30° and 60° angles are considered. The implant was inserted at five angles (30°, 60°, 90°, 120° and 150°) and a linear force of 2N was applied at two angles (0° and 30°). Considering only the first three implant angulations, the maximum stress generated was at 60° implant angulation, which was 58 and 35 MPa for cortical and cancellous bones, respectively. When direction of force was at 30°, the maximum stress generated was also at 60° implant angulation, which was 62.3 and 33.4 MPa, respectively. The differences in the values obtained by them may be attributed to the increased length of screw (8 mm) and an increased force of 2 N.
Our findings are in accordance with the findings of Lin et al. 33 who used stainless steel mini-implants of three different lengths (8 mm, 10 mm and 12 mm) at three different angulations (60°, 90° and 120°), and orthodontic force of 2 N was applied in three different angles (30°, 45° and 60°). Also, the implants were exposed, that is, the implants were kept outside and were not inserted completely. When the direction of force was at 30° with minimum exposure considered (3 mm), and angle of insertion was at 60°, the stress generated in cortical and cancellous bones were 1.72 and 0.25 MPa, respectively, and at 90°, it was 1.74 and 0.21 MPa for cortical and cancellous bones, respectively.
From the obtained results, it is clear that, as the angle of placement of implant increases, the stress generated in the implant also increases when both linear and torsional forces are applied. Also, stress generated in the bone (cortical and cancellous) and in the mini-implant was less for stainless steel implant when both linear and torsional forces were applied. These findings are in accordance with the findings of Yao et al., 34 who had stated that stainless steel exhibits better tensile properties than titanium.
Conclusion
The findings for the study lead to following conclusion:
Stress generated in stainless steel implant during linear force and torsional force was less than that generated in the titanium implant. Stress generated in stainless steel and titanium implants during linear and torsional force increased progressively from 30° to 90° for most of the angles. Difference in stress generated by stainless steel implant in cortical bone for both linear and torsional forces was less when compared with titanium implant, whereas for cancellous bone, the difference was insignificant at all the angles. Irrespective of angles, difference in stress generated in stainless steel implants and titanium implants for both the forces was not significant.
Footnotes
Declaration of Conflicting Interests
The authors declared no potential conflicts of interest with respect to the research, authorship and/or publication of this article.
Funding
The authors received no financial support for the research, authorship and/or publication of this article.