
Abstract
In contrast to prototypical facial expressions, we show less perceptual tolerance in perceiving vague expressions by demonstrating an interpretation bias, such as more frequent perception of anger or happiness when categorizing ambiguous expressions of angry and happy faces that are morphed in different proportions and displayed under high- or low-quality conditions. However, it remains unclear whether this interpretation bias is specific to emotion categories or reflects a general negativity versus positivity bias and whether the degree of this bias is affected by the valence or category of two morphed expressions. These questions were examined in two eye-tracking experiments by systematically manipulating expression ambiguity and image quality in fear- and sad-happiness faces (Experiment 1) and by directly comparing anger-, fear-, sadness-, and disgust-happiness expressions (Experiment 2). We found that increasing expression ambiguity and degrading image quality induced a general negativity versus positivity bias in expression categorization. The degree of negativity bias, the associated reaction time and face-viewing gaze allocation were further manipulated by different expression combinations. It seems that although we show a viewing condition-dependent bias in interpreting vague facial expressions that display valence-contradicting expressive cues, it appears that the perception of these ambiguous expressions is guided by a categorical process similar to that involved in perceiving prototypical expressions.
Keywords
Our perception of facial expressions of emotion is often argued as a categorical process, in which discrete labels are associated with expressions of different valence and arousal levels (Ekman & Cordaro, 2011). Among these labels, happiness, sadness, anger, fear, disgust, and surprise signify the six most common facial expressions that represent typical human emotional states and are recognizable by people from different cultures (Ekman & Cordaro, 2011; see also Gendron et al., 2014; Jack et al., 2009). One evidence supporting the categorical process is that expressing these common emotions is accompanied by distinctive patterns of facial muscle movements, so that different local facial features tend to transmit diagnostic visual cues for each expression (Smith et al., 2005). Subsequently, when perceiving these expressions, humans often scan the internal facial features of the eyes, nose, and mouth but gaze more frequently at the expression-representative regions, such as the mouth in happy faces and the eyes in angry faces (Eisenbarth & Alpers, 2011; Guo, 2012; Schurgin et al., 2014).
Considering that appropriate facial expression recognition plays a crucial role in guiding our social interaction and behaviour, it is important to understand how consistently we can interpret the same expressive cues in different viewing conditions and what factors could affect or bias our interpretation of these cues. Previous studies have revealed comparable accuracies in categorizing common facial expressions displayed at different expression intensities (Guo, 2012), image qualities (Du & Martinez, 2011; Guo et al., 2019; Johnston et al., 2003), viewing perspectives (Guo & Shaw, 2015; Matsumoto & Hwang, 2011), and viewing distances (Guo, 2013). For instance, changing the viewing angle across frontal, mid-profile, and profile views (Guo & Shaw, 2015) or reducing image resolution to 64 × 48 pixels (Guo et al., 2019) or less (up to 30 × 20 pixels for some expressions; Du & Martinez, 2011) had little deterioration impact on expression recognition performance. It seems that our brain has a reasonably good tolerance for interpreting these common prototypical facial expression signals.
In contrast, the assessment of ambiguous expressive signals is often subject to interpretation bias, such as negativity bias (i.e., a tendency to decipher uncertain events as negative to promote a more urgent response; Rozin & Royzman, 2001). For instance, when judging the emotional valence of burred facial expression images (manipulated through spatial frequency filters), participants tended to assign more a negative valence to surprise faces (an ambiguous expression which can be perceived as either positively or negatively valenced), but not to happy, fearful, and angry faces which have a clear emotional valence (Neta & Whalen, 2010). Similar interpretation bias also exists when categorizing non-prototypical ambiguous expressions (e.g., fake smile to hide anger). By asking participants to label vague facial expressions displaying contradictory happy and angry cues (via morphing happiness and anger in different proportions), a recent study observed that increasing expression ambiguity led to a negativity bias of labelling the morphed expression as anger (Kinchella & Guo, 2021). Interestingly, the direction of this interpretation bias was further modulated by face image quality. Degrading image quality (via reducing image resolution) led to a positivity bias of perceiving the morphed expression as happiness (Kinchella & Guo, 2021). It seems that unlike common prototypical facial expressions, our brain has less tolerance for interpreting ambiguous expression signals and may show a viewing condition-dependent interpretation bias. It is plausible that the perception of prototypical and ambiguous expressions may involve different cognitive and neural processes (e.g., categorical-based vs. arousal- and/or valence-based processes).
For instance, it is unclear whether the opposite interpretation bias modulated by image quality is restricted to anger versus happiness bias (a bias based on specific expression) or reflects a general negativity versus positivity bias (a bias based on expression valence). Probably because anger and happiness are typical high-arousal negatively and positively valenced emotions that are clearly associated with avoidance and approach tendencies (Calder et al., 2011; Ekman & Cordaro, 2011), humans often show higher perceptual sensitivity to process angry facial cues (e.g., anger superiority effect in which angry expressions tend to pop out more easily, capturing and holding attention automatically; Anderson, 2005; Lyyra et al., 2014) and higher perceptual tolerance to process happy facial cues (e.g., happiness recognition is less prone to expression intensity decline, image quality distortion, and neural process disruption; Du & Martinez, 2011; Guo, 2012; Guo et al., 2019, 2020). Consequently, we could be more easily to detect angry over happy cues in high quality ambiguous happiness-anger expressions (anger bias), but happy over angry cues in low quality ambiguous expressions (happiness bias). If so, then these face quality-modulated interpretation biases would not be necessarily applied to other ambiguous facial expressions, such as happiness-sadness and happiness-fear.
On the other hand, psychological studies have reported that stimulus ambiguity is intrinsically aversive and would induce negative emotional perception and responses (e.g., Anderson et al., 2019), but degrading the image resolution of negatively valenced scenes could reduce valence recognition and arousal ratings (Stevenson & Guo, 2020). From this perspective, the anger versus happiness bias in assessing high- versus low-quality ambiguous happiness-anger expressions may reflect a general valence-based negativity versus positivity bias. If so, a similar interpretation bias could exist when judging other expressions displaying contradictory affective cues (e.g., happiness-sadness or happiness-fear).
Furthermore, it would also be interesting to examine whether the degree of these interpretation biases could be influenced by different expression combinations (e.g., happiness-anger vs. happiness-sadness vs. happiness-fear vs. happiness-disgust). If the categorical process is involved in perceiving ambiguous facial expressions, then different expression combinations may affect the behavioural measurements associated with expression categorization, such as categorization accuracy, reaction time for expression categorization, and face-viewing gaze distribution. For instance, previous eye-tracking studies on categorizing prototypical facial expressions have suggested preferential gaze allocation at the expression-representative local facial regions (e.g., eyes in angry faces; Eisenbarth & Alpers, 2011; Guo, 2012; Schurgin et al., 2014), and such gaze allocation could be tightly coupled with expression categorization performance (Adolphs et al., 2005) and bias (Green & Guo, 2018; Neta et al., 2017).
These possibilities have been explored in two eye-tracking studies. Experiment 1 examined whether the negativity and positivity biases could be extended to interpreting ambiguous happiness-sadness or happiness-fear expressions. Experiment 2 examined whether the degree of these interpretation biases could be influenced by different expression combinations by directly comparing participants’ behavioural responses and gaze behaviour in perceiving ambiguous happiness-anger, happiness-sadness, happiness-fear, and happiness-disgust expressions. The research findings would shed light on cognitive mechanisms linked to ambiguous expression perception.
Experiment 1: Negativity and Positivity Biases in Perceiving Happiness-Sadness or Happiness-Fear Faces of Varying Expression Ambiguity and Image Clarity
Materials and Methods
Forty-one students (8 males, 33 females), age ranging from 19 to 21 years old with a mean of age 20.29 ± 0.18 (mean ± SEM), successfully completed this study. This sample size is consistent with previous studies (Guo et al., 2019; Stevenson & Guo, 2020), and its suitability was confirmed by G*power analysis. With a conservative effect size (ηp2) of 0.2 reported in previous expression categorization studies (Guo, 2012, 2013), a sample of 22 participants would have been large enough to detect the interpretation bias with a power of 0.95 at an alpha level of 0.05 in an 11 (expression ambiguity) × 2 (image quality) within-factor repeated measures design. All participants had normal or corrected-to-normal visual acuity. The Ethical Committee in the School of Psychology, University of Lincoln, approved this study (PSY20211034). Prior to the study, the research purpose and experimental tasks were explained to the participants, and written informed consent was obtained from each of them. All procedures complied with the British Psychological Society Code of Ethics and Conduct.
The procedure for image preparation is the same as described in Stevenson and Guo (2020), from which the following details are reproduced. Grey-scale white western Caucasian face images, consisting of two female and two male models displaying happy, sad, and fearful expressions in a full frontal view, were selected from the Karolinska Directed Emotional Faces CD ROM (Lundqvist et al., 1998). These faces were processed in Adobe Photoshop to remove external facial features (e.g., hair) and to ensure a homogeneous grey background, consistent face size, and brightness (Green & Guo, 2018). For each model, Morpheus Photo Morpher was used to morph the sad or fearful face (treated as 100% sad or fearful expression, 100S or 100F) with the happy face (100H) to create 11 expressive face images with different mix of sadness-happiness or fear-happiness proportions, such as 100S, 70S30H, 60S40H, 57S43H, 53S47H, 50S50H, 47S53H, 43S57H, 40S60H, 30S70H, and 100H. Instead of using equal space to mix the sadness-happiness or fear-happiness expressions, we chose more morphing proportions around 50S50H or 50F50H to create more ambiguous expressions to induce a relatively frequent expression interpretation bias as shown in our pilot observation and previous research (Kinchella & Guo, 2021).
The morphed face images were then resized to 384 × 512 pixels (14 × 19°, roughly equivalent to viewing a face from 70 cm away or at a close personal distance; Guo, 2013) and were referred to as the ‘high-quality’ resolution 1 condition. Based on previous research (Stevenson & Guo, 2020), low image resolution was used to induce a happiness bias in interpreting ambiguous expressions. Specifically, for each of those high-quality face images, one subsequent face was constructed by downsizing it to 24 × 32 pixels (‘low-quality’ resolution 1/16 condition). To provide a constant presentation size for all face images, the downsized faces were scaled back to 384 × 512 pixels using bilinear interpolation, which preserves most of the spatial frequency components (Guo et al., 2019). As a result, 88 face images were generated for sadness-happiness and fear-happiness expressions, respectively (4 models × 11 expression ambiguities × 2 image resolutions, see Figure 1 for examples). These face images were gamma-corrected and displayed once in a random order (a new random order for each participant) in two blocks during the testing.
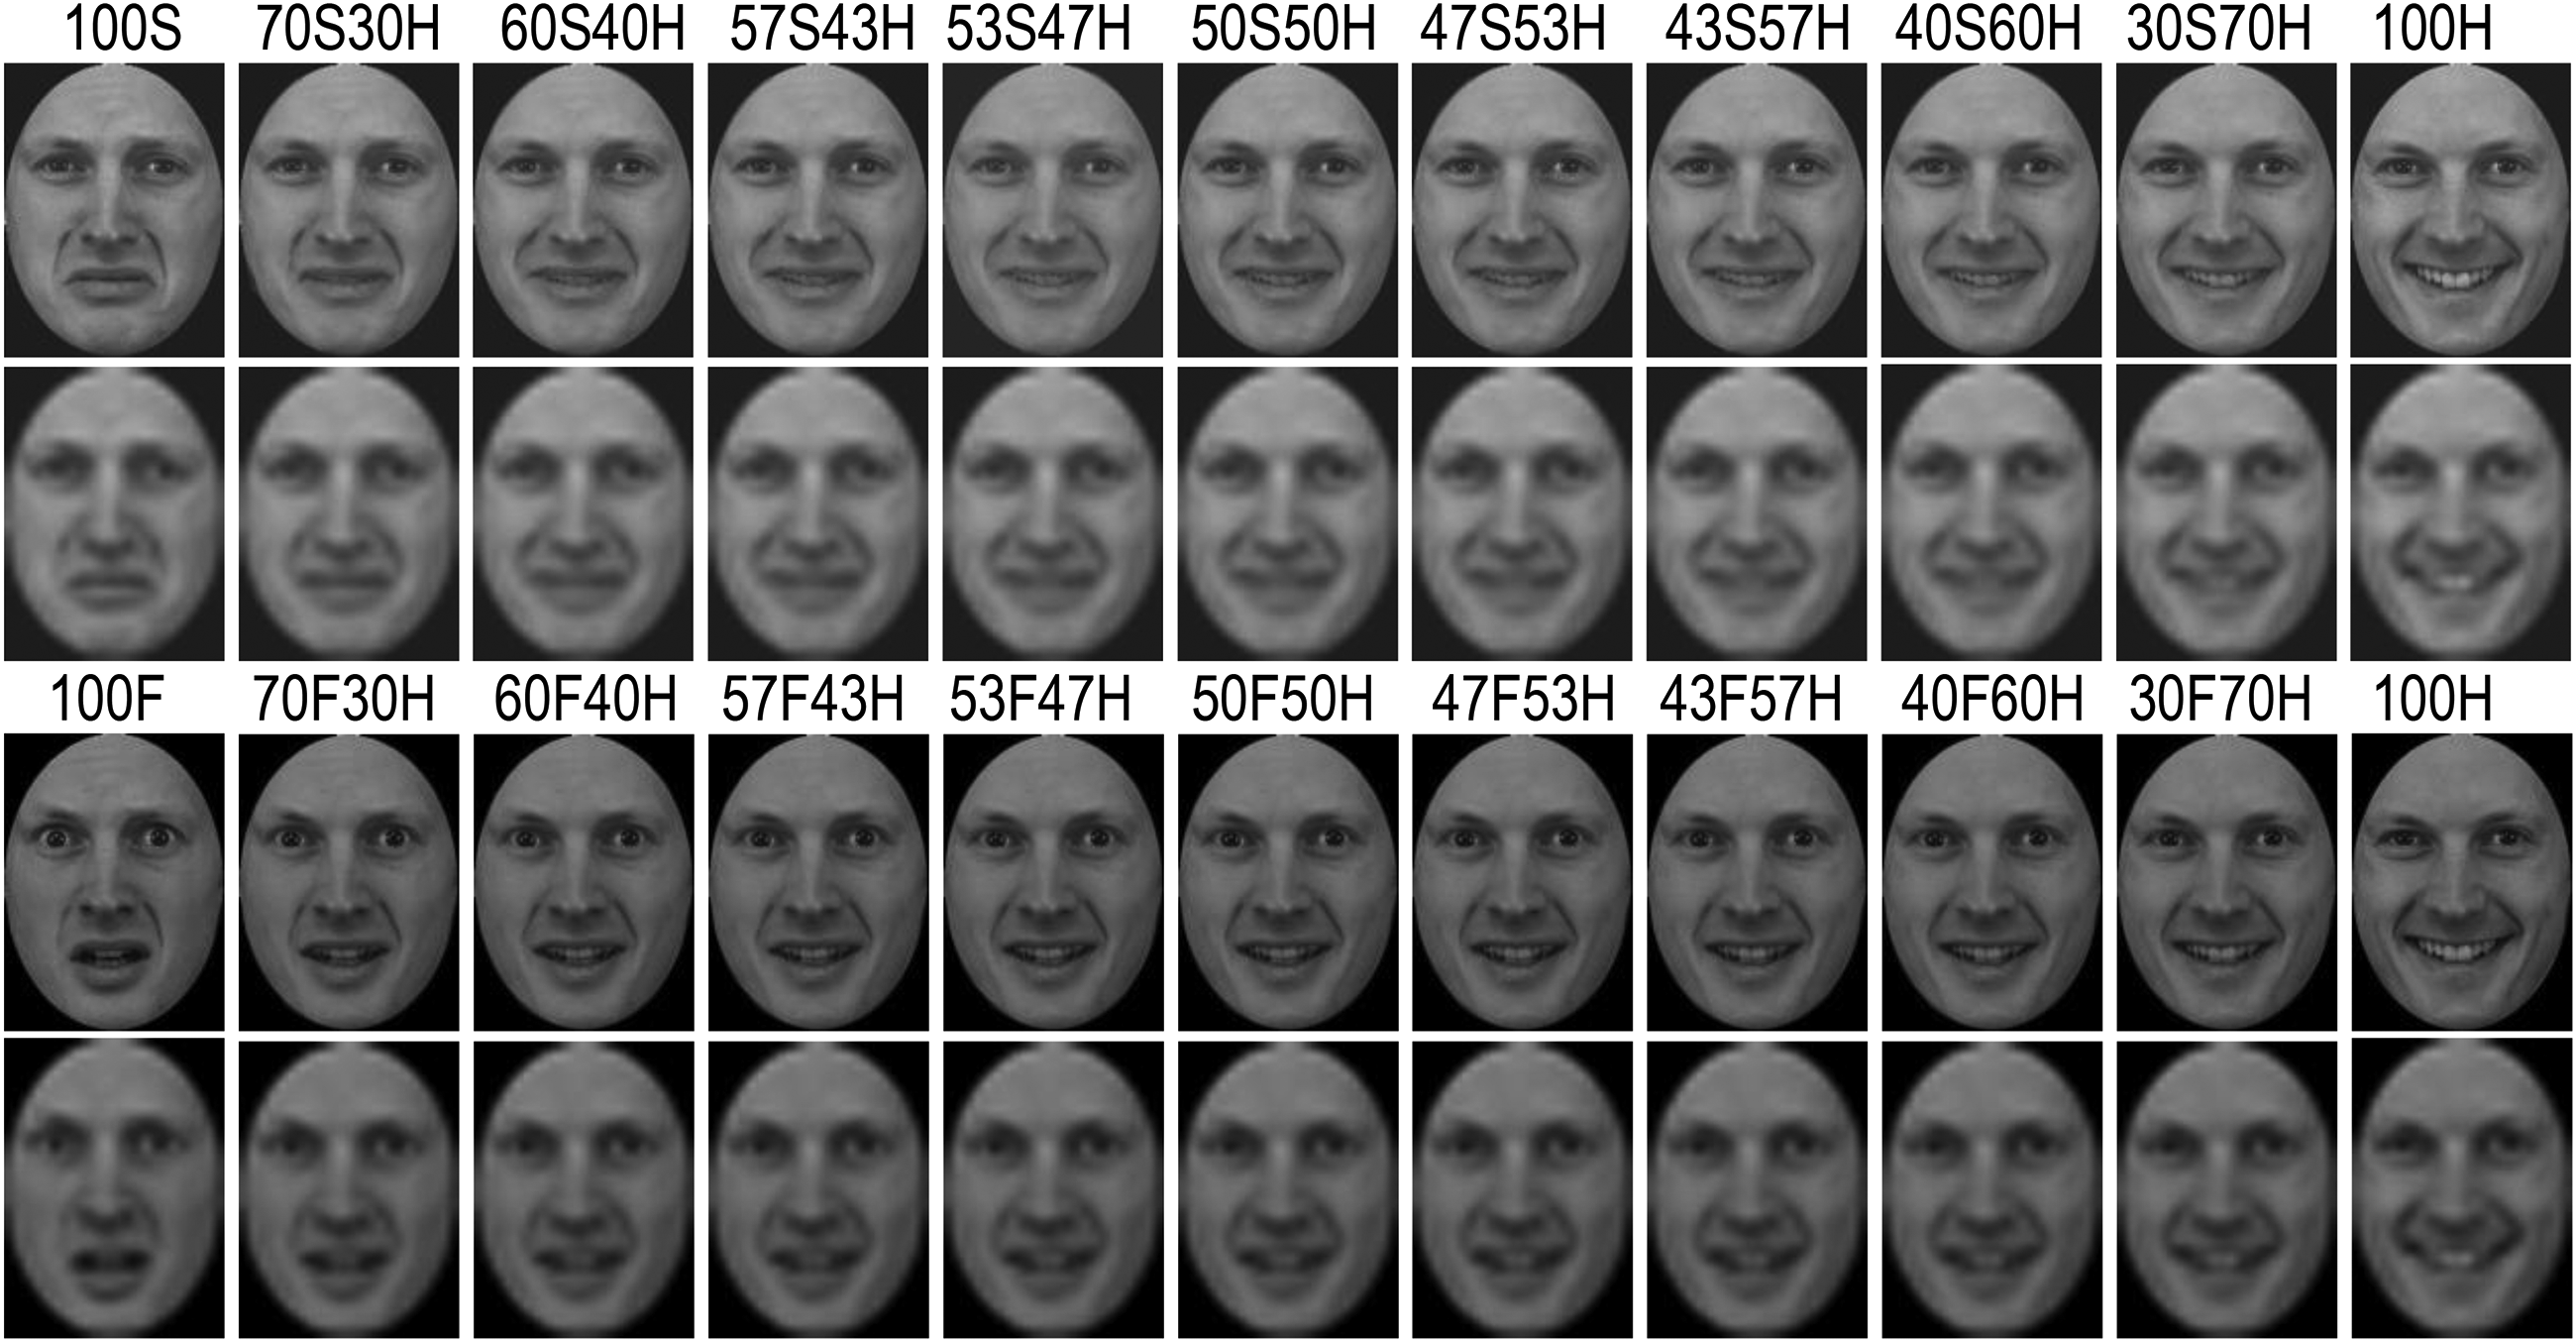
Examples of expressive faces mixed with different proportions of sadness-happiness (1st and 2nd rows) and fear-happiness (3rd and 4th rows) at varying image resolutions (1st and 3rd rows: resolution 1; 2nd and 4th rows: resolution 1/16).
The general experimental setup and procedure for data collection and analysis were similar to Guo et al. (2019). Briefly, the faces were presented on a non-interlaced gamma-corrected colour monitor (30 cd/m2 background luminance, 100 Hz frame rate, 1024 × 768 pixels, Mitsubishi Diamond Pro 2070SB) through the ViSaGe graphics system (Cambridge Research Systems, UK). At a viewing distance of 57 cm, the monitor subtended a visual angle of 40 × 30°. During the eye-tracking experiment, the ambiguous sadness-happiness and fear-happiness expressions were presented in two separate blocks with a counterbalanced order for each participant. In each block, the participants sat in a chair with their head restrained by a chinrest and viewed the display binocularly. Horizontal and vertical eye positions from the dominant eye (determined through the Hole-in-Card test) were measured using a pupil-centre/cornea-reflection Video Eyetracker Toolbox with a 250 Hz sampling frequency and up to 0.25° accuracy (Cambridge Research Systems, UK). Eye movement signals were first calibrated by instructing the participant to follow a fixation point (FP, 0.3° diameter, 15 cd/m2 luminance) displayed randomly at one of 9 positions (3 × 3 matrix) across the monitor (the distance between adjacent FP positions was 10°). After the calibration procedure, the participant pressed the response box to initiate a trial. The trial was started with an FP displayed 10° left or right to the screen centre to minimize central fixation bias. If the participant maintained fixation for 1 s, the FP disappeared, and a face image was presented at the centre of the monitor for 3 s The participant was instructed to ‘categorize this facial expression as carefully as possible’, and verbally report the perceived expression (2-alternative forced choice: sadness or happiness in the presentation block of ambiguous sadness-happiness expressions, fear or happiness in the presentation block of ambiguous fear-happiness expressions). The reported responses were typed into the eye-tracking software developed in Matlab by the researcher. No reinforcement was given during this procedure.
All the collected data were analysed off-line. For eye movement data, the software developed in Matlab computed horizontal and vertical eye displacement signals as a function of time to determine eye velocity and position. Fixation locations were then extracted from raw eye-tracking data using velocity (less than 0.2° eye displacement at a velocity of less than 20°/s) and duration (greater than 50 ms) criteria (Guo, 2007). To determine gaze allocation at key internal facial features (i.e., eyes, nose, and mouth), a consistent criterion was adopted to define boundaries between facial features to ensure equal size of individual features across faces of different expressions from the same model (Guo et al., 2010). Specifically, the ‘eye’ region included the eyes, eyelids, and eyebrows; the ‘nose’ or ‘mouth’ region consisted of the main body of the nose or mouth and the immediate surrounding area (up to 0.5°). The division line between the mouth and nose regions was the midline between the upper lip and the bottom of the nose. The viewing time allocated to each facial feature was normalised in proportion to the total viewing time sampled in that trial.
A series of repeated measures analyses of variance (ANOVAs) were conducted to examine the effect of expression ambiguity and image quality on participants’ expression categorization performance, perceived expression intensity, and associated face-viewing gaze allocation. For each ANOVA, Greenhouse–Geisser correction was applied where sphericity was violated. To uncover specific differences between group means where the main effect of the independent variable was significant, a Bonferroni adjustment was made for post-hoc multiple comparisons with alpha set as 0.05 divided by the number of comparisons and corrected p-values were reported in the Results.
Results and Discussion
Facial Expression Categorization
To examine how the interpreted expression category was affected by expression ambiguity and image resolution, we conducted 11 (expression ambiguity) × 2 (image quality) ANOVAs with the percentage of perceived happiness collected for each expression ambiguity at each image quality as the dependent variable.
For sadness-happiness expressions, the analysis showed a significant main effect of expression ambiguity (F(5.84, 233.42) = 517.74, p < .001, ηp2 = 0.93; Figure. 2A and Table S1) with increased happiness cues in the morphed faces leading to an increased happiness interpretation from 0.31% ± 0.31 to 100%; significant main effect of image quality (F(1, 40) = 22.44, p < .001, ηp2 = 0.36) with more happiness interpretation for low-quality faces than for high-quality faces; and significant expression ambiguity × image quality interaction (F(5.62, 224.69) = 9.82, p < .001, ηp2 = 0.2). Specifically, high-quality ambiguous expressions were more likely to be interpreted as sadness. Above-chance performance for categorizing ambiguous expressions as happiness started to emerge for faces containing 60% happy cues (p = .02). Reducing image quality, on the other hand, significantly increased happiness categorization for 50S50H, 47S53H, 43S57H, 40S60H, and 30S70H expressions (all ps < .05; Figure 2A).
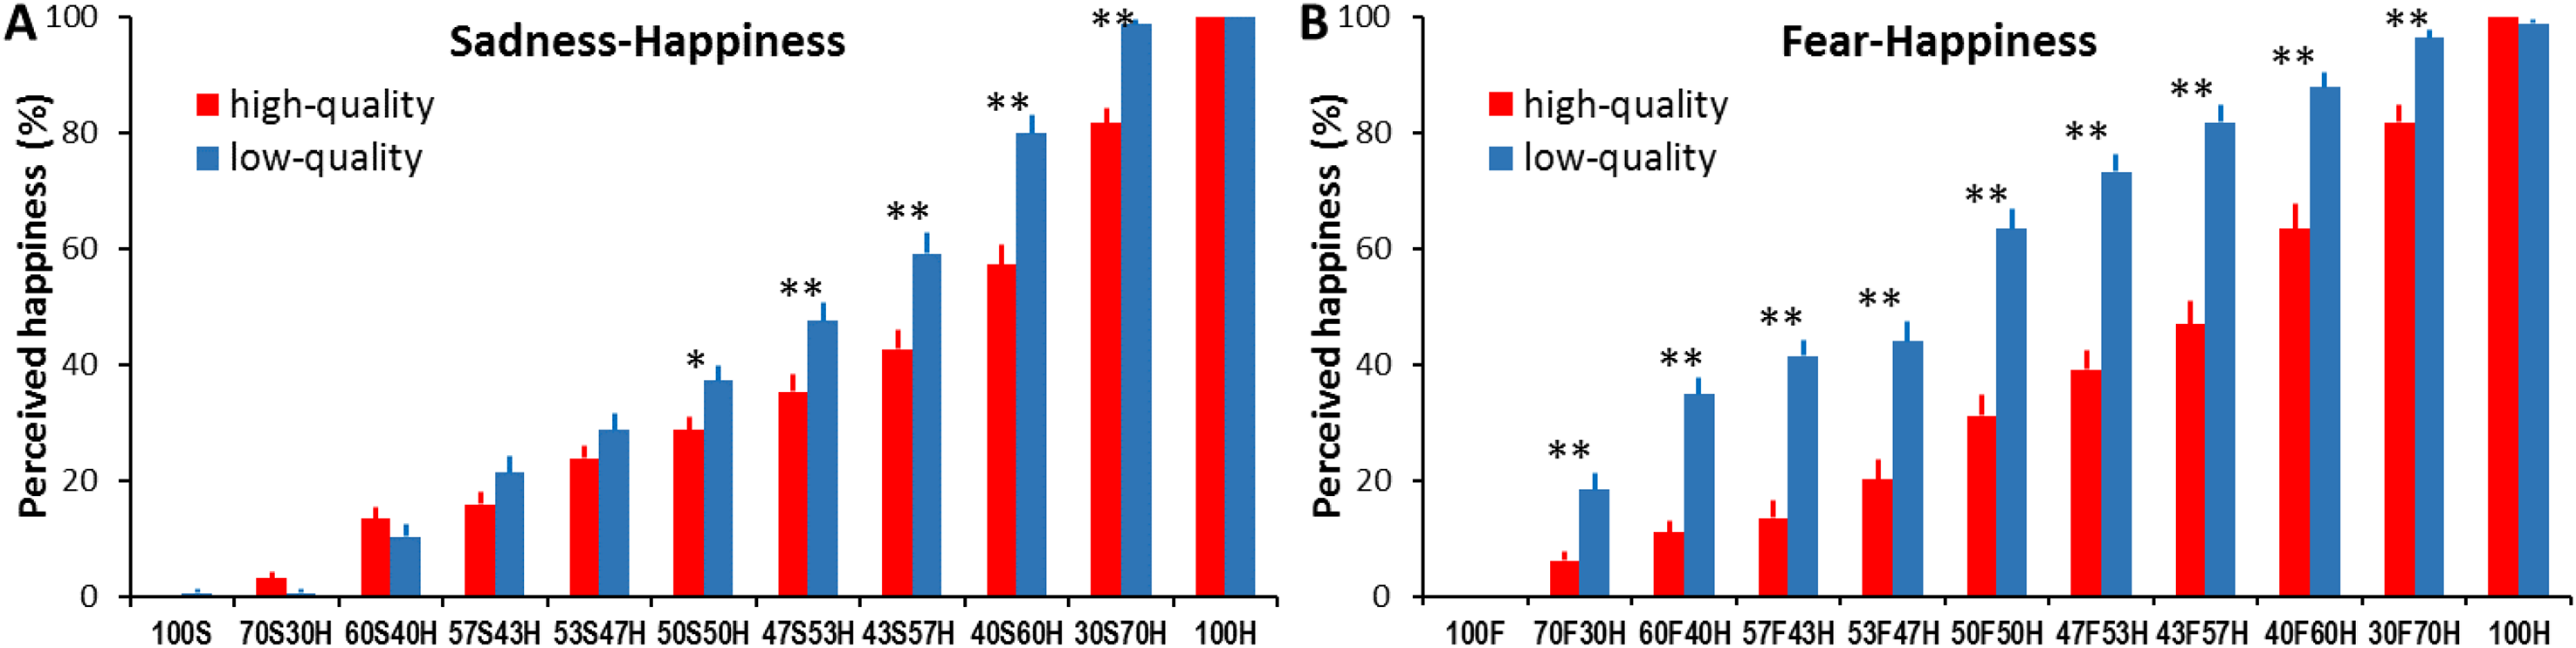
Percentage of perceived happy expression as a function of sadness-happiness (A) and fear-happiness (B) expression ambiguity and face image quality. Error bars represent SEM. * represents a statistical difference between high and low image quality conditions for a given expression ambiguity (* p < .05, ** p < .01).
For fear-happiness expressions, the analysis also revealed a significant main effect of expression ambiguity (F(6.38, 255.13) = 338.58, p < .001, ηp2 = 0.89; Figure 2B and Table S2) with increased happiness cues leading to an increased happiness interpretation from 0 to 99.39% ± 0.43; significant main effect of image quality (F(1, 40) = 124.92, p < .001, ηp2 = 0.76) with more happiness interpretation for low-quality faces than for high-quality faces (37.53% ± 1.75 vs. 58.157% ± 1.55); and significant expression ambiguity × image quality interaction (F(6.7, 267.84) = 14.02, p < .001, ηp2 = 0.26). Specifically, high-quality ambiguous expressions were more likely to be interpreted as fear. The above-chance happiness interpretation started to emerge for faces containing 60% happy cues (p = .02). Moreover, all low-quality ambiguous fear-happiness faces (from 70F30H to 30F70H) were interpreted as happier than high-quality faces (all ps < .01; Figure 2B).
It appears that similar to the previously reported anger bias in categorizing high-quality ambiguous anger-happiness expressions (Kinchella & Guo, 2021), our participants demonstrated a clear sadness or fear bias in categorizing high-quality ambiguous sadness-happiness or fear-happiness expressions, even for those faces containing 57% happiness, suggesting a general negativity (rather than expression-specific) bias in perceiving ambiguous facial expressions containing contradictory valence cues. This observation is in line with previous findings of high sensitivity to detect and process negatively valenced affective information. Similar to the anger superiority effect (Anderson, 2005; Lyyra et al., 2014), we tend to be more sensitive to detect sad and fearful faces compared to neutral or happy faces (Lipp et al., 2009; Yang et al., 2007). In comparison with happiness, these negative emotional cues, especially fear, are processed more quickly in the early visual pathway of the brain (Guo et al., 2020; Li et al., 2019). Consequently, this high sensitivity of detecting and processing negative (angry, fearful, and sad) facial cues in the morphed faces may lead to a general negativity bias when labelling high-quality ambiguous expressions.
Also like previously reported happiness bias in categorizing low-quality ambiguous anger-happiness expressions (Kinchella & Guo, 2021), the observed sadness or fear bias was reduced or even reversed to a happiness bias when the image resolution of ambiguous sadness-happiness or fear-happiness faces was changed from high to low quality. For instance, 43S57H or 50F50H faces induced evident sad or fear bias when presented in high quality, but a happiness bias when presented in low quality. Previous studies have reported that the recognition of happiness is the least susceptible to expression intensity decline and image quality distortion among common facial expressions (Du & Martinez, 2011; Guo, 2012; Guo et al., 2019; Wells et al., 2016). This higher perceptual tolerance for happy faces enables us to still detect happy facial signals in degraded faces even when other expression cues are unrecognizable, hence leading to a general positivity bias in perceiving low-quality ambiguous expressions. The results for expression intensity judgement can be found in the Supplemental Materials (Figure S1, Tables S3 and S4).
Face-Viewing Gaze Allocation
To determine whether the same facial features were attended to when interpreting facial expressions across different expression ambiguities and image qualities, we conducted 3 (face region) × 11 (expression ambiguity) × 2 (image quality) ANOVAs with the proportion of viewing time directed at each face region as the dependent variable.
For sadness-happiness expressions (Figure 3A to C), the analysis showed a significant main effect of face region (F(1.63, 64.99) = 15.86, p < .001, ηp2 = 0.28), non-significant main effect of expression ambiguity (F(6.8, 271.79) = 1.04, p = .41, ηp2 = 0.03) and image quality (F(1, 40) = 2.22, p = .14, ηp2 = 0.05), and significant face region × expression ambiguity (F(10.95, 437.87) = 3.26, p < .001, ηp2 = 0.08) and face region × image quality interactions (F(1.7, 68.04) = 123.92, p < .001, ηp2 = 0.76). Overall, the eyes and nose attracted longer viewing time than the mouth (all ps < .01). In comparison with less ambiguous expressions, more ambiguous expressions attracted shorter viewing times at the eyes (F(8.03, 650.75) = 3.63, p < .001, ηp2 = 0.04) but longer viewing times at the mouth (F(10, 810) = 6.58, p < .001, ηp2 = 0.09). On the other hand, in comparison with high-quality faces, low-quality faces attracted shorter viewing times at the eyes and mouth, but longer viewing times at the nose (high- vs. low-quality for eyes: 39.24% ± 1.05 vs. 27.27% ± 0.99, mouth: 22.83% ± 0.66 vs. 14.56% ± 0.7, nose: 35.96% ± 1.02 vs. 55.83% ± 1.1; all ps < .01; Tables S5, S6 and S7).
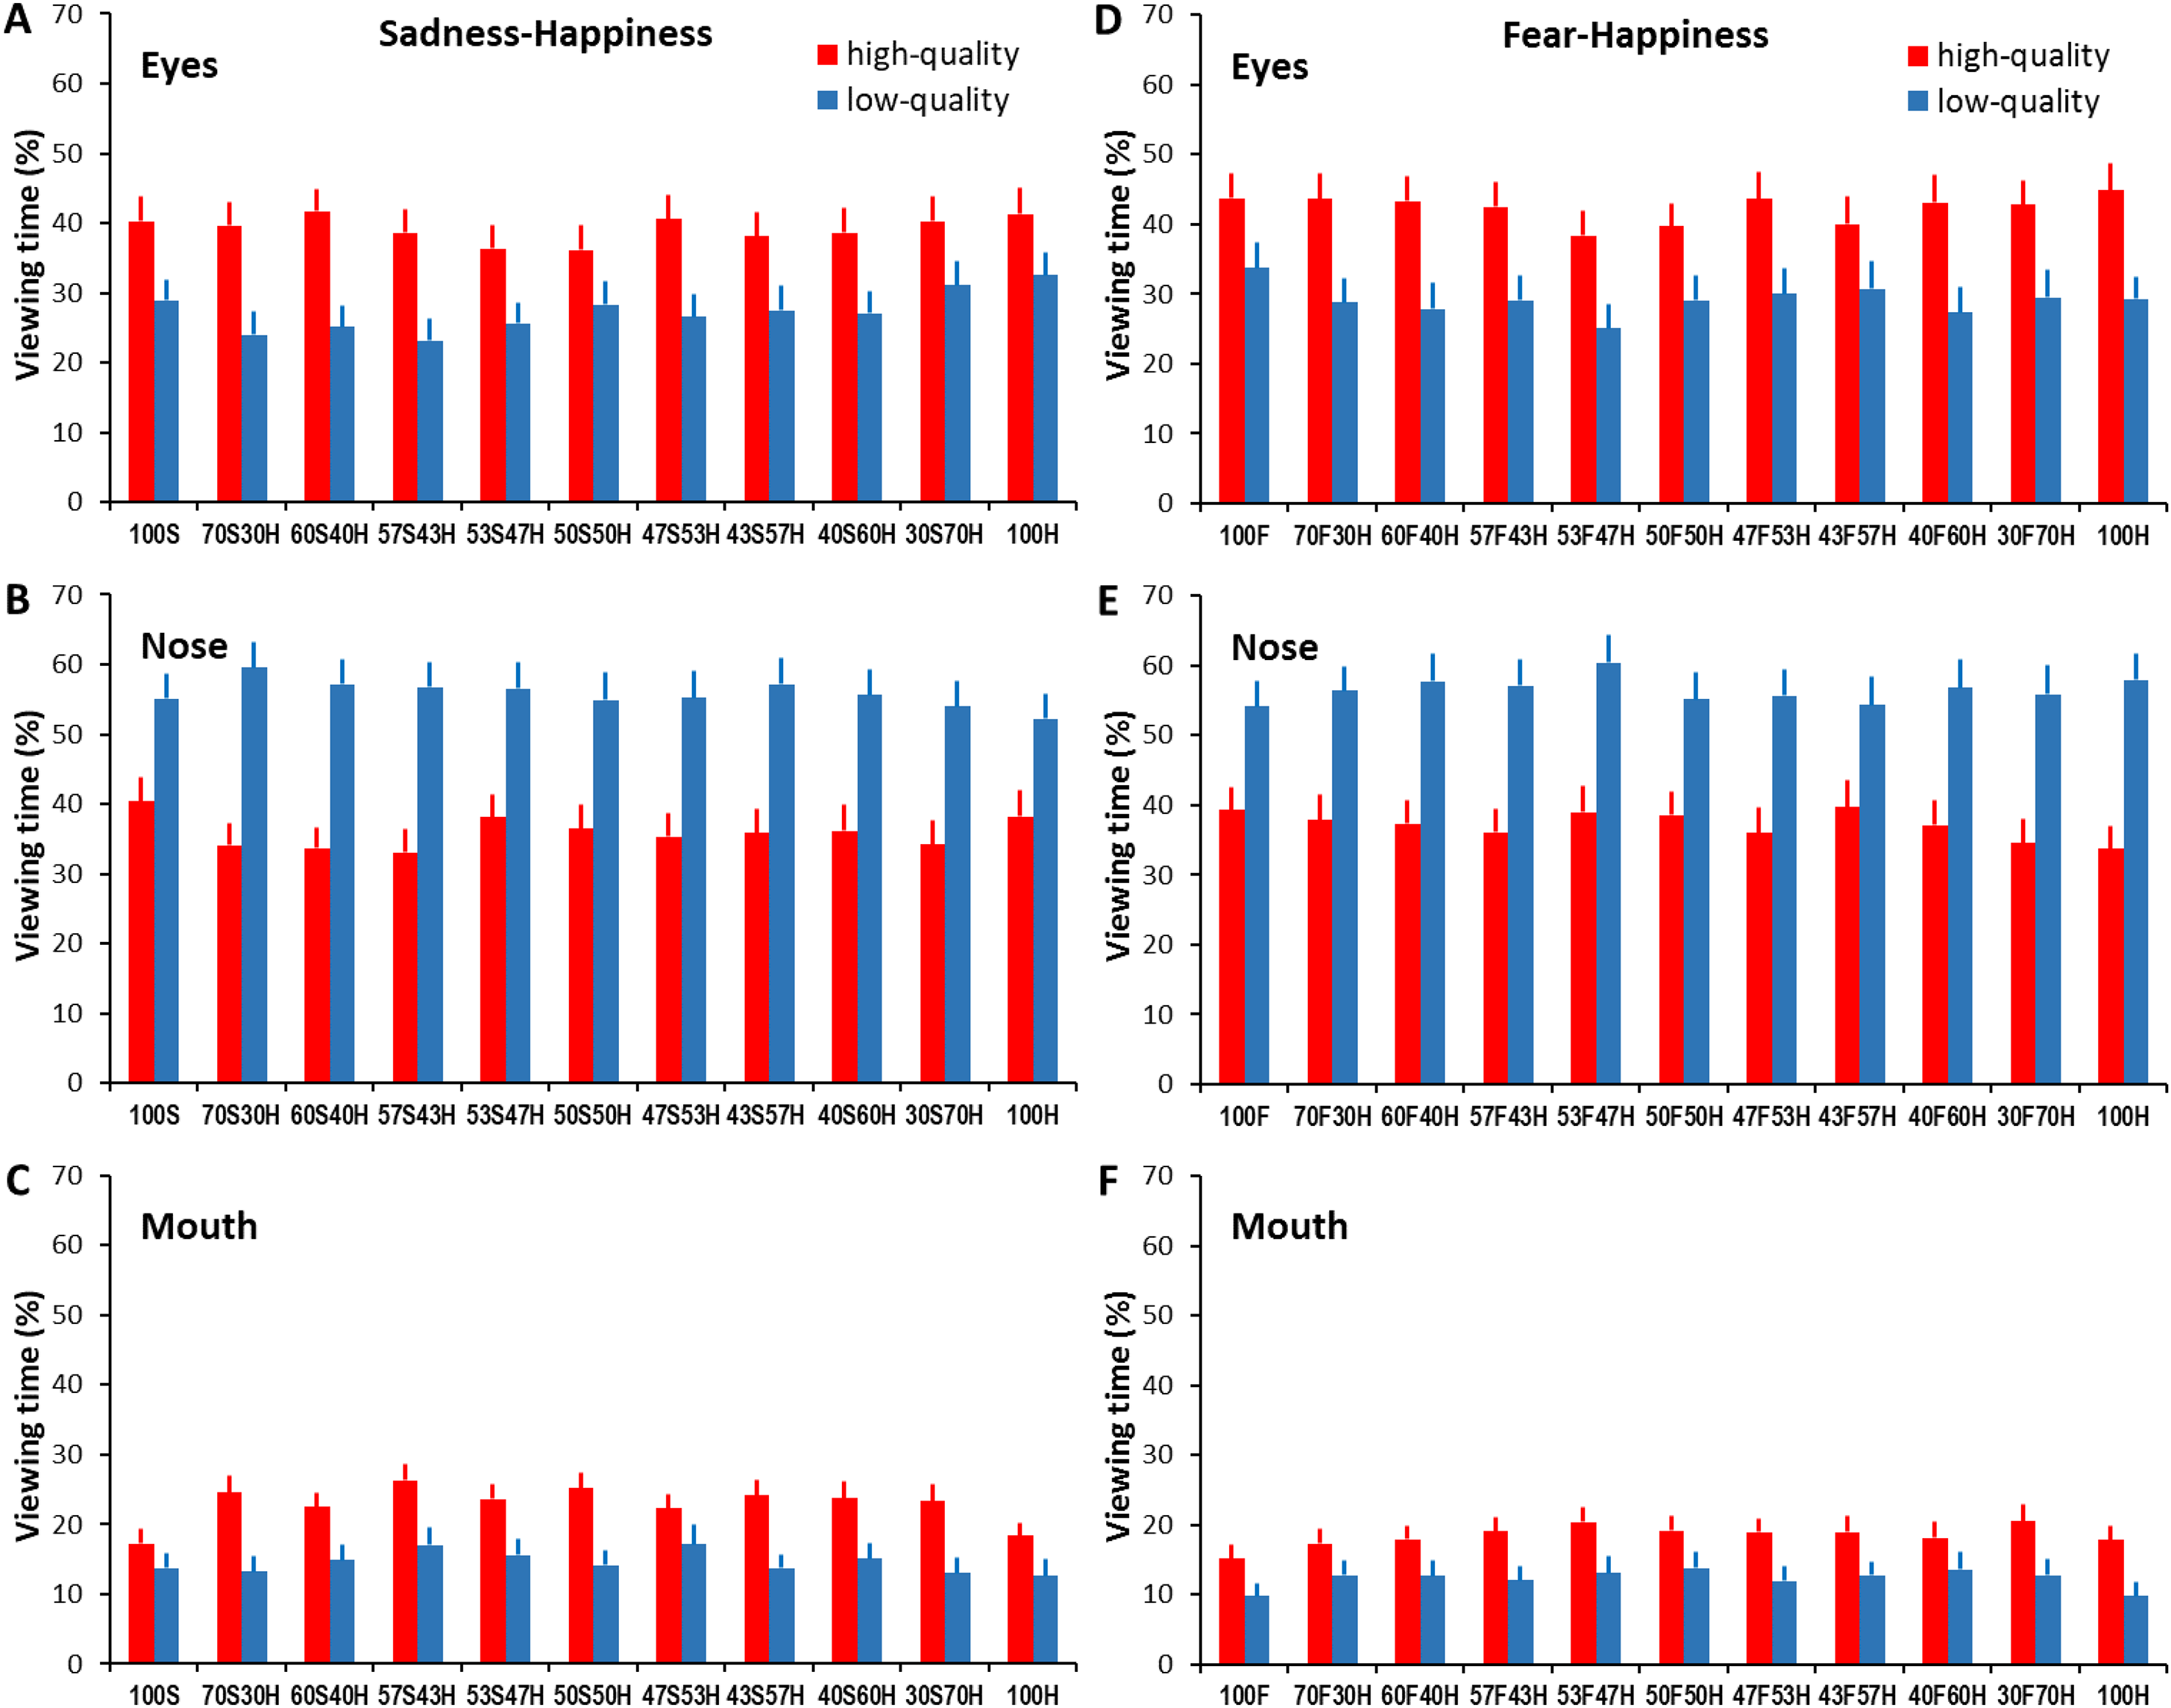
Percentage of viewing time directed at the eyes, nose, and mouth regions when categorizing sadness-happiness (A, B, C) and fear-happiness faces (D, E, F) with different expression ambiguities and image qualities. Error bars represent SEM.
Similarly, for fear-happiness expressions (Figure 3D to F), the analysis revealed a significant main effect of face region (F(1.5, 60) = 19.59, p < .001, ηp2 = 0.33) and expression ambiguity (F(6.77, 270.88) = 2.26, p = .03, ηp2 = 0.05), a non-significant main effect of image quality (F(1, 40) = 0.09, p = .77, ηp2 = 0.002), and significant face region × expression ambiguity (F(10.39, 415.61) = 2.77, p = .002, ηp2 = 0.07) and face region × image quality interactions (F(1.52, 60.65) = 114.09, p < .001, ηp2 = 0.74). Overall, the eyes and nose attracted longer viewing times than the mouth (all ps < .01). Participants also tended to gaze shorter at the eyes but longer at the mouth in more ambiguous than in less ambiguous expressions (eyes: F(8.08, 653.96) = 3.59, p < .001, ηp2 = 0.04; mouth: F(7.56, 612.57) = 4.19, p < .001, ηp2 = 0.05). Image quality degradation also quantitatively changed the amount of viewing time allocated to each facial region by reducing viewing at the eyes and mouth but increasing viewing at the nose (high- vs. low-quality for eyes: 42.34% ± 1.1 vs. 29.17% ± 1.07, mouth: 18.5% ± 0.64 vs. 12.29% ± 0.64, nose: 37.2% ± 1.05 vs. 56.52% ± 1.16, all ps < .001; Tables S8, S9, and S10).
Overall, the gaze distribution analysis in viewing sadness-happiness and fear-happiness faces has revealed qualitatively similar findings to previously reported gaze distribution in viewing anger-happiness faces (Kinchella & Guo, 2021). More ambiguous expressions were associated with decreased viewing of the eyes but increased viewing of the mouth. It seems that participants displayed a more holistic gaze behaviour (i.e., directing a more balanced viewing of local facial features such as the eyes, nose, and mouth) to extract, analyse, and then integrate local affective information when evaluating ambiguous facial expressions. Considering that the mouth conveys informative cues for detecting happiness, but the eyes and surrounding region transmit diagnostic cues for detecting anger, sadness, and fear (Smith et al., 2005), it is not surprising that participants showed a similar gaze distribution in viewing ambiguous anger-happiness, sadness-happiness and fear-happiness faces by frequently inspecting the eyes and mouth in which contradictory happy and angry/sad/fearful cues were embedded.
On the other hand, reducing face quality induced an increased viewing of the nose but decreased viewing of both the eyes and mouth in sadness-happiness, fear-happiness, and the previously reported anger-happiness faces (Kinchella & Guo, 2021). This concentrated gaze bias towards the image centre is a common feature when viewing degraded or distorted face and natural scene pictures (Guo et al., 2019; Judd et al., 2011; Röhrbein et al., 2015), probably driven by reduced local image saliency in the out-of-focus periphery vision, delayed information analysis and fixation target selection, and subsequently decreased saccade initiation to the peripheral regions (Nuthmann et al., 2010).
Clearly, our previously reported face-viewing gaze distribution and interpretation bias in perceiving anger-happiness expressions can be generalized to perceive sadness-happiness and fear-happiness expressions, and a general negativity and positivity bias might represent the change in perceptual sensitivity to contradictory anger/sadness/fear-happiness cues presented at different image qualities. However, it is unclear whether the degree or amplitude of this interpretation bias was purely determined by the valence of two morphed facial expressions or if it could be further influenced by different combinations of two morphed expression categories. This possibility was examined in Experiment 2 by directly comparing participants’ behavioural responses and gaze behaviour in perceiving ambiguous happiness-anger, happiness-sadness, happiness-fear, and happiness-disgust expressions.
Experiment 2: Comparison of Interpretation Bias in Perceiving Ambiguous Happiness-Anger/Sadness/Fear/Disgust Expressions
Materials and Methods
Thirty undergraduate students (8 males, 22 females), age ranging from 18 to 26 years old (20.9 ± 0.32), successfully completed this study. The suitability of this sample size was confirmed by G*power analysis. With a conservative effect size (ηp2) of 0.2 reported in previous expression categorization studies (Guo, 2012, 2013), a sample of 22 participants is large enough to detect the interpretation bias with a power of 0.95 at an alpha level of 0.05 in an 11 (expression ambiguity) × 4 (expression combination) within-factor repeated measures design and 0.85 nonsphericity correction. All participants had normal or corrected-to-normal visual acuity.
The procedure for preparing ambiguous facial expression images from four models was the same as in Experiment 1. For each model, a different mix of anger-happiness, sadness-happiness, fear-happiness, and disgust-happiness expressions was created with the proportion of happiness varied as 0%, 30%, 40%, 43%, 47%, 50%, 53%, 57%, 60%, and 70%. In total, 164 high-quality face images (384 × 512 pixels) were generated (4 models × 10 expression ambiguities × 4 expression combinations + 4 models’ 100% happy faces, see Figure 4 for examples). These face images were gamma-corrected and displayed once in a random order (a new random order for each participant) in one block during the testing.
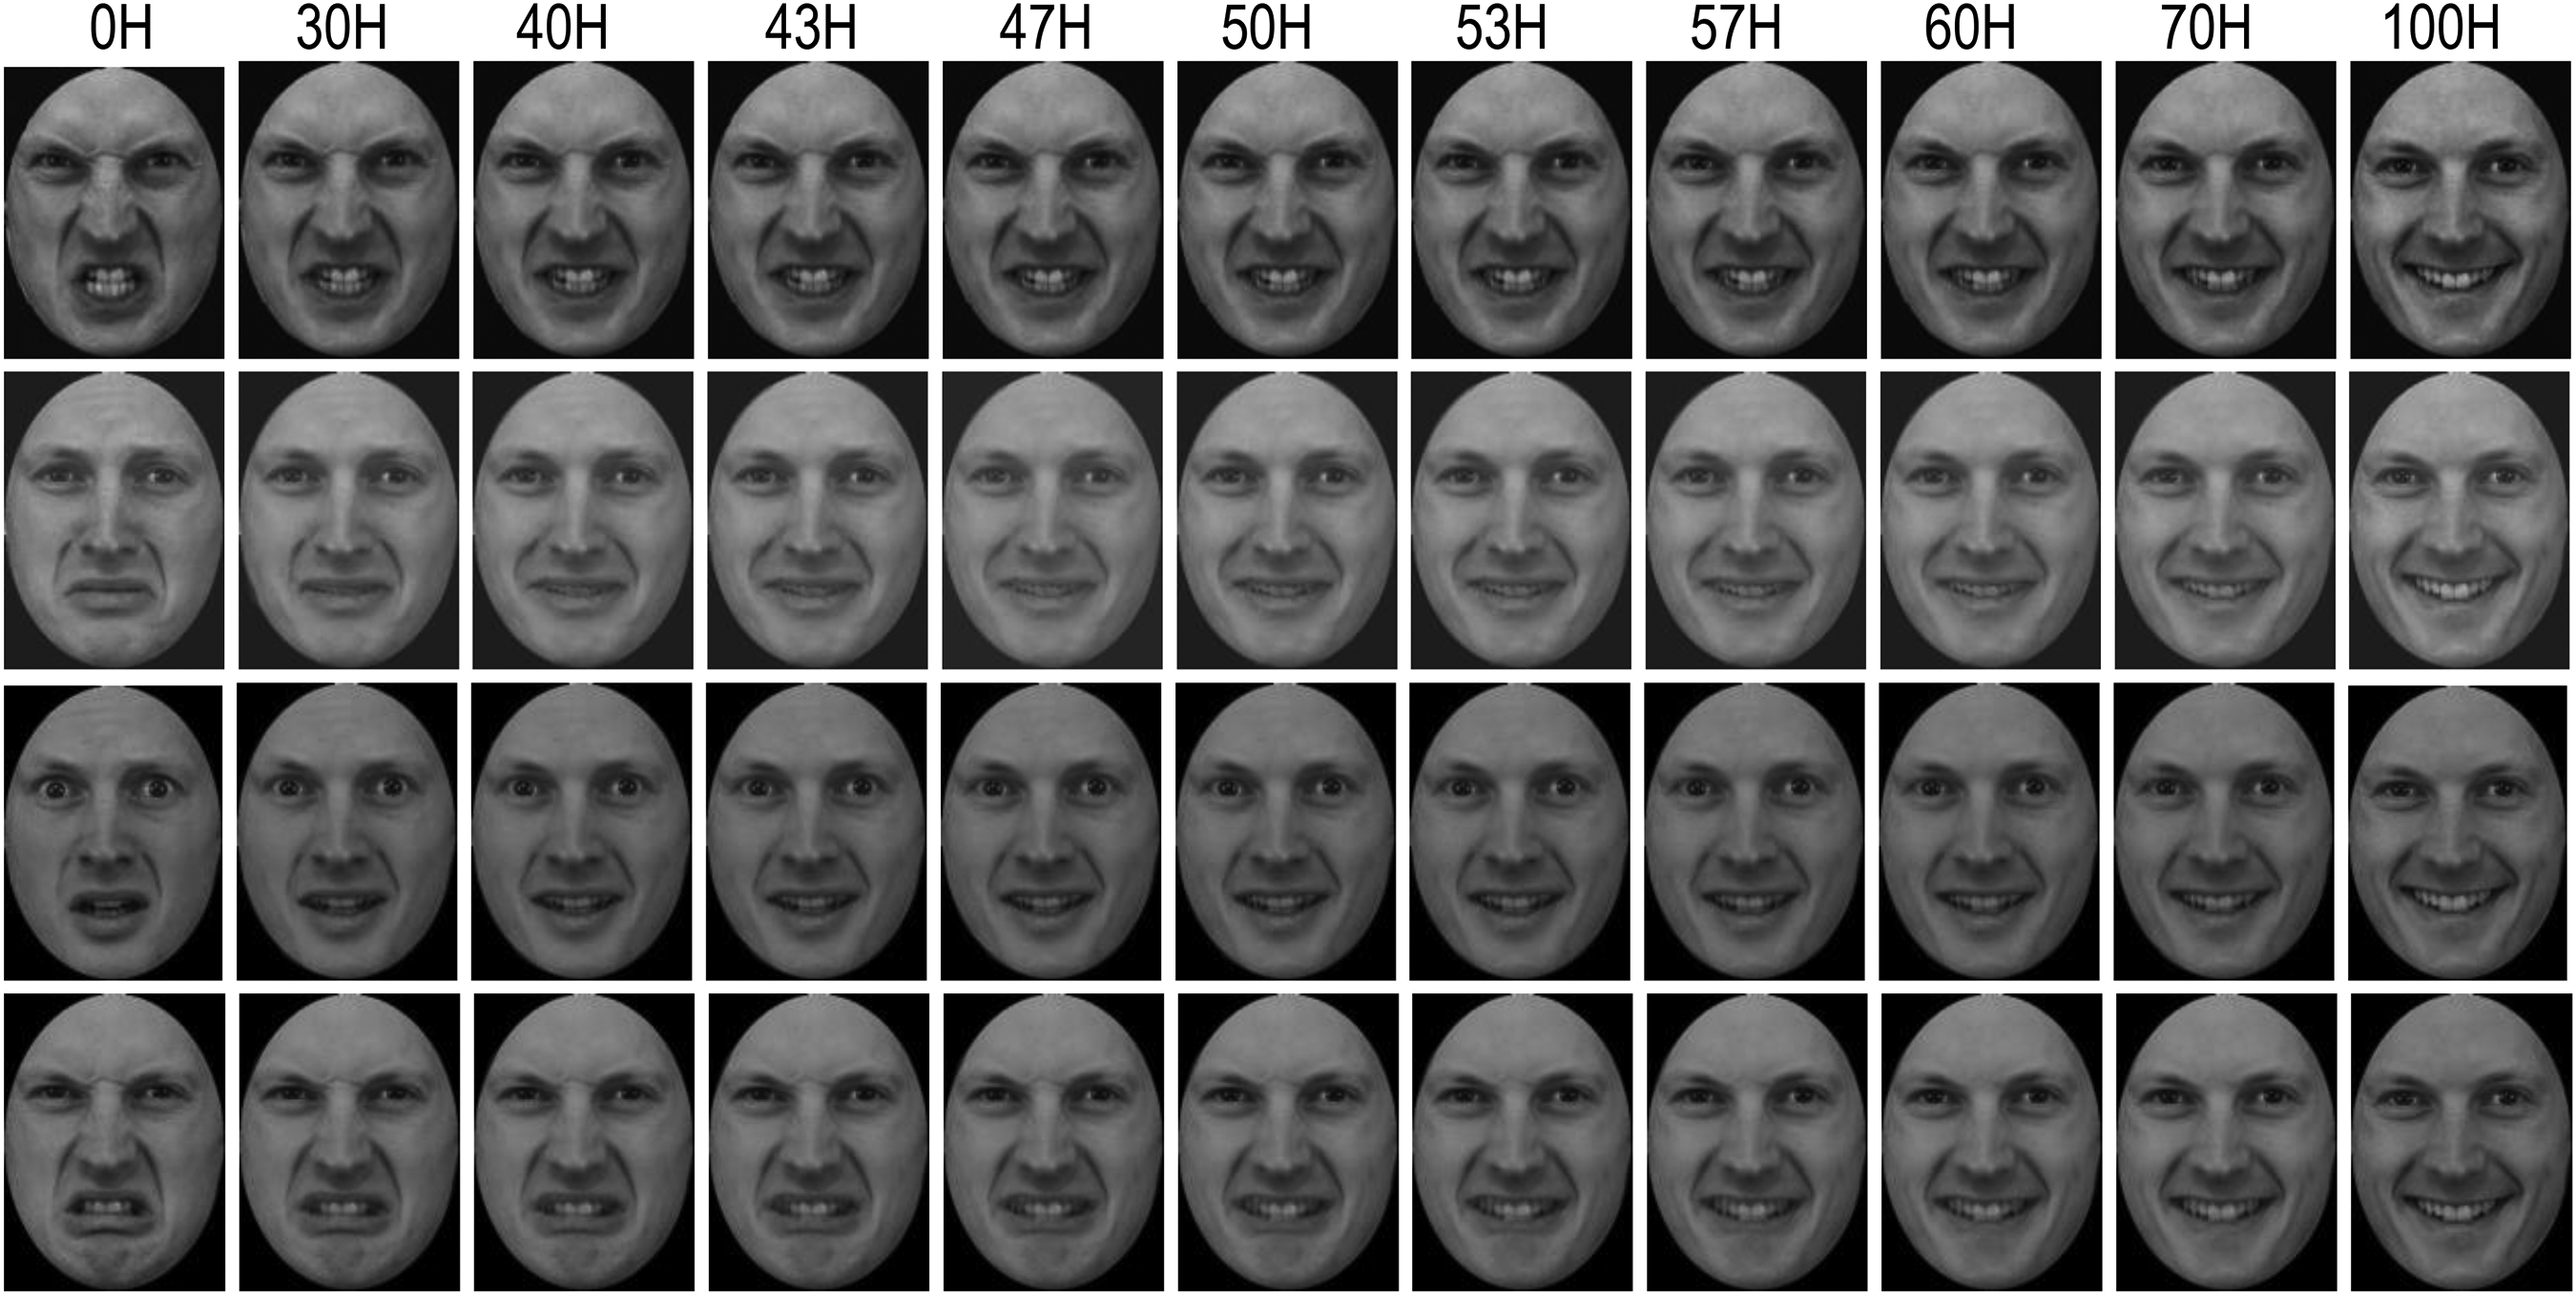
Examples of expressive faces mixed with different proportions of anger-happiness (1st row), sadness-happiness (2nd row), fear-happiness (3rd row), and disgust-happiness (4th row).
The experimental setup and eye-tracking calibration procedure were the same as in Experiment 1. After calibration, the participant pressed the response box to initiate a trial. The trial started with an FP displayed 10° left or right to the screen for 1 s, followed by a face image presented at the centre of the monitor. With the task instruction of ‘categorize this facial expression as carefully and as quickly as possible’, the participant was required to press the response box as soon as they identified the displayed expression (to record reaction time) and then verbally report the perceived expression category (five-alternative forced choice: happiness, sadness, anger, fear, or disgust). No reinforcement was given during this procedure. The procedures for data analysis were similar to those used in Experiment 1. Briefly, a series of ANOVAs were conducted to examine the effect of expression ambiguity and expression combination on participants’ expression categorization performance, reaction time, and associated face-viewing gaze allocation. For each ANOVA, Greenhouse–Geisser correction was applied where sphericity was violated. To uncover specific differences between group means where main effect of the independent variable was significant, a Bonferroni adjustment was made for post-hoc multiple comparisons with alpha set as 0.05 divided by the number of comparisons and corrected p-values were reported in the Results section. For each significant interaction between expression ambiguity and expression combination, a one-way ANOVA was conducted for each expression ambiguity with expression combination as an independent variable, followed by Bonferroni-adjusted post-hoc multiple comparisons where appropriate.
Results
Facial Expression Categorization
To examine how the interpreted expression category was affected by expression ambiguity and combination, we conducted 11 (expression ambiguity) × 4 (expression combination) ANOVAs with the percentage of perceived happiness collected for each expression ambiguity at each expression combination as the dependent variable. The analysis revealed a significant main effect of expression ambiguity (F(3.59, 104) = 617.21, p < .001, ηp2 = 0.96; Figure 5A) with increased happiness cues in the morphed faces leading to a monotonically increased happiness interpretation (all ps < .01); significant main effect of expression combination (F(2.06, 59.74) = 38.86, p < .001, ηp2 = 0.57; Table 1) with higher happiness interpretation in fear-happiness than in anger-, sadness- and disgust-happiness faces (all ps < .01); and significant expression ambiguity × expression combination interaction (F(10.99, 317.29) = 16.41, p < .001, ηp2 = 0.36). At each expression ambiguity, fear-happiness had the highest chance of being perceived as happiness (all ps < .05), whereas anger- and sadness-happiness had indistinguishable chances of being perceived as happiness (all ps > .05, except for 47H). Compared to anger- and sadness-happiness faces, disgust-happiness was less likely to be judged as happiness in the morphed faces containing <57% happy cues but was more likely in the faces containing ≥57H cues (all ps < .05, Table S11).
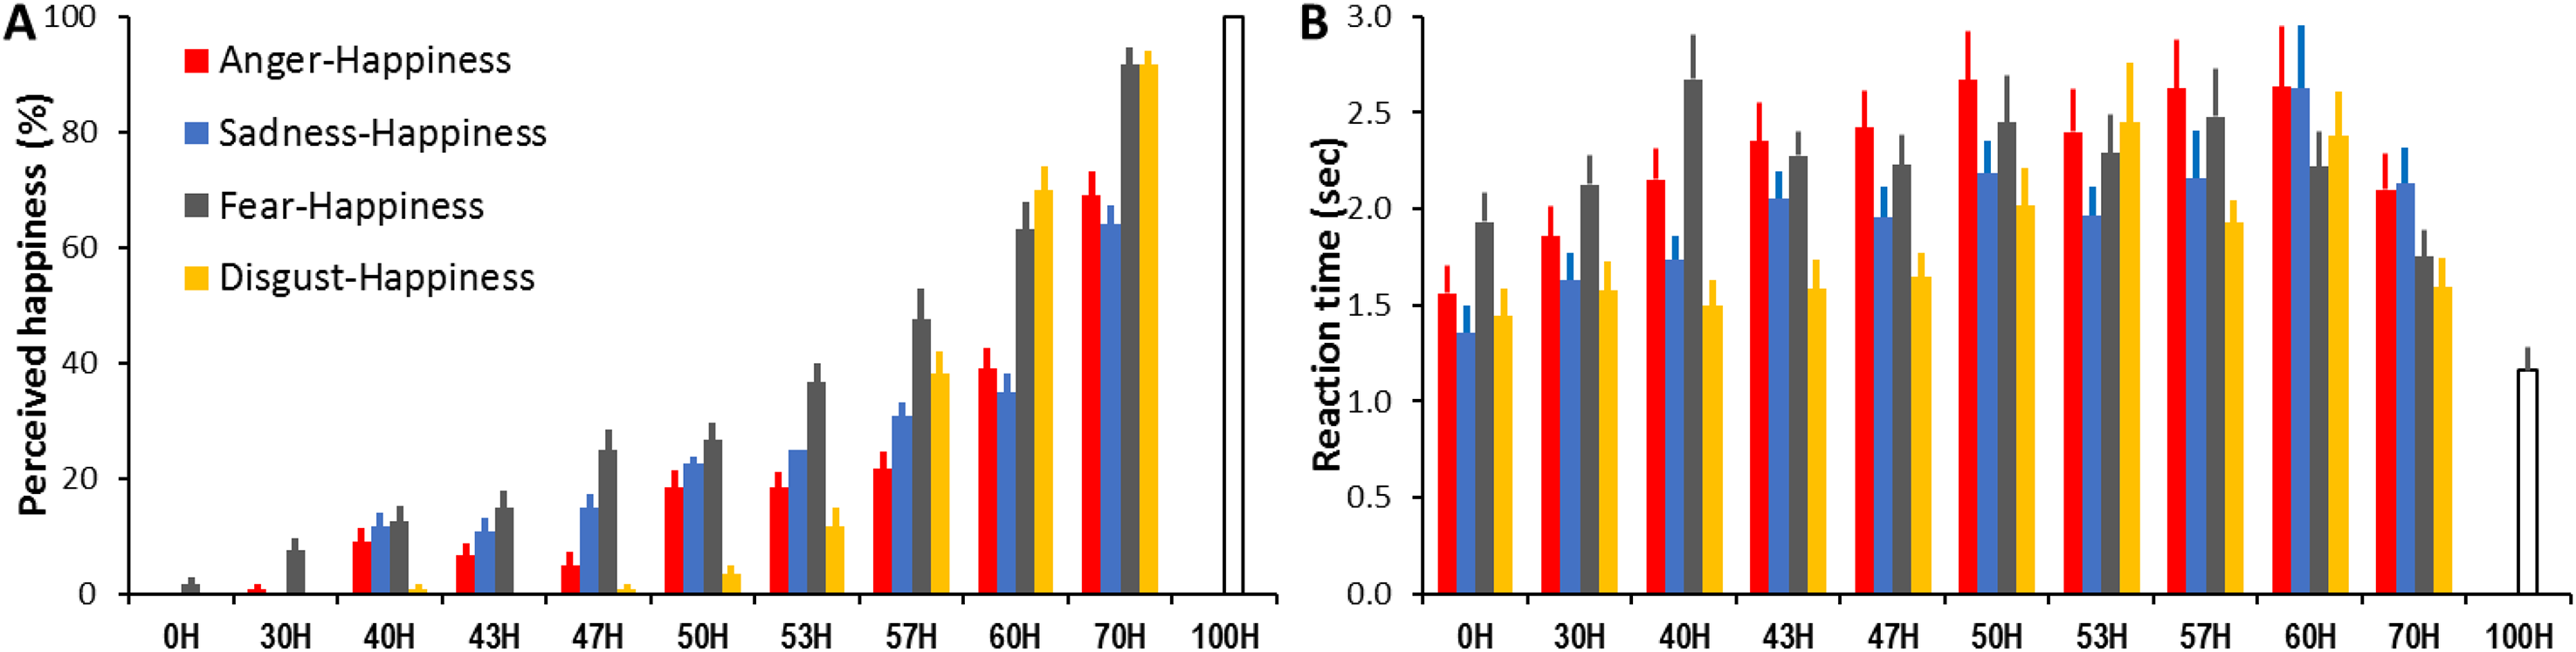
Percentage of perceived happy expression (A) and mean reaction time (B) as a function of the displayed anger-happiness, sadness-happiness, fear-happiness, and disgust-happiness expression ambiguity. Error bars represent SEM.
Behavioural responses in perceiving ambiguous facial expressions.
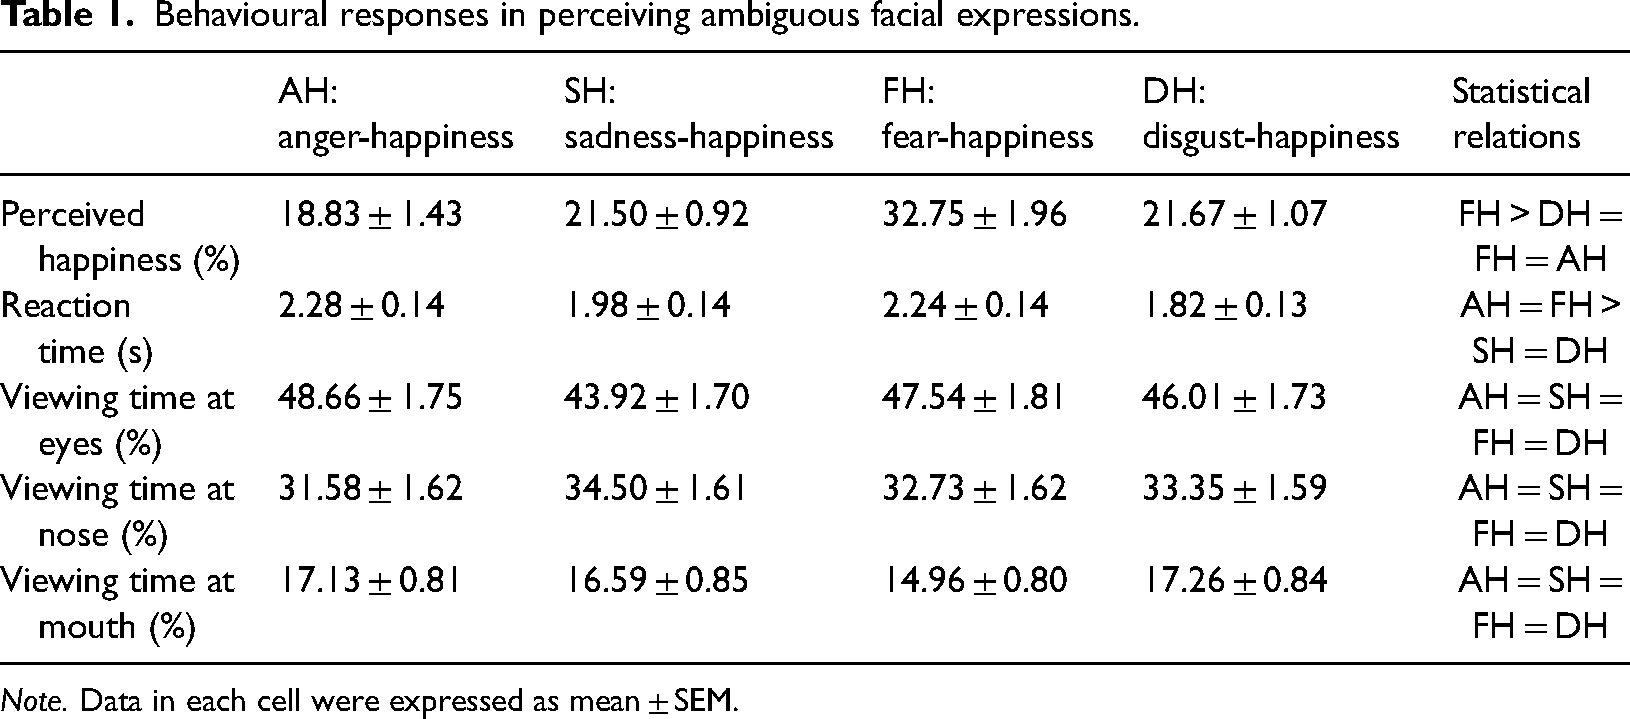
Note. Data in each cell were expressed as mean ± SEM.
Reaction Time
To measure whether expression ambiguity and combination affected participants’ speed in interpreting expressions, an 11 (expression ambiguity) × 4 (expression combination) ANOVA was conducted with the reaction time collected for each expression ambiguity at each expression combination as the dependent variable. The analysis revealed a significant main effect of expression ambiguity (F(4.39, 127.15) = 20.79, p < .001, ηp2 = 0.42; Figure 5B) with shorter reaction time in interpreting less ambiguous expressions (0H/30H/70H/100H vs. 40H/43H/47H/50H/53H/57H/60H, all ps < .05); significant main effect of expression combination (F(3, 87) = 21.79, p < .001, ηp2 = 0.43; Table 1) with longer reaction time in interpreting anger- and fear-happiness compared to sadness- and disgust-happiness faces (all ps < .01); and significant expression ambiguity × expression combination interaction (F(8.8, 255.27) = 2.93, p < .001, ηp2 = 0.09). For each expression ambiguity (except for 60H), the same happiness cues mixed with the other three expressions induced different reaction times (1-way ANOVA, all ps < .05). Participants were typically the fastest at interpreting disgust-happiness faces and the slowest at interpreting anger- and fear-happiness faces (all ps < .05; Table S12).
Face-Viewing Gaze Allocation
To determine whether the same facial features were attended to perceiving expressions across different expression ambiguities and combinations, we conducted 3 (face region) × 11 (expression ambiguity) × 4 (expression combination) ANOVAs with the proportion of viewing time directed at each face region as the dependent variable. The analysis revealed a significant main effect of face region (F(1.28, 33.37) = 9.96, p = .002, ηp2 = 0.28; Figure 6) with longer viewing allocated to the eyes and nose than the mouth (all ps < .05, Table 1); a significant main effect of expression combination (F(3, 78) = 4.41, p = .006, ηp2 = 0.15) with overall shorter viewing at sadness- and fear-happiness faces than at anger- and disgust-happiness faces (all ps < .05); but a non-significant main effect of expression ambiguity (F(3, 78.03) = .72, p = .54, ηp2 = 0.03). There also were significant face region × expression combination (F(3.77, 98.06) = 4.26, p = .001, ηp2 = 0.14), face region × expression ambiguity (F(7.23, 188.08) = 2.41, p = .02, ηp2 = 0.09), and face region × expression ambiguity × expression combination interactions (F(15.16, 394.21) = 6.62, p < .001, ηp2 = 0.2). These interactions indicated that when viewing an ambiguous expression at a given ambiguity, participants’ gaze allocation at a specific facial region was modulated by the expression combinations (anger-, sadness-, fear-, and disgust-happiness).
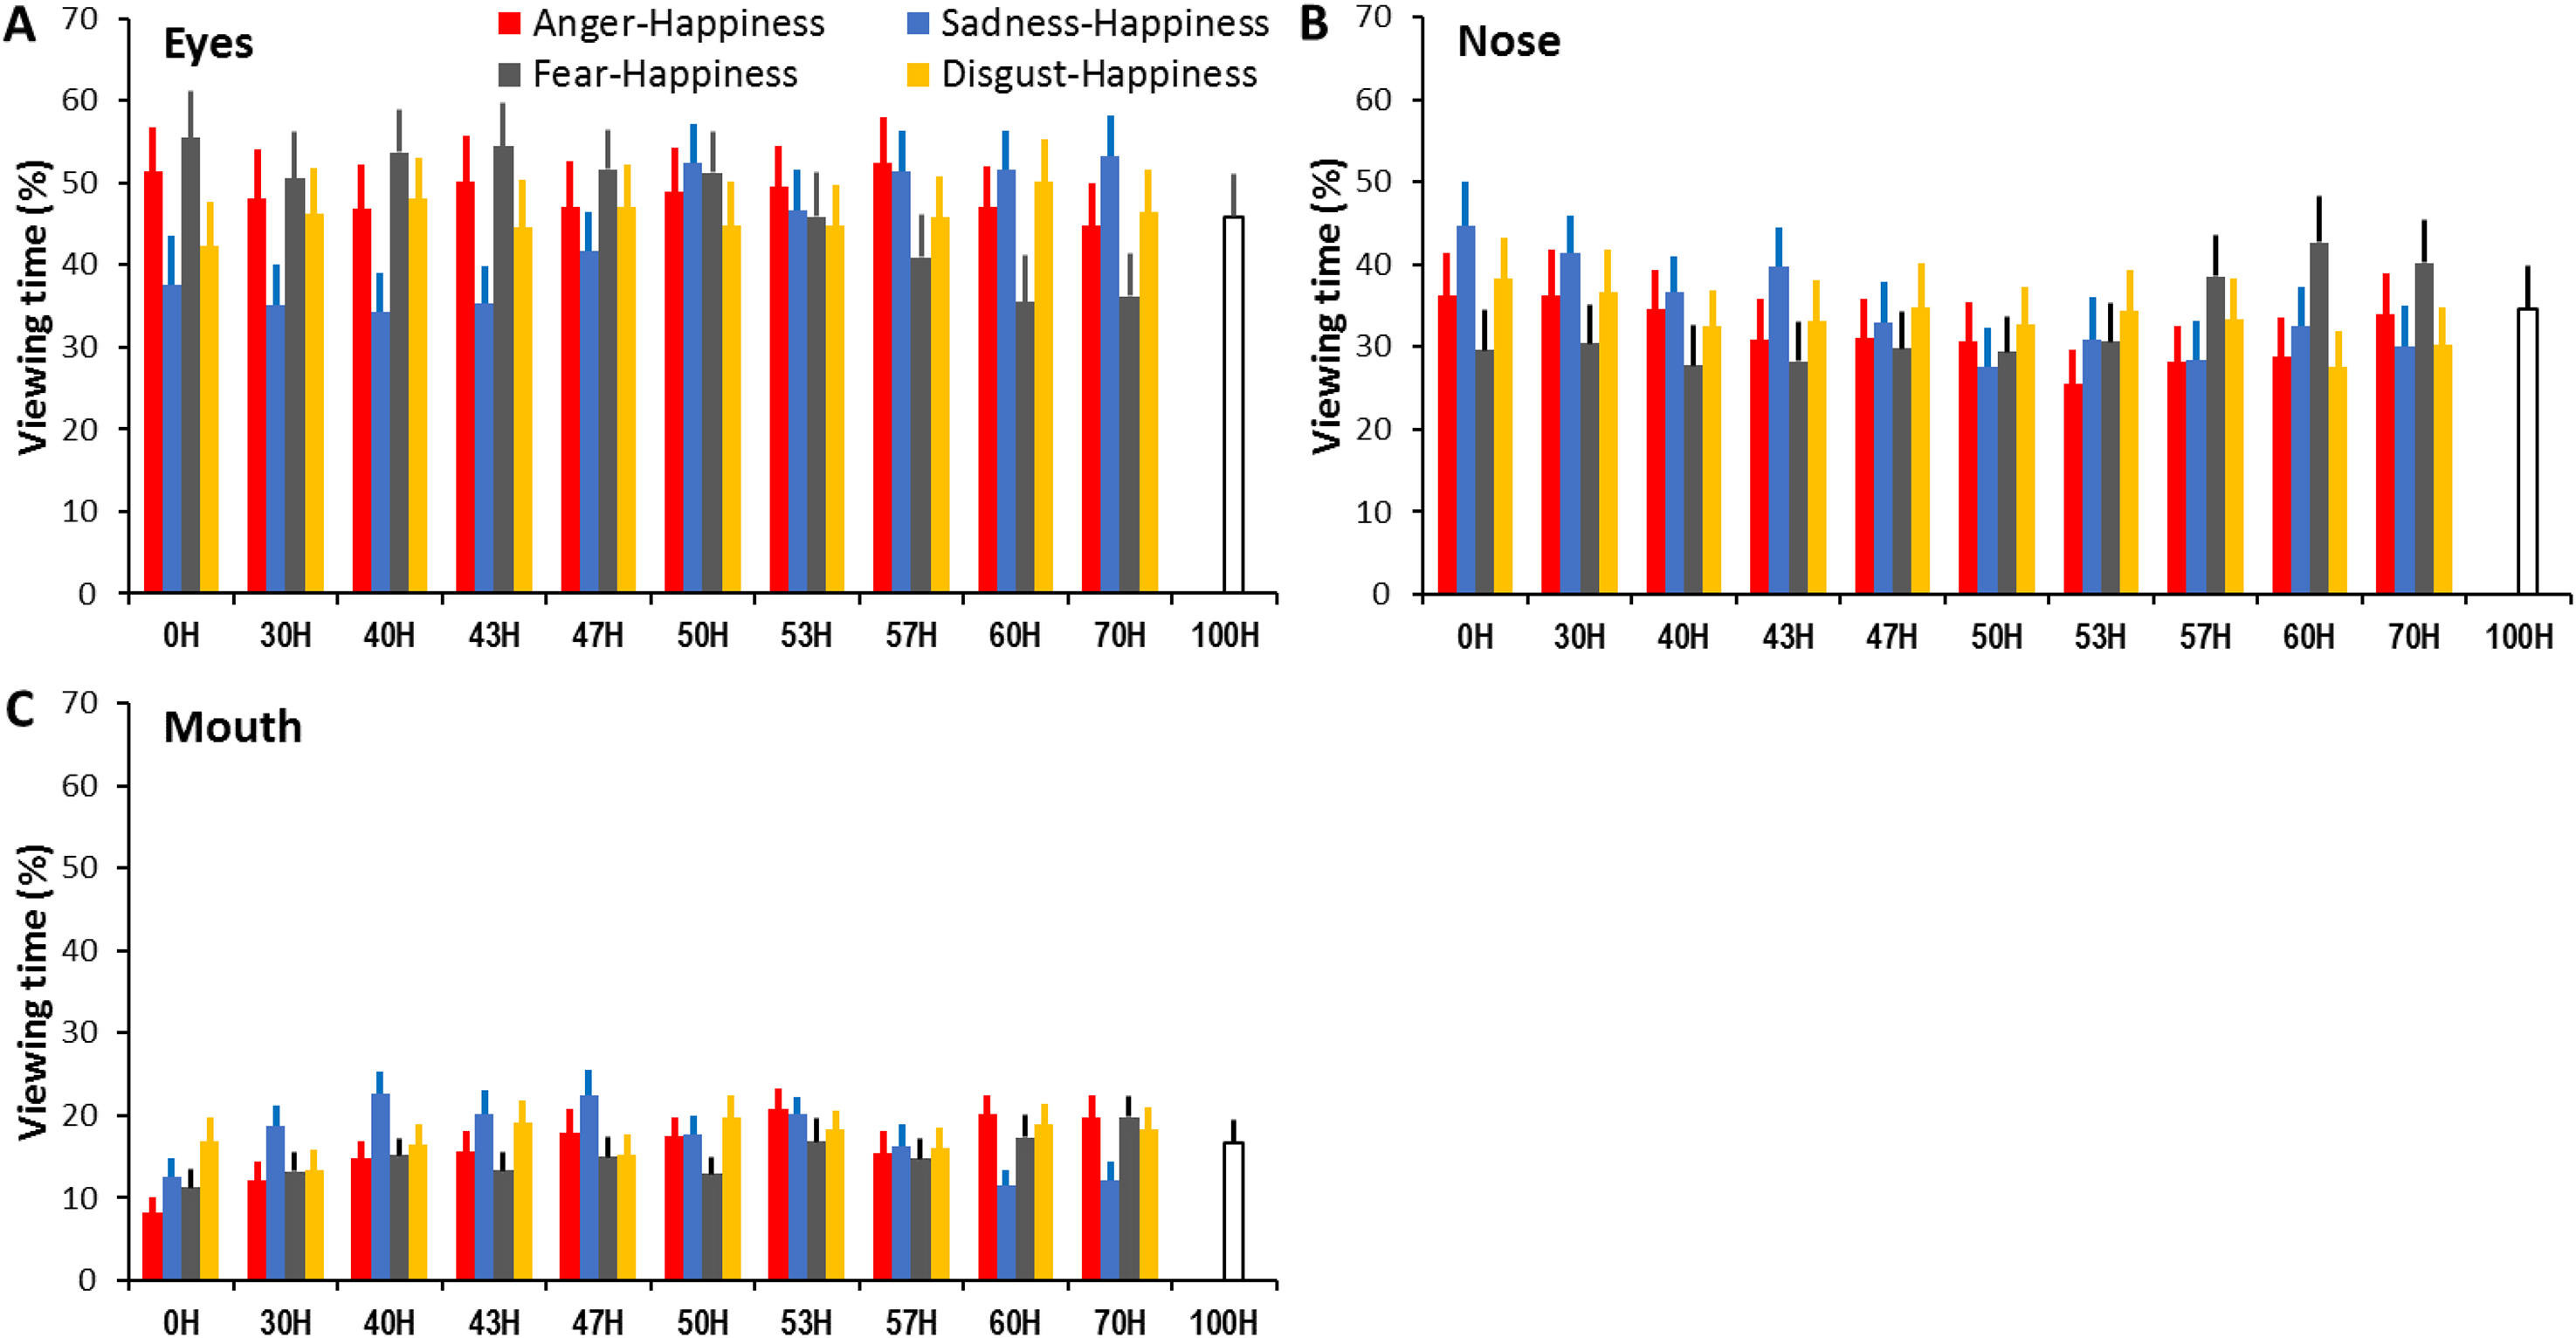
Percentage of viewing time directed at the eyes (A), nose (B), and mouth (C) when interpreting expressive anger-, sadness-, fear-, and disgust-happiness faces with different expression ambiguities. Error bars represent SEM.
Specifically, for each expression ambiguity (except for 50H and 53H), the same happiness cue mixed with the other three expressions attracted different viewing times directed at the eyes (1-way ANOVA, all ps < .05; Table S13). When the morphed faces contained <50% happy cues, the eyes in sadness-happiness and (in some cases) disgust-happiness faces tended to attract less viewing than in fear- and anger-happiness faces. However, when the morphed faces contained a high proportion of happiness (e.g., 57H, 60H, and 70H), the eyes in fear-happiness faces attracted less viewing than in other expression combinations (all ps < .05).
Similarly, the proportion of viewing time directed at the nose varied across different expression combinations at each expression ambiguity (except for 47H and 50H; 1-way ANOVA, all ps < .05; Table S14). When the morphed faces contained <50% happy cues, the nose in sadness-happiness faces attracted more viewing than in fear-happiness faces; but when the morphed faces contained >50% happiness, the nose in fear-happiness faces attracted more viewing than in other expression combinations (all ps < .05).
Finally, the proportion of viewing time directed at the mouth also varied across different expression combinations at each expression ambiguity (except for 50H, 53H and 57H; 1-way ANOVA, all ps < .05; Table S15). In comparison with other expression combinations, the mouth in sadness-happiness faces attracted longer viewing when the morphed faces contained a low proportion of happiness (e.g., 30H, 40H, and 43H), but shorter viewing when the morphed faces contained a high proportion of happiness (e.g., 60H and 70H) (all ps < .05). Additionally, when viewing prototypical non-happy faces (0H), participants gazed significantly more at the mouth in the disgust faces than in other expressions (all ps < .05).
General Discussion
In this study, we extended anger versus happiness bias in categorizing high- versus low-quality ambiguous anger-happiness expressions (Kinchella & Guo, 2021) to sadness/fear versus happiness bias in categorizing high- versus low-quality sadness-/fear-happiness expressions (Experiment 1), suggesting the existence of a general negativity versus positivity bias in interpreting valence-ambiguous facial expressions displayed at different image qualities. Interestingly, when perceiving high-quality ambiguous expressions, different expression combinations could further manipulate the degree of this general negativity bias (anger-happiness = sadness-happiness = disgust-happiness > fear-happiness faces), reaction time for expression categorization (anger-happiness = fear-happiness > sadness-happiness = disgust-happiness faces), and face-viewing gaze allocation (Experiment 2). It appears that these ambiguous facial expressive cues may be processed according to the analysis of emotion category rather than emotion valence.
One novel finding in Experiment 2 is that the participants showed different sensitivities to detect happiness when the same proportion of happy cues was mixed with angry, sad, fearful, or disgust cues (Figure 5A). They consistently had the lowest probability to report happiness in the morphed anger- or sadness-happiness faces across different expression ambiguities, probably due to our higher perceptual sensitivity to detect and recognize angry and sad expressions (Anderson, 2005; Lyyra et al., 2014) especially when feeling anxious and/or depressed (e.g., Penton-Voak et al., 2017; Surguladze et al., 2004). Indeed, anger and sadness typically attract higher recognition accuracy than other common facial expressions ever when posed at low expression intensities (Guo, 2012). Ambiguous fear-happiness faces, on the other hand, had the highest probability of being perceived as happiness. With the lowest recognition accuracy among common facial expressions, fear is more difficult to categorize and is often mistaken for surprise (Guo, 2012) due to the similarity in facial feature configuration between these two expressions (Roy-Charland et al., 2014). It is plausible that weak fearful cues in the morphed faces are confused with positive surprise cues, and the ambiguous fear-happiness faces have been subsequently labelled as happiness. Interestingly, compared to other expression combinations, disgust-happiness was less likely to be judged as happiness in the morphed faces, containing a low proportion of happy cues but more likely in the morphed faces with a higher proportion of happy cues. As there exist distinctive configuration and/or appearance differences in all local facial features (eye, nose, mouth) between happy and disgust expressions (Smith et al., 2005), it is less likely to mistake faces with a higher mix of disgust as happiness (i.e., low probability of reporting happiness in ambiguous faces containing <57H). On the other hand, like fear, prototypic disgust expression is associated with relatively low recognition accuracy (Guo, 2012); hence weaker disgust cues in happiness-dominated faces are less likely to be correctly identified (i.e., high probability of reporting happiness in ambiguous faces containing >57H). Overall, these significant differences in interpretation bias when assessing ambiguous expressions of different expression combinations may reflect a categorical process of perceiving ambiguous expressions, of which different expressions are categorised in different ways according to the discrete emotion prototypes that they correspond to (Calder et al., 1996; Ekman & Cordaro, 2011).
In agreement with previous research (Young et al., 1997), the reaction time for interpreting expressions was longer for more ambiguous than less ambiguous faces, probably due to extra time needed to evaluate the more ambiguous affective cues embedded in the diagnostic facial features (Guo et al., 2019). Such reaction time is further influenced by the morphed expression combinations. Participants were typically the fastest at interpreting disgust-happiness faces and the slowest at interpreting anger- and fear-happiness faces, especially when faces containing lower mix of happiness (<50H; Figure 5B). Coincidently, an early study has also reported longer reaction times in categorizing low-intensity fear and anger compared to disgust expressions (Guo, 2012), indicating those subtle or ambiguous fearful and angry cues, most likely transmitted through the eyes, require longer processing time than disgust cues that are more widely conveyed in the facial expressions. Overall, these significant differences in reaction time associated with interpreting ambiguous expressions also infer an emotion category-specific mechanism as opposed to a valence-general process underlying the processing of ambiguous facial expressions.
Our analysis of gaze distribution further implies an emotion category-specific process for viewing ambiguous facial expressions. For faces had the same expression ambiguity (i.e., the same proportion of happiness mixed with one of the other three expressions), the gaze allocation at individual facial features (eyes, nose, and mouth) systematically varied according to the diagnostic expressive cues needed for identifying anger, fear, sadness, and disgust expressions. Specifically, when inspecting ambiguous expressions containing less happiness (<50H), participants tended to direct more balanced viewing at local facial features (relatively reduced viewing at the eyes, but enhanced viewing at the nose and mouth) in disgust-happiness faces, but relatively more viewing at the eyes in anger- and fear-happiness faces, and at the nose and mouth in sadness-happiness faces (Figure 6). These patterns of gaze allocation in perceiving ambiguous expressions are consistent with those diagnostic local facial cues needed for categorical perception of prototypical facial expressions. For instance, the eyes transmit crucial information for recognizing angry and fearful faces (Smith et al., 2005; Wegrzyn et al., 2015). In comparison with anger and fear, reliable identification of sadness (especially when displayed at low-intensity) relies relatively more on information-rich nose and mouth areas which also attract longer viewing time (Guo, 2012; Smith et al., 2005; Yitzhak et al., 2022). The lower half of faces (e.g., nose wrinkling and upper lip raising) further convey diagnostic cues for identifying disgust (Smith et al., 2005; Wegrzyn et al., 2017; Yitzhak et al., 2022). It seems although participants adopted a holistic viewing strategy (i.e., scanning all key facial features) in perceiving ambiguous expressions, they attended relatively more to emotion category-specific diagnostic features.
Taken together, although we tend to show a general negativity bias to interpret vague facial expressions displaying valence-contradictory expressive cues, the perception of these ambiguous expressions seems to be guided by a categorical process similar to perceive those prototypical facial expressions, in which a set of predefined expression classifiers, each tuned to a specific emotion category, may mediate face-viewing gaze distribution and subsequent categorization of a particular expression (Calder et al., 1996; Ekman & Cordaro, 2011; Guo, 2012). However, these observed changes in behavioural responses alone, such as gazing at expression category-representative local facial regions at the early stage of face perception, expression category-modulated interpretation bias, and associated reaction time, are insufficient to conclusively differentiate between a ‘categorical’ and ‘continuous’ model of emotion perception. The possible similarities or differences in the cognitive and neural mechanisms underlying the perception of ambiguous and prototypical facial expressions could be examined in detail by further incorporating brain imaging techniques in future studies.
It should be noted that in this study we collected data mostly from UK undergraduate students. It remains to be seen whether the current findings can be generalised to other participant groups, such as subclinical or clinical participants with mental health issues (e.g., anxiety and depression) as they are usually more susceptible to expression interpretation bias (Penton-Voak et al., 2017), or participants from different cultural backgrounds as recent debates about the universality of the tested expressions (happiness, sadness, anger, fear, and disgust) have suggested some cross-cultural differences in categorizing these expressions and the associated face-viewing gaze allocation (e.g., Gendron et al., 2014; Jack et al., 2009). Furthermore, it is worth mentioning that the observed negativity bias might also be partially linked to participants’ perceptual sensitivity (e.g., the morphed 50A50H faces may not be perceived as containing 50% angry and 50% happy cues due to our nonlinear process in categorizing mixed emotions; Young et al., 1997) and nonlinear change in valence in the morphed faces (e.g., the 50A50H faces may not be perceived as having zero valence due to differences in expression intensity and/or valance ratings for the initial 100A and 100H faces). For instance, if the originating expressions (e.g., 100% happiness, sadness, anger, fear, or disgust) have different expression intensities, the more intensely expressed originating expression might bias the categorisation of the morphed expressions around 50H. Hence, the reported differences in perceived happiness when categorising the same ambiguity level for anger-happiness, sadness-happiness, fear-happiness, and disgust-happiness expressions (Figure 5A) may partly reflect differences in the intensity of the originating expressions. Further research could systematically control these limitations, such as using averaged facial expressions across different expressers to minimize individual differences in expression intensity when posing for the same expression category, or using animated faces with quantitative control of individual action units for each originating and morphed facial expression.
Supplemental Material
sj-docx-1-pec-10.1177_03010066231186936 - Supplemental material for Emotion category-modulated interpretation bias in perceiving ambiguous facial expressions
Supplemental material, sj-docx-1-pec-10.1177_03010066231186936 for Emotion category-modulated interpretation bias in perceiving ambiguous facial expressions by Emily Todd, Shaini Subendran, George Wright and Kun Guo in Perception
Footnotes
Author contribution(s)
Declaration of Conflicting Interests
The author(s) declared no potential conflicts of interest with respect to the research, authorship, and/or publication of this article.
Funding
The author(s) received no financial support for the research, authorship, and/or publication of this article.
Supplemental Material
Supplemental material for this article is available online.
References
Supplementary Material
Please find the following supplemental material available below.
For Open Access articles published under a Creative Commons License, all supplemental material carries the same license as the article it is associated with.
For non-Open Access articles published, all supplemental material carries a non-exclusive license, and permission requests for re-use of supplemental material or any part of supplemental material shall be sent directly to the copyright owner as specified in the copyright notice associated with the article.