
Abstract
We often show an invariant or comparable recognition performance for perceiving prototypical facial expressions, such as happiness and anger, under different viewing settings. However, it is unclear to what extent the categorisation of ambiguous expressions and associated interpretation bias are invariant in degraded viewing conditions. In this exploratory eye-tracking study, we systematically manipulated both facial expression ambiguity (via morphing happy and angry expressions in different proportions) and face image clarity/quality (via manipulating image resolution) to measure participants’ expression categorisation performance, perceived expression intensity, and associated face-viewing gaze distribution. Our analysis revealed that increasing facial expression ambiguity and decreasing face image quality induced the opposite direction of expression interpretation bias (negativity vs. positivity bias, or increased anger vs. increased happiness categorisation), the same direction of deterioration impact on rating expression intensity, and qualitatively different influence on face-viewing gaze allocation (decreased gaze at eyes but increased gaze at mouth vs. stronger central fixation bias). These novel findings suggest that in comparison with prototypical facial expressions, our visual system has less perceptual tolerance in processing ambiguous expressions which are subject to viewing condition-dependent interpretation bias.
Keywords
Introduction
Understanding facial expressions of emotion in an accurate and timely manner plays a critical role in human social interactions. Previous research has proposed the existence of four or six basic facial expressions (e.g., happiness, sadness, anger/disgust, fear/surprise) that signify our typical emotional states, are accompanied by distinctive patterns of facial muscle movements, and can be recognised as discrete categories of emotion by people from different cultures (Ekman & Rosenberg, 2005; Jack et al., 2009). This expression categorisation process is often associated with a stereotypical pattern of gaze behaviour, in which (at least) western participants tend to scan three informative local facial regions (i.e., eyes, nose, and mouth), but look more often at those regions conveying diagnostic cues for each expression, such as eyes in angry faces and mouth in happy faces (Eisenbarth & Alpers, 2011; Guo, 2012; Schurgin et al., 2014).
Probably for the purpose of biologically important invariant expression categorisation, our visual system has demonstrated a good tolerance (within given limits) for perceiving expressive faces varied in viewing conditions, such as viewing perspective, viewing distance, expression intensity, and image quality. Typically, comparable expression categorisation accuracies have been observed when the face viewing perspective was shifted from full frontal view to mid-profile or profile view (Guo & Shaw, 2015; Matsumoto & Hwang, 2011) or when the face image size was manipulated to simulate typical human social interaction distance up to 5 m (Guo, 2013). Blurring the face image up to 15 cycles/image (Guo et al., 2019) or reducing the facial expression intensity to 40% to 60% of its peak intensity (Guo, 2012) and the face image resolution to 64 × 48 pixels (Guo et al., 2019) or less (up to 30 × 20 pixels for some expressions; Du & Martinez, 2011; Johnston et al., 2003) also have little deterioration impact on expression recognition performance.
It is worth mentioning that these studies only examined those clearly defined prototypical facial expressions, including happiness, anger, fear, sadness, surprise, and disgust. In real life, however, facial expressions could be mixed and categorically ambiguous, such as happy crying or fake smile to hide anger. The perception of these vague expressions containing contradictory emotional cues (e.g., happy vs. sad/angry) is subject to interpretation bias, typically negativity bias (i.e., tendency to interpret uncertain stimuli or events as negative to ensure a more urgent response; Rozin & Royzman, 2001) which has been commonly reported in people with mental health disorders such as depression and anxiety (Penton-Voak et al., 2017). It is unclear to what extent the categorisation of ambiguous expressions and associated interpretation bias are invariant across different viewing conditions.
One study has shed light on this research question. Neta and Whalen (2010) applied spatial frequency filters on surprised face images, an ambiguous expression which can be perceived as either positively or negatively valenced, and observed that participants tended to interpret blurred surprise expression as negatively valenced. In contrast, the manipulation of image spatial frequency had little impact on the valence judgement of those faces with clear emotional valence, such as happiness, fear, and anger, indicating that the valence categorisation of ambiguous surprise expression is more susceptible to the change of face image clarity, and might be less invariant in degraded viewing conditions. Interestingly, this interpretation bias was further associated with face-viewing gaze allocation bias, as individuals with shorter saccade latencies to fixation on the mouth and longer viewing at the mouth were more likely to interpret the blurred surprise faces as positively valenced (Neta et al., 2017). It should be noted although surprise is inherently ambiguous in valence, it is categorised as a single emotion type which makes it difficult to manipulate the degree of expression ambiguity. We know little about to what extent the interpretation of faces containing two contradictory emotions in different ambiguities (e.g., happiness-anger in different mixes) is affected by image clarity/quality.
In this exploratory eye-tracking study, we systematically manipulated both facial expression ambiguity (via morphing happiness and anger in different proportions) and face image quality (via manipulating image resolution) to further examine our visual tolerance in processing ambiguous facial expressions. We chose to morph happiness-anger rather than other expression combinations because interpreting ambiguous expression toward anger plays a causal role in the maintenance of aggression and could significantly affect individuals’ mental health and social behaviour (Penton-Voak et al., 2013, 2017). In addition to expression categorisation performance, we also analysed the perceived expression intensity, an integral part of expression perception which could be affected more heavily by the changes of viewing settings (Guo & Shaw, 2015; Guo et al., 2019). Furthermore, as the face-viewing gaze allocation could be tightly coupled with expression categorisation accuracy (e.g., Adolphs et al., 2005) and bias (e.g., Neta et al., 2017), we examined whether the same diagnostic visual cues in faces varying in expression ambiguity and image clarity were used for expression interpretation.
Materials and Methods
Participants
To control potential culture differences in expression recognition performance and associated gaze behaviour (Jack et al., 2009), only Caucasian participants were recruited. In total, 37 undergraduate students (6 males and 31 females), age ranging from 19 to 22 years with the mean of 20.05 ± 0.14 (mean ± SEM), successfully completed this study in return for course credit. This sample size is compatible with those published studies in this field (e.g., Guo et al., 2019; Röhrbein et al., 2015), and its suitability was confirmed by power analysis using G*power software (Faul et al., 2009). With a relatively conservative effect size (
Visual Stimuli
Grey-scale white western Caucasian face images, consisting of two female and two male models displaying happy and angry expressions in full frontal view, were selected from the Karolinska Directed Emotional Faces CD ROM (Lundqvist et al., 1998). To represent typical high-intensity expressions viewed in our daily life, happy faces included four open mouth happiness, and angry faces included two open mouth anger and two closed mouth anger. These faces were processed in Adobe Photoshop to remove external facial features (e.g., hair) and to ensure a homogenous grey background, face size and brightness (Green & Guo, 2018). For each model, Morpheus Photo Morpher was used to morph the angry face (treated as 100% angry expression, 100A) with the happy face (100H) to create 11 expressive face images with different mix of anger and happiness proportions, such as 100A, 70A30H, 60A40H, 57A43H, 53A47H, 50A50H, 47A53H, 43A57H, 40A60H, 30A70H, and 100H. Instead of using equal space to mix anger-happiness expressions, we chose more morphing proportions around 50A50H (e.g., 57A43H, 53A47H, 47A53H, 43A57H) to create more ambiguous expressions to induce relatively frequent expression interpretation bias.
The morphed face images were then resized to 384 × 512 pixels (14 × 19°, roughly equivalent to viewing a face from 70 cm away or at close personal distance; Guo, 2013) and were referred as “high-quality” Resolution 1 condition. Based on previous research (Guo et al., 2019), two degraded levels of image resolution were used to induce significant deterioration effect of face image quality on expression categorisation performance. Specifically, for each of those high-quality face images, two subsequent faces were constructed by further downsizing to 24 × 32 pixels (“medium-quality” Resolution 1/16 condition) and 12 × 16 pixels (“low-quality” Resolution 1/32 condition). To provide a constant presentation size for all face images, the two downsized faces were scaled back to 384 × 512 pixels using bilinear interpolation, which preserves most of the spatial frequency components (Guo et al., 2019). As a result, 132 expressive face images were generated for the testing session (4 Models × 11 Expression Ambiguities × 3 Image Resolutions, see Figure 1 for examples). These face images were gamma corrected and displayed once in a random order (a new random order for each participant) in one block during the testing.
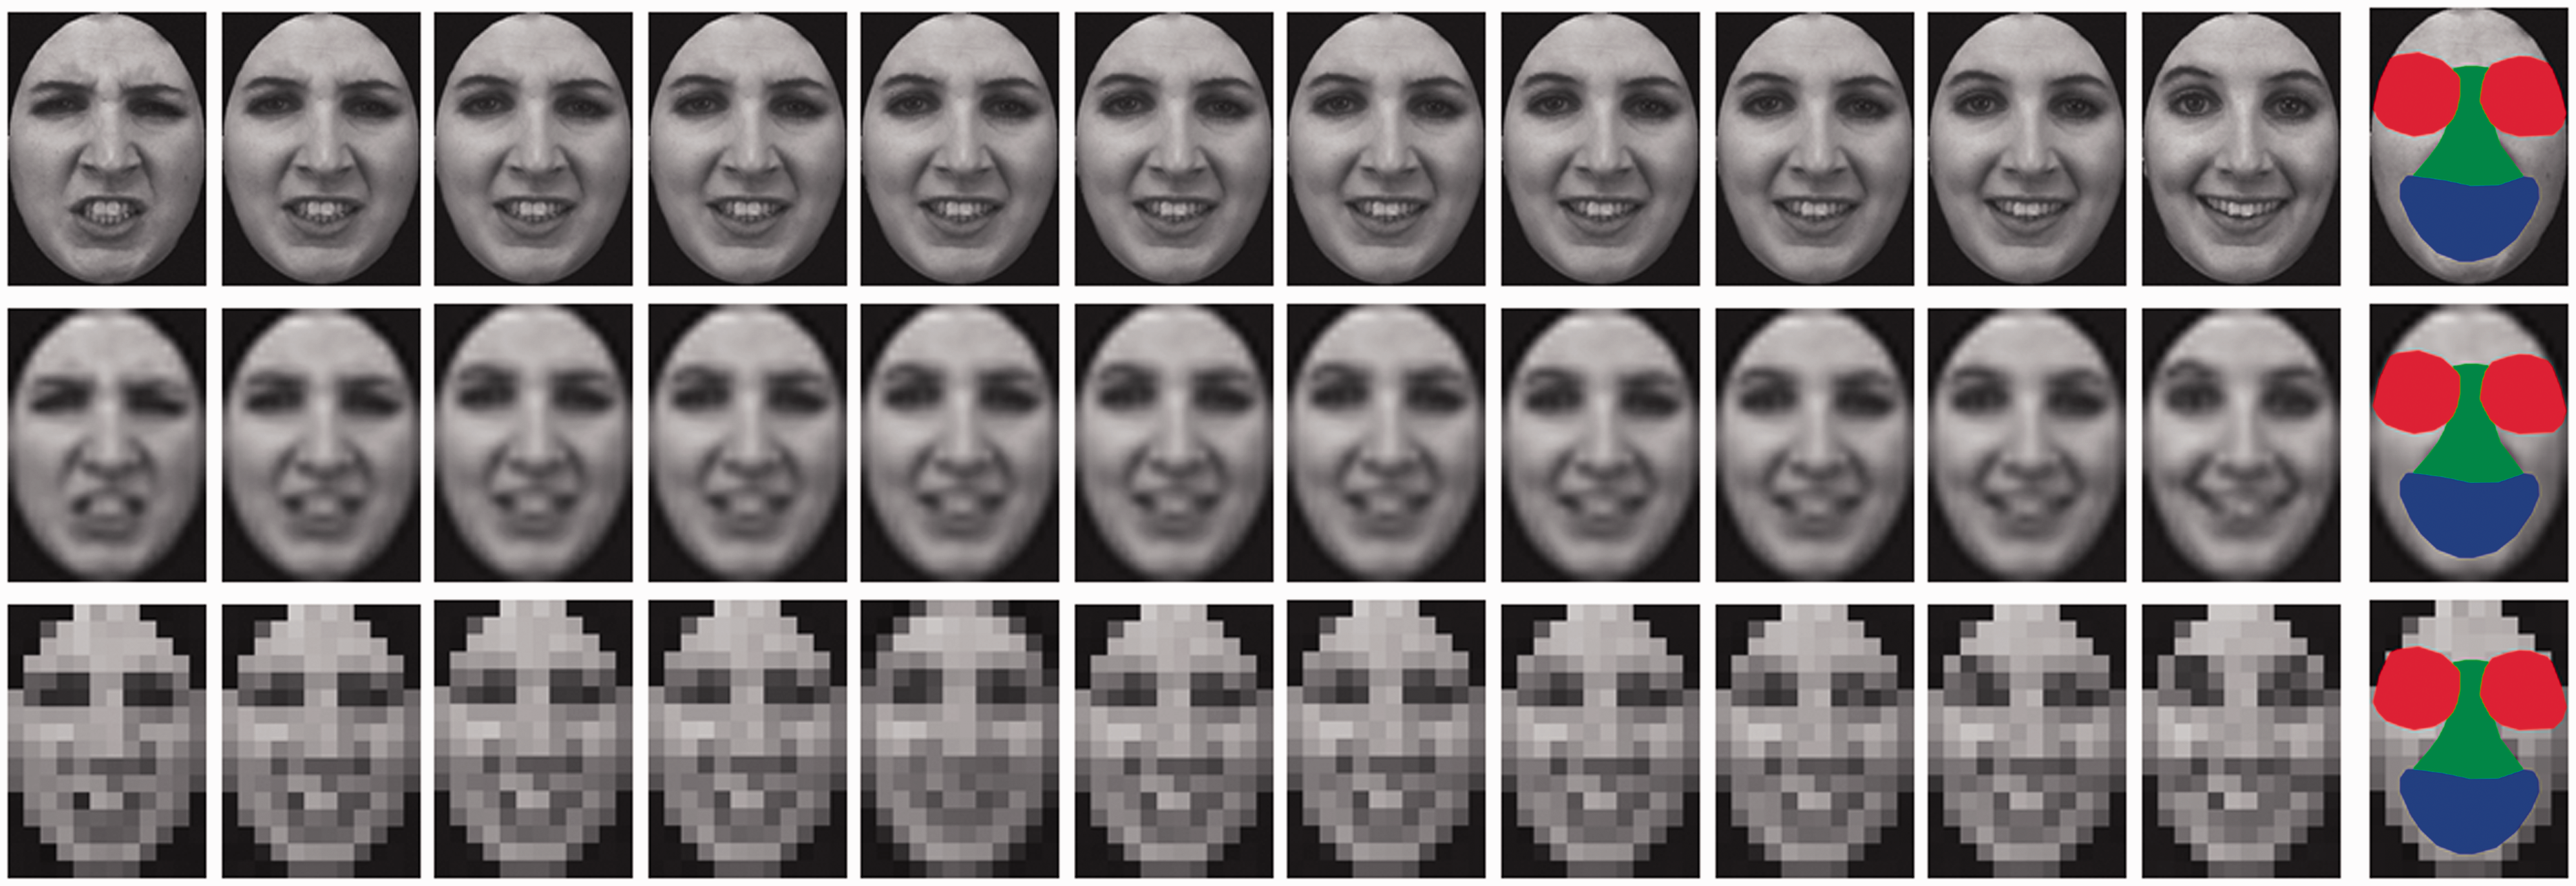
Examples of Expressive Faces Mixed With Different Proportions of Anger and Happiness (From Left to Right: 100A, 70A30H, 60A40H, 57A43H, 53A47H, 50A50H, 47A53H, 43A57H, 40A60H, 30A70H, and 100H) at Varying Image Resolutions (From Top to Bottom: Resolution 1, Resolution 1/16, and Resolution 1/32). The faces in the last column show examples of the facial regions that were used in the eye-tracking analyses. The red, green, and blue areas represent the eyes, nose, and mouth regions, respectively.
Procedure
The general experimental setup and procedure for data collection and analysis were similar to Guo et al. (2019), from which the following details are reproduced. The digitised face images were presented through a ViSaGe graphics system (Cambridge Research Systems, UK) and displayed on a non-interlaced gamma-corrected colour monitor (30 cd/m2 background luminance, 100 Hz frame rate, Mitsubishi Diamond Pro 2070SB) with the resolution of 1,024 × 768 pixels. At a viewing distance of 57 cm, the monitor subtended a visual angle of 40 × 30°.
During the eye-tracking experiment, the participants sat in a chair with their head restrained by a chin-rest and viewed the display binocularly. Horizontal and vertical eye positions from the dominant eye (determined through the Hole-in-Card test) were measured using a pupil-centre/cornea-reflection Video Eyetracker Toolbox with 250 Hz sampling frequency and up to 0.25° accuracy (Cambridge Research Systems, UK). Eye movement signals were first calibrated by instructing the participant to follow a fixation point (FP, 0.3° diameter, 15 cd/m2 luminance) displayed randomly at one of the nine positions (3 × 3 matrix) across the monitor (distance between adjacent FP positions was 10°). After the calibration procedure, the participant pressed the response box to initiate a trial. The trial was started with an FP displayed 10° left or right to the screen centre to minimise central fixation bias. If the participant maintained fixation for 1 second, the FP disappeared and a face image was presented at the centre of the monitor for 3 seconds. The participant was instructed to “categorise this facial expression as accurately as possible” and verbally report the perceived expression (two-alternative forced choice: happiness or anger) and its intensity on a 9-point scale, in which 1 represents not expressive at all and 9 represents extremely expressive. The reported responses were typed into the eye-tracking software developed in MATLAB by the researcher. No reinforcement was given during this procedure.
Data Analysis
All the collected data were analysed off-line. For eye movement data, the software developed in MATLAB computed horizontal and vertical eye displacement signals as a function of time to determine eye velocity and position. Fixation locations were then extracted from raw eye-tracking data using velocity (less than 0.2° eye displacement at a velocity of less than 20°/second) and duration (greater than 50 milliseconds) criteria (Guo, 2007). To determine gaze allocation at key internal facial features (i.e., eyes, nose, and mouth), a consistent criterion was adopted to define boundaries between facial features to ensure equal size of individual feature across faces of different expressions from the same model (Guo et al., 2010). Specifically, the “eye” region included the eyes, eyelids, and eyebrows; the “nose” or “mouth” region consisted of the main body of the nose or mouth and immediate surrounding area (up to 0.5°). The division line between the mouth and nose regions was the midline between the upper lip and the bottom of the nose (see Figure 1 for examples). The viewing time allocated to each facial feature was normalised in proportion to total viewing time sampled in that trial.
A series of repeated measures analysis of variance (ANOVAs) were conducted to examine the effect of expression ambiguity and image quality on participants’ expression categorisation performance, perceived expression intensity, and associated face-viewing gaze allocation. For each ANOVA, Greenhouse–Geisser correction was applied where sphericity was violated. To uncover specific differences between group means where main effect of the independent variable was significant, a Bonferroni adjustment was made for post hoc multiple comparisons with alpha set as .05 divided by number of comparisons and corrected-p values were reported in “Results” section. For each significant interaction in two-way or three-way ANOVAs, one-way ANOVA was conducted for each combination of the groups of the two or three independent variables, followed by Bonferroni-adjusted post hoc multiple comparisons where appropriate. Only significant results were reported.
Results
To examine the extent to which the interpreted facial expression category was affected by the displayed facial expression ambiguity and face image resolution/quality, we conducted 11 (Expression Ambiguity) × 3 (Image Quality) ANOVAs with the proportion of perceived happiness collected for each expression ambiguity at each image quality as the dependent variable. The analysis revealed significant main effect of expression ambiguity, F(5.80, 208.87) = 225.09, p < .001, ηp2 = .86; Figure 2, with increased mix of happiness from 0% to 100% in the morphed faces leading to monotonically increased happiness interpretation from 12.84% ± 1 to 90.99% ± 1.22 (post hoc multiple comparisons, all ps < .05); significant main effect of image quality, F(1.55, 55.89) = 106.61, p < .001, ηp2 = .75, with low-quality faces attracting the highest happiness categorisation (64.37% ± 2.02) followed by medium-quality (44.17% ± 1.38) and then by high-quality faces (31.94% ± 1.36; all ps < .01); and significant Expression Ambiguity × Image Quality interaction, F(11.63, 418.76) = 23.54, p < .001, ηp2 = .4. Overall, as a group, participants were less likely to report happiness in high- and medium-quality face images but were more likely to report happiness in low-quality images. For instance, a face with equal mix of angry and happy expressions (50A50H) was categorised as happy in 24.32% ± 2.47, 33.11% ± 3.07 and 67.57% ± 3.07 of the trials in high-, medium- and low-quality conditions, respectively (all ps < .05). Specifically, the gradual degradation in face quality induced monotonically increased preference to interpret ambiguous expression as happy when there was <60% happy cues in the faces (low- vs. medium- vs. high-quality for each face ambiguity, all ps < .05). This trend was less evident for predominantly happy expressions, such as 40A60H, 30A70H, and 100H faces, in which low-quality faces induced indistinguishable or even less happiness categorisation than medium-quality faces (all ps > .05 except for 100H).
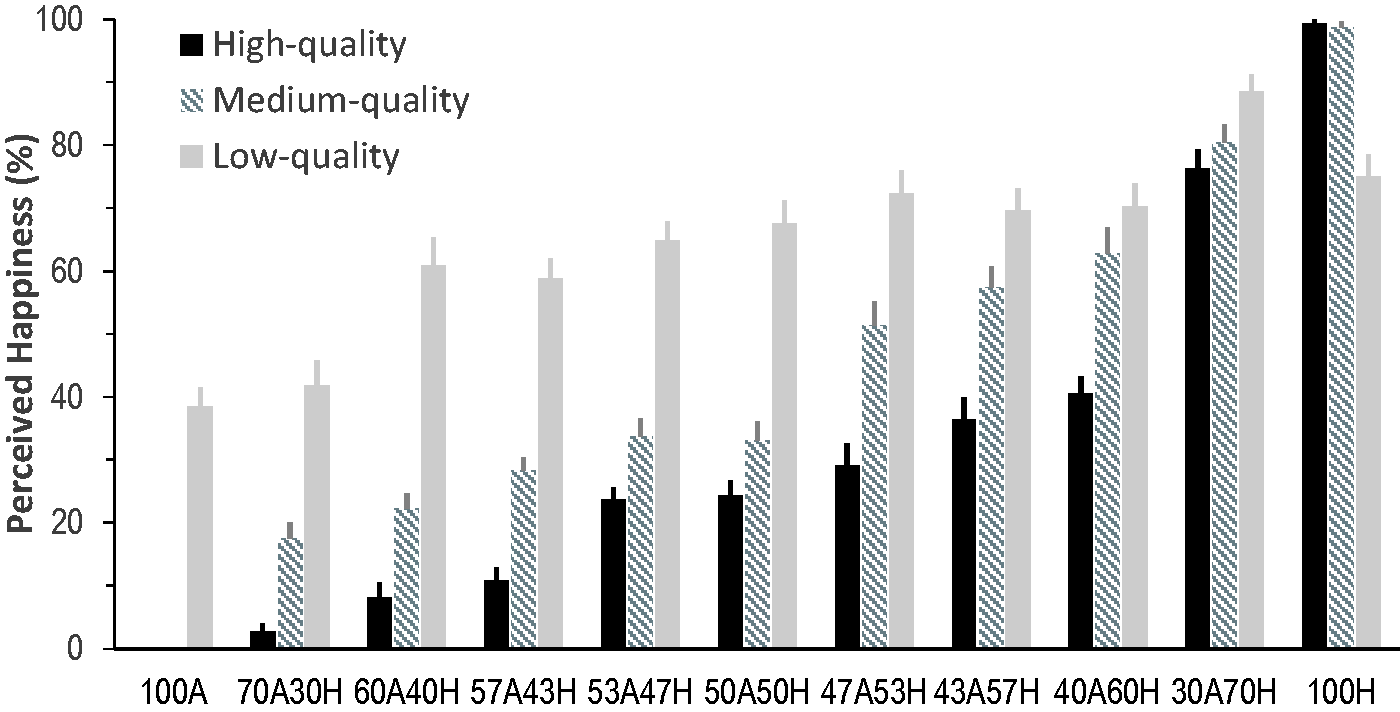
Proportion of Perceived Happy Expression as a Function of the Displayed Facial Expression Ambiguity (100A, 70A30H, 60A40H, 57A43H, 53A47H, 50A50H, 47A53H, 43A57H, 40A60H, 30A70H, and 100H) and Face Image Quality (Resolution 1, 1/16, and 1/32 for High-, Medium-, and Low-Quality, Respectively). Error bars represent SEM.
We then examined the extent to which the perceived expression intensity was affected by the displayed facial expression ambiguity and face image quality; 11 (Expression Ambiguity) × 3 (Image Quality) ANOVAs revealed significant main effect of expression ambiguity, F(4.58, 164.84) = 109.18, p < .001, ηp2 = .75; Figure 3, with less intense expression perceived for more mixed/ambiguous expressions (e.g., 3.63 ± 0.12 for 47A53H faces) than less mixed expressions (e.g., 5.80 ± 0.21 for 100 A, 5.83 ± 0.18 for 100H); significant main effect of image quality, F(1.30, 46.96) = 32.15, p < .001, ηp2 = .47, with high-quality faces attracting the highest intensity ratings (5.14 ± 0.19) followed by medium-quality (4.65 ± 0.16) and then by low-quality faces (3.25 ± 0.24; all ps < .05); and significant Expression Ambiguity × Image Quality interaction, F(20, 720) = 25.5, p < .001, ηp2 = .42. Specifically, ambiguity-induced reduction in intensity rating was apparent for high- and medium-quality faces (all ps < .05) but was less clear for low-quality faces. Furthermore, face degradation-induced reduction in intensity rating was more evident for less mixed expressions but was less obvious for more mixed expressions (e.g., high- vs. medium-quality for 60A40H, 57A43H, 53A57H, and 50A50H faces, all ps > .05).
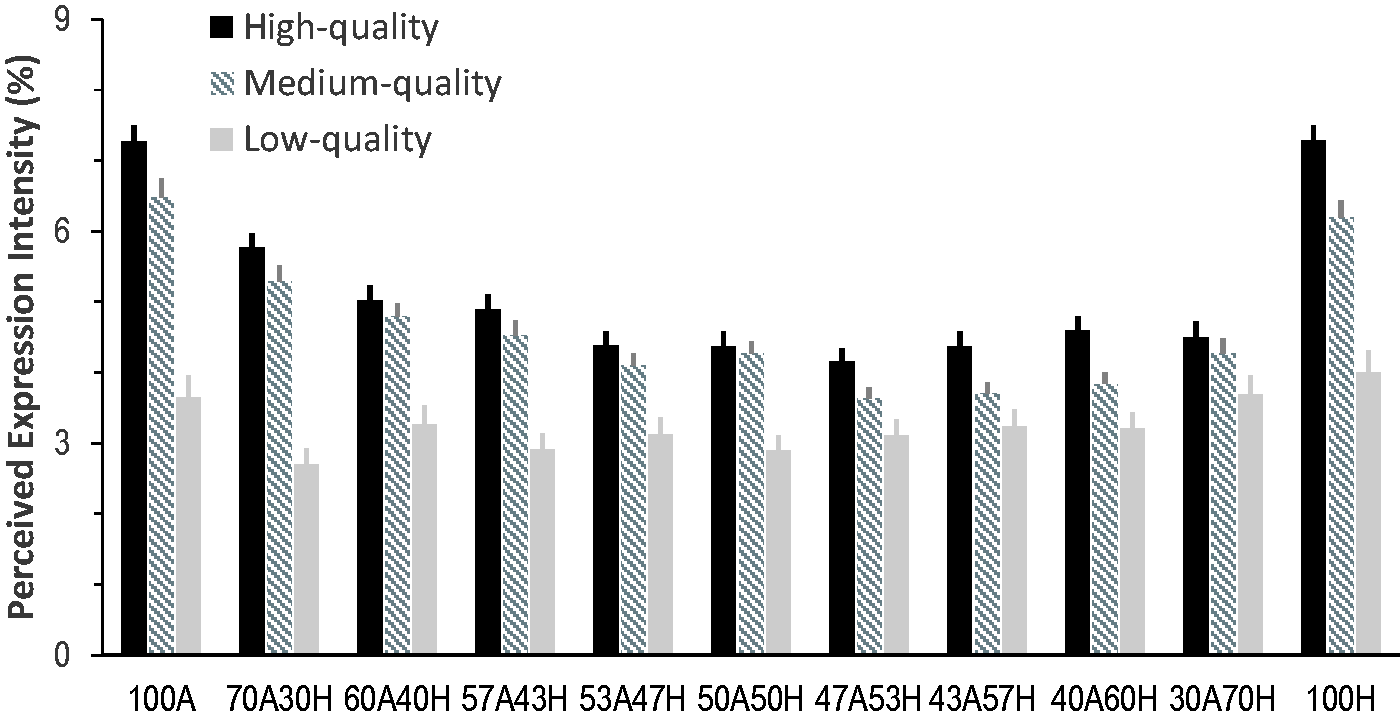
Mean Perceived Expression Intensity as a Function of the Displayed Facial Expression Ambiguity (100A, 70A30H, 60A40H, 57A43H, 53A47H, 50A50H, 47A53H, 43A57H, 40A60H, 30A70H, and 100H) and Face Image Quality (Resolution 1, 1/16, and 1/32 for High-, Medium-, and Low-Quality, Respectively). Error bars represent SEM.
We finally examined the detailed face-viewing gaze distribution to determine which facial features participants attended frequently when categorizing facial expressions across different expression ambiguities and image qualities; 3 (Face Region) × 11 (Expression Ambiguity) × 3 (Image Quality) ANOVAs with the proportion of viewing time directed at each face region as the dependent variables revealed significant main effect of face region, F(2, 72) = 29.04, p < .001, ηp2 = .45; Figure 4, with the nose region attracting overall longer viewing time (50.83% ± 2.56) than the eyes (25.74% ± 2.36) and mouth (20.76% ± 2.41); but non-significant main effect of expression ambiguity, F(6.78, 244.16) = .52, p = .82, ηp2 =.01, and image quality, F(1.39, 49.93) = 1.25, p = .29, ηp2 = .03.
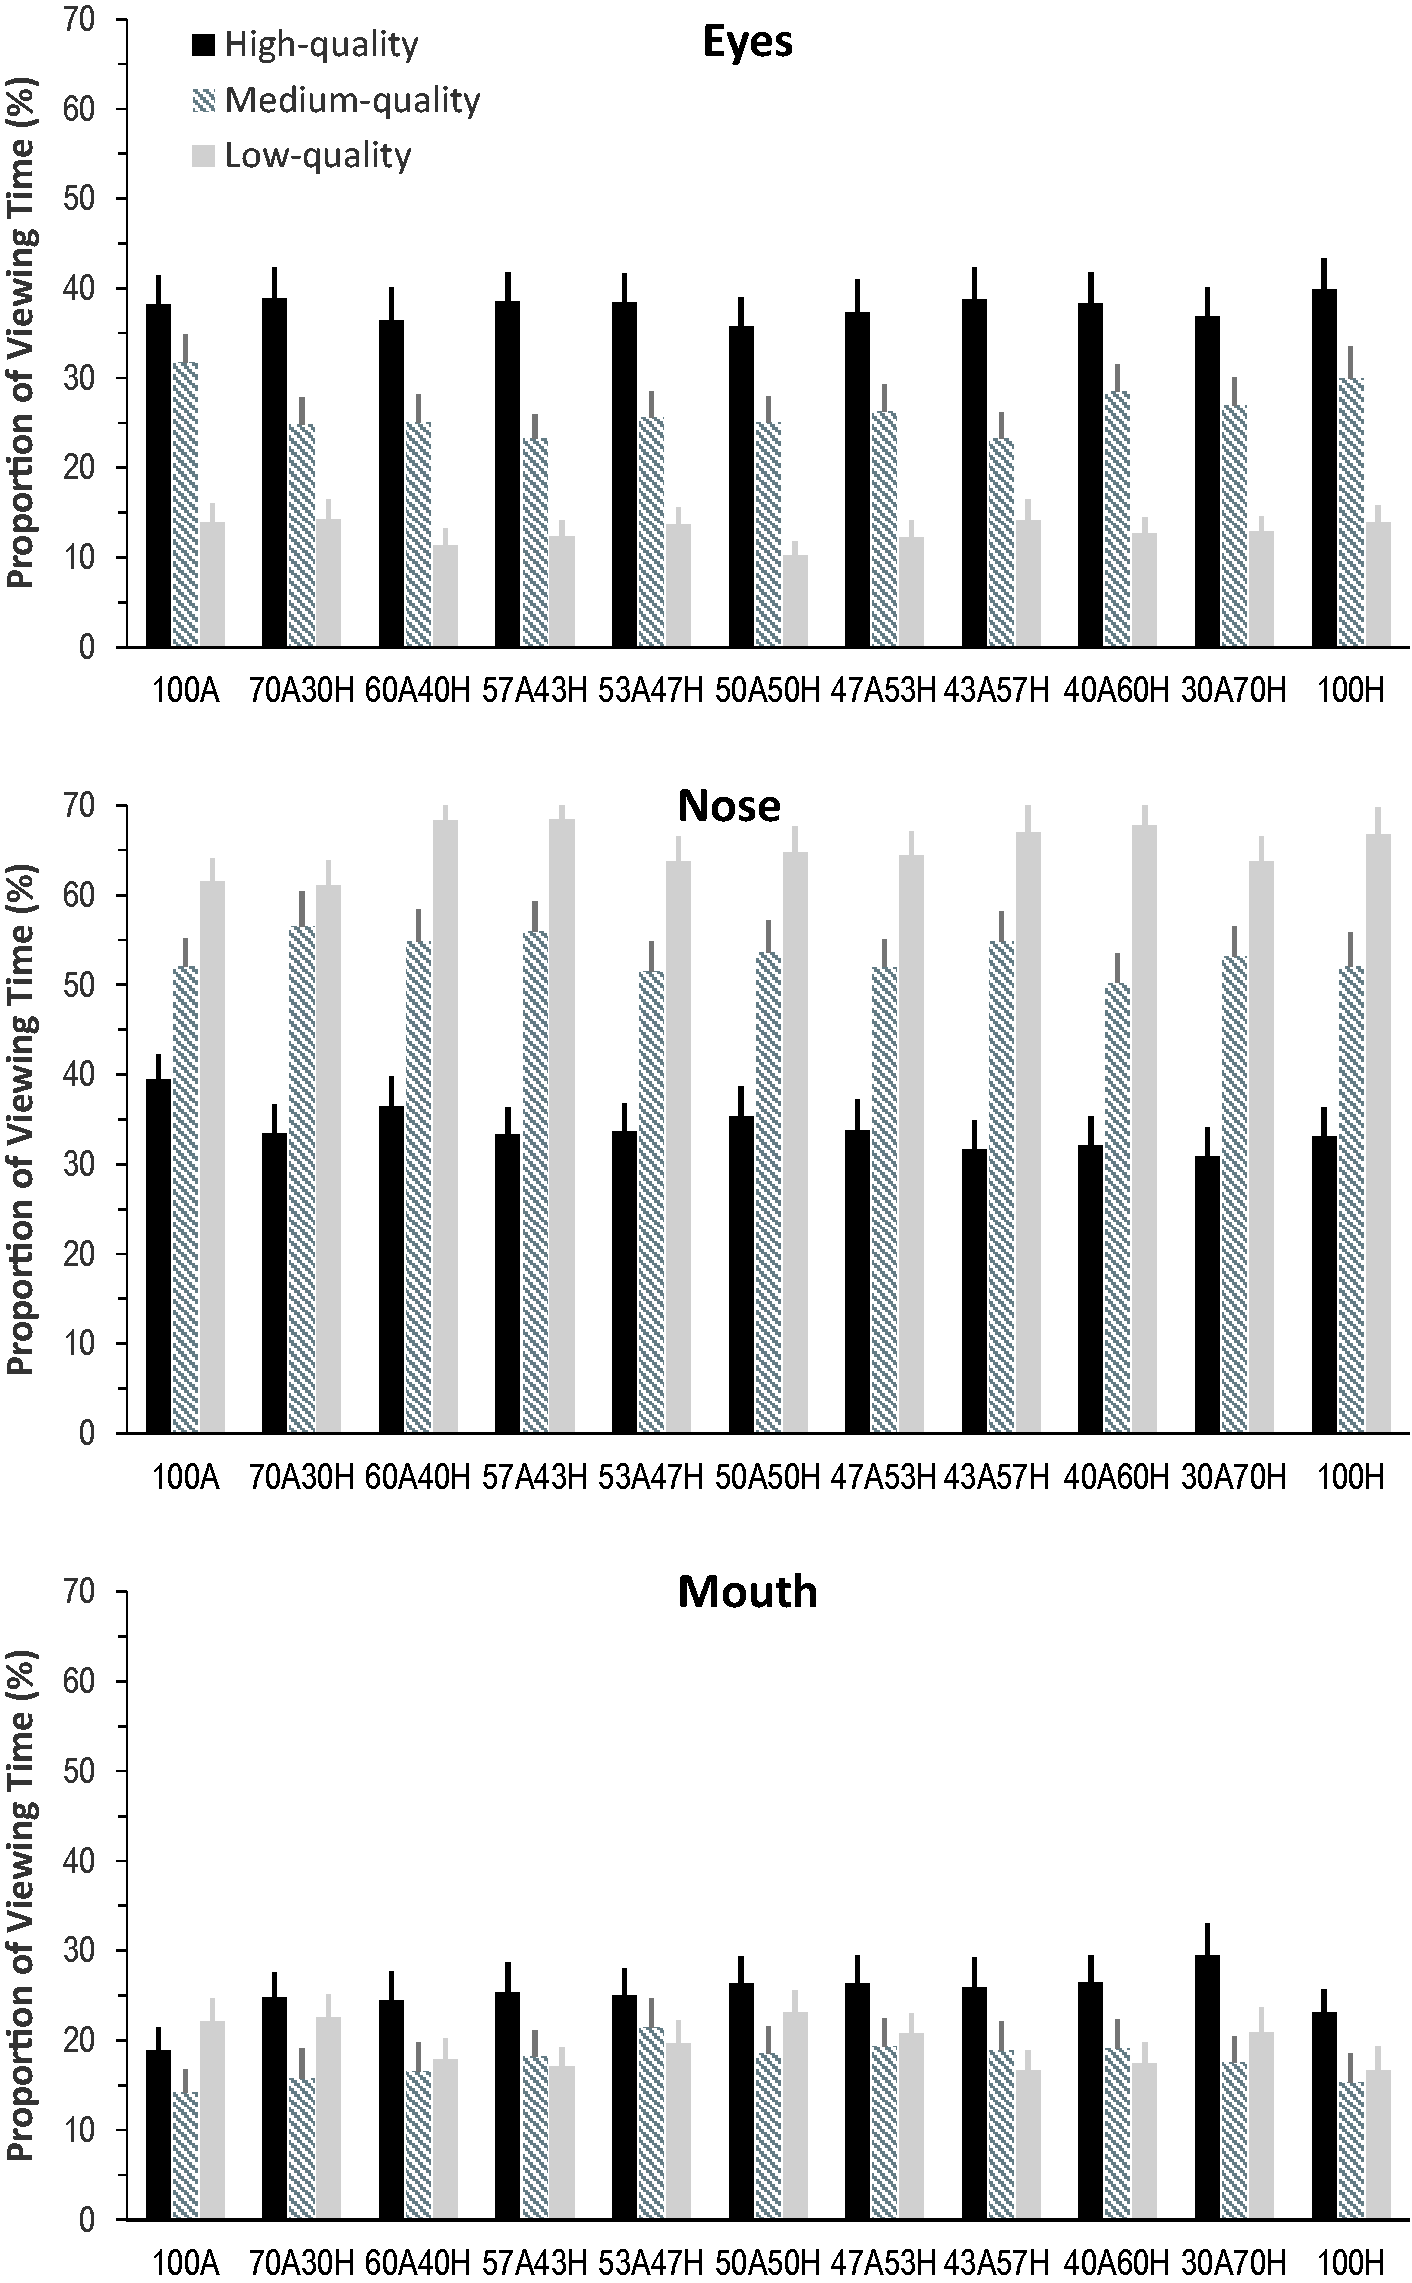
Proportion of Viewing Time Directed at the Eyes, Nose, and Mouth Regions When Categorizing Expressive Faces of Different Expression Ambiguities (100A, 70A30H, 60A40H, 57A43H, 53A47H, 50A50H, 47A53H, 43A57H, 40A60H, 30A70H, and 100H) and Image Qualities (Resolution 1, 1/16, and 1/32 for High-, Medium-, and Low-Quality, Respectively). Error bars represent SEM.
There were significant Face Region × Expression Ambiguity, F(11.29, 406.39) = 2.88, p = .001, ηp2 = .07, Face Region × Image Quality, F(2.90, 104.28) = 71.78, p < .001, ηp2 = .67, and Face Region × Expression Ambiguity × Image Quality interactions, F(40, 1440) = 2.43, p < .001, ηp2 = .06. Specifically, expression ambiguity could manipulate the proportion of viewing time directed at the eyes and mouth regions. Participants gazed longer at the eyes but shorter at the mouth in less mixed expressions (e.g., eyes in 100A: 27.98% ± 2.4, 100H: 27.9% ± 2.71; mouth in 100A: 18.42% ± 2.26, 100H: 18.34% ± 2.57) than in more ambiguous expressions (e.g., eyes in 50A50H: 23.67% ± 2.4, mouth in 50A50H: 22.65% ± 2.43; all ps < .05). Face image quality also quantitatively changed the amount of viewing time allocated at each facial region and induced a stronger central fixation bias (at the nose region) in lower quality images. Specifically, image quality degradation significantly reduced viewing at the eyes (proportion of viewing time at eyes in high-, medium-, and low-quality faces: 37.92% ± 3.21 > 26.42% ± 2.77 > 12.87% ± 1.6; all ps < .05) and mouth (25.07% ± 2.93 > 17.71% ± 2.88 = 19.51% ± 2.14) but increased viewing at the nose (33.92% ± 2.97 < 53.34% ± 3.06 < 65.24% ± 2.36; all ps < .05). Interestingly, the relative difference in viewing time at the eyes and mouth, two informative facial regions for detecting angry and happy expressions, was affected by both expression ambiguity and face quality. For high-quality faces, the eyes attracted longer viewing than the mouth in most of the morphed expressions (all ps < .05) except for a few very ambiguous ones (e.g., 50A50H, 47A53H; all ps > .05); for medium-quality faces, the eyes only attracted longer viewing than the mouth in two prototypical expressions (100A and 100H, all ps < .05) but similar viewing as the mouth in all the morphed expressions (all ps > .05); for low-quality faces, the eyes attracted similar viewing as the mouth in most of the expressions (all ps > .05) but shorter viewing than the mouth for a few very ambiguous ones (e.g., 50A50H, 47A53H; all ps < .05). Furthermore, adding happy cues in the high-quality (to less extent medium-quality) morphed faces tended to increase viewing time at the mouth region in comparison with the mouth at 100A angry faces (all ps < .05).
Discussion
Unlike invariant categorisation performance across different viewing conditions for those clearly defined prototypical facial expressions (e.g., Du & Martinez, 2011; Guo, 2012, 2013; Guo & Shaw, 2015; Guo et al., 2019; Matsumoto & Hwang, 2011), in this study, we have demonstrated that human visual system showed less tolerance to perceive ambiguous facial expressions created by morphing happiness and anger in different proportions and manipulating face image resolution. The facial expression ambiguity and face image quality induced the opposite direction of expression interpretation bias (anger bias vs. happiness bias), the same direction of deterioration impact on expression intensity judgement, and qualitatively different influence on face-viewing gaze distribution (decreased gaze at the eyes but increased gaze at the mouth vs. stronger central fixation bias).
When judging high-quality face images, our participants showed clear anger bias to interpret ambiguous expressions as angry, even for those morphed faces containing 60% happiness (40A60H; Figure 2). Such tendency of interpreting contradictory happy versus angry expressive cues as anger to ensure a more urgent response has been commonly reported in patients suffering from depression and anxiety (Penton-Voak et al., 2017) and is also in agreement with previously reported high sensitivity to detect and process angry facial cues in healthy people (Anderson, 2005). Typically in comparison with other common facial expressions, anger tends to pop out more easily, capture and hold attention automatically, amplify perceptual process, and enhance early face-specific neural responses even outside attention or preattentively (Anderson, 2005; Hansen & Hansen, 1998; Lyyra et al., 2014; Öhman et al., 2001). As anger is a threatening social stimulus and has high biological significance or relevance, it would be logical to be exceptionally sensitive to its presence to protect oneself. Consequently, this high sensitivity and priority of detecting angry facial cues in the morphed faces may lead to the observed anger bias to label ambiguous expressions, such as 53A47H, 50A50H, 47A53H, 43A57H, and 40A60H.
Interestingly, this anger bias was reduced and then even reversed to happiness bias when the presented image resolution of those ambiguous expressions was changed from high- to medium- and then to low-quality (Figure 2). For instance, our participants showed above-chance level probability to label low-quality ambiguous expressions as happy if the morphed faces containing 40% happiness (60A40H) or more. Previous studies have established that in comparison with other expressions, recognition of happiness is associated with the highest face image visibility rating and categorisation accuracy, and is the least susceptible to expression intensity decline, image quality distortion and transcranial magnetic stimulation induced neural process disruption over early visual cortex (Du & Martinez, 2011; Guo, 2012; Guo et al., 2019, 2020; Wells et al., 2016). This higher perceptual tolerance for happy facial signal distortion or disruption is probably due to more distinctive facial features in happy faces and our higher perceptual expertise in processing happiness (i.e., it is the first expression in children’s development to reach adult-level recognition accuracy; Rutter et al., 2019). Consequently, when viewing low-quality ambiguous expressions, our high sensitivity of detecting angry facial cues is reduced because angry cues become unrecognisable. On the other hand, happy cues might be still detectable which lead to positivity bias to label happiness. Furthermore, the teeth are still visible in low-quality morphed faces containing >50% anger cues. These exposed teeth may also promote the positivity bias as they are more often associated with happiness in our daily life.
These observed opposite direction of interpretation biases provide novel information into the relationship between uncertainty and emotion. Majority of psychological theories argue that stimulus uncertainty is inherently aversive and will typically lead to negative emotional perception and responses (Anderson et al., 2019). This study, however, indicated that the perception of uncertain expressions is subject to different cognitive moderators (e.g., in this case higher perceptual priority to anger but higher perceptual tolerance to happiness) and subsequently lead to both positive and negative appraisal responses. Our novel observation of low-quality image-induced happiness bias may have practical implication on assessing people’s behaviour in low-quality CCTV videos and images, such as mistakenly interpreting aggressive action as friendly behaviour in legal or security settings. However, it should be noted that only happy and angry expressions were tested in this study. Future research could include more expression categories (e.g., fear, sadness, surprise) to examine whether the observed opposite direction of interpretation biases (anger vs. happiness) might reflect a more general negativity versus positivity bias.
While facial expression ambiguity and image quality demonstrated the opposite direction of expression interpretation bias, they showed the same direction of impact on judging expression intensities. Both increasing expression ambiguity and decreasing image quality tended to reduce the perceived expression intensity, although expression ambiguity-induced reduction in intensity rating was less prominent in low-quality faces (Figure 3). Nevertheless, participants rated more ambiguous and lower quality expressions as less intense, probably due to the increased difficulty to conduct calculated quantitative evaluation of affective cues embedded in internal facial features, such as shapes of eyes, nose, and mouth (Guo et al., 2019), and the decreased confidence to assess ambiguous faces (Ito et al., 2017). Furthermore, it seems that our manipulation of expression ambiguity and face quality had different impact on qualitative (expression categorisation) and quantitative (expression intensity rating) assessment of affective facial cues. Similar findings have also been reported in other viewing conditions. For instance, changing face viewing point from frontal to profile view of prototypical expressions had little deterioration impact on expression categorisation accuracies but considerably reduced expression intensity ratings (Guo & Shaw, 2015).
In this study, we have also compared participants’ gaze distribution across different expression ambiguity and face quality levels. In agreement with previously observed “holistic” face-viewing gaze behaviour (Guo, 2012), irrespective of the viewed faces our participants scanned all key facial features (i.e., eyes, nose, and mouth) to extract, analyse, and then integrate local affective information in order to evaluate facial expressions. The novel finding here is that such “holistic” gaze distribution was more evident when viewing ambiguous expressions. Increasing expression ambiguity tended to decrease viewing at the eyes but increase viewing at the mouth region, leading to more balanced gaze distribution between these two facial features (i.e., proportion of viewing time at the eyes and mouth were ∼28% vs. ∼18% in 100A or 100H faces, but were ∼24% vs. 23% in 50H50A faces; Figure 4). As the eyes and mouth regions convey diagnostic cues for detecting anger and happiness, respectively (Smith et al., 2005), participants may need to pay similar amount of attention to these two regions to compare and determine their affective meanings when viewing ambiguous faces containing contradictory happy and angry cues.
Further in agreement with previous eye-tracking studies, examining the effect of image quality on face and scene perception (Guo et al., 2019; Judd et al., 2011; Röhrbein et al., 2015), reducing face image quality led to prolonged viewing or concentrated gaze bias toward the nose region or image centre at the expense of gazing at the eyes and mouth regions (∼34%, 53%, and 65% of viewing time allocated at the nose in high-, medium-, and low-quality faces, respectively; Figure 4). It has been reported that this image quality-induced changes in central fixation bias were predominately driven by distortion severity (e.g., image noise intensity) rather than distortion types or image categories, reflecting an adapted oculomotor behaviour in processing noisy visual inputs (Guo et al., 2019). Specifically, image degradation would delay visual information analysis, reduce visual object saliency in out-of-focus periphery vision, and slow down fixation target selection and subsequent saccade initiation to the peripheral regions (Nuthmann et al., 2010; Reingold & Loschky, 2002). These changes consequently induce short saccadic distance, fewer fixations to noncentre areas and concentrated central fixation bias (Röhrbein et al., 2015). Furthermore, face image distortion can induce the loss of high spatial frequency information (Smith & Schyns, 2009). This in turn will enhance central fixation bias and promote holistic perception of faces.
In addition to manipulate central fixation bias, face quality also interacted with expression ambiguity to affect the relative difference in viewing time at the eyes and mouth regions. Specifically, for many morphed ambiguous expressions, the eyes attracted longer viewing than the mouth in high-quality faces, similar amount of viewing as the mouth in medium-quality faces but shorter viewing than the mouth in low-quality faces. This modulatory effect is (at least partly) caused by both the heightened contribution of mouth region in detecting ambiguous expressions containing happy cues (Eisenbarth & Alpers, 2011; Guo, 2012; Smith et al., 2005) and differences in spatial frequency spectra of expressive information conveyed by the eyes and mouth which show different vulnerabilities to image degradation (Smith & Schyns, 2009). In comparison with angry cues transmitted through the eyes, happy information in the mouth (especially with the open mouth) are represented in relatively lower spatial frequency of the diagnostic spectra (Smith & Schyns, 2009), which could maximise information transmission to facilitate long-distance communication (Fridlund, 1991) and to be less prone to image distortion (Guo et al., 2019). Consequently, when the ambiguous expressive cues in the eyes became less detectable in medium- and low-quality faces, our participants shifted their attention from the eyes to the mouth and directed relatively longer viewing time to extract those still discriminable low spatial frequency happy cues to judge uncertain expressions. Such gaze reallocation could partly explain the observed happiness bias (tendency to label ambiguous expression as happiness) when categorizing low-quality vague expressions.
It should be noted for the purpose of enhancing data comparability between testing conditions, in this study, we employed a within-subject design to morph happy and angry expressions and collected data mostly from female undergraduate students. Although universal expression recognition is unlikely to be heavily varied across participant culture, gender, and age (Bruce & Young, 2012), it remains to be seen whether the current findings can be generalised to other participant groups, especially clinical or subclinical participants with mental health issues (social anxiety, depression, autism, etc.) as they are usually more susceptible to expression interpretation bias (Penton-Voak et al., 2017). Future research could also examine other expression combinations, such as happiness-sadness and happiness-fear. Given that angry, sad, and fearful faces all transmit diagnostic expressive cues through the eyes and surrounding region rather than the mouth used by happy expression (Smith et al., 2005), and show similar vulnerability to image degradation that is significantly different from happy expression (Guo et al., 2019; Smith & Schyns, 2009), it is plausible that the current findings could be generalised to happiness-sadness and happiness-fear combinations. Furthermore, it is worth mentioning that the observed negativity versus positivity bias might also be interpreted as the change of perceptual sensitivity to the contradictory happiness-anger cues presented in different viewing conditions. Given our nonlinearity process in categorizing mixed emotions (Young et al., 1997), the morphed high-quality 50A50H faces may not be perceived as containing 50% happy and 50% angry cues. Hence, the observed anger bias may reflect our participants’ natural perceptual baseline for perceiving these facial expressions in high-quality images. From this perspective, the happiness bias to interpret the same expressions presented in low-quality condition may indicate the change of perceptual sensitivity or perceptual bias relative to this high-quality baseline.
Nevertheless, this study is a step forward in understanding how invariant our facial expression perception could be. We have previously reported that human capacity of perceiving prototypical facial expressions has a good tolerance to changes in viewing conditions and face distortions, such as viewing perspective, viewing distance, expression intensity and image quality (Guo, 2012, 2013; Guo & Shaw, 2015; Guo et al., 2019), probably attained through predefined expression classifiers, each tuned to a specific emotion category, suggested by the categorical model of expression perception (Ekman & Rosenberg, 2005). Such invariant perception is less evident for categorically ambiguous expressions. Increasing expression ambiguity and decreasing face quality showed obviously different impact on expression interpretation bias (anger bias vs. happiness bias) and associated face-viewing gaze distribution, suggesting that different cognitive mechanisms may be involved in categorizing clearly defined and ambiguous expressive facial signals.
Footnotes
Declaration of Conflicting Interests
The author(s) declared no potential conflicts of interest with respect to the research, authorship, and/or publication of this article.
Funding
The author(s) received no financial support for the research, authorship, and/or publication of this article.