
Abstract
Canine oral melanoma is a common, aggressive tumor with limited treatment options. Tumor-infiltrating lymphocytes (TILs) are important in antitumor immunity. This study used histopathology and immunophenotyping by flow cytometry to evaluate the presence and distribution of TILs in canine oral melanoma, including the frequency of CD8+ T cells, CD4+ T cells, and regulatory T cells. Fifty samples of oral melanoma from 45 dogs that did not receive treatment prior to surgery were included in the study. The distribution of TILs in the tissue (brisk, nonbrisk, and absent) was evaluated in 48 samples. Twenty-eight (58%) samples had a brisk distribution pattern, 10 (21%) samples had a nonbrisk pattern, and 10 (21%) samples had an absent TIL pattern. Comparing the histological evaluation and the immunophenotyping data, it was observed that samples with a brisk TIL pattern had a higher frequency of CD8+ T lymphocytes (P = .05) and a lower frequency of CD4+/CD25+/FoxP3+ Tregs (P = .03), compared to the samples with nonbrisk and absent infiltrate patterns. Patients with a higher survival rate had higher TIL scores (P = .002), a brisk or nonbrisk TIL pattern (P = .001), and an increased frequency of CD8+ T lymphocytes infiltrating the tumor (P = .003). Our analysis suggests that the evaluation of TILs in canine oral melanoma is relevant to predict tumor aggressiveness and patient prognosis.
Keywords
A multifactorial biological system becomes organized during the development of a neoplasm. 31 Among the factors that influence tumor development, the immune system plays an important role, as evidenced by the spontaneous regression of some tumors like melanomas in humans. 22,28 Although spontaneous regression of melanoma has not been reported in dogs, there are references to this event in humans and swine, suggesting that this tumor may be susceptible to immune responses. 3,7,8,18
The presence of an inflammatory infiltrate, including tumor-infiltrating lymphocytes (TILs) in tumor biopsies, is evidence that the immune system responds to tumors. The term TILs was first used by Wallace H. Clark Jr in a study of cutaneous human melanomas, who developed a classification system for the distribution pattern of TILs in melanomas. Later, other classification systems that included not only the distribution pattern but also the density of TILs were considered complementary to Clark’s classification system. 1,9,21,43 Initially, these cells were unjustly associated with malignancy, and only 50 years ago was their antitumor role recognized based on the association between clinical outcome and the presence of these cells. 26
TILs are composed of different lymphocyte subsets that may exert different biological actions. For example, many CD4+ T cells have an antitumor activity that supports the accumulation of cytotoxic T lymphocytes (CTL) and activates antigen presenting cells; however, other CD4+ subsets have a regulatory phenotype. 23,36,37,47 This regulatory function is carried out by a subset of CD4+/CD25+/Foxp3+ regulatory T-cells (Tregs) that suppress the immune response. These cells are more prevalent in metastatic and advanced lesions, where they suppress IFN-γ production by CD4+ T cells and aid in tumor progression. 23,37,47 Previous studies demonstrated the paradox of regulatory and cytotoxic actions of TILs by identifying the presence of Tregs infiltrating tumors, such as oral canine melanoma. Tregs can inhibit the antitumor response mediated by CD8+ and CD4+ T lymphocytes, and their frequency in the peripheral blood of dogs with oral melanoma increases proportionally to the patient’s stage. 20,45 CD8+ cytotoxic T lymphocytes also have a prominent role in antitumor immunity. They recognize tumor antigens presented by tumor class I MHC (human HLA analog) molecules expressed on tumor cells and induce tumor cell death. 25,36,47
The incidence of oral canine melanoma is increasing and there are no curative treatments. Since the disease resembles human mucosal and acral melanomas, a better understanding of immune environment of these tumors is necessary to understand their biology and to develop better therapies for humans and dogs. 41,42 The present study of dogs with oral melanoma histologically evaluated TILs and their relationship with clinical characteristics including staging and survival. The study also aimed to identify the frequency of different lymphocytes subsets infiltrating canine oral melanoma (ie, T CD8+, CD25+ CD4+ Foxp3+ T, and CD4+ T).
Materials and Methods
Samples
The 50 oral melanomas included in this study were completely excised from 45 dogs at private veterinary institutions in the city of São Paulo, Brazil. Of these, 16 were recurrences, and 5 of the recurrences had the original tumor sample included in the study. Inclusion criteria were consent of the animal guardian, confirmation of the diagnosis of melanoma by histopathological or immunohistochemical examination, and the possibility of complete clinical staging of the patient with the criteria of the WHO (World Health Organization) adapted by Owen. For the latter, staging was based on tumor size, presence or absence of lymph node involvement, and presence or absence of distant metastases. 32 This staging is still widely used despite its limitations (such as not considering patient size). 5,30 Exclusion criteria were dogs that received immunosuppressive treatment prior to surgery, and dogs with an unconfirmed diagnosis of oral melanoma. In the amelanotic samples, the diagnosis was confirmed by immunohistochemical labeling for melan-A and PNL2. 35 The present study was approved by the Ethics Committee on the Use of Animals (CEUA #3123210217) of the University of São Paulo.
Immunohistochemistry
Tissues were fixed in neutral buffered formalin for 24 to 92 hours. For melan-A and PNL2, 5-μm-thick sections from the paraffin-embedded tumor specimens were deparaffinized and rehydrated. The slides were heated in a 9% hydrogen peroxide solution, at 65 °C, in a dark water bath, for 45 minutes, to remove the melanin from the samples (“bleaching”). The antigen recovery was obtained using Pascal pressure cooker for 10 minutes in pH 6.0 sodium citrate buffer solution. Subsequently, endogenous peroxidases were blocked in 30% H2O2 solution and pure methanol for 15 minutes. Following this process, the primary antibodies against melan-A (Dako, clone A103) or PNL2 (Santa Cruz, clone PNL2) at the dilution of 1:100 was added to each slide. The slides were incubated for 60 minutes in an oven at 37 °C and then in a humid chamber for 14 hours at 4 °C. Then, slides were incubated with the secondary antibody of the Super Picture Kit (ThermoFisher). The reaction was revealed using the tetrachloro-3,3′-diaminobenzidine (DAB) chromogen (Sigma-Aldrich) and counterstaining was performed with Harris hematoxylin. As positive control, oral canine melanoma tissues already confirmed by immunohistochemistry were used. As negative control, the primary antibody was omitted in the tissues.
For FoxP3 staining, the immunohistochemical reaction and bleaching were carried out as stated above. This reaction was performed with only 10 samples and only to demonstrate the presence of FoxP3+ cells by another method besides immunophenotyping. Nonspecific labelling was blocked with Protein Block Dako solution for 15 minutes. One hundred microliters of primary anti-FoxP3 antibody (Invitrogen 14-5773-82) was used for overnight incubation at 4 °C, at a concentration of 1:100, diluted in Tris-buffer saline (TBS) solution (pH 7.6). The negative control slides were incubated with TBS pH 7.6, under the same conditions. The positive control was canine lymph nodes. The chromogen used was diaminobenzidine (Chromogen DAB, EP-12-20542, EasyPath). Counterstaining was performed with hematoxylin. FoxP3 immunolabeling was scored on 5 immunolabeling hotspots by scanning the slide at 400× magnification, and classifying as follows: 0 (no immunolabeling), 1 (<1% labeling as isolated cells), and 2 (immunolabeling of >1% of cells o or groups of cells).
Histopathologic Analysis
After histological processing, slides stained with hematoxylin and eosin from 40 tumors samples were assessed for the degree of nuclear atypia, pigmentation (amelanotic or melanotic), number of mitoses, and cellular pattern (Supplemental Table S1). Eight samples were excluded from this analysis because they were not of sufficient quality for proper evaluation of cell nuclei. Two samples were excluded from this analysis because these samples were fragmented by the veterinary surgeon before reaching the laboratory. Mitotic counts were performed in 10 high-power fields with field of view of 5 mm2 at 400× magnification. We considered that samples with more than 3 mitoses in 10 fields had a high mitotic count, and samples with up to 3 mitoses in 10 fields had a low mitotic count as reported for canine melanocytic neoplasms. 14
To determine the degree of atypia, we evaluated 100 neoplastic cells per sample to evaluate variations in size and nuclear shape, presence of a macronucleolus, and multiple nucleoli. Nuclear atypia grade of 4 or greater has been associated with a higher risk of death within the first year after diagnosis. 4 Therefore, in our survival analysis, we separated the samples into 2 groups: samples with atypia grade less than 4 and samples with atypia grade greater than 4.
According to a recent study, the presence of visible nucleoli in more than 20% of the neoplastic cells was associated with shorter disease-free time in cutaneous melanomas in humans. 11 Thus, in our study, 200 neoplastic cells were evaluated per 40× field to determine the presence of nucleoli. For survival analysis, samples were separated into 2 groups: more than 20% of cells with nucleoli present and less than 20% of the neoplastic cells with nucleoli.
Analysis of Lymphocytic Infiltrate
Melanoma samples were kept in RPMI-1640 from the time of surgical resection until their arrival in the laboratory; this interval was 12 ± 14 hours (mean ± SD). Two techniques were used to analyze the lymphocytic infiltrates: histopathological evaluation of the samples and immunophenotyping of the cells isolated after enzymatic digestion by flow cytometry as described below.
Histopathologic evaluation of TILs in tumor tissue was performed in 48 samples; 2 samples were omitted because they were fragmented. Samples were radially sectioned, fixed in 10% buffered formalin for 48 hours, paraffin embedded, sectioned, and stained with hematoxylin and eosin. Two methods were used to evaluate TILs by microscopy. The first, proposed by the Cancer Genome Atlas Network, generated a lymphocytic score based on semiquantitative analysis of the lymphocytes in the tissue. 43 Specifically, the semiquantitative method evaluated the sum of the total lymphocyte distribution that occupied the tissue with the lymphocyte density found in 10 high-power fields with field of view of 5 mm at 40× magnification. The score from 0 to 2 was considered low, and the score of 3 to 6 was considered as high (Supplemental Table S2).
The second method was developed by Clark et al in 1989, in which a qualitative evaluation of the lymphocytes in the melanoma tissue was carried out. 9,29 A brisk pattern was defined as a intratumoral lymphocytic infiltrate with a widespread distribution of lymphocytes throughout the sample, regardless of how many lymphocytes are distributed. A nonbrisk pattern was defined as a focal or multifocal clusters of tissue-infiltrating lymphocytes. An “absent” pattern was defined as no lymphocytes in the tumor. If lymphocytes were only peripheral to the tumor (peritumoral) but not actually infiltrating the tumor, this sample was classified as have an “absent” pattern (Figs. 1–3).
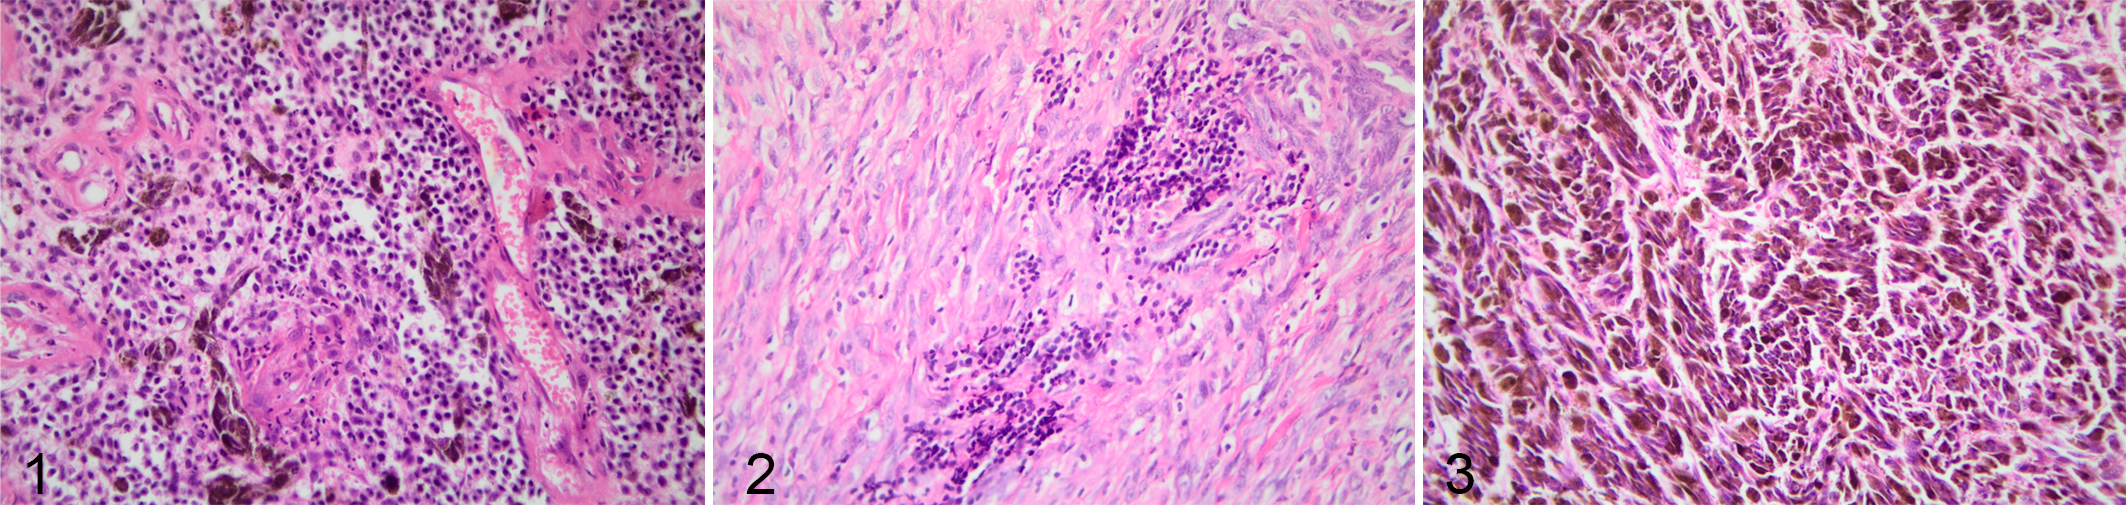
Melanocytic neoplasia, oral cavity, dogs. The brown pigment is melanin within tumor cells). Hematoxylin and eosin.
TIL Isolation and Immunophenotyping by Flow Cytometry
For immunophenotyping, after removal of fat and necrotic tissue, the remaining tumoral fragments were manually minced and incubated with 1 mg/ml of collagenase type II (ThermoFisher) for 1 hour at 37 °C in RPMI. Four samples were excluded because of insufficient quality; therefore, immunophenotyping was performed on 46 samples. After digestion, cells were passed through a 70-µm filter (BD) to make single cell suspensions, and these suspensions were frozen in liquid nitrogen in cryopreserving solution with 90% fetal bovine serum (Gibco) and 10% DMSO (Merck) until the time of analysis.
Cells were thawed in a 37 °C water bath and 1 × 10⁵ to 1 × 10⁶ cells/100 µl were incubated for 15 minutes at room temperature with Fc-block FcR blocking reagent (eBiosciences). After, the cells were labeled with commercially available fluorophores: anti-CD3-FITC, anti-CD4-APC, and anti-CD8-Alexa Fluor 647 (Bio-Rad, CA 17.2°12; YKIX 302.9, and YCATE 55.9). The antibodies were conjugated at 1:20 dilution in a final volume of 100 µl and incubated for 30 minutes at 4 °C and protected from light. A combination of anti-CD4-APC (Bio-Rad, YKIX 302.9), anti-CD25-FITC (Bio-Rad, BC96), and the anti-Foxp3-RPE (eBioscience, FJK-16) antibodies were used for Treg detection (appropriate Rat IgG2a isotype Control was used; results not shown). After surface staining with anti-CD4 and CD25 antibodies, cells were incubated with fixation/permeabilization buffer (eBioscience) for 20 minutes at 4 °C in the dark. 12,19,39,45 After fixation, cells were washed with 2 ml permeabilization buffer and Foxp3 antibody was then added (1:50) in 100 µl of permeabilization buffer, incubated for 20 minutes at room temperature, and protected from light. After incubation, cells were washed twice with 2 ml permeabilization buffer, and then washed once with 1 ml PBS containing 1% fetal calf serum.
Acquisitions and analyses were performed on 5 × 10⁴ cells per sample using the FACSCalibur (Becton & Dickinson) flow cytometry system with a standard 4-color filter configuration using CellQuestPro software. During data acquisition a gate was drawn to exclude tumor cells. Lymphocytes were identified based on cell characteristic properties in the forward (FSC) and side (SSC) scatter. The frequency of CD8+ TILs were defined as the proportion of CD8+ cells within the CD3+ cell population (Figs. 4, 5), and the percentage of Treg lymphocytes was calculated based on percentage of staining with CD25+/Foxp3+ within the CD4+ T cell population (Figs. 6, 7). The results are based on the analysis of qualitative and semiquantitative evaluation of lymphocytic infiltrate and were expressed as relative proportions of the phenotypic subsets measured using 4-quadrant analysis and histogram with the FlowJo software.
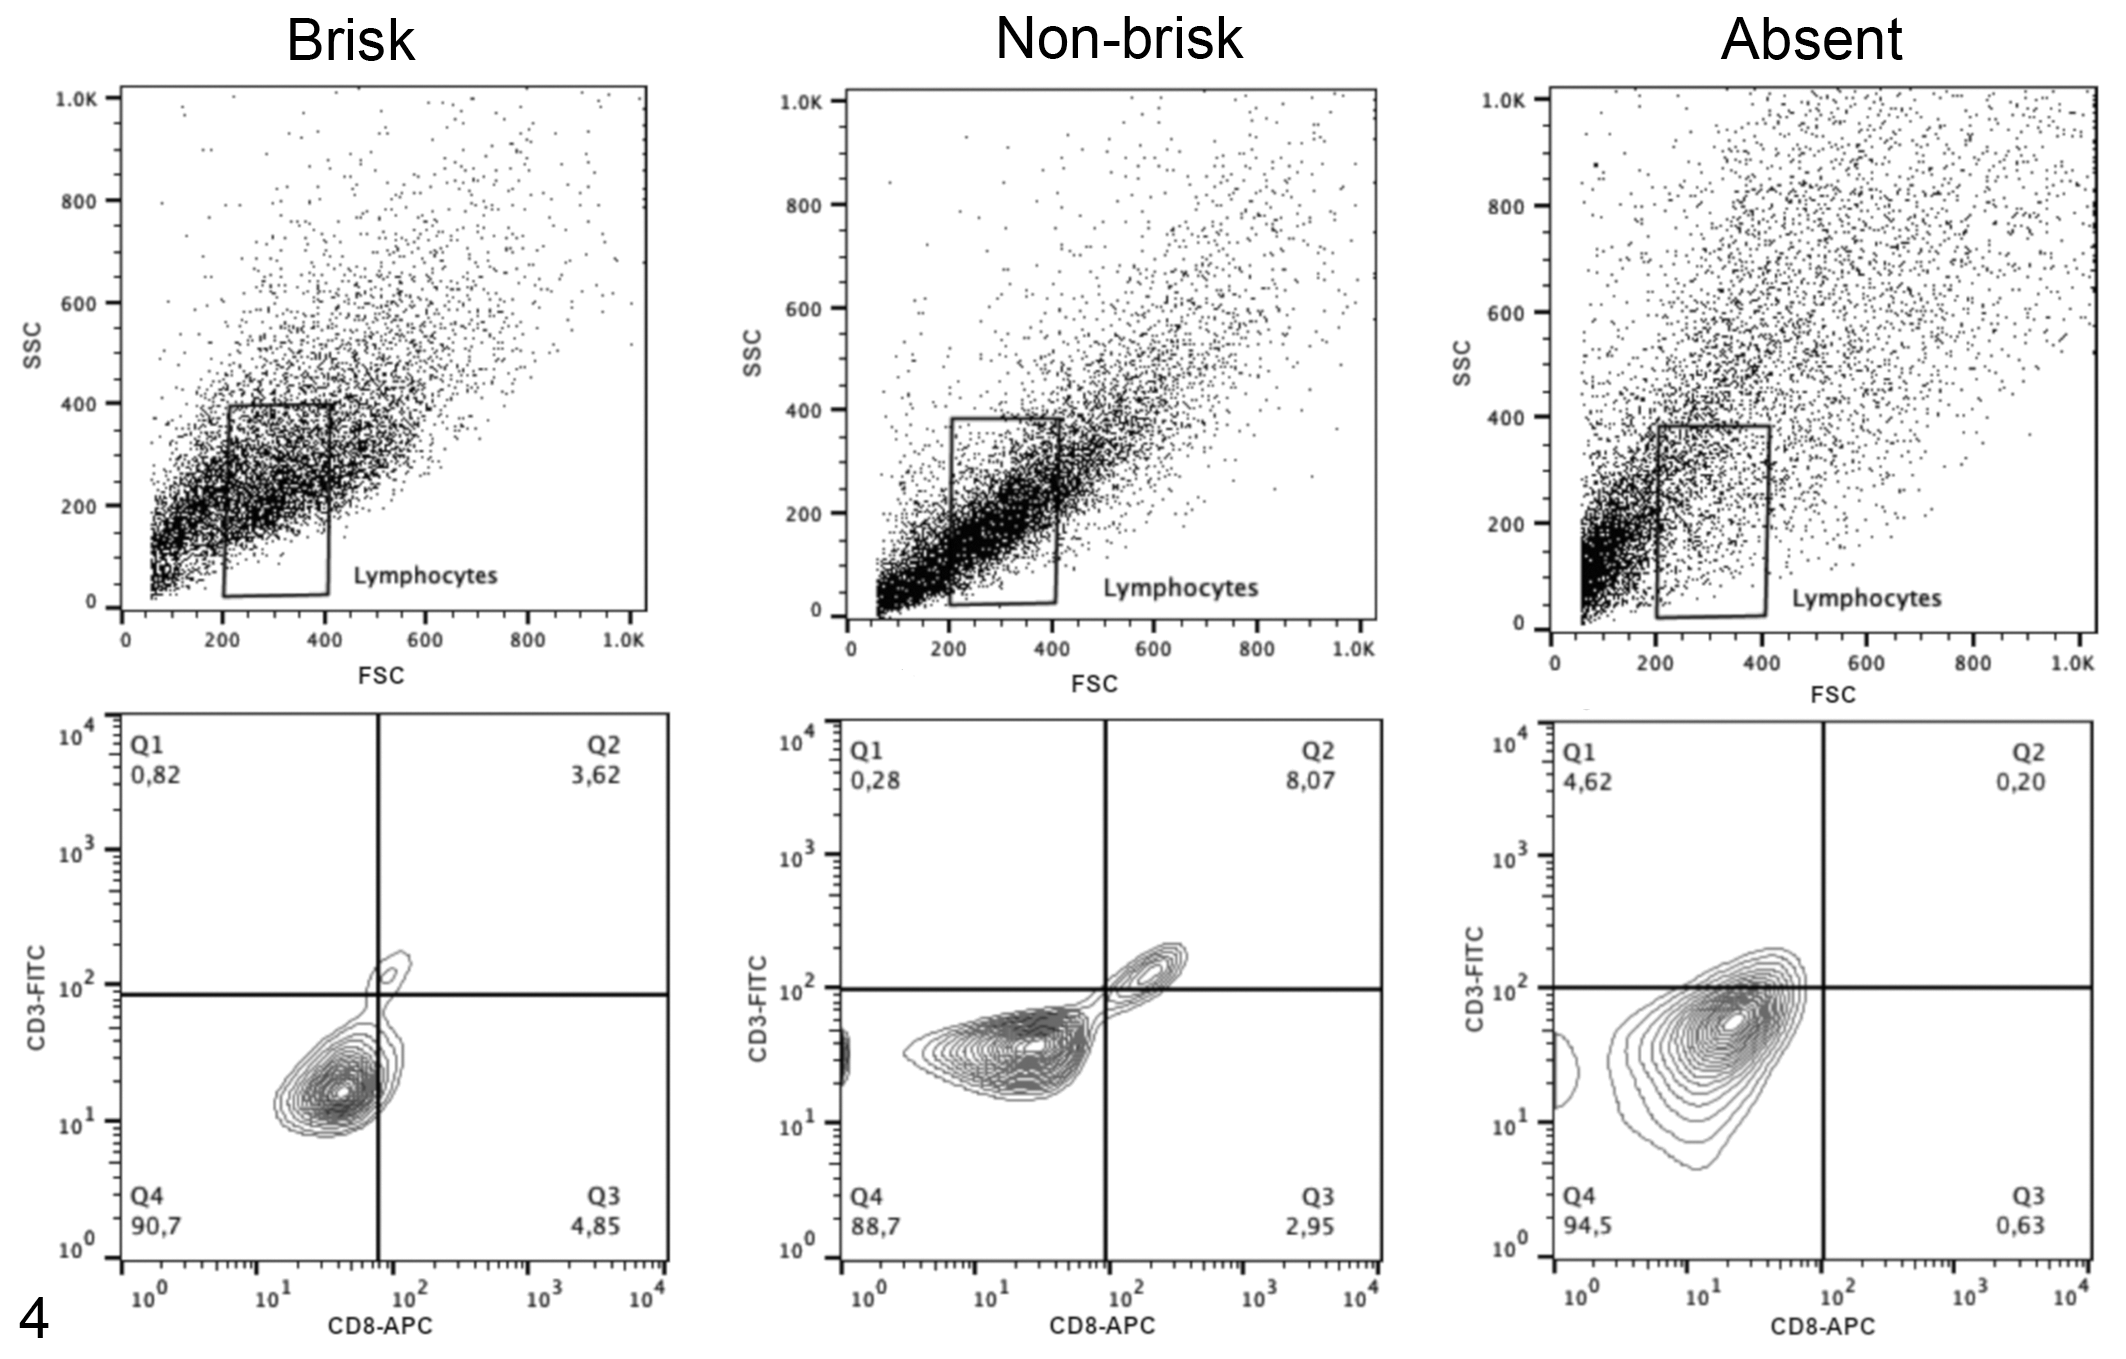
Representative plots illustrating the flow cytometry gating strategy to determine the frequency of CD3+CD8+ T cell subsets in tumor samples with histologically defined patterns as follows: brisk, nonbrisk, or absent patterns of TIL distribution (qualitative analysis). The upper panels show lymphocyte populations based on forward and side scatter (FSC and SSC). The lower panels show the CD3 and CD8 immunolabeling of cells within the lymphocyte cell gate; the antibody specificities are noted on the x- and y-axes.
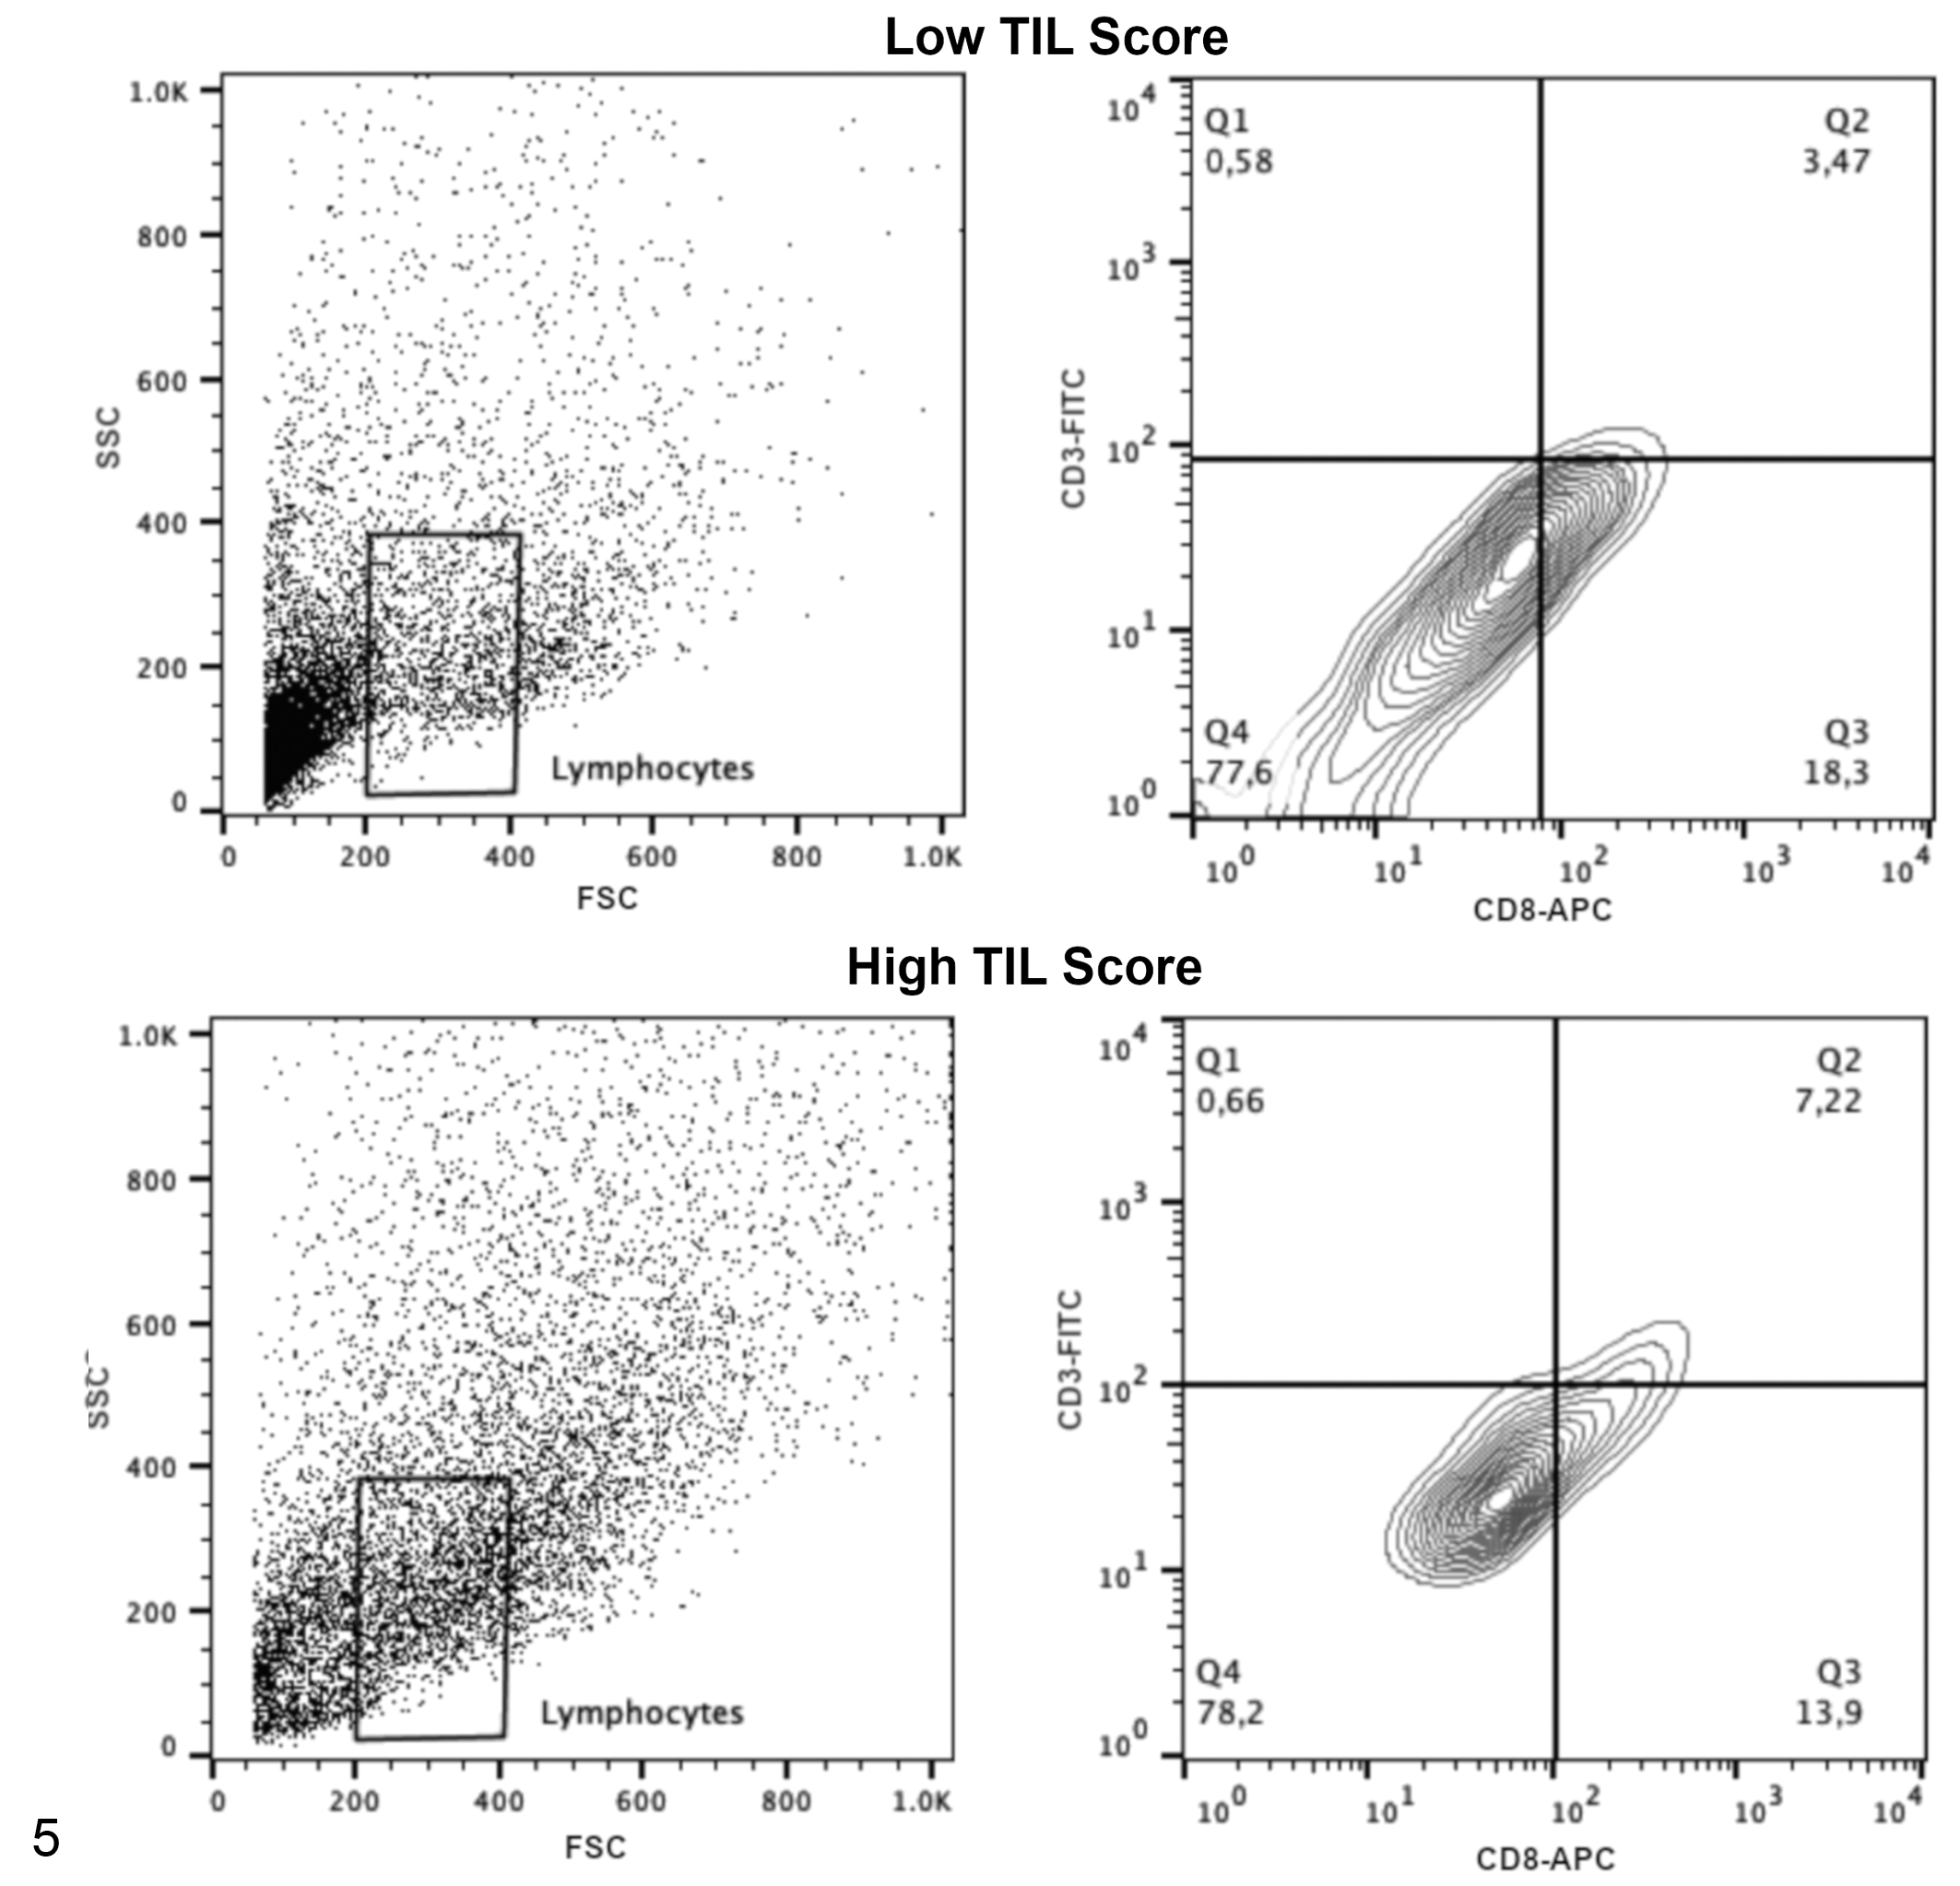
Representative plots illustrating the flow cytometry gating strategy to determine the frequency of CD3+CD8+ T cell subsets in tumor samples with low or high tumor-infiltrating lymphocyte scores (semiquantitative analysis). The left panels show lymphocyte populations based on forward and side scatter (FSC and SSC). The right panels show the CD3 and CD8 immunolabeling of cells within the lymphocyte cell gate; the antibody specificities are noted on the x- and y-axes.
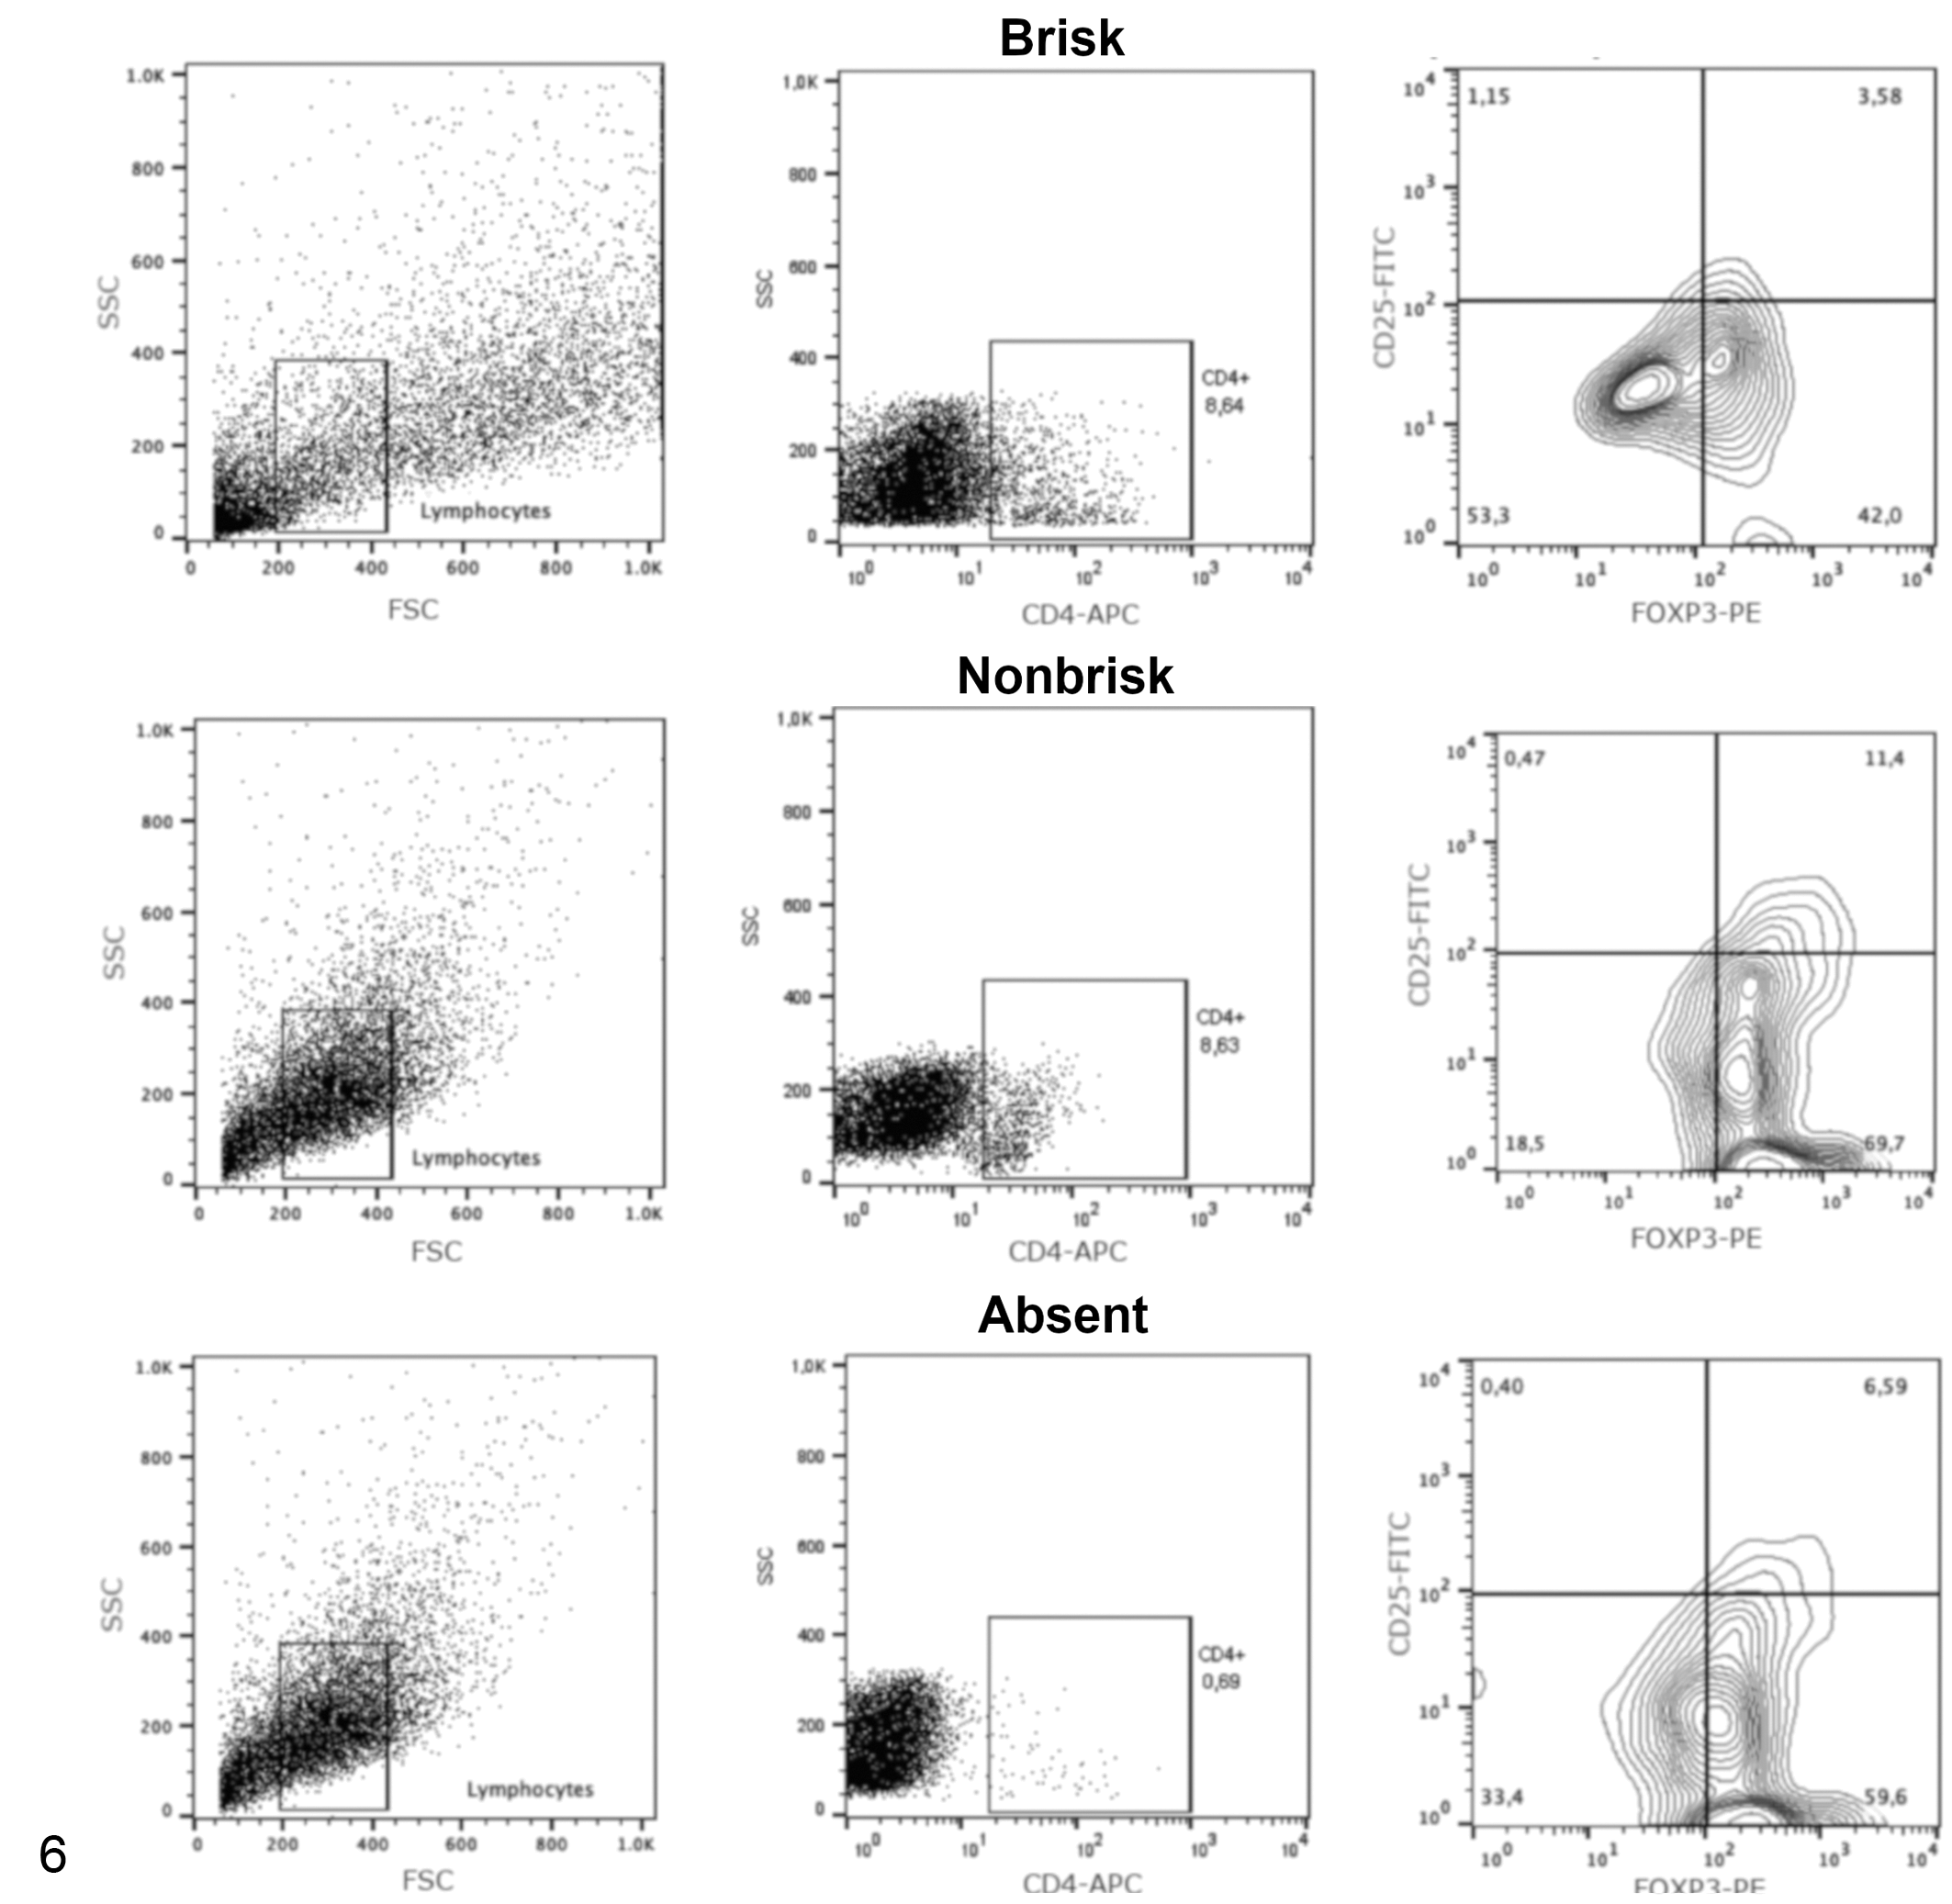
Representative flow cytometry plots showing the frequency of regulatory T cells (CD4+CD25+FoxP3+ subset) in tumor samples with histologically defined patterns as follows: brisk, nonbrisk, or absent patterns of TIL distribution (qualitative analysis). The analysis used a progressive gating strategy for analysis of tumor-infiltrating lymphocytes in tumor samples. The first gate includes lymphocyte populations based on forward and side scatter (FSC and SSC), then CD4+ cells were defined within the lymphocyte gate, and finally the regulatory T cells were defined as Foxp3+ CD25+ cells within the CD4+ T cell gate. The antibody specificities are noted on the x- and y-axes (center and right panels).
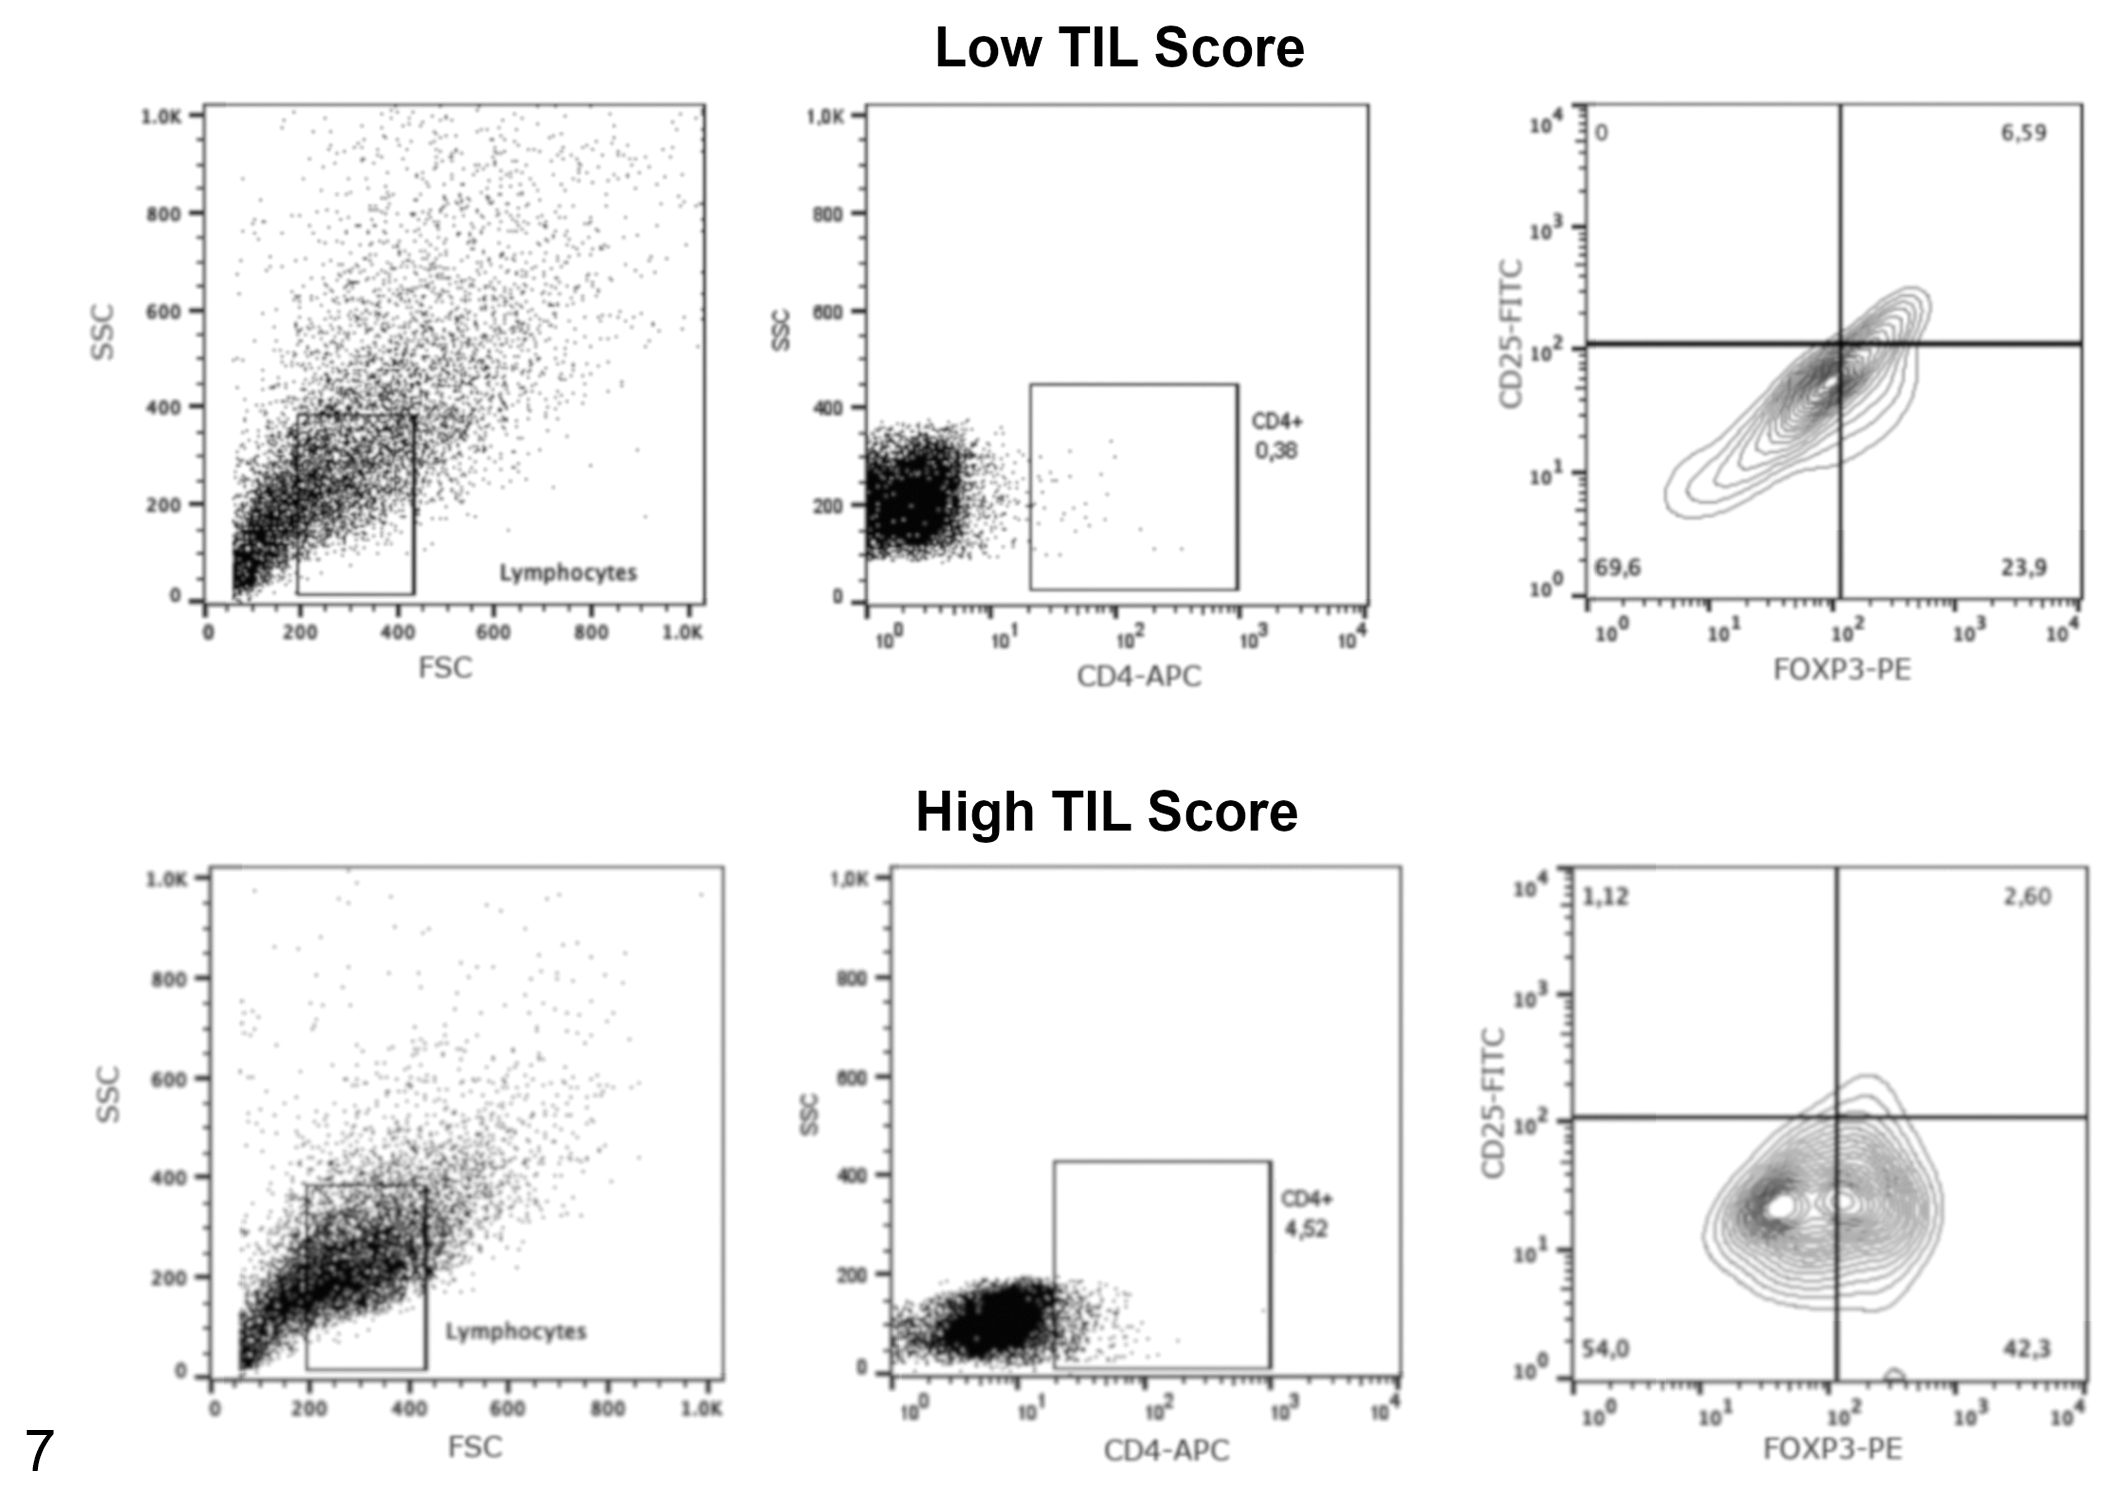
Representative flow cytometry plots showing the frequency of regulatory T cells (CD4+CD25+FoxP3+ subset) in tumor samples with low or high tumor-infiltrating lymphocyte scores (semiquantitative analysis). The analysis used a progressive gating strategy for analysis of tumor-infiltrating lymphocytes in tumor samples. The first gate includes lymphocyte populations based on forward and side scatter (FSC and SSC), then CD4+ cells were defined within the lymphocyte gate, and finally the regulatory T cells were defined as Foxp3+ CD25+ cells within the CD4+ T cell gate. The antibody specificities are noted on the x- and y-axes (center and right panels).
Statistical Analysis
Stages 1 and 2 tumors were grouped as “less aggressive” and stages 3 and 4 tumors were grouped as “more aggressive” to perform the statistical analyses. Bartlett’s test was used to assess whether groups of data showed homogeneity of variance. Statistical differences of the histopathological analyses (including TIL score and pattern), patient age, breed, and staging were determined by Student’s t test and one-way ANOVA. Post hoc Tukey test was performed. Immunophenotyping data were analyzed with the Kruskal-Wallis test, and a post hoc Dunn’s test was performed. Contingency tables were analyzed with the Fisher’s test. Survival was considered as the time between surgery and the date of death. This information was provided by the veterinarians who performed the surgeries. Follow-up period was 1½ years. Survival curves were generated by the Kaplan-Meier method. Gehan-Breslow-Wilcoxon test was used for multiple comparison of the survival results. In all applied tests, the probability of P < .05 was considered capable of revealing significant differences. For the statistical analysis, GraphPad Prism 6 software was used. The data analyzed in this study are available as Supplemental Materials.
Results
Patient Demographics
Demographic data were obtained through clinical records provided by the responsible veterinarians and information provided by the patients’ owners. Fifty samples from 45 patients were studied (5 were considered to be recurrences of the primary tumor and were also included in the study). The mean age of dogs included in this study was 12.5 years. Twenty-three were female and 22 were male, and all dogs were castrated or spayed. The most represented breeds were mixed breed (18), Teckel (5), and English Cocker Spaniel (4). Of the 50 samples received, 34 were the first occurrence of melanoma and 16 were local recurrences. All tumors were completely excised by hemimaxillectomy, hemimandibulectomy, labioplasty, or palatoplasty procedures. Patients did not receive treatment prior to surgery. In 44% of patients, the evaluation of mandibular lymph node metastasis was performed only by palpation in the clinical examination; in the remaining 56%, mandibular lymph nodes were also evaluated histopathologically.
Of the 45 dogs included in the study, 5 were in stage 1, 11 were in stage 2, 26 were in stage 3, and 8 were in stage 4 (Supplemental Table S3). Of the primary tumors (ie, first occurrence), 13 were from patients in stages 1 to 2 and 21 were from patients in stages 3 to 4. Of the tumors that were recurrences, 3 were from patients in stages 1 to 2 and 13 were from patients in stages 3 to 4.
Regarding the localization of melanoma in the oral cavity, 7 were in the soft or hard palate, 22 were in the gingiva (ie, with attached gingiva and/or muco-gingival junction), 4 were in the mucolabial fold, 5 were in the lip, and 12 were present in more than one location (gingiva and soft or hard palate) in the oral cavity.
Association of Histologic Parameters and Survival
There were no statistically significant differences in survival of patients with tumors with a high mitotic index (more than 3 mitosis in ten 40× fields) compared to those with a low mitotic index (P = .15), in those with a high degree of cell atypia (atypia grade ≥4) compared to those with a low degree of atypia (atypia grade <4, P = .62), or in those in which greater than 20% of cells contained nucleoli compared to those with nucleoli in less than 20% of the evaluated neoplastic cells (P = .7).
Assessment of TILs in Melanoma
The evaluation of TILs was performed in 48 samples. Histopathological analysis was not performed in 2 samples because of insufficient tissue quality. In the semiquantitative histopathologic analysis, samples from dogs with a less aggressive stage (stages 1 and 2) had higher TIL score compared to those with a more aggressive stage (stages 3 and 4; P = .004; Fig. 8, Supplemental Figure S2). Furthermore, samples from a primary tumor (ie, a first occurrence) had higher TIL scores compared to samples from recurrent tumors (P = .01; Fig. 9, Supplemental Figure S3).
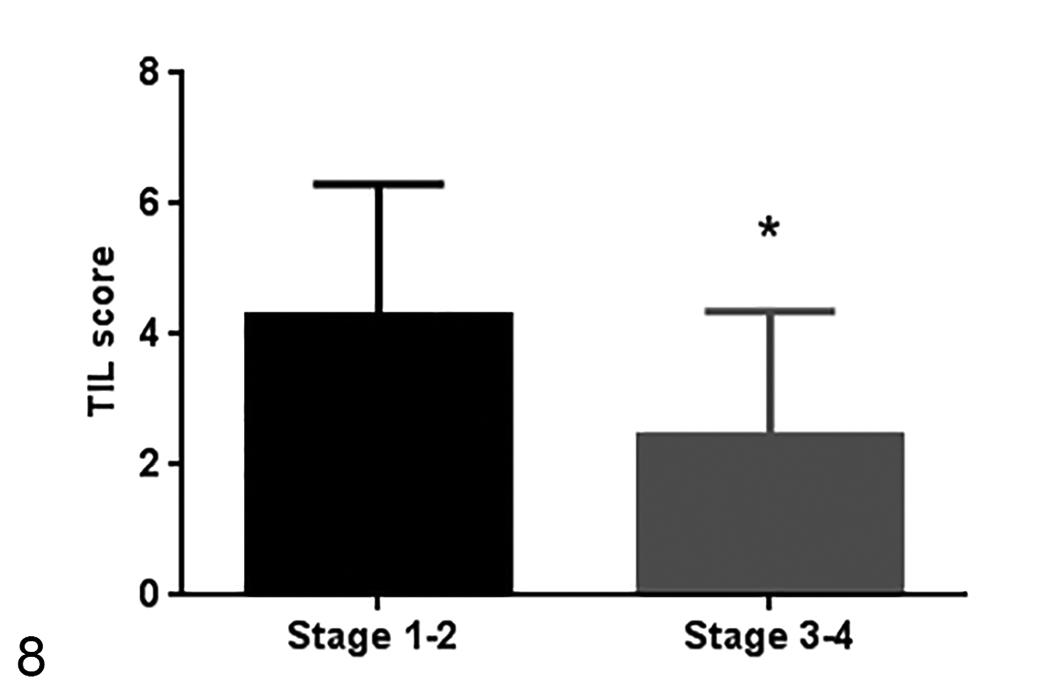
Tumor-infiltrating lymphocyte TIL scores in different stages of disease. The TIL score is higher in less aggressive stages (stages 1 and 2). Number of samples of stage 1 and 2 = 14 samples, number of samples of stage 3 and 4 = 34 samples. Median ± standard deviation. *P = .004, unpaired t test.
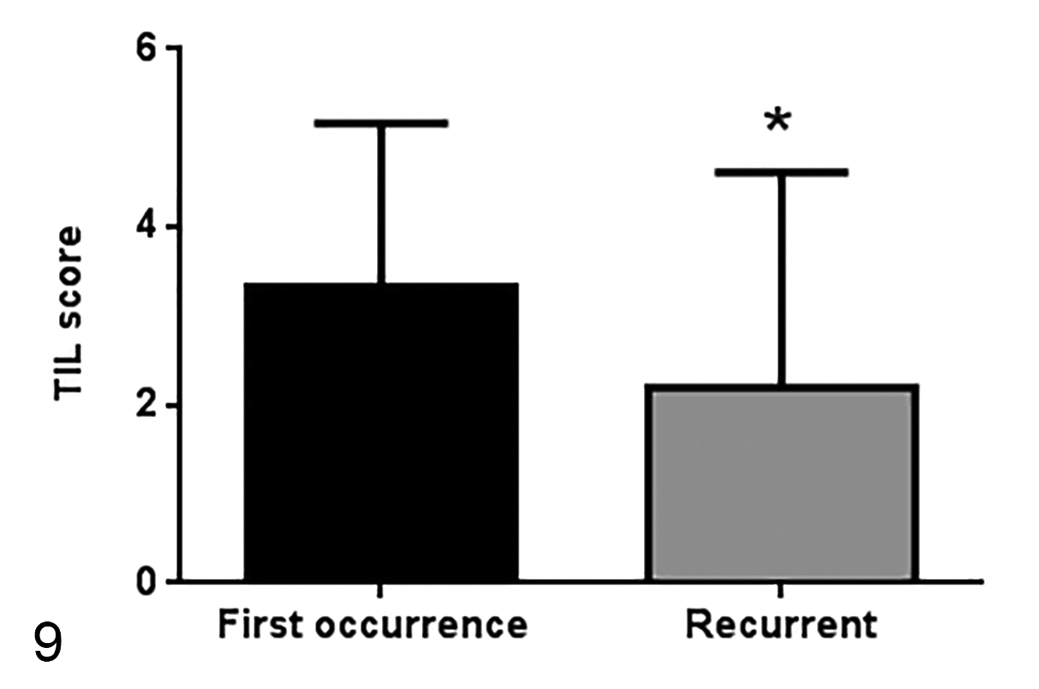
TIL scores in primary tumors (a first occurrence) or tumor recurrences (33 samples and 15 samples, respectively). TIL scores are higher in first occurrence tumors. Median ± standard deviation. *P = .01, unpaired t test.
In the qualitative analysis, 28 (58%) samples had a brisk TIL distribution pattern, 10 (21%) samples had a nonbrisk pattern, and TILs were absent in 10 (21%) samples. Samples that had a brisk or nonbrisk pattern had a higher TIL score in the semiquantitative analysis (P < .0001) compared to those with an absence of TILs (Fig. 10, Supplemental Figure S4).
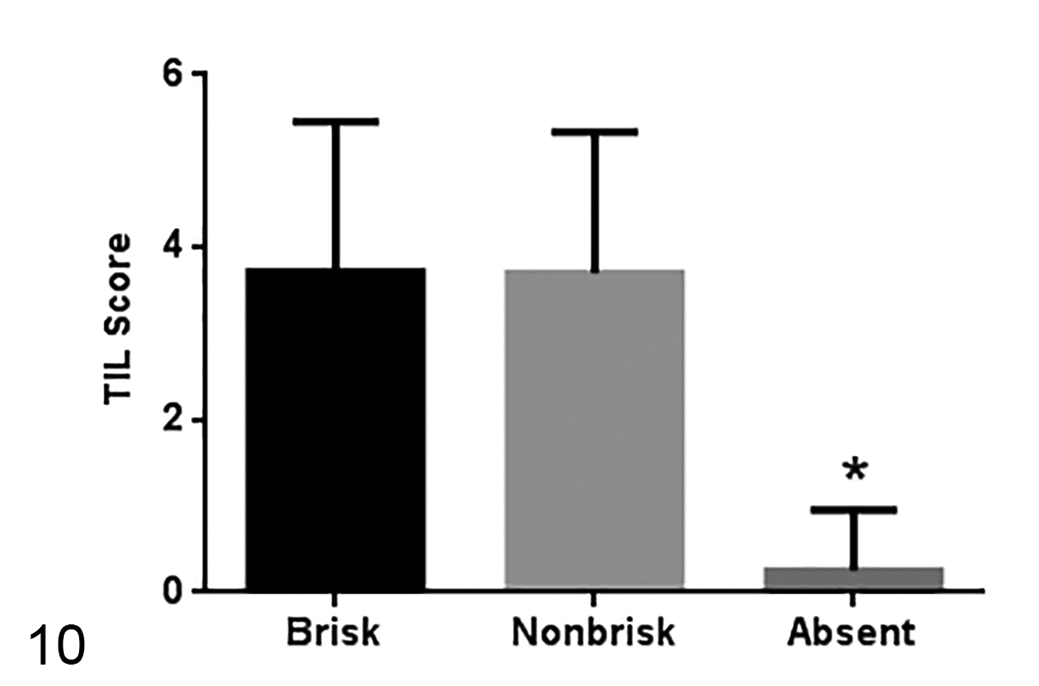
TIL scores in tumors with different TIL distribution patterns (28 samples with brisk pattern, 10 samples with nonbrisk pattern, and 8 samples with absent pattern). Median ± standard deviation. *P < .0001, one-way ANOVA.
Correlation of Histologic Assessment of TILs and Flow Cytometry-Based Immunophenotyping
Comparing the histological evaluation and the immunophenotyping data of 46 samples, the histopathologically brisk pattern of TILs had a higher frequency of CD8+ T lymphocytes by flow cytometry (P = .05) and a lower frequency of CD4+/CD25+/FoxP3+ Tregs (P = .03) compared to the samples with nonbrisk and absent infiltrate patterns (Figs. 11, 12; Supplemental Figures S5, S6). Samples with higher TIL scores (scores from 3 to 6) in the semiquantitative histopathological analysis had a higher frequency of CD8+ T lymphocytes (P = .009) and a lower frequency of CD4+/CD25+/Foxp3+ Tregs (P = .02) by flow cytometry (Figs. 13, 14; Supplemental Figures S7, S8). In addition to demonstrating CD4+/CD25+/FoxP3+ Tregs by flow cytometry, the presence of FoxP3+ lymphocytes was also confirmed by immunohistochemistry. However, the immunohistochemical labeling of Foxp3+ T lymphocytes was not statistically analyzed due to the low number of samples, since only few samples of each TIL pattern were analyzed (4 brisk samples, 3 nonbrisk samples, and 2 absent samples) and only to demonstrate the presence of FoxP3+ cells by another method besides immunophenotyping (Supplemental Figure S1).
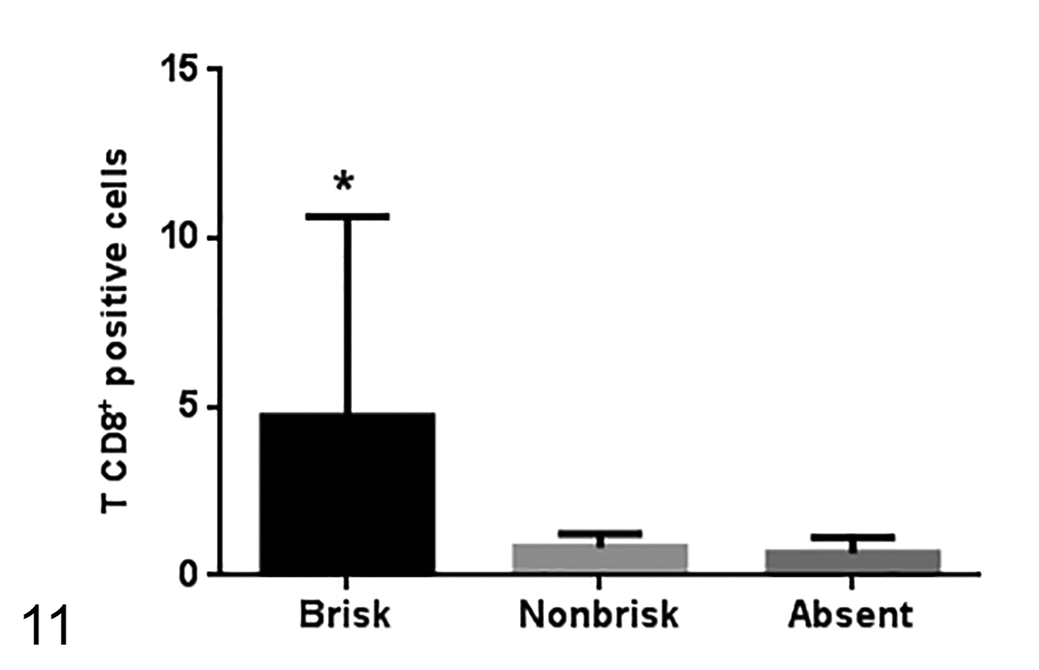
The percentage of CD8+ T cells (as a percentage of all CD3+ T cells) is higher in the brisk pattern of lymphocytic infiltration (24 samples with brisk pattern, 6 samples with nonbrisk pattern, and 8 samples with absent pattern). Median ± standard deviation. *P = .05, Kruskal-Wallis test.
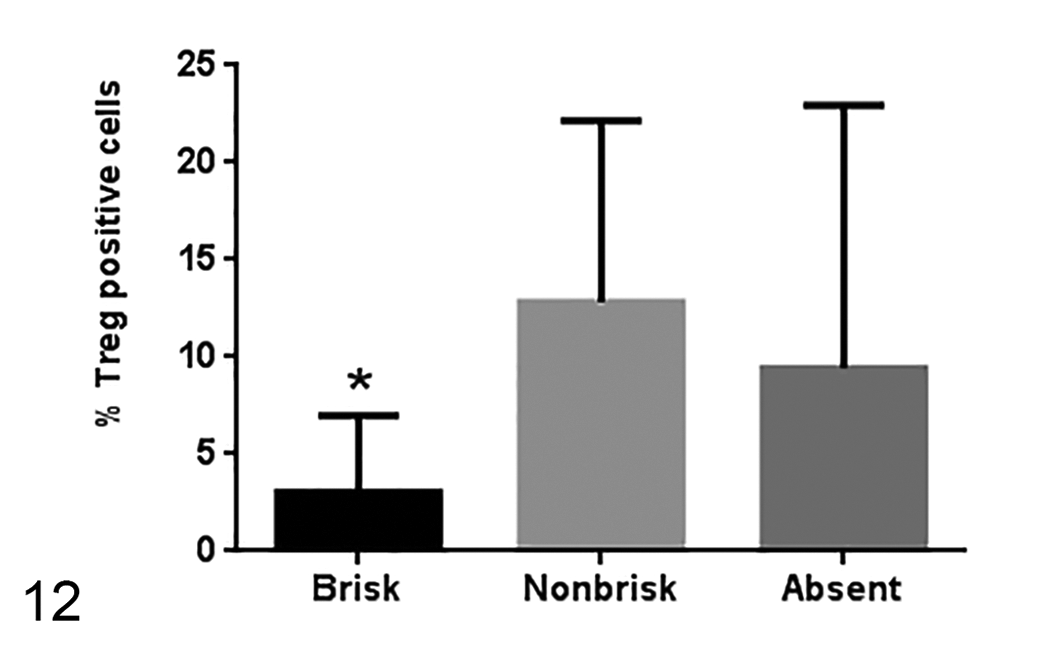
The percentage of Treg cells is lower in the brisk melanoma samples (26 samples with brisk pattern, 6 samples with nonbrisk pattern, and 9 samples with absent pattern). Median ± standard deviation. *P = .03, Kruskal-Wallis test.
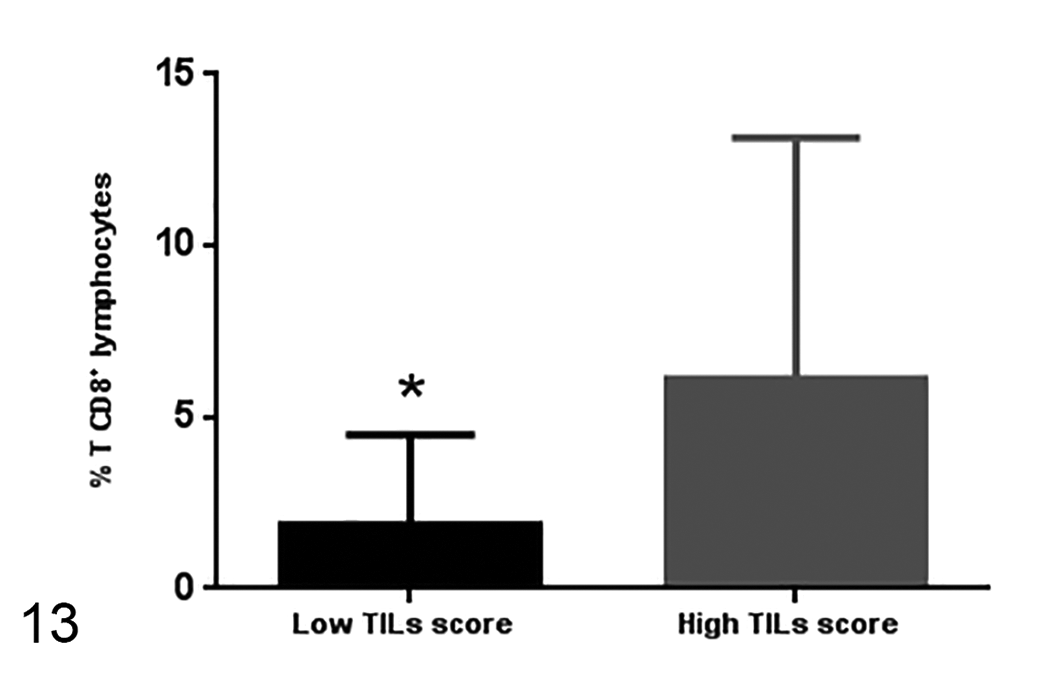
The percentage of CD8+ T cells is lower in samples with low TIL score (24 samples) compared to samples with high TIL score (17 samples). Median ± standard deviation. P = .009, unpaired t test.
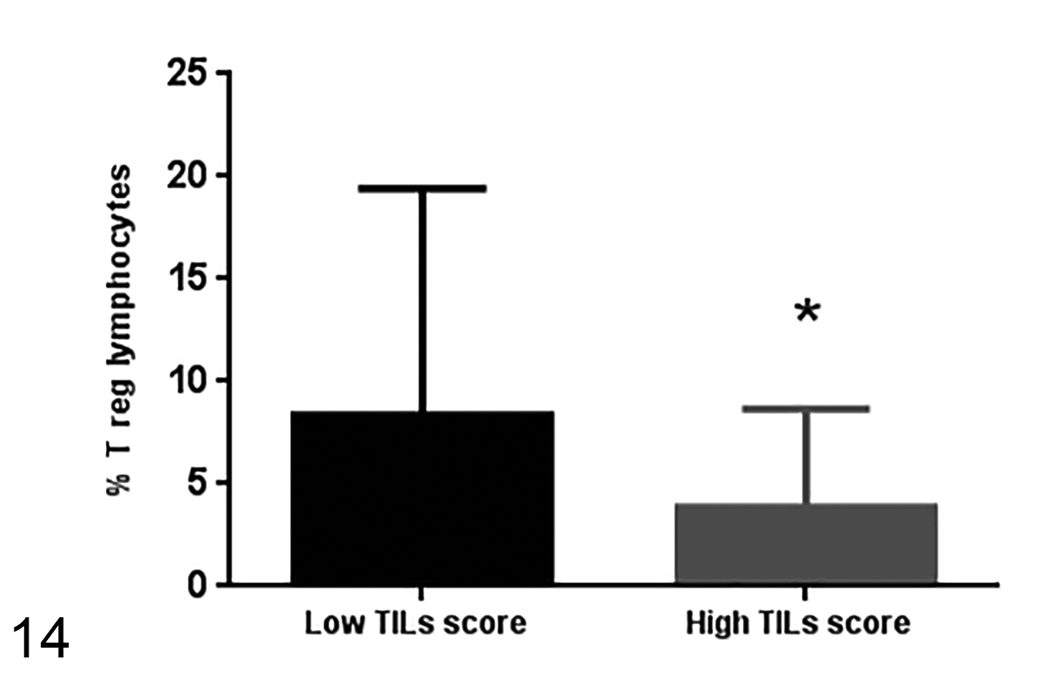
The percentage of Treg cells in samples with high TIL score (17 samples) is lower than the frequency of Treg cells in samples with low TIL score (24 samples). Median ± standard deviation. P = .02, unpaired t test.
Consistent with the TIL scores, samples of primary tumors (ie, a first tumor occurrence) had a higher frequency of intratumoral CD8+ and CD4+ T lymphocytes by flow cytometry than the samples that were tumor recurrences (P = .02 and P = .01, respectively).
Samples of less aggressive stages (stages 1 and 2) had a higher frequency of CD8+ T lymphocytes (P < .0001) and CD4+ T lymphocytes (P = .002) than the samples of more aggressive stages (stages 3 and 4). This difference between stages was not observed for Treg cells. No statistically significant relationships were found between either stage or TIL scores and any of the following: the number of sample mitoses, cell pattern, degree of pigmentation, observed presence of nucleoli, or degree of atypia.
When the survival between patients was compared, patients with higher TIL scores and those with a brisk or nonbrisk TIL pattern had a higher overall survival rate than patients with low TIL scores (P = .002) and those with an absence of TILs (P = .001; Figs. 15, 16). Overall survival also correlated with an increased frequency of CD8+ T lymphocytes infiltrating the tumor (P = .003); specifically, patients in which greater than 3% of the CD3+ T cells were of CD8+ subtype had a mean survival of 210 days, compared to the 60 days for those with less than 3% of CD8+ T cells (Fig. 17). There was no impact of Treg and T CD4+ lymphocyte frequency on patient survival.
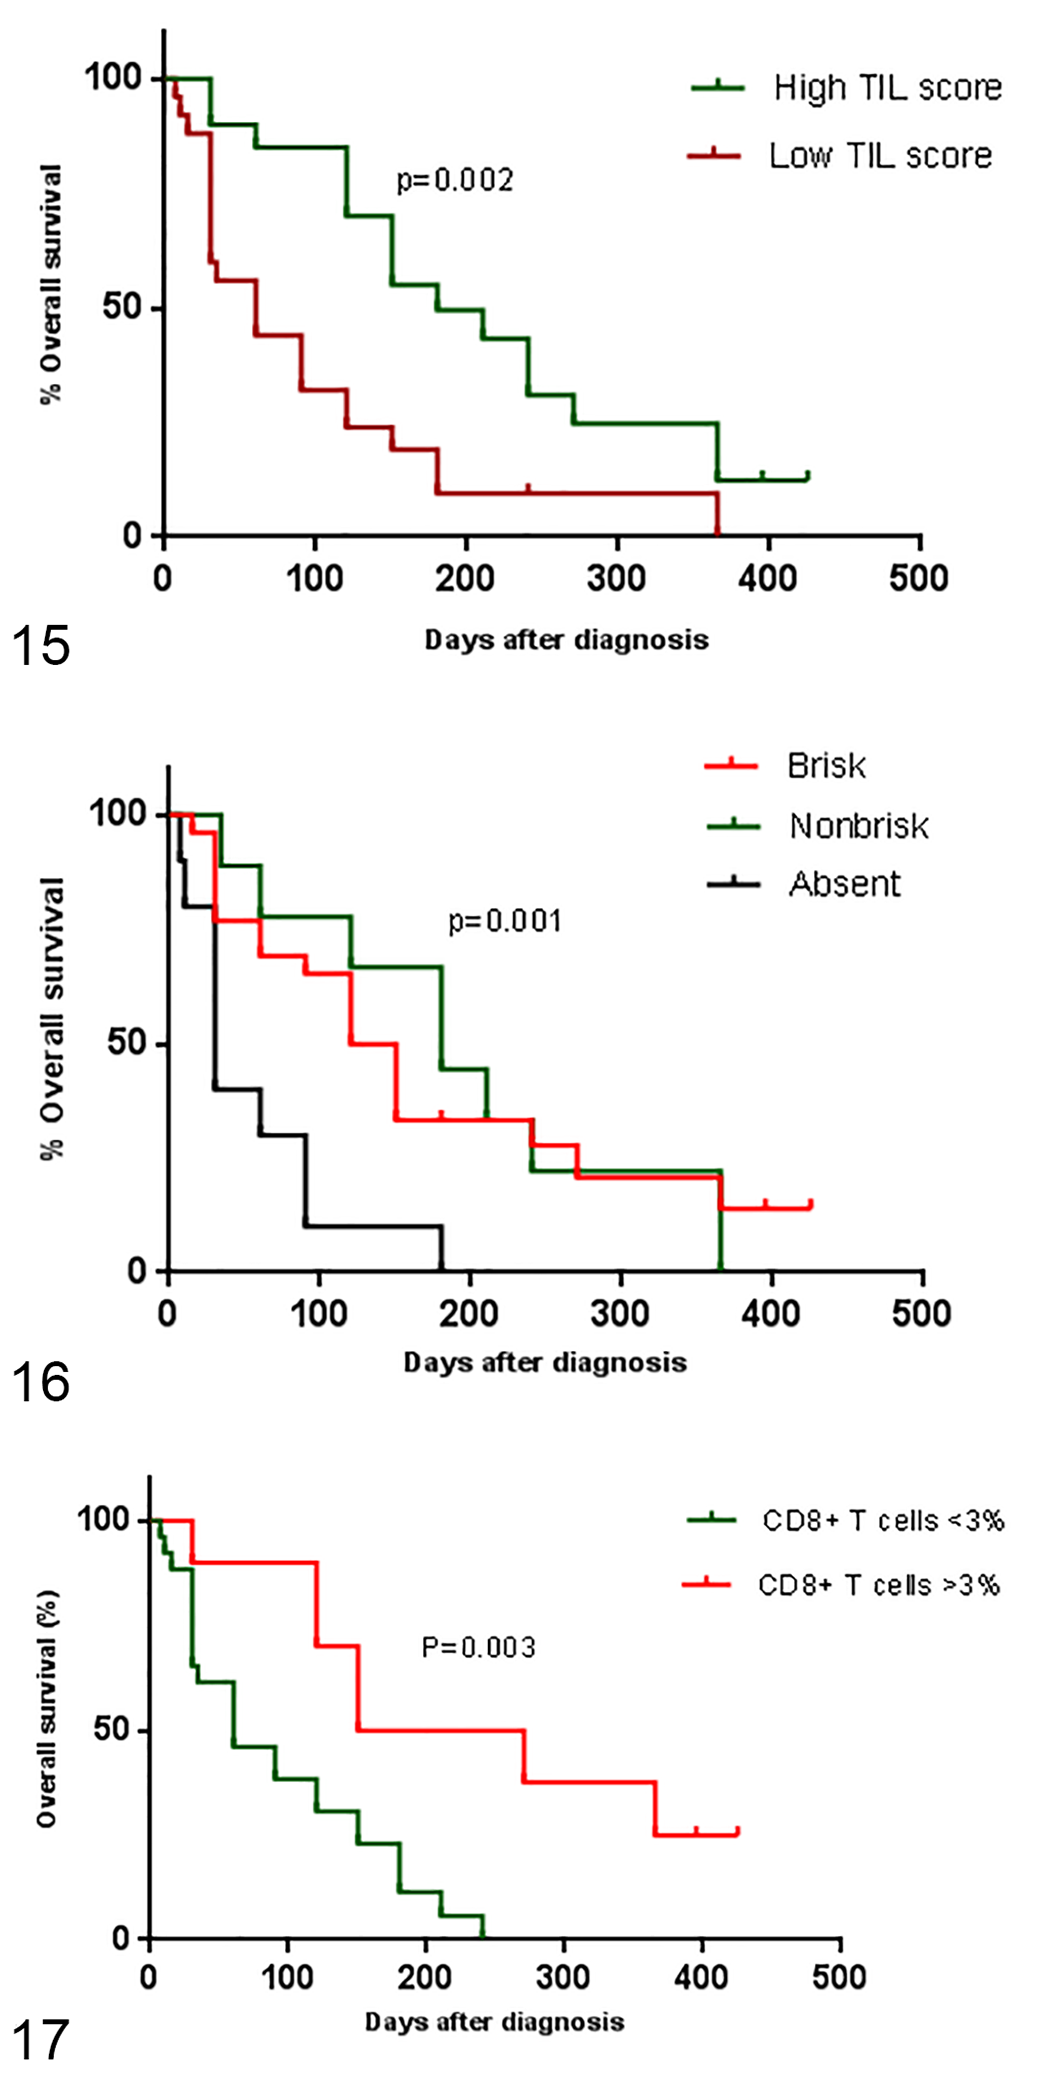
Kaplan-Meier overall survival curves for dogs with oral melanoma. Figure 15. Overall survival curves of dogs having tumors with high and low tumor-infiltrating lymphocyte scores as defined by histopathology. P = .002, log-rank test.
Discussion
In canine melanoma, the role of immune cells, especially TILs, is still relatively unexplored. The purpose of this study was to better understand the clinical context of the presence of different T lymphocyte subsets.
Dogs included in this study were at different stages of disease. However, failure in staging oral melanoma may occur because the current staging system does not consider the dog size. In addition, in Brazil, most oncology services assess the presence of distant organ metastases by radiography rather than tomography, and very small pulmonary nodules may not be detected on radiographs. Another limitation is that in 44% of our patients, the presence of lymph node metastasis was ascertained solely based on the increase in mandibular lymph node volume based on palpation rather than by histopathology. For these reasons, in this study, we grouped stages 1 and 2 as “less aggressive” and stages 3 and 4 as “more aggressive” to perform the statistical analyses. 24,46
TIL scores were higher in samples from dogs with less aggressive disease stages and in tumors that represented first occurrences, as well as in patients with longer survival times. Likewise, the frequency of CD8+ and CD4+ T lymphocytes was higher in samples from less aggressive stages and from tumors that were first occurrences. This may be explained by the ability of the aggressive tumors to evade the immune response, while less aggressive tumors are detected by the immune system. 13 A higher TIL score and a higher CD8+ T cell frequency were also observed in melanomas with a diffuse pattern of lymphocytic infiltrates, while the frequency of Tregs was lower in melanomas with diffuse TIL patterns and high TIL scores.
Similarly, a study of canine mammary neoplasms identified intratumoral CD3+ T lymphocytes and found greater number of TILs in benign neoplasms (adenomas and benign mixed mammary tumors) than in malignant neoplasms (carcinomas and carcinosarcoma). 6 There are other examples of canine tumors where the presence of intratumoral lymphocytes is associated with improved outcomes such as the presence of CD8+ T lymphocytes in mammary carcinomas 15 and in transmissible venereal sarcomas in regression. 2 This relationship between TILs and prognosis has also been described in human cancers including cutaneous melanoma, breast tumor, hepatic carcinoma, colorectal tumors, ovarian tumor, and non–small cell lung cancer. 10,16,17,29,33,34
Previous studies have evaluated the presence of Tregs in canine tumors. A study of dogs with oral melanoma evaluated the intratumoral and blood population of CD4+ FoxP3+ Tregs. Tregs cells were more prevalent in the tumor than in the peripheral blood. It was hypothesized that tumor cells induce the migration of Tregs into the tumors. 45 Another study evaluated the presence of Tregs in canine oral melanoma with immunohistochemistry and found decreased overall survival in patients with increased numbers of infiltrating Tregs. 38
In a study of histiocytic sarcomas in flat-coated retriever dogs, immunohistochemistry was used to evaluate the proportion of TILs that were Tregs. It was observed that cutaneous histiocytic sarcomas contained a higher proportion of Tregs than did visceral histiocytic sarcomas. While the presence of Tregs in canine tumors is often associated with a worse prognosis, the visceral form of histiocytic sarcoma has a worse prognosis in dogs despite having a lower proportion of Tregs. 27 In our study, there was no relation between the frequency of Tregs and patient survival.
We observed a longer survival of patients with brisk and nonbrisk patterns of lymphocyte infiltrate compared to absence of lymphocyte infiltrate, and in those with a high TIL score compared to patients with absent and low TIL scores. This finding corroborates previous studies in which a longer survival was observed in human and canine patients who had brisk and non-brisk patterns of TIL distribution and a high TIL score. 9,15,16,44
In humans, tumors infiltrated by CD8+ T cells are called “hot tumors” and these tumors have a high mutational rate that leads to the presence of neoantigens on the tumor cell surface. Tumor antigens are available for antigen-presenting cells (APCs), which induce the activation of more CD4+ and CD8+ T lymphocytes. These lymphocytes migrate to the tumor site, secrete TNF and IFN-γ leading to increased MHC I expression by tumor cells, and increased sensitivity to lysis by cytotoxic CD8+ T cells. Conversely, tumors with no infiltrating lymphocytes are called “cold tumors” and they do not provoke an immune reaction and, therefore, do not respond to medications such as checkpoint inhibitors aimed at enhancing the antitumor immune response. 25,40
Pattern evaluation alone probably does not represent the actual number of lymphocytes, and for this reason the semiquantitative method was also applied. Classification of lymphocyte patterns could assist with and be complementary to tumor, node, and metastasis staging system, since it is a practical and inexpensive analysis that can be used in the routine analysis of tumors by pathologists. Also, as mentioned above for human tumors, the TILs pattern analysis associated with others information from TILs could serve as a basis for future studies to select those canine patients who will benefit from immunotherapy for oral melanoma.
Conclusion
Our data indicate an association between clinically relevant outcomes and TIL score, lymphocyte infiltrate pattern, and intratumoral lymphocyte subtypes. Analysis of TILs could be an ancillary method to predict prognosis in canine oral melanoma.
Supplemental Material
Supplemental Material, sj-pdf-1-vet-10.1177_0300985821999321 - Intratumoral T-Lymphocyte Subsets in Canine Oral Melanoma and Their Association With Clinical and Histopathological Parameters
Supplemental Material, sj-pdf-1-vet-10.1177_0300985821999321 for Intratumoral T-Lymphocyte Subsets in Canine Oral Melanoma and Their Association With Clinical and Histopathological Parameters by Cassia C. Yasumaru, José Guilherme Xavier, Ricardo De Francisco Strefezzi and Cristina O. Massoco Salles-Gomes in Veterinary Pathology
Footnotes
Acknowledgement
To pathologists Vívian Ríspoli, DVM, and DVM Luciana Neves Torres, DVM, for the invaluable contribution to tumor infiltrating lymphocyte histopathological analysis.
Declaration of Conflicting Interests
The author(s) declared no potential conflicts of interest with respect to the research, authorship, and/or publication of this article.
Funding
The author(s) disclosed receipt of the following financial support for the research, authorship, and/or publication of this article: The authors received financial support from CAPES for this research.
Supplemental material for this article is available online.
References
Supplementary Material
Please find the following supplemental material available below.
For Open Access articles published under a Creative Commons License, all supplemental material carries the same license as the article it is associated with.
For non-Open Access articles published, all supplemental material carries a non-exclusive license, and permission requests for re-use of supplemental material or any part of supplemental material shall be sent directly to the copyright owner as specified in the copyright notice associated with the article.