
Abstract
Counting mitotic figures (MF) in hematoxylin and eosin–stained histologic sections is an integral part of the diagnostic pathologist’s tumor evaluation. The mitotic count (MC) is used alone or as part of a grading scheme for assessment of prognosis and clinical decisions. Determining MCs is subjective, somewhat laborious, and has interobserver variation. Proposals for standardizing this parameter in the veterinary field are limited to terminology (use of the term MC) and area (MC is counted in an area measuring 2.37 mm2). Digital imaging techniques are now commonplace and widely used among veterinary pathologists, and field of view area can be easily calculated with digital imaging software. In addition to standardizing the methods of counting MF, the morphologic characteristics of MF and distinguishing atypical mitotic figures (AMF) versus mitotic-like figures (MLF) need to be defined. This article provides morphologic criteria for MF identification and for distinguishing normal phases of MF from AMF and MLF. Pertinent features of digital microscopy and application of computational pathology (CPATH) methods are discussed. Correct identification of MF will improve MC consistency, reproducibility, and accuracy obtained from manual (glass slide or whole-slide imaging) and CPATH approaches.
Keywords
Counting mitotic figures (MF) in histologic preparations is the oldest and most widely used method to estimate cell proliferation in tumors. Although possibly not as precise and reproducible as other proliferation indices, the mitotic count (MC) is a rapid, inexpensive test that can be performed by any pathologist with a microscope and glass slide or with a computer and whole-slide image (WSI) technology. The results can be used alone or as part of a grading scheme to aid clinical decisions about prognosis and treatment. As indispensable as the MC is in the assessment of tumor behavior for many tumor types, this test has never been standardized in veterinary oncologic pathology. A standard area of 2.37 mm2 has recently been proposed to resolve the inherent variability in utilizing 10 high power fields for the MC. 44 However, multiple studies have demonstrated disparity in reproducibility of the MC with interobserver agreement (κ-values) ranging between 0.08 to 0.77 even if standard area is used. 13,20,22,27,28,45,51 Additional potential causes of inconsistency in the MC include variable identification of MF, 11,40,45,62 an inability to evaluate the complete tumor area, 7,11,34,57 and potentially pathologist fatigue from performing repetitive tasks. Disagreements of labeling structures as MF or mitotic-like figures (MLF) occurred with frequencies of 6% to 35%, 40 10% to 46%, 45 17%, 11,21,58,59 and 68% 62 and can be improved by establishing clear criteria for MF morphology.
In order to advance our understanding of the relationship between tumor morphology and behavior and to ensure progress in oncologic pathology, it is essential to delineate how to perform a MC, which starts with clearly defining the morphology of MF. This article therefore provides standards for the identification of MF and AMF to help distinguish them from MLF (Table 1). Additionally, we present comparisons of the general features of WSI as compared to light microscopy for identification of MF as well as a discussion of the role that computational pathology (CPATH) may play in MF identification and MC determination.
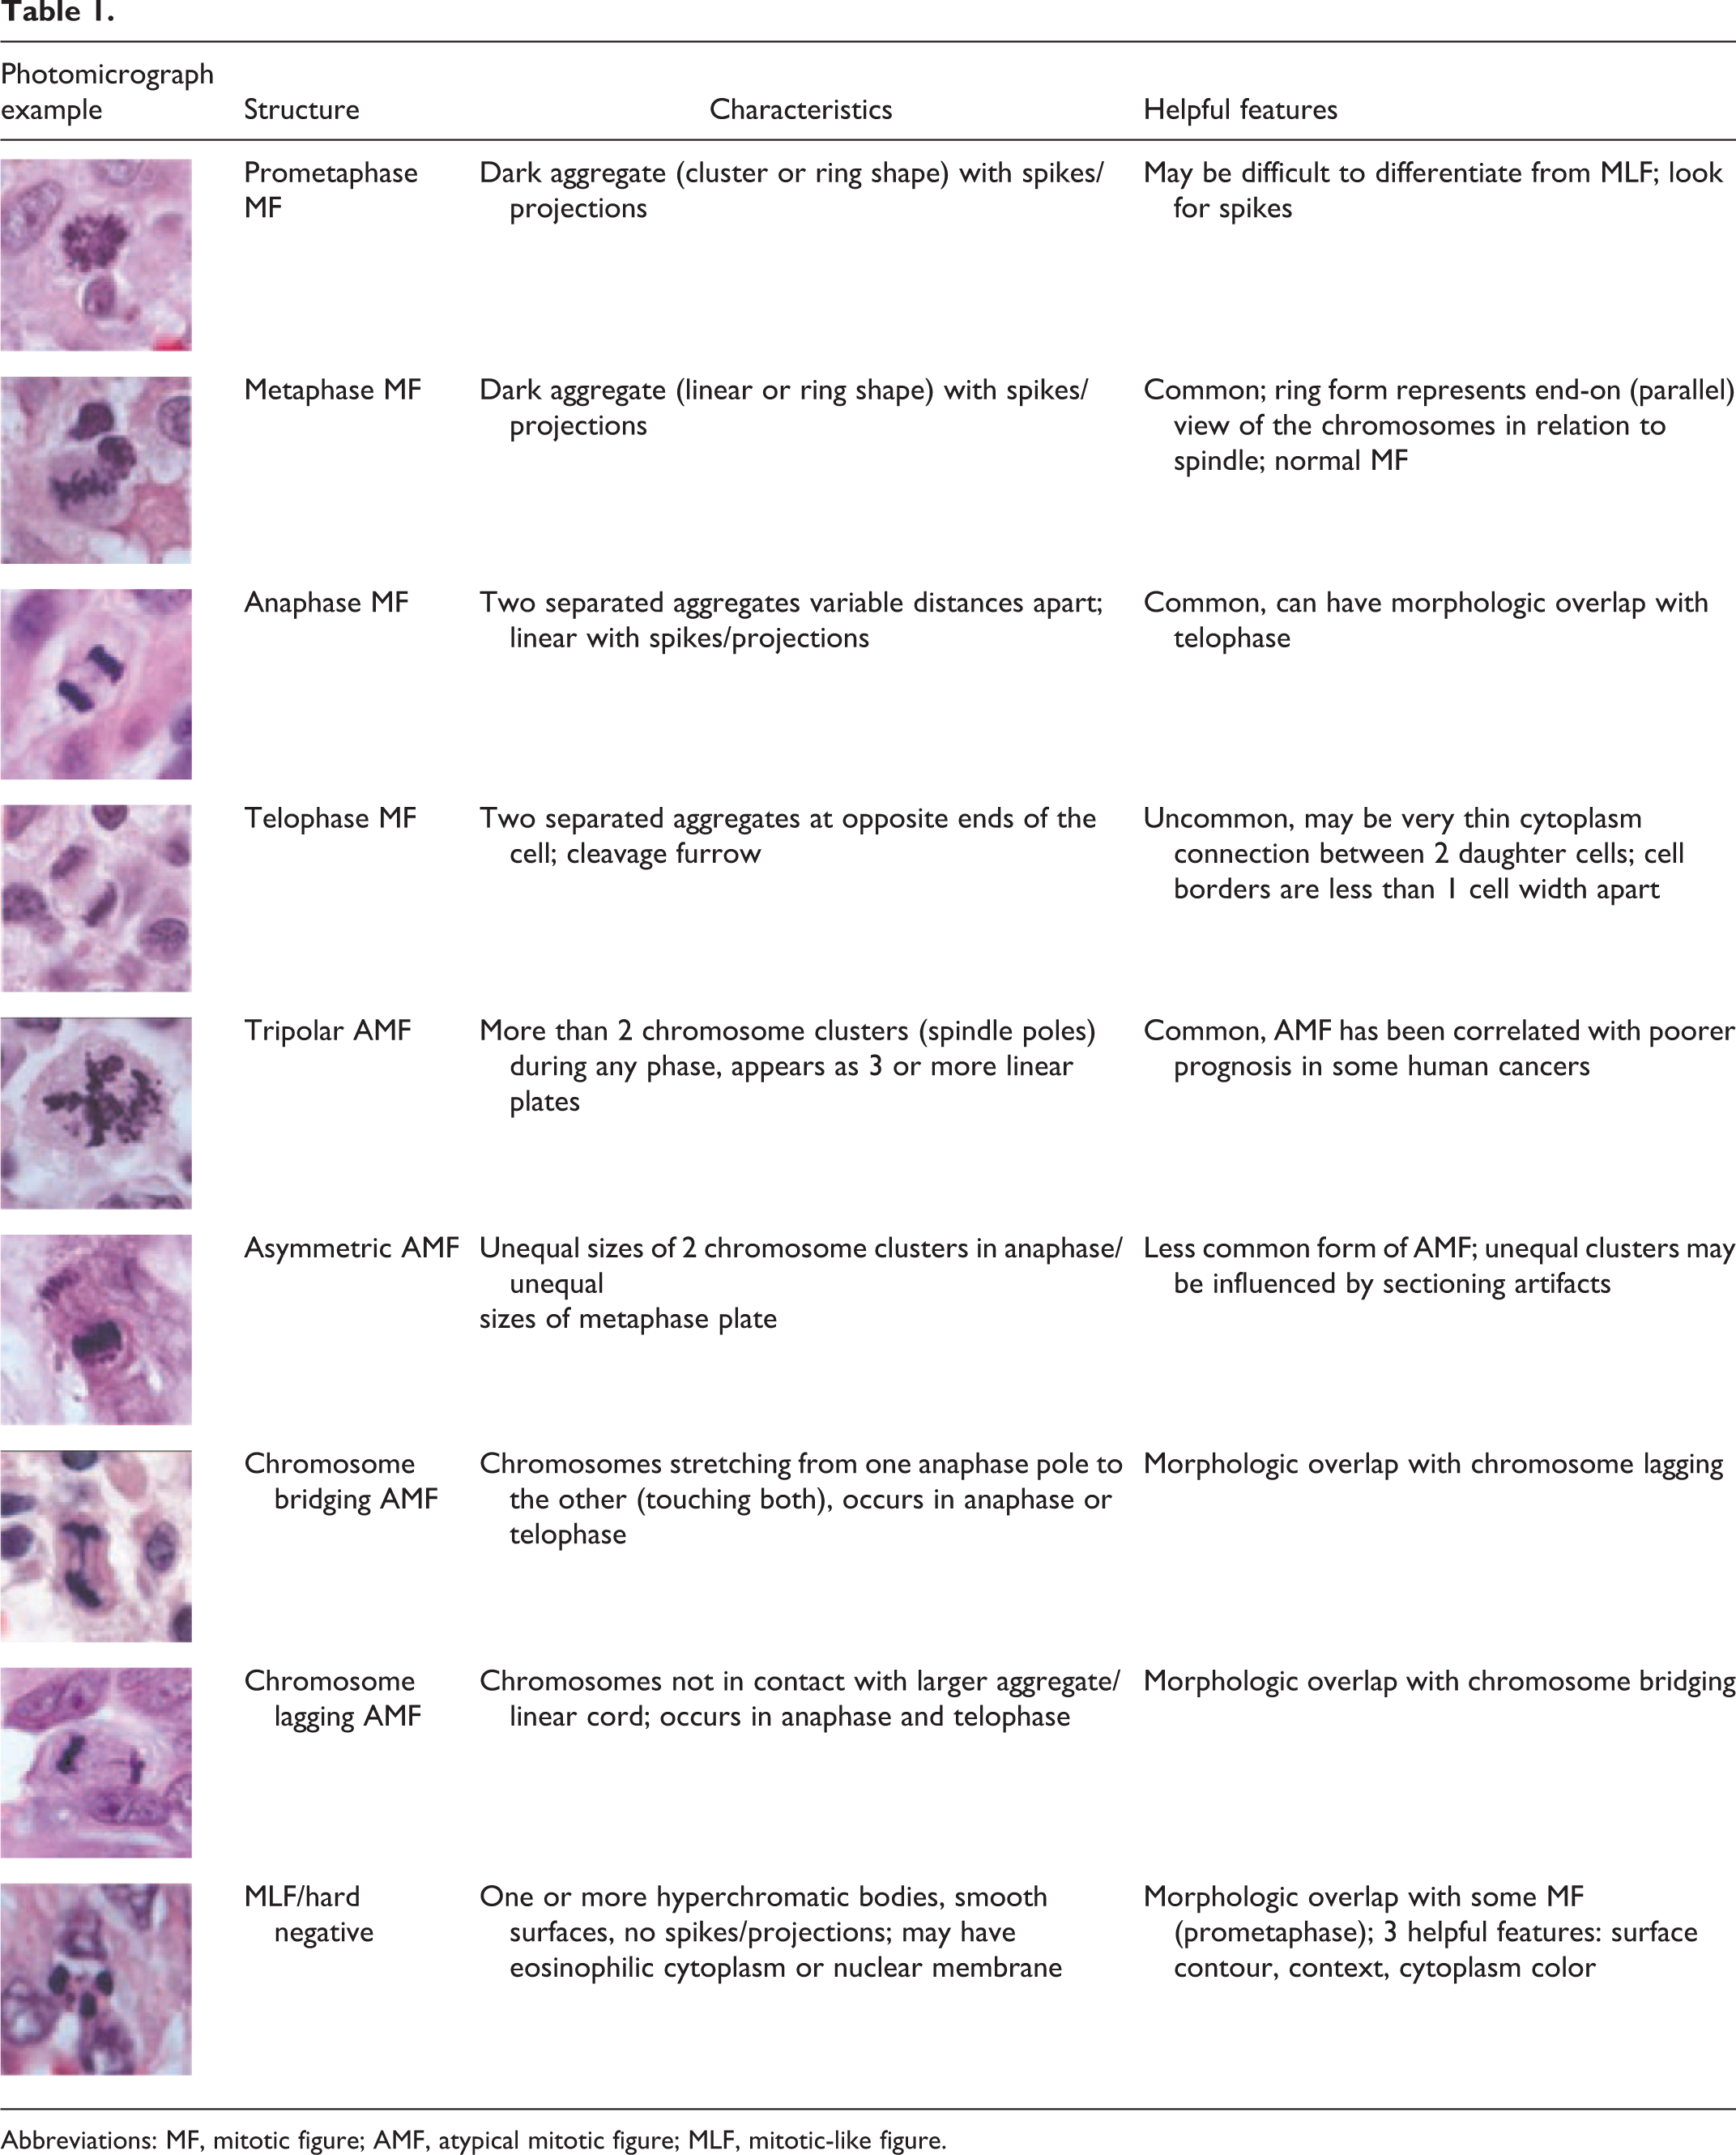
Abbreviations: MF, mitotic figure; AMF, atypical mitotic figure; MLF, mitotic-like figure.
Mitosis
Mitosis (karyokinesis) occurs during the M phase of the cell cycle, in which duplicated DNA is organized for equipartitioning. 21,42 The DNA of any complete genome is exceedingly longer than the cell diameter (in humans, almost 2 meters, with cells less than 1/100 000th of that size), translating to a herculean task in accurately segregating these long strands. 42 Chromatin, a complex of DNA and protein, has 2 forms visible with light microscopy: heterochromatin (densely compact, staining as dark granules) and euchromatin (active, loosely coiled, and light staining). Nuclei with greater replicative activity have more euchromatin and open space between granules of heterochromatin. Heterochromatin along the nuclear membrane is what allows this membrane to be visualized microscopically. Although pairs of duplicated, compacted DNA are referred to as chromatids, we will refer to this nuclear material visible in cytologic and histologic preparations as chromosomes, since there is no definitive way to differentiate chromosomes from chromatids with light microscopy. The phases of normal mitosis include prophase, prometaphase, metaphase, anaphase, and telophase. 17, 21,42,50,58,59 It is important to note that mitosis is a continuum, and that cells observed in histologic preparations may be arrested in transition between phases. The duration of each phase may vary between animal species and cell types. Both prophase and metaphase have been reported as the longest phases of mitosis; however, it is unclear whether this plays a role in how commonly identified these phases are in tumors viewed by light microscopy. 17,26,31,39
Morphologies of MF in Histology and Cytology
Mitosis is the process of karyokinesis while MF are the structures that can be identified with light microscopy. MF are defined as nuclear aggregates containing short rods or spikes of chromosomes (first described by van Diest as hairy projections), 59 unbound by a nuclear membrane after prophase (the first phase of mitosis). 34,59 Depending on the phase of mitosis, the morphologies of MF vary. While identification of the phases of mitosis is not necessary to perform MCs, general knowledge of the phases is useful when differentiating normal MF and AMF from MLF.
Prophase
At the first stage of mitosis, the chromosomes are compacted via reduced length and increased thickness, facilitated by proteins called condensins. 42 In prophase, a microtubule cytoskeletal spindle (rarely visible with light microscopy) forms, and attaches to and guides the chromosomes during the subsequent phases. 42 Prophase has 3 subphases (early, middle, and late). Histologically, early to mid-prophase is difficult to identify with light microscopy, as it is composed of chromosomes that are loosely compacted (not densely aggregated) into rod-shaped forms best seen in cytologic samples with preservation of the nuclear shape and membrane 42,50,58 (Fig. 1). These early subphases are difficult or impossible to reliably distinguish from MLF due to the similarity of the condensed nuclear chromosomes (which lack rods or spikes in prophase) to condensed, hyperchromatic, or pyknotic nuclei (Figs. 1, 18, 20, 21, 24, 26). 11,40,45,57 A pathologist or CPATH is not likely to reliably and consistently recognize early to mid-prophase because the characteristics that define this portion of prophase are too subtle when evaluating histologic preparations with light microscopy. The nuclear membrane is present and chromosomes are condensed uniformly, appearing as dark aggregates but without the easily visible dark clusters of chromosomes with rods or spikes seen in later phases. Therefore, we recommend that early to mid-prophase should not be enumerated in the MC as it cannot be reliably distinguished from MLF. During late prophase to prometaphase, condensed aggregating chromosomes are compacted 57,59 and chromosome spikes start to project from the cluster.
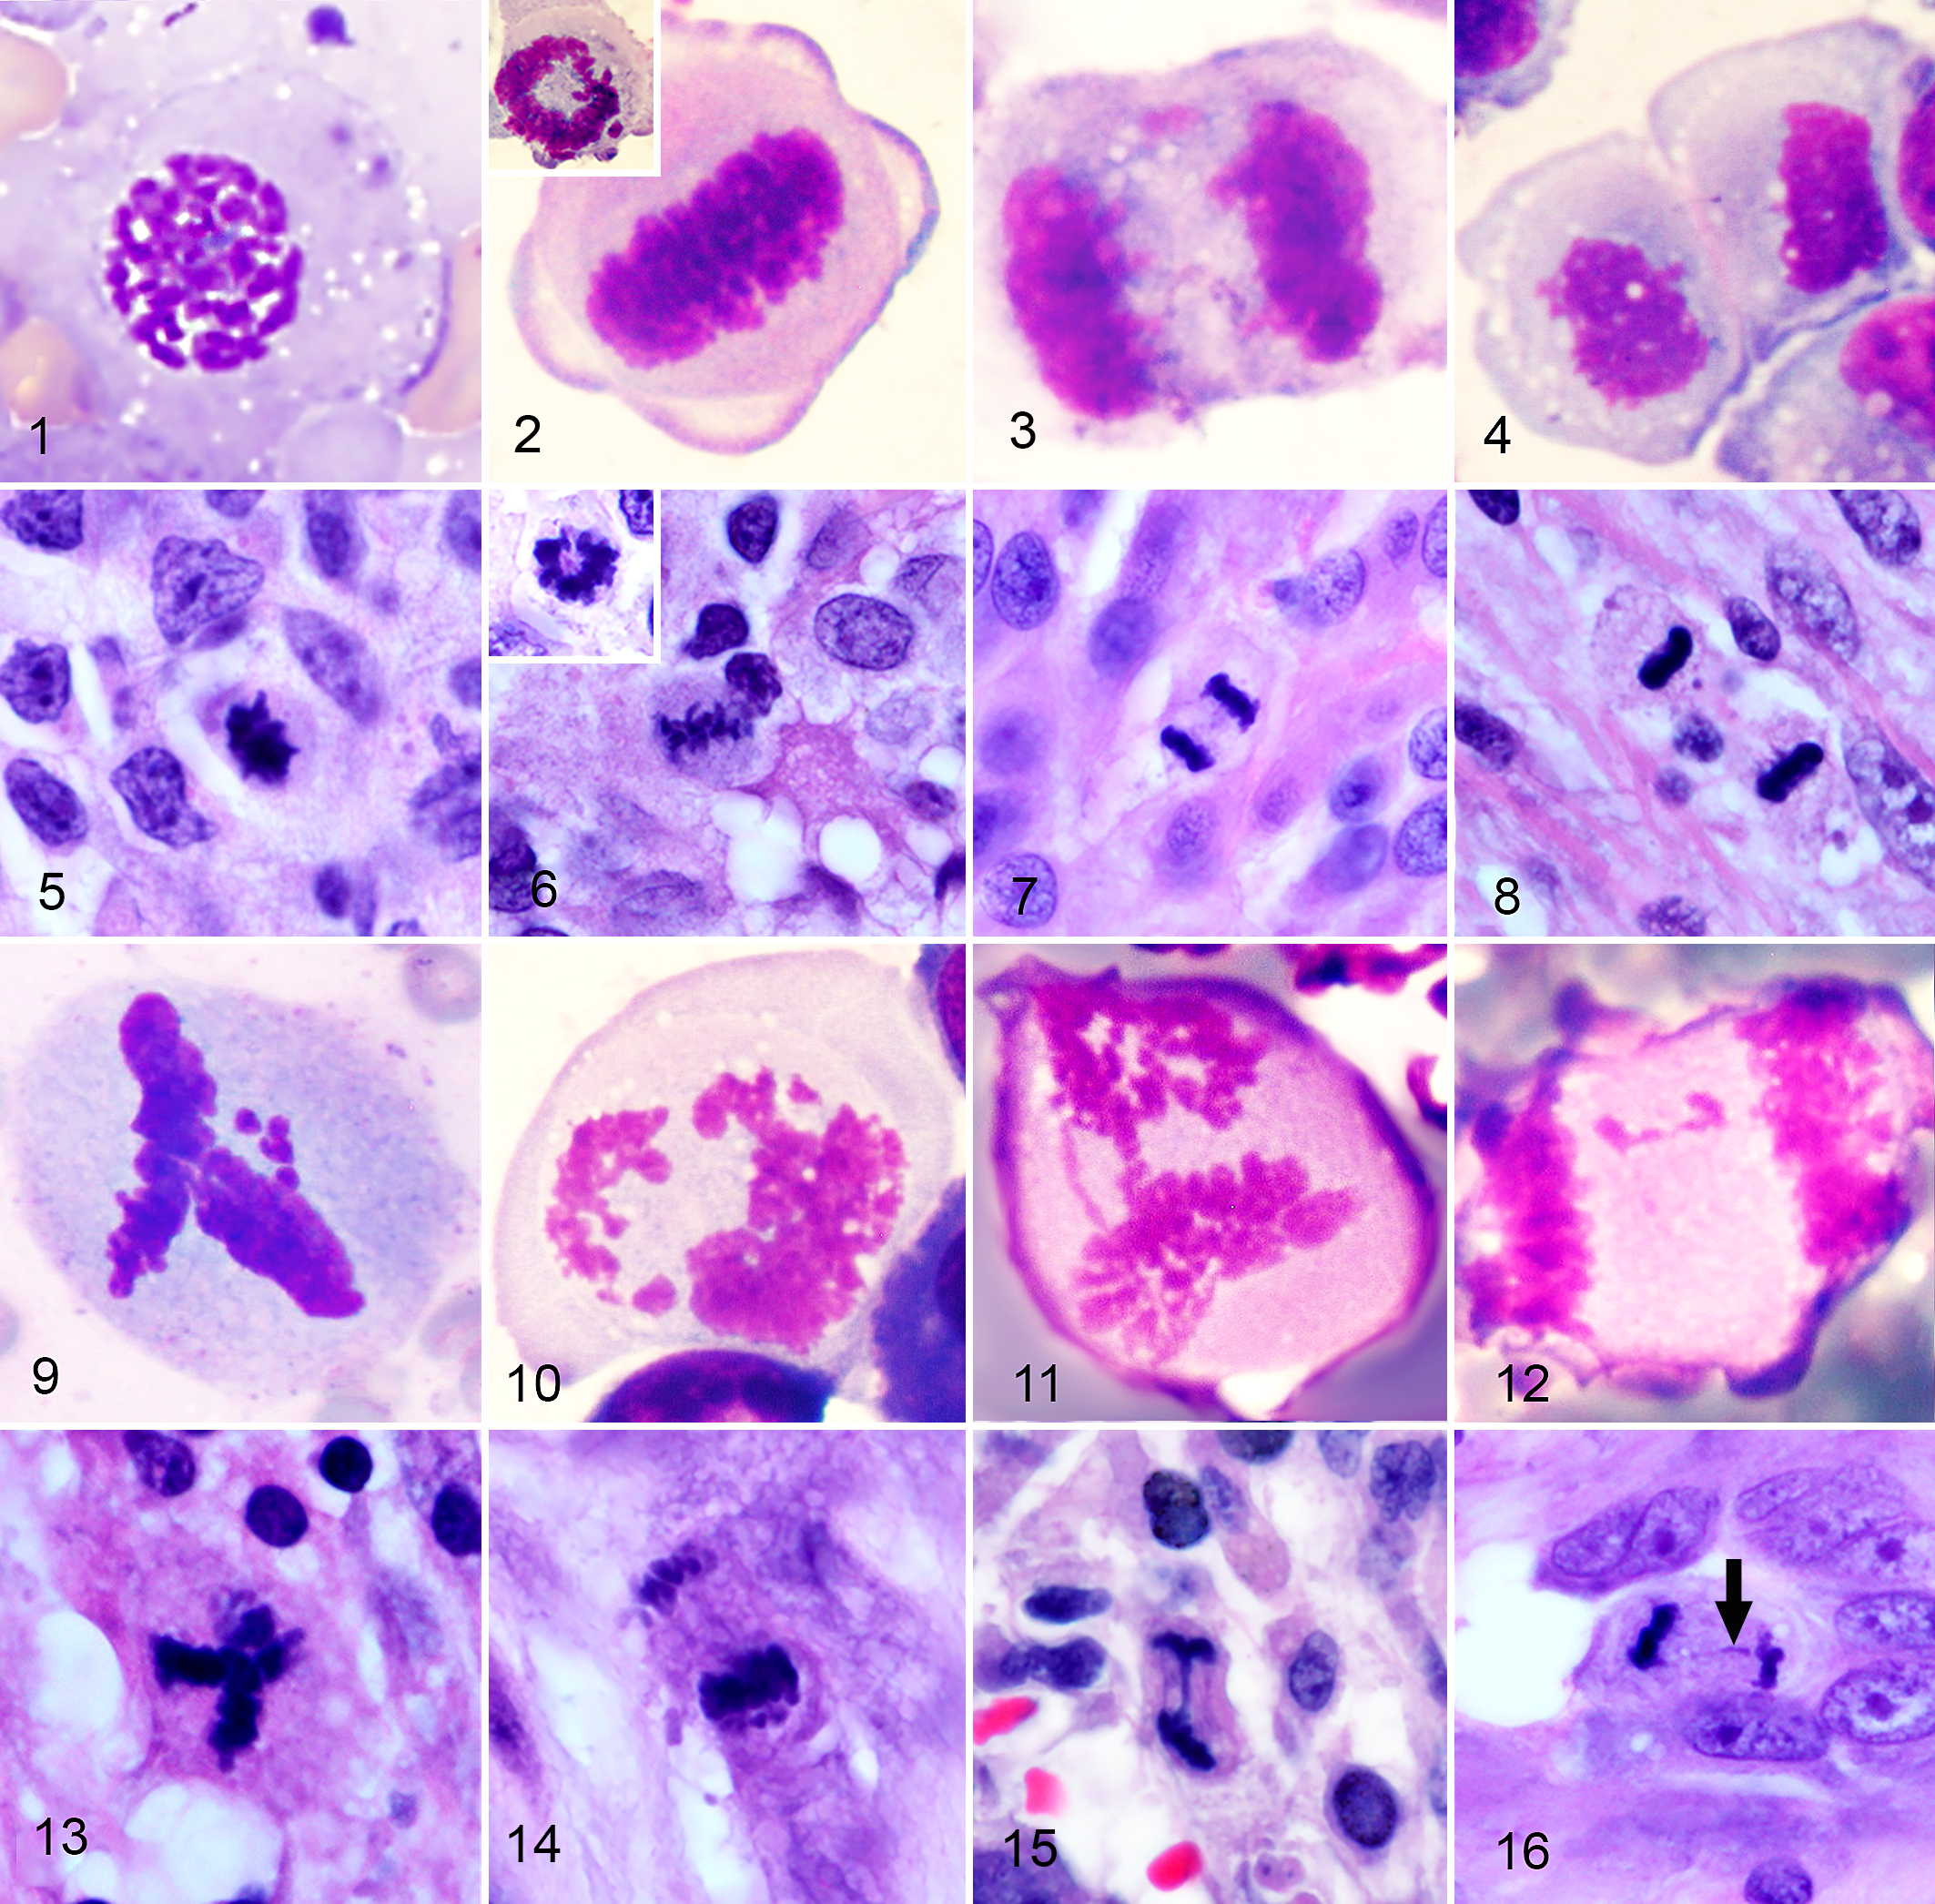
Cytologic appearance (Figs. 1–4 and 9–12; Romanowsky) and histologic appearance (Figs. 5–8 and 13–16; hematoxylin and eosin) of mitotic figures (MF) from various canine tumors.
Prometaphase and Metaphase
Prometaphase is characterized by a dark cluster of chromosomes with visibly protruding chromosome rods and spikes. During late prometaphase, the chromosomes are briefly arranged into a single, wreath-shaped ring known as the chromosome rosette. 46 Metaphase is denoted by alignment of the chromosomes at the “equator” and can be visualized in histologic and cytologic samples as a linear plate, band or ring shape. 17,21,42 This dark cluster has rods or spikes of chromosomes projecting from the surface that are seen easily with light microscopy at 400× final magnification and which are the most definitive way to identify MF and distinguish them from MLF (Figs. 2, 6). MLF such as apoptotic nuclei consist of a homogenous mass of degraded DNA with a smooth outer contour (Figs. 18, 19, 20, 21, 22, 24–26). 34
Histologic appearance of mitotic figures (MF), atypical mitotic figures (AMF), and mitotic-like figures (MLF) from various canine tumors. Hematoxylin and eosin.
This contour of smooth vs irregular surfaces with short spikes should be used by pathologists to aid identification of MF with manual (glass slides, WSI) and CPATH approaches. Depending on the orientation of the cell, these stacks of chromosomes appear either perpendicular or parallel to the spindle apparatus, which alters their appearance in histologic sections. 58 If the metaphase plate is perpendicular to the spindle, the dark aggregate of chromosomes is linear with projecting spikes (Figs. 2, 6, 53). If metaphase is viewed as “head on” or parallel to the spindle apparatus, the dark cluster of chromosomes has a circular ring shape and is referred to as “starburst” or “rosette,” which has been incorrectly interpreted as AMF (insets, Figs. 2, 6, Fig. 54). 58
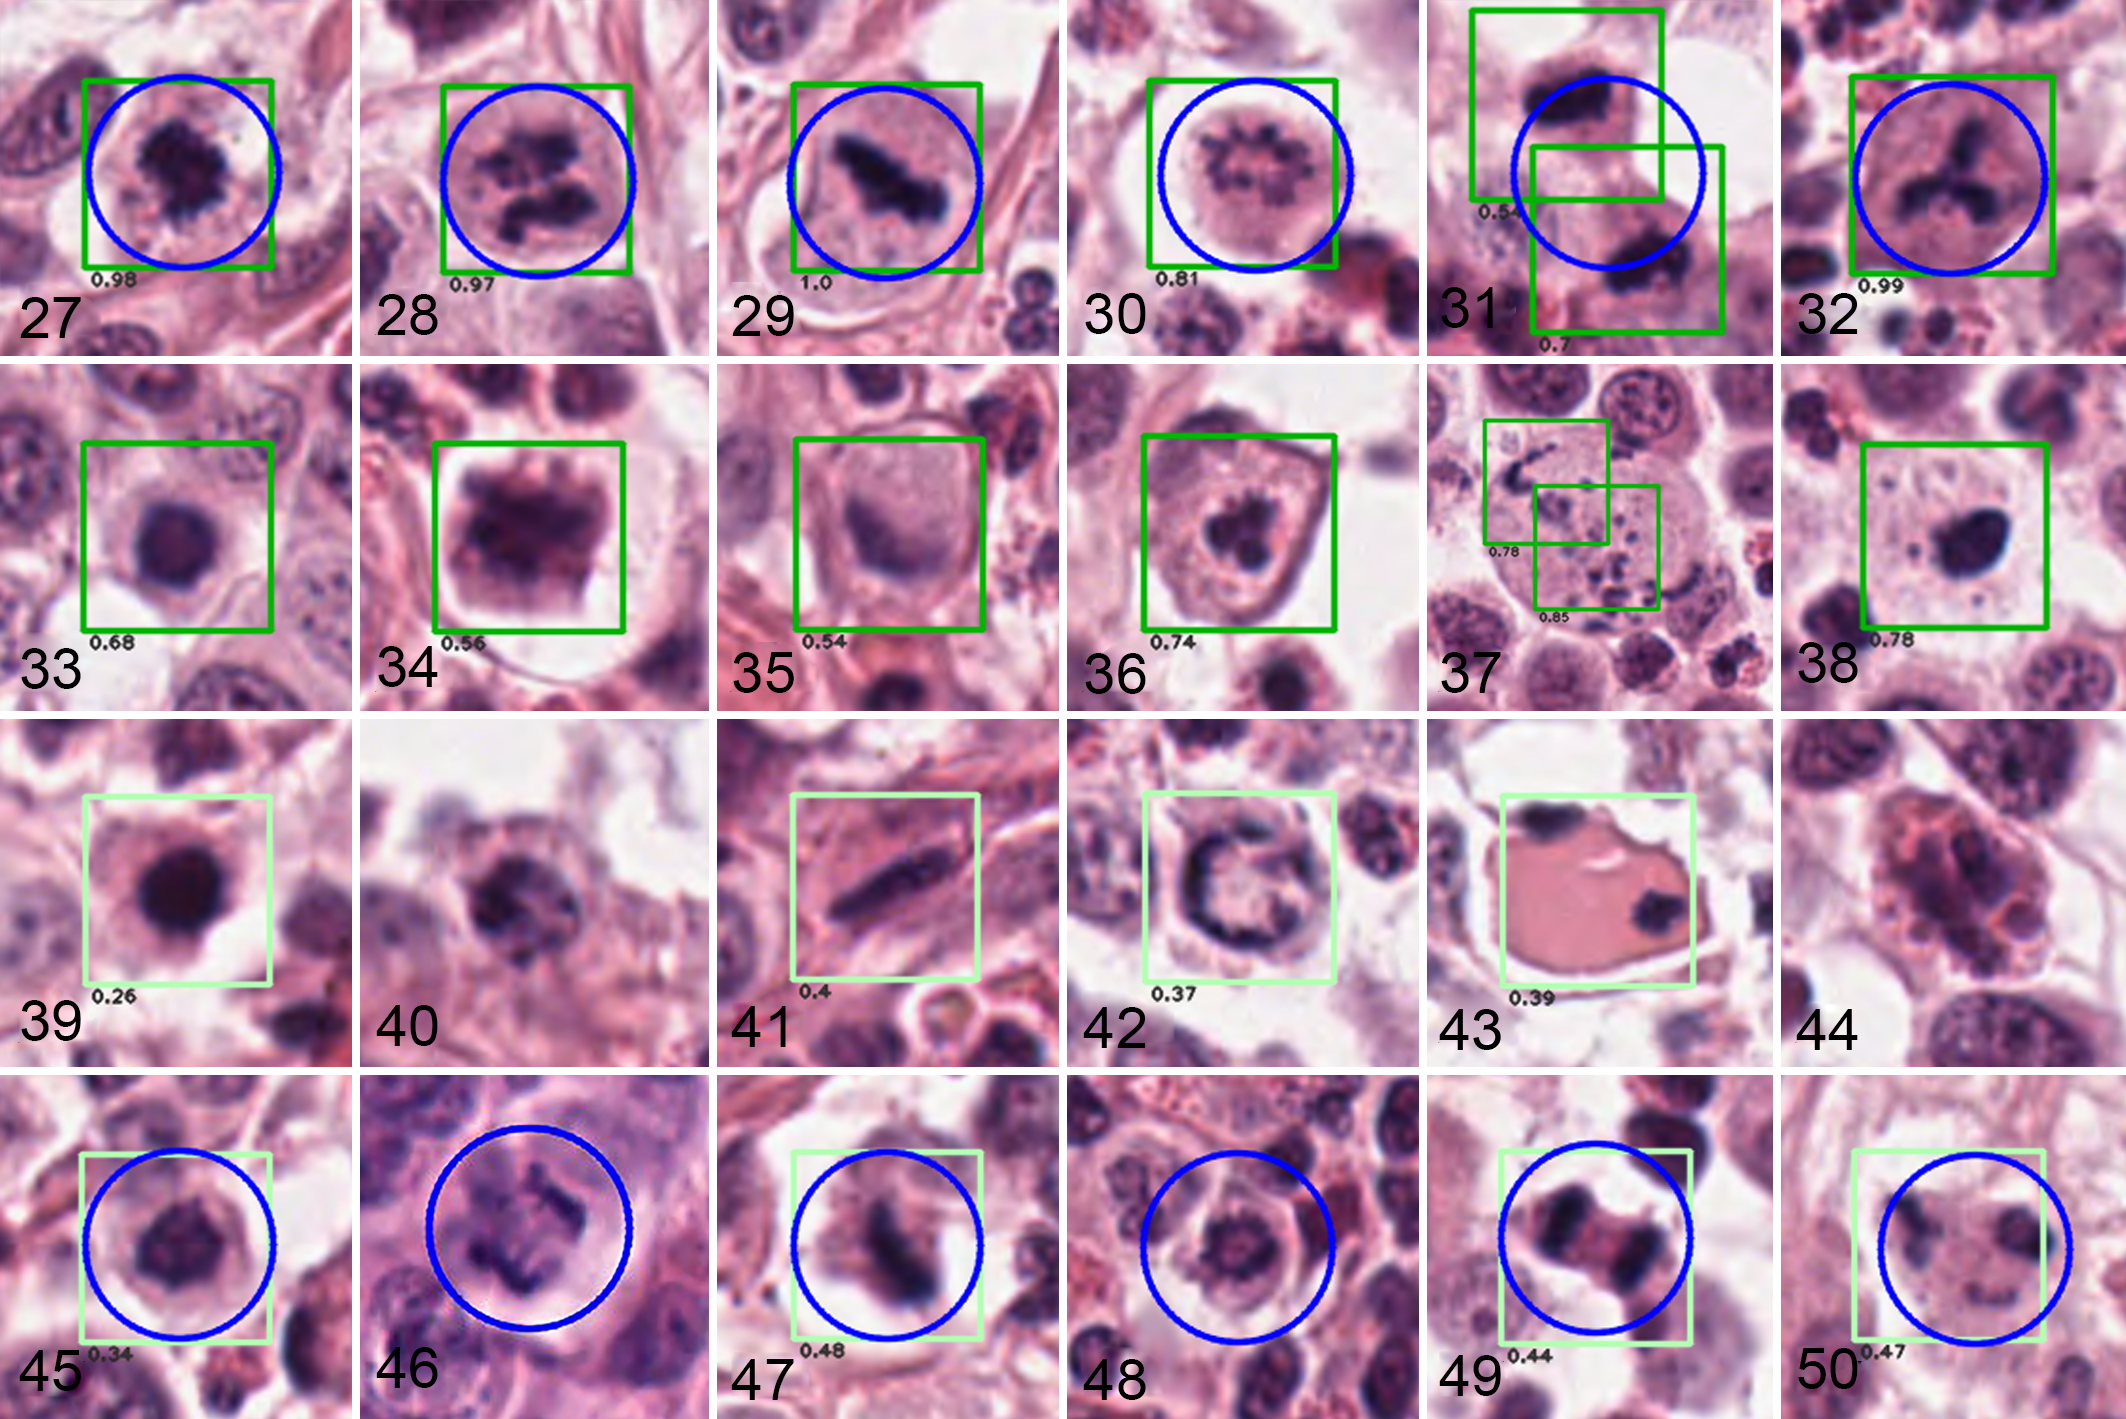
Detection and classification results of a dual-stage deep learning-based algorithm for mitotic figures in digital images of canine cutaneous mast cell tumors.
7
Detections (first stage) are labeled by boxes. Classification (second stage) into MF or MLF is indicated by color: Numbers below the boxes (model scores) as well as colors of the boxes indicate how likely a structure is interpreted to be MF (dark green, score ≥0.5, Figs. 27–38) or MLF (light green, score <0.5, Figs. 39–50). The pathologist-defined ground truth labels (MF, as defined by 5 board-certified veterinary pathologists) are indicated by blue circles. Undetected structures do not have boxes. Figures are obtained from WSI (resolution 0.25 µm per pixel or approximately 400× magnification).
Anaphase
Anaphase, also seen easily in histologic and cytologic preparations, occurs when the single plate or ring of chromosomes from metaphase splits into 2 equal clusters of sister chromosomes. Each cluster separates and is pulled apart along the microtubules of the spindle apparatus 17,21,50,58 (Figs. 3, 7). The 2 clusters of chromosomes will be variable distances from one another until they reach the opposite ends of the cell. It is important to note that there is a continuum between anaphase and telophase as the chromosome clusters reach the ends of the cell. These differences (distance between chromosome clusters) are relatively inconsequential for the pathologist but may have importance for CPATH applications when delineating phases of mitosis or counting the clusters as 1 or 2 MF.
Telophase
Telophase is characterized by movement of 2 chromosome clusters to opposite ends of the cell, formation of cleavage furrows (separation of the 2 daughter cells) and nuclear envelopes, and the emergence of nucleoli 50,58 (Figs. 4, 8). Formation of the nuclear membranes and nucleoli cannot be seen consistently with histopathology or cytopathology in glass slides or WSI (Figs. 4, 8, 31). In some cases, cells in telophase may be connected by a thin strand of cytoplasm, which may or may not be in a plane visible to the pathologist (examples in Supplemental Figures S49, S54, S55). Cytokinesis is the physical separation of cytoplasmic components into 2 daughter cells and occurs after telophase. The lack of cytokinesis can produce multinucleate cells. 21
Consensus of MF Morphology
If a pathologist is confident that a structure represents a MF or an AMF, it is counted regardless of the exact phase of mitosis or type of AMF. Fortunately for pathologists, it is not required that the normal or atypical phases of mitosis are specifically identified (or agreed upon!) in order to obtain a MC. However, the characteristics of and therefore the differentiation between MF, AMF, and MLF are important so that use of microscopes, WSI, and CPATH provide the same MC. If the morphologic criteria for these structures are adhered to as described above, highly reproducible MF identification is possible. Herein, we provide expert consensus on aspects that have been performed inconsistently in previous studies and require standardization.
Prophase
In order to provide consensus on the identification of MF, the authors reviewed hundreds of photomicrographs of potential prophase MF in different tumor types. Most structures were MF with a circular cluster of chromatin and inconspicuous rods suggestive of late prophase, prometaphase, or a transition between prometaphase and metaphase 8,34,46,57 –59 (Figs. 5, 18). Other examples had a clear space within the central nuclear aggregate which likely represents a nonperpendicular view of the prometaphase/metaphase plate (rosette, starburst; 58 Figs. 2, 6, 54). Some structures displayed a condensed, round basophilic nucleus which could not be reliably differentiated from a pyknotic nucleus, autolyzed nucleus, or other types of MLF (Figs. 18, 20, 21, 33, 39). Due to discrepancies in how pathologists interpret prophase, Meyer et al recommended that prophase be excluded from mitotic counts performed for grading of human breast cancer, and the authors of the current manuscript agree with this recommendation. 45 These images and comments exemplify the fact that there will be structures that must be interpreted carefully. Fine focusing and examination of the immediately adjacent tissue may influence interpretation. For example, if the doubtful structure is close to an area of necrosis, MLF may be a more correct interpretation. If the structure in question were close to a “hot spot” (area of high mitotic activity within a tumor) and there is good tissue preservation, then a MF may be more likely. The final interpretation when using adjacent tissues is an example of contextual reasoning, which is an area of development in CPATH. The problems posed by attempting to accurately identify early stages of prophase warrant restricting MF enumeration to the stages of mitosis which can be reliably distinguished on the basis of identification of chromosome clusters with short rods/spikes. These include prometaphase, metaphase, anaphase, and telophase (Table 1).
Figure 5 is our best attempt at finding an example of prometaphase in histologic sections, with additional examples in Table 1 and Supplemental Figures S1–S16. Despite reviewing hundreds of examples of MF in histologic sections and images, we could not find a suitable histologic image to represent prophase. MF previously characterized as prophase are likely to be more accurately identified as prometaphase or MLF.
Early studies recommended that the MC includes only MF at the metaphase stage or later (ie, definitive MF), presumably due to the difficulty of recognizing prophase MF. 43,59 Given the paucity of information on confirming early to mid-prophase in histologic sections, future studies may reveal an alternate method of recognizing prophase. For example, immunohistochemistry (IHC) for the phosphorylated form of histone 3 (PHH3) is considered to be a reliable marker of mitosis and allows differentiation of MF from MLF. 4,9,55 This immunohistochemical marker is present from early prophase to telophase and must highlight a visible MF in order to be counted as positive. 4 The increased contrast facilitates detection and thus may further aid pathologists and CPATH in recognizing MF, 9,55 but it would have to be correlated with outcome assessments in order to determine if the resulting data are predictive of tumor behavior.
Telophase
Telophase MF should be counted as one MF (Table 1, Figs. 4, 8, 31, Supplemental Figures S45–S56). Although it was originally recommended to count the 2 chromosome clusters of telophase as 2 separate MF, 59 we propose to count the 2 chromosome aggregates of telophase as a single MF. The original intent of counting telophase as 2 MF was to correlate manual counts with those made by future automated systems, as exemplified in Figure 31. However, CPATH systems can be trained to recognize a telophase figure as a single MF and this should represent the standard for telophase enumeration. A pathologist can look for cleavage between the 2 aggregates, and how close these aggregates are to one another, and thereby deduce that they were derived from one cell (ie, one MF). Alternatively, a pathologist may assess the 2 chromosome clusters as dissimilar and too far apart to be from the same MF, therefore counting them as two, perhaps both in metaphase. Rarely, cells in telophase appear to have undergone cytokinesis (although they may be still attached in a plane not visible to the pathologist). If these MF arise from one cell, they should be counted as one. We propose that the cell borders be a minimum distance of at least one tumor cell width apart (therefore the center of the cells are at least 2 tumor cell widths apart) in order to count 2 MF. Distances less than one tumor cell width apart should be counted as 1 MF, even if a clear connection between cells cannot be appreciated for reasons stated above. CPATH can produce similar results if the initial training and ongoing validation process adheres to these morphologic definitions for telophase. CPATH programs may use color (or color depth), shape (morphology), surface irregularities (texture), intensity (darkness), size, distance between clusters (µm or pixels), or other unknown characteristics (“black box”) 1,63 to determine if a structure represents a MF and if it is 1 or 2 MF. In a computer-assisted approach for obtaining MCs, the pathologist can modify the pixel size or diameter of the annotation, review candidate MF, and discard doubtful structures.
Morphologies of AMF in Histology and Cytology
Chromosome segregation errors during cell division can cause genetic abnormalities in neoplastic cells. 24,30 These abnormalities can be observed morphologically as AMF and include 2 broad categories: (1) mitotic/polar asymmetry and (2) abnormal segregation of chromosomes. More complex aberrations are derived from combinations of these categories. 30
AMF in cytologic preparations were described by Tvedten as a reference for veterinary clinical pathologists to improve accuracy and consistency in identification and classification of AMF (Figs. 9–12). 58 These abnormalities are also appreciated in histologic preparations but can be less obvious due to lower magnification and greater thickness of preparations. Cytologic samples are often evaluated with oil immersion at 1000× magnification, while histopathology samples are thin slices (3–6 µm thickness) of a formalin-fixed, paraffin-embedded block and are typically evaluated or scanned at 200× to 400× magnification. Compare the similar AMF in cytologic preparations (Figs. 9–12) and histologic preparations (Figs. 13–16). For instance, Figure 11 is clearly anaphase but the separation is not distinct and there are chromosomes bridging from one cluster to the other. These features are easier to see in the cytologic preparation but are not as well visualized histologically (see Fig. 15, interpreted as anaphase bridging). In Figure 12, lagging chromosomes can be easily seen in the center of the cell in the cytologic preparation. This is less conspicuous in the histologic preparation, appearing as a small, thin purple streak in the center of the cell (Fig. 16, interpreted as lagging chromosomes). Nonetheless, AMF are readily identifiable in histologic sections and if possible, should be classified according to the morphologic features described herein.
AMF With Mitotic/Polar Asymmetry
Abnormalities of mitotic/polar symmetry are composed of multipolar MF and asymmetrical bipolar MF. 30 Multipolar MF (frequently tripolar MF) are defined by the presence of more than 2 spindle poles during any stage of mitosis, 30 resulting in movement of the chromosomal content in three or more directions at anaphase. This abnormality is easily appreciable from metaphase through telophase (Figs. 9, 13, 17, 32, 50 Supplemental Figures S57-S59, S62, S64, S65, S67). If these cells survive through anaphase, the daughter cells are likely to contain different numbers of chromosomes as compared to the mother cell due to random redistribution. 30,36 Toxins that affect the mitotic spindle have been shown to create tripolar mitoses, but it is unclear whether multipolar mitoses are the cause or consequence of cancer. 36
Asymmetrical bipolar MF are described as unequal sizes of the metaphase axes or anaphase poles 30 (Figs. 10, 14). Oblique sectioning artifacts in normal or multipolar cells can sometimes artifactually create the appearance of asymmetry. 30
AMF With Abnormalities of Chromosome Segregation
The second broad category, abnormalities of chromosome segregation include anaphase bridging, lagging chromosomes, and lagging chromosome fragments. 30 Anaphase bridges are defined as the stretching of chromosomes connecting one anaphase pole cluster to the other 30 (Figs. 11, 15). Lagging chromosomes or chromosome fragments are left behind the other chromosomes at anaphase and telophase, but there is no standard criterion for this distance (Figs. 9, 12, 16). Differentiation between a lagging chromosome and a chromosome fragment is difficult or impossible in histologic samples. Chromosome lagging has been associated with multiple abnormalities in cellular signaling systems. 30 Chromosome segregation disorders have been linked to chromosomal instability and telomere dysfunction in some human cancers, which contributes to carcinogenesis via genomic alterations including oncogene amplification and tumor suppressor gene deletion. 35
Significance of AMF
AMF have been correlated with poorer prognosis and outcome for some tumors in humans. 35,36,41,47 In those studies, AMF included MF with multipolarity, lagging chromosomes, ring morphology, asymmetry, and anaphase bridging. In the authors’ opinion, ring MF should not be included in the category of AMF as they are more likely to reflect a prometaphase/metaphase rosette in which the chromosomes are seen parallel to the spindle 58 (Figs. 2, 6 inset, Fig. 54). Future studies that have accurate and robust outcome assessments should consider evaluating if AMF counts and types of AMF have any prognostic significance for tumors of veterinary patients. Enumerating AMF will be possible but carefully identifying the specific types of AMF may require evaluation at high magnifications (greater than 400×).
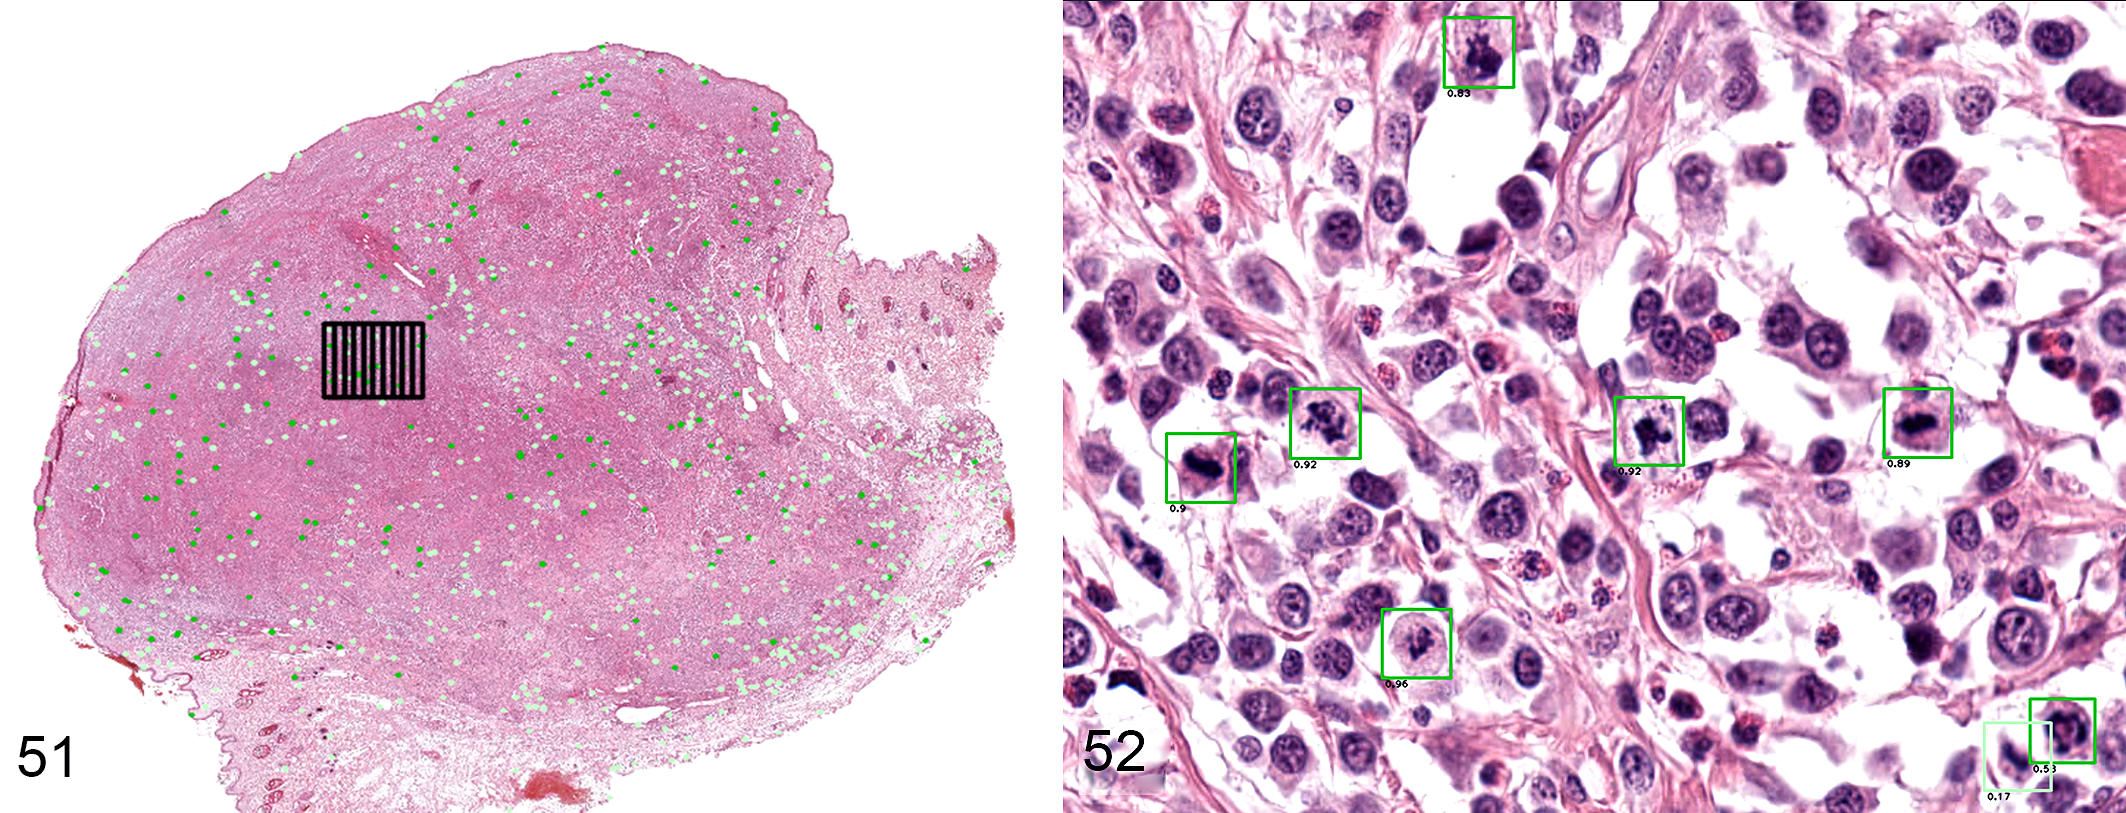
Possible computer-assisted system for determination of mitotic count in whole-slide images of canine cutaneous mast cell tumors.
7
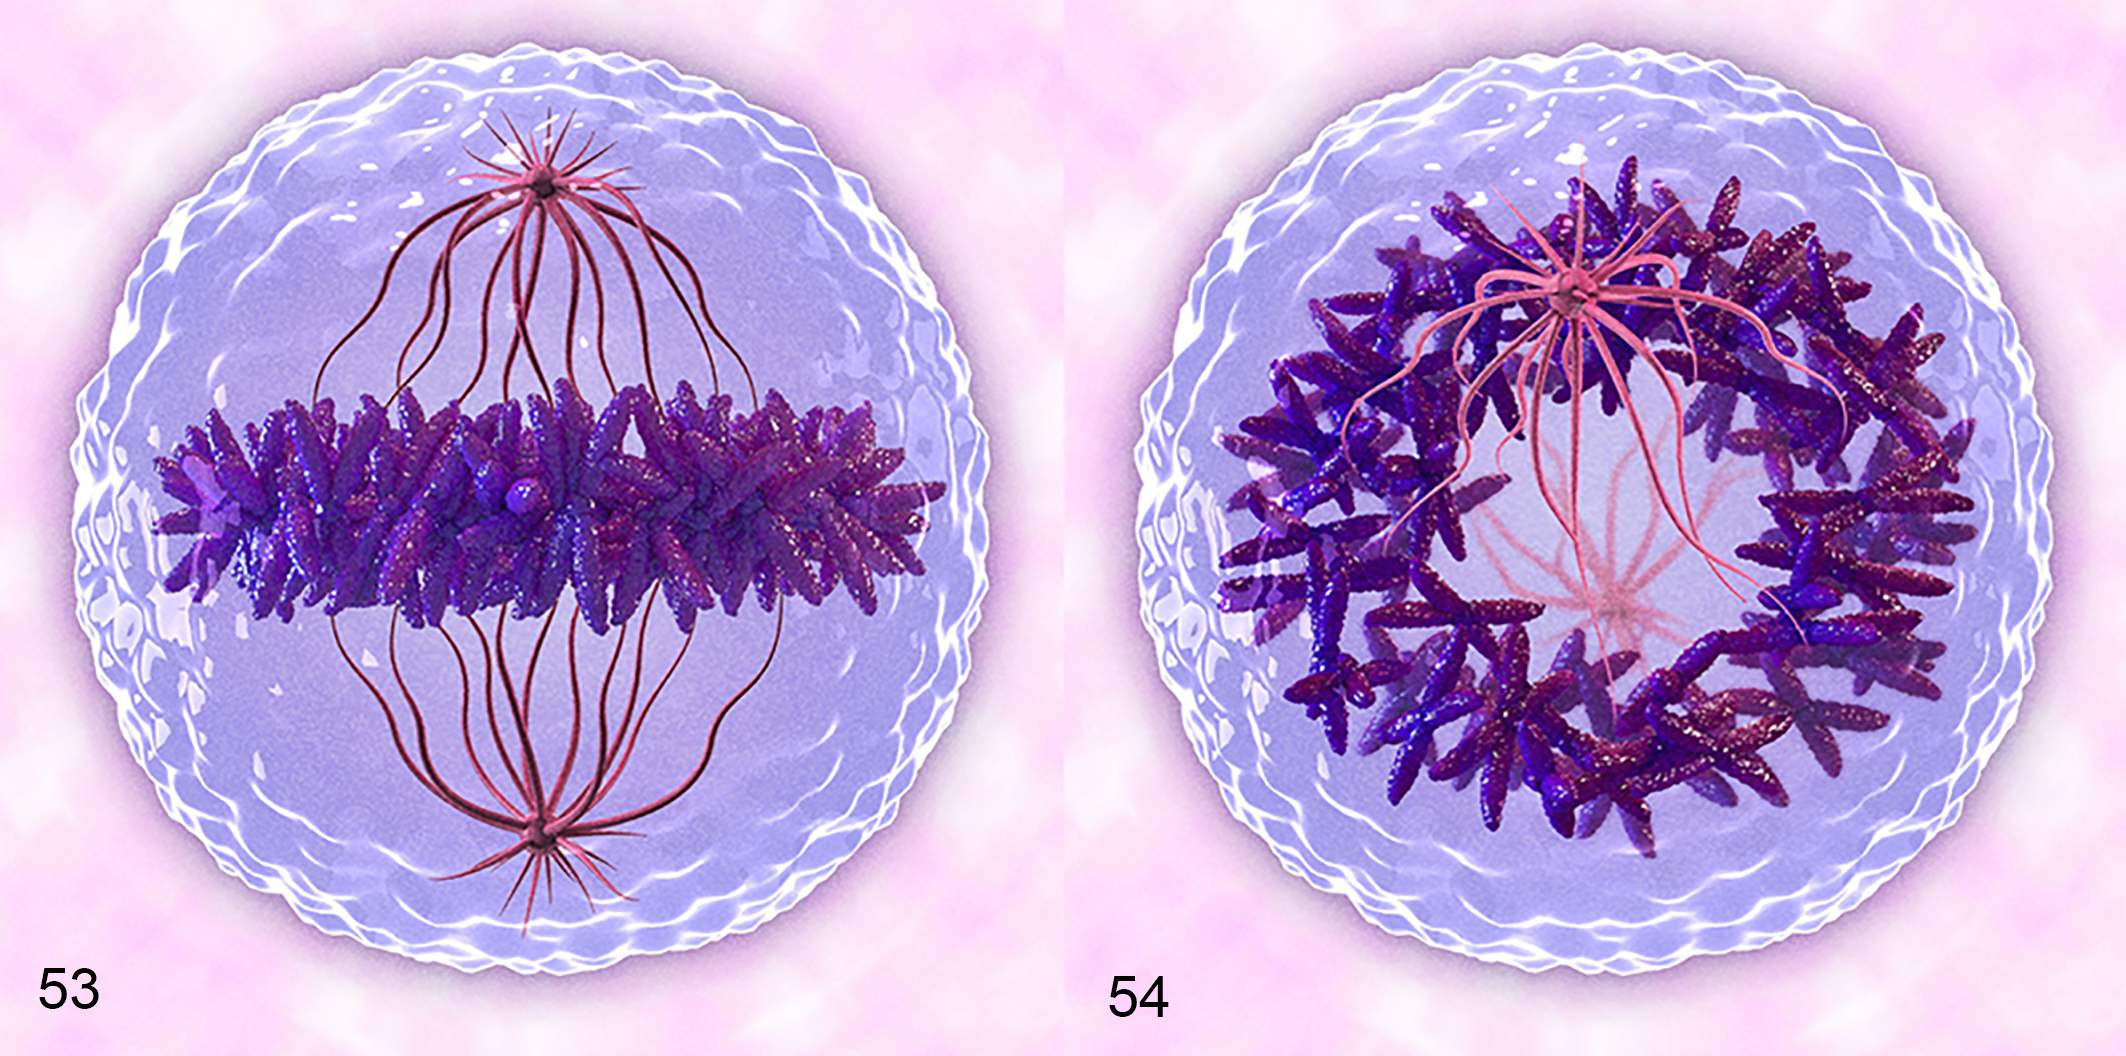
Three-dimensional representation of a cell undergoing mitosis at metaphase.
Mitotic-Like Figures
MLF are structures or processes that appear similar to MF, and include apoptotic bodies, hyperchromatic nuclei, deformed nuclei, karyorrhectic debris, inflammatory cells, and tissue artifacts 3,8 (Figs. 18–26). MLF are characterized by smooth contours and are generally circular or oval and dark (hyperchromatic) bodies that can be single or multiple in an area where a nucleus should be located (Figs. 18–26). Light microscopic criteria useful for identification of MF/AMF and distinguishing them from MLF include the absence of a nuclear membrane, an irregular surface (presence of short rods, spikes or projections), and amphophilic or basophilic cytoplasm. 8
Distinguishing MF and AMF from MLF is one of the most critical and error-prone steps in determining the MC, for both humans and computers. Figures 18 to 26 and Figures 33 to 44 contain examples of MLF (imposter MF), some of which can be difficult to distinguish from MF. Making this distinction requires thorough examination via fine focusing, and more importantly, considering the context of the adjacent tissue around these structures. For example, a structure adjacent to an area of necrosis (with multiple cells undergoing nuclear pyknosis or karyorrhexis) is more likely to be a MLF, whereas a single dark structure with “spikes” on the surface, especially in a region of mitotic activity favors a MF. 3,60,61 Cells undergoing degeneration, necrosis or apoptosis should ideally have an eosinophilic cytoplasm, whereas cells containing MF are expected to have more basophilic cytoplasm; however, exceptions to this rule are numerous and there is variability between different staining protocols. To summarize, 3 helpful features to aid in differentiation of MLF from MF are surface contour, evaluation of the adjacent tissue (i.e., the tissue context), and color of the cytoplasm. MF are incorrectly differentiated from MLF because of a lack of defined criteria or adherence to criteria, proceeding too rapidly, not using high enough magnification, and artifacts due to fixation, staining, and scanning. 3,8,9,62 Each of these can contribute to interpathologist variation in performing the MC. Careful and methodical evaluation is important for accurate classification of these structures. Candidate MF that cannot be reliably distinguished from MLF at high magnification (400× or higher) in a reasonable time frame should not be included in the MC.
It is inevitable that cells or structures may be difficult to classify when subjectively assessing biological specimens. This contention is well captured in a quotation by Dr Irwin Leav, “One man’s protozoan is another man’s necrotic nucleus.” Minimizing interpathologist (and intrapathologist) variation is important in reducing the frequency of false positives and false negatives. To mitigate these variables, only definitive MF and AMF should be enumerated as part of the MC and doubtful structures should not be included.
Factors That Affect MF Identification and the MC
Slide Preparation
MF may appear differently based on multiple factors involved in slide preparation, including staining technique, thickness of the section, and type of preparation being evaluated by the pathologist (glass slide or digitally scanned WSI). 8,11,13,14,61,62 In cytologic preparations, the whole cell is visible in one focal plane. However, in histologic preparations the cells have been transected and only a portion of a MF may be seen, which can interfere with recognition. Distinguishing MF from MLF is thus easier with cytologic preparations than histologic sections or WSI due to the ability to appreciate greater cellular detail at 1000× magnification and the ability to evaluate the whole cell. Enumerating MF has become a part of grading dermal mast cell tumors cytologically. 19,33,52
Cytoplasmic basophilia or eosinophilia should be used carefully to differentiate MF versus MLF as variation in staining methods between laboratories can produce color changes in tissue sections. Eosinophilic cytoplasm may suggest necrotic cells because of denatured cytoplasmic proteins and loss of mRNA (Figs. 18, 24, 43). 56 However, variations in the concentrations of eosin and hematoxylin can affect these colors as can quality of fixation. Examples are provided of MF, AMF, and MLF with eosinophilic cytoplasm (Figs. 13, 18, 21, 24, 25 26, 43) and with amphophilic cytoplasm (Figs. 5, 8, 16, 17, 20). Amphophilia and basophilia are expected with increased mRNA on ribosomes of neoplastic or young cells.
Fixation Delay
Fixation delay has been reported to correlate with changes to the MC; however, studies have reached different conclusions and the significance is not clear. 9,10,23,25,38,49 In larger tissues that have not undergone complete formalin fixation, cells remain capable of proliferation and can progress through the phases of mitosis until the tissues are fixed or cells exhaust their energy reserves, thereby artifactually increasing the numbers of observable MF. 25,38,49 One study comparing resected breast carcinomas to incisional biopsies of the same tumors found an increase in MF of up to 3-fold in the samples from the resected breast. This difference was so great that it resulted in increased tumor grades in approximately 25% of carcinomas, thus having an effect on prognosis and treatment plan. 38 This phenomenon has also been reported to occur in samples obtained from a canine hepatocellular adenoma. Fixation delay within a needle biopsy resulted in substantially increased numbers of mitotic figures as compared to the resected neoplasm that was immediately placed in formalin. 49 Alternatively, decreased numbers of MF was caused by reduced tissue quality from delayed fixation which led to an inability to differentiate between MF and MLF. 23,25 Other studies have shown no appreciable influence of fixation delay on the MC. 10,23,25 At this time, there is no consistent correlation between fixation delay and MC.
MF Identification in Whole-Slide Images (WSI)
Pros and Cons of WSI for MF Detection
WSI are widely used for histologic diagnoses and teaching in both veterinary and human pathology. WSI permits remote primary diagnosis, ergonomic benefits, economic advantages, annotation of structures, accurate measurement of areas/fields of interest (such as 2.37 mm2), and application of CPATH methodology. 14 Additionally, duplicate counting of structures or fields is prevented, and doubtful structures can be reviewed with distant colleagues. Assessment of MF, AMF, and MLF in WSI poses some challenges due to the lack of fine focus capability and limited image resolution in routinely scanned images. Although multiple focal planes (z axis) can be captured to simulate fine focusing, and high scanning magnification is technically possible, the scan time and storage space required is impractical in the current typical diagnostic setting. 3,11,13,14,54,61,64
WSI Validation for Diagnosis and MC
There is generally good agreement between WSI and light microscopy (LM) with regard to cytologic and histologic diagnosis and MC in animal and human tumors. 2,3,13,16,18,29,32,48,53,64 A better correlation was observed in cases with higher MCs as compared to those with lower MCs. 3 Some studies reported a trend toward underestimating the MC with WSI as compared to LM and attributed this to difficulty of identifying MF via WSI. 3,32,53 Grade assignments via LM or WSI has not yielded consistent results. 13,32,54 One study found that the modality used (LM vs WSI) did not have significant effects on tumor grading derived from the MC for breast cancer in humans, 3 while another study found that the grades obtained by using MC derived from WSI versus LM were different for sarcomas and neuroendocrine tumors in humans. 32 Grading canine cutaneous MCT with a 2-tier system using WSI was inferior as compared to LM; however, pathologists lacked long-term experience with WSI. 13
Counting MF with WSI as compared to LM has been reported to be more time consuming 3,32 ; however, as with any new task, this time factor eventually becomes negligible. Software modifications including grid applications (Figure 51), computerized preselection of regions with high mitotic activity, more efficient annotation, and field of view auto-sizing may further reduce the time required for obtaining the MC with WSI. 3,11,62 The diagonal size and resolution of the monitor, as well as the on-screen magnification at which the images are evaluated, influences how many screen areas must be counted in order to obtain a MC. 13,44 Comparisons of digital and microscopic high-power field areas revealed significant variations between different display resolutions and monitor sizes with minimal differences between WSI viewers and no differences between scanners. 37 Standardization of minimum monitor size, resolution, and use of standard color calibration may further reduce variability between pathologists when counting MF with WSI. 37,64
Limited resolution of the WSI does not seem to influence the overall MC significantly. Most studies comparing LM and WSI obtained MC using 400× magnification images (image resolution: 0.25 μm/pixel). 3,13,32,64 For MCs obtained from canine melanomas, WSI at 400× or 200× magnification had similar inter- and intraobserver concordance with one another and with LM. 64 Based on published information as well as personal experiences among the authors, diagnostic evaluation and MC can be readily performed with WSI.
Classifying Individual MF With WSI
Comparisons between WSI and LM in terms of identifying individual structures (including MF) has revealed conflicting results. 54,61 Comparing the ability to identify or classify individual structures as MF or MLF with LM and WSI is technically challenging. 54,61 Tabata et al 54 used a light microscope mounted with a camera and specific software to compare LM to WSI from 4 different scanners. Inter- and intraobserver agreement was substantial for all scanners; however, accuracy of MF identification compared to the pathologist-derived ground truth was significantly lower with WSI in 3 of the 4 scanners. WSI yielded lower numbers of MF compared to LM. In a study of human breast cancer that analyzed object-level interobserver agreement of MF classification using WSI, disagreements between pathologists occurred more frequently with smaller objects (average length of 8.7 μm). 61 This trend was attributed to difficulties in spotting these smaller objects during scanning and more difficulty in appreciating distinguishing features like protruding chromosome rods or spikes in smaller objects. 61 In order to counteract this limitation, using a minimum size for acceptance of candidate structures as MF may improve reproducibility, but would vary between tumor types. 59,61 Structures that are difficult to identify with LM will likely remain difficult to identify with WSI.
The Future: CPATH Recognition of MF, AMF, and MLF
CPATH is defined by the Digital Pathology Association as a “big-data” approach to pathology, in which a combination of image data and meta-data are used to develop digital and automatic analysis of features and patterns in WSI. 1 Machine learning and, more recently, deep learning (a subset of machine learning) are examples of artificial intelligence (AI) that encompass computational techniques and are key elements of CPATH. 1 Machine learning employs the relationship between input data (in the case of WSI, data from pixels that form the scanned image and patterns extracted from the image), and desired output information (such as an image label or detection of objects and shapes within the image).
Reasons to Use CPATH for MF Identification
Imperfect interobserver and intraobserver reproducibility when obtaining the MC can result from (1) difficulty of differentiating MF from MLF (human error); (2) an inability to efficiently locate the region of highest mitotic density; and (3) impaired reproducibility of MF identification or classification while performing repetitive tasks. 7,11,13,20,22,27,28,34,35,40,45,51,57,65 With sufficient numbers of images, humans, and computer programs can be “trained” to differentiate MF, AMF, and MLF. Algorithms can assess the entire slide or several slides within a short period of time, are 100% reproducible, and (with good data sets and deep learning methods) they can be as accurate as pathologists. Therefore, it can be hypothesized that an indefatigable, fully reproducible computer algorithm may be a viable potential alternative or complementary method for identifying MF when performing the MC in histologic samples.
Recent CPATH Progress in Veterinary and Human Pathology
Recent progress in methods for the training of algorithms using big data may now open the possibility of using CPATH for automatically determining the MC in routine veterinary diagnostics. However, it is in the early stages of consideration in veterinary medicine 5 –7,12 and still requires further research and validation before being incorporated into conventional diagnostic services. CPATH approaches have been applied to automate MC calculation in digital images in order to compensate for human shortcomings and will likely increase pathologists’ efficiency, reproducibility, and accuracy. Current groundbreaking results of CPATH for MF identification have been achieved with convolutional neuronal networks (CNN; a type of deep neural network), which function autonomously to identify MF in digital histologic images. These networks consist of multiple layers of artificial neurons that are connected in a complex way. Through pathologist-defined labels that act as “ground truth” (eg, MF or not MF), the CNN autonomously extracts discriminative features from the images during supervised training of deep learning-based algorithms to produce user-desired outputs. During this learning process, the connections are modified with supervised cycles of positive and negative feedback input based on “correct” or “incorrect” as compared to the ground truth. The computer “sees” images differently from a human and has complex decision-making criteria (autonomous analytic and approach pathways), which are commonly too complicated to be understood by algorithm developers (the so-called “black box”). In some cases, the methods to better understand output information, such as visualization of a detected pattern, can be used in which case the black box becomes a “glass box.” 1 An analogy would be the comparison of decision making between an experienced pathologist and a trainee. The experienced pathologist may process the image, slide, or case by rapidly incorporating several steps simultaneously in order to make a diagnosis. When this decision tree is not explainable to the trainee, this is analogous to a “black box.” Alternatively, when the steps are able to be broken down and explained, this is analogous to a “glass box.” Deep learning methods, such as CNNs, have only recently become available due to the high computing capacity and large data sets required. 5,6,12,15,60,62 These data sets contain numerous images (WSI or parts thereof) and thousands to tens of thousands of labels which include structures to be detected (MF) and structures that should not be detected (MLF). The latter (structures that should not be detected) are not required, but may aid algorithm performance. 5,6,12,15,60,62
Publicly available data sets of MF from human and animal tumors have tremendously fostered the development of deep learning methods. 12,15,63 Bertram and colleagues published a large-scale data set which contains an unprecedented 44 880 annotated MF and 27 965 annotated MLF (hard negatives) in canine mast cell tumors. 12 A deep learning–based algorithm for automatic MF detection yielded an F1 score of 0.820, indicating high recognition of MF on the test set (a combination of precision and recall, where a value of 1.00 indicates perfect recognition), which is close to the values found for human interobserver variability. 12 Similarly, another data set for canine mammary carcinoma, which included 13 907 annotated MF and 36 379 annotated MLF, 5,15 yielded an F1 score of 0.79 when compared to the ground truth based on a human observer. With this and other current deep learning approaches, algorithms have shown substantial agreement with pathologists. 5,15,61
CPATH Limitations
Major limitations in current CPATH solutions are the lack of “real-life” variability in the training datasets. This leads to a nonrobust algorithm that may perform almost perfectly in the training environment for a specific laboratory, species, and tumor type, but not when applied to other tumor types, species, and images from different laboratories. Variations in staining protocols of tissue sections, slide preparation, or even color representation of different slide scanners can significantly affect the algorithm’s ability to recognize MF versus MLF. 5 The current veterinary pathology laboratory environment lacks global standardization for tissue processing, staining, and slide preparation. 1 This means that application of insular MF algorithms developed under one set of laboratory conditions requires adaptation and validation if introduced to other laboratory conditions. Thus, this variability must be included in the training data sets (composed of thousands or tens of thousands of image labels) to develop robust, globally applicable algorithms for usage in every laboratory.
Lack of standardization for staining was a major difficulty for analysis of breast cancer images. 61,63 Previous studies have attributed many false positives to darkly stained objects without rods or spikes of chromosomes (false positive; MLF) or light-staining nuclei (false negatives). 62,63 Careful definitions and annotation of MF, AMF, and MLF by several independent experts and the availability of numerous example image patches (thousands to tens of thousands) are needed so that the programs can learn and teach themselves how to identify MF, AMF, and MLF. Robustness of algorithms is still an unsolved problem and requires development of large representative data sets from different laboratories, scanners, and cell types. However, if developed carefully, the power of such algorithms to quantitate MC and other parameters may help predict tumor behavior better and faster than pathologists presently can. Standardization of the morphologic criteria of MF and AMF for development of consistent and accurate ground truth data sets is an important part of creating CNN algorithms.
Future Diagnostic Use of CPATH
Due to the availability of advanced deep learning–based pattern recognition pipelines and “big data,” we are now able to develop accurate CPATH software that has the potential to be incorporated into pathologists’ workflow for enumerating MF in diagnostic and research settings. Speed and accuracy of algorithm analysis allows the ability to identify the area of highest mitotic density more accurately than pathologists (Fig. 51). 7 Computer-assisted systems that support the pathologists in these critical decision-making steps are considered promising. Figures 27 to 52 show examples of candidate MF and MLF proposed by CPATH that require verification by a pathologist. For this specific approach, the first stage (object detection) has a high sensitivity in detection of MF candidates but detects high numbers of false positives (MLF). The refining second stage (object classifier) has a higher specificity and is therefore designed to remove the false positive detections. Any computational approach proposed for use in veterinary pathology would need to be tested and validated before widespread use could occur. 12,13 Correlating the results from CPATH analysis with outcome assessments is essential in evaluating the utility of these tools to predict tumor behavior. Higher reproducibility of the MC in combination with CPATH approaches may reveal additional trends of prognostic importance to which we were previously unaware.
Conclusions
The purpose of the MC is to determine an accurate reflection of mitotic activity within a tumor. This article provides morphologic criteria for differentiating MF, AMF, and MLF with recommendations for counting and categorizing MF. Figures 1 to 26 are our best examples of MF, AMF, and MLF. They were selected because they contain definitive diagnostic features used for microscopic identification and should have near-unanimous agreement. However, they are at a higher magnification and resolution than most anatomic pathologists use while working with diagnostic material and many have a cytologic partner image to complement histologic identification. These idealistic examples do not recapitulate a diagnostic setting. We cannot encompass all the variables associated with tissue preservation, staining variability, tissue artifacts, magnification at scanning, or time allocated for slide/image review. Supplemental Figures S1 to S84 are closer to what is experienced in routine identification of MF in diagnostic pathology. Examples of problematic structures, ranges of magnification, and variably stained tissues are included to highlight the difference between publication-quality images and working-level diagnostic material, so that readers can identify candidate structures for themselves and compare their interpretations to ours. Identification of structures taken out of context, as done in this article, is not part of a pathologist’s decision tree. However, it is one conundrum that CPATH will address. There will always be doubtful candidate structures that the pathologist cannot confidently identify. What to do with these structures will likely remain an individual pathologist’s or laboratory’s choice and is difficult to standardize. The most important determination is simple: Should the candidate structure be counted as a MF? Since some structures are difficult to classify and interpathologist variation is inevitable, the most straightforward way to handle these and other confounders is to simply count definitive MF and AMF.
Future studies should evaluate the precision and prognostic utility of restricting the MC to MF which are the most easily identified (metaphase, anaphase, telophase). Should this prove useful, there will be decreased interobserver variation in MCs, increased accuracy of CPATH MF identification, and greater standardization of the MC to compare with outcome assessment. Accurate identification of MF, AMF, and MLF are central elements in each of these components.
Supplemental Material
Supplemental Material, Combined_supplemental_materials-Donovan_et_al - Mitotic Figures—Normal, Atypical, and Imposters: A Guide to Identification
Supplemental Material, Combined_supplemental_materials-Donovan_et_al for Mitotic Figures—Normal, Atypical, and Imposters: A Guide to Identification by Taryn A. Donovan, Frances M. Moore, Christof A. Bertram, Richard Luong, Pompei Bolfa, Robert Klopfleisch, Harold Tvedten, Elisa N. Salas, Derick B. Whitley, Marc Aubreville and Donald J. Meuten in Veterinary Pathology
Footnotes
Acknowledgements
Declaration of Conflicting Interests
The author(s) declared no potential conflicts of interest with respect to the research, authorship, and/or publication of this article.
Funding
The author(s) disclosed receipt of the following financial support for the research, authorship, and/or publication of this article: CAB gratefully acknowledges financial support received from the Dres. Jutta & Georg Bruns-Stiftung für innovative Veterinärmedizin.
Supplemental material for this article is available online.
References
Supplementary Material
Please find the following supplemental material available below.
For Open Access articles published under a Creative Commons License, all supplemental material carries the same license as the article it is associated with.
For non-Open Access articles published, all supplemental material carries a non-exclusive license, and permission requests for re-use of supplemental material or any part of supplemental material shall be sent directly to the copyright owner as specified in the copyright notice associated with the article.