
Abstract
Articular osteochondrosis (OC) arises due to vascular failure and ischemic chondronecrosis. The aim of the study was to describe the histological and computed tomographic (CT) characteristics of changes in the distal femoral physis of pigs, to determine if they represented OC lesions and if the pathogenesis was the same as for articular OC. The material included 19 male Landrace pigs bred for predisposition to OC. One or 2 pigs were euthanized and CT-scanned at 2-week intervals from 82 to 180 days of age. Material from 10 pigs was available for histological validation. The CT scans revealed 31 lesions confirmed in 3 planes and 1 additional macroscopically visible lesion confirmed in 2 CT planes. Twelve of the lesions were histologically validated. All lesions were compatible with OC. Cartilage canal and eosinophilic streak morphological changes corresponded to failure of end arteries coursing from the epiphysis, toward the metaphysis. The location of lesions was compatible with failure at the point of vessel incorporation into bone. Vascular failure was associated with retention of viable hypertrophic chondrocytes and delayed ossification but not cartilage necrosis. Lesion width ranged from 1.1% to 45.6% of the physis. Several lesions were expected to resolve due to small size and evidence of CT-identifiable, reparative ossification. Angular limb deformity was not detected in any pig. The pathogenesis of physeal OC started with vascular failure that was morphologically identical to articular OC. The heritable predisposition may therefore be the same. The association between lesions and limb deformity should be studied further in older pigs in future.
Keywords
Computed tomography (CT) is used in the selection of boars for breeding 2,22 and is an ideal modality for evaluation of skeletal health. Scoring of articular osteochondrosis (OC) lesions in CT scans has previously been histologically validated. 27 Osteochondrosis in the metaphyseal growth plate, or physis, is as important to pig health and welfare as articular OC because it has been associated with angular limb deformity. 3,19,32 During the validation of articular lesions, 27 focal changes were detectable in the physes of pigs, but it is currently not known if the changes represented OC. It is important to determine if this is the case, because it determines whether physeal OC lesions can be scored in the same way as articular OC in CT scans. 27 It is also not known whether physeal OC lesions have the same pathogenesis as articular OC, something that is important because if the pathogenesis is the same, the heritable predisposition 2,33 may also be the same.
Articular OC arises in the epiphyseal growth cartilage that is located between the articular cartilage and the secondary center of ossification. 24,48 Epiphyseal growth cartilage has a temporary blood supply that enters the cartilage from the perichondrium and courses within cartilage canals. 5,49 The circulation is organized as anatomical end arteries, 13 and canals can therefore be said to have a proximal, middle, and distal end. The blood supply becomes incorporated into epiphyseal bone during growth, and this happens earlier at the midportion than at the proximal and distal ends of the canal. 50 In both pigs and foals, early lesions were consistently located axial to the point of incorporation into bone, around the distal portion of the canal. 30,50 The lesions consisted of areas of necrotic cartilage centered on necrotic cartilage canals (ie, ischemic chondronecrosis) that were located at intermediate depth of the growth cartilage outside diffusion distance from alternative sources, termed OC latens. 5,30,50 Together, these observations prompted the interpretation that lesions were due to failure of vessels during the process of incorporation into bone. 30,50 Endochondral ossification proceeded as normal in the cartilage adjacent to but not within lesions, which therefore caused a focal delay in endochondral ossification, or OC manifesta. 31,50 Articular lesions can resolve 26 or progress to pathologic fracture and loose fragments in joints known as OC dissecans. 25,31
The hypothesis that articular OC occurred due to failure of vessels during incorporation into bone has since been supported by further evidence. In histological sections, OC manifesta lesions often consisted of multiple areas of ischemic chondronecrosis close together at slightly different depth levels in the ossification front, known as stair-step lesions. 5,27,28 The only anatomical component that matched the geometry of the stair-step lesions was the cartilage canal blood supply. 27 In longitudinal CT scans, multiple lobes appeared at the same time, and the most feasible explanation was that failure of a single vascular trunk during incorporation led to lesions around multiple smaller vessel branches simultaneously. 24,26 The pathogenesis of articular OC has also been experimentally reproduced by transecting the blood supply in pigs, 5,47 foals, 25 and goats. 38 It is known that whereas articular OC lesions consist of areas of ischemic chondronecrosis, physeal OC lesions consist of large numbers of hypertrophic chondrocytes and streaks of intensely eosinophilic-staining material. 7,17,18,31,44 The eosinophilic streaks most likely represent remnants of the cartilage canal blood supply, 16,17,21 and it has been suggested that physeal OC occurs due to vascular failure, but in most cases, this refers to failure of vessels to penetrate growth cartilage from bone rather than failure of cartilage canal vessels. 7,17,18,21 The literature contains some information about the configuration of the blood supply to physeal growth cartilage. 16,18,40 Importantly, the midportion of physeal end arteries is incorporated into bone on the deep side of the secondary center of ossification during growth (Fig. 1). 16 Failure of a vascular trunk during incorporation into bone can therefore potentially lead to lesions around multiple vessel branches simultaneously in exactly the same way in the physis as in articular OC. 30,50
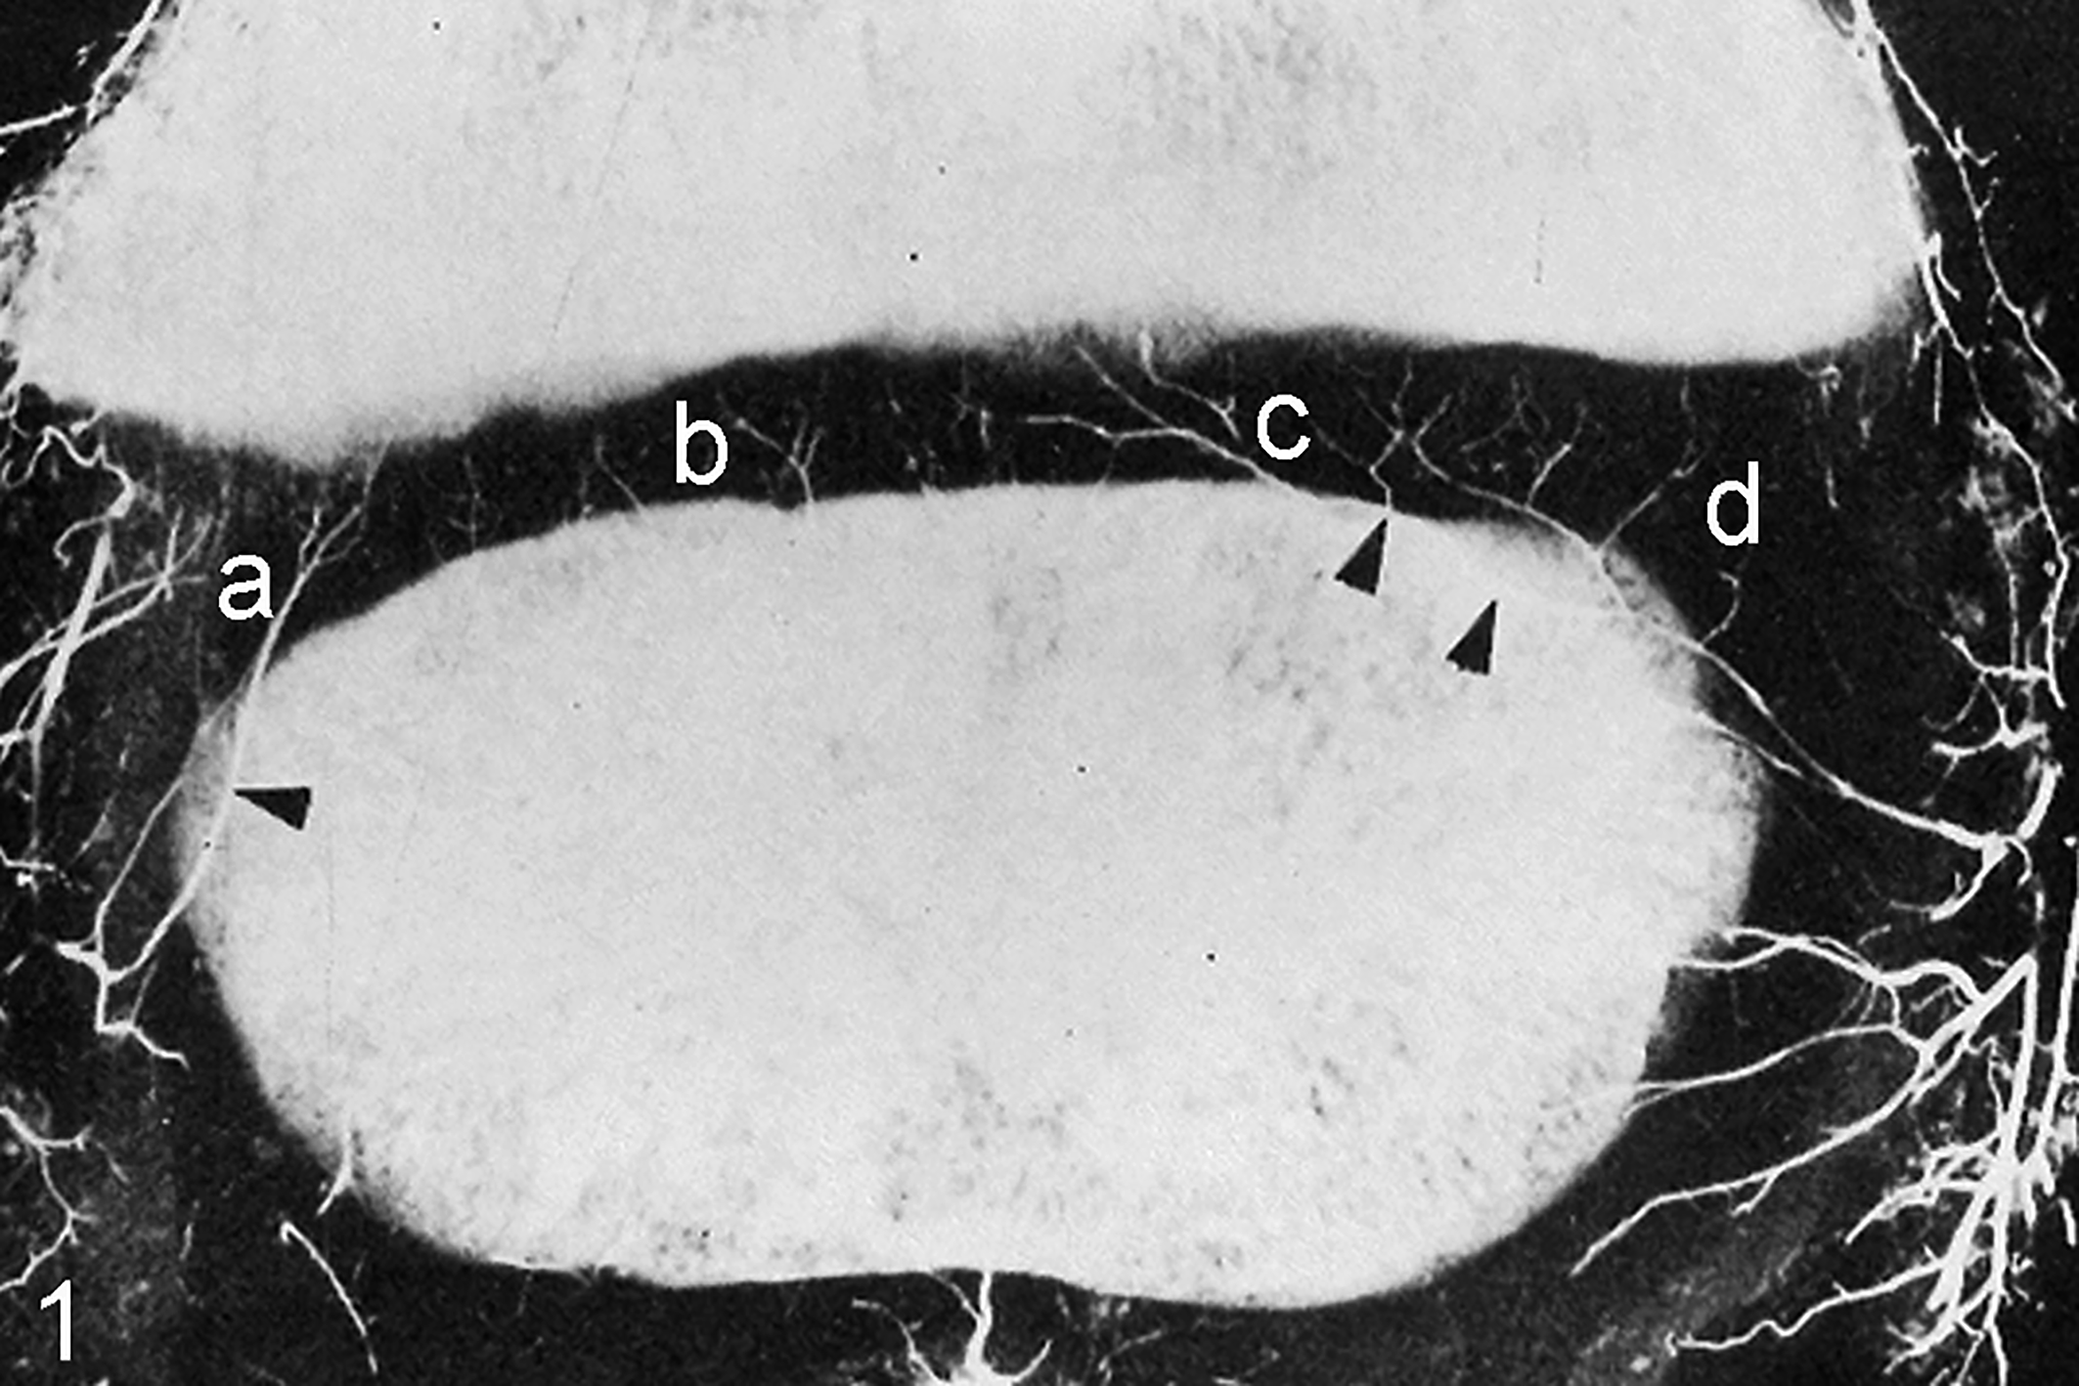
Arterial perfusion, distal femoral physis, 15-day-old pig. Perfused vessels enter the growth cartilage from the perichondrium. The midportion of the end arteries supplying the physis is incorporated into the ossification front on the deep side of the secondary center of ossification (arrowheads). Four main vessel configurations are visible: vessels that enter the physis peripherally and course roughly perpendicular to the epiphyseal-side ossification front, referred to as peripheral-perpendicular vessels (a); vessels that enter the physis centrally and course perpendicular to the epiphyseal-side ossification front, referred to as central-perpendicular vessels (b); vessels that enter the physis centrally and continue in an axially oblique direction, referred to as central-axial vessels (c); and vessels that enter the physis peripherally and continue in an abaxially oblique direction, referred to as peripheral-abaxial vessels (d). Reprinted with permission from Hill et al. 16
The aim of the current study was to describe the histological and CT characteristics of changes in the distal femoral physis of pigs, to determine if they represented OC lesions and if the lesions had the same pathogenesis as articular OC.
Materials and Methods
The study was approved by the National Animal Research Authority (FOTS ID: 2010/2630). All pigs were kept according to national legislation (Animal Welfare Act 2009-06-19-97, Regulation for the Keeping of Pigs in Norway 2003-02-18-175).
The material consisted of 19 male Landrace pigs used in previous studies. 26,27 The pigs were purchased with informed consent for research from members of the Norwegian pig breeders’ association, Norsvin (www.norsvin.no). The pigs were purpose-bred from a boar with high breeding value for articular OC and were the offspring of 8 different sows whose farrowing dates fitted with the study start date. All pigs were examined at 2-week intervals from 82 to 180 days of age (longitudinal data reported elsewhere). The pigs were visually inspected for angular limb deformity by a veterinary surgeon at each examination interval. One or 2 pigs were selected for euthanasia, CT scanning, and histological validation at each interval. At the eighth and final interval, all remaining pigs were euthanized and examined. Pigs were assigned letters from A to S by ascending age on the study end date and by ascending body weight if they were of the same age (range, 33-128 kg; Suppl. Table S1).
Computed Tomography
Each pig was euthanized by captive bolt stunning and exsanguination and positioned in sternal recumbency with the hind limbs extended on the patient table of a 32-slice helical CT scanner (GE Light Speed Pro 32; GE Healthcare, Munich, Germany). A hind-limb scan comprising an average of 960 transverse slices from the tuber coxae to the claws was acquired using a fixed kV of 120, a dynamic mA of up to 650, and a slice thickness of 0.625 mm.
The right distal femoral physis was selected for evaluation. The maximum mediolateral width of the physis was measured by scrolling to the frontal slice where this dimension subjectively appeared widest (Fig. 2). The software calipers were placed midway between the medial extreme of the secondary center of ossification and the metaphysis and midway between the lateral extreme of the secondary center of ossification and the metaphysis, and the straight line between the 2 points was measured (Fig. 2). The maximum craniocaudal length of the physis was measured by scrolling to the sagittal slice where this dimension subjectively appeared longest. The software calipers were placed midway between the cranial extreme of the secondary center of ossification and the metaphysis and midway between the caudal extreme of the secondary center of ossification and the metaphysis, and the straight line between the 2 points was measured. Proximodistal thickness was not measured because although the physis was open in all pigs, thickness was below the CT slice thickness of 0.625 mm at several locations in the physes of multiple pigs.
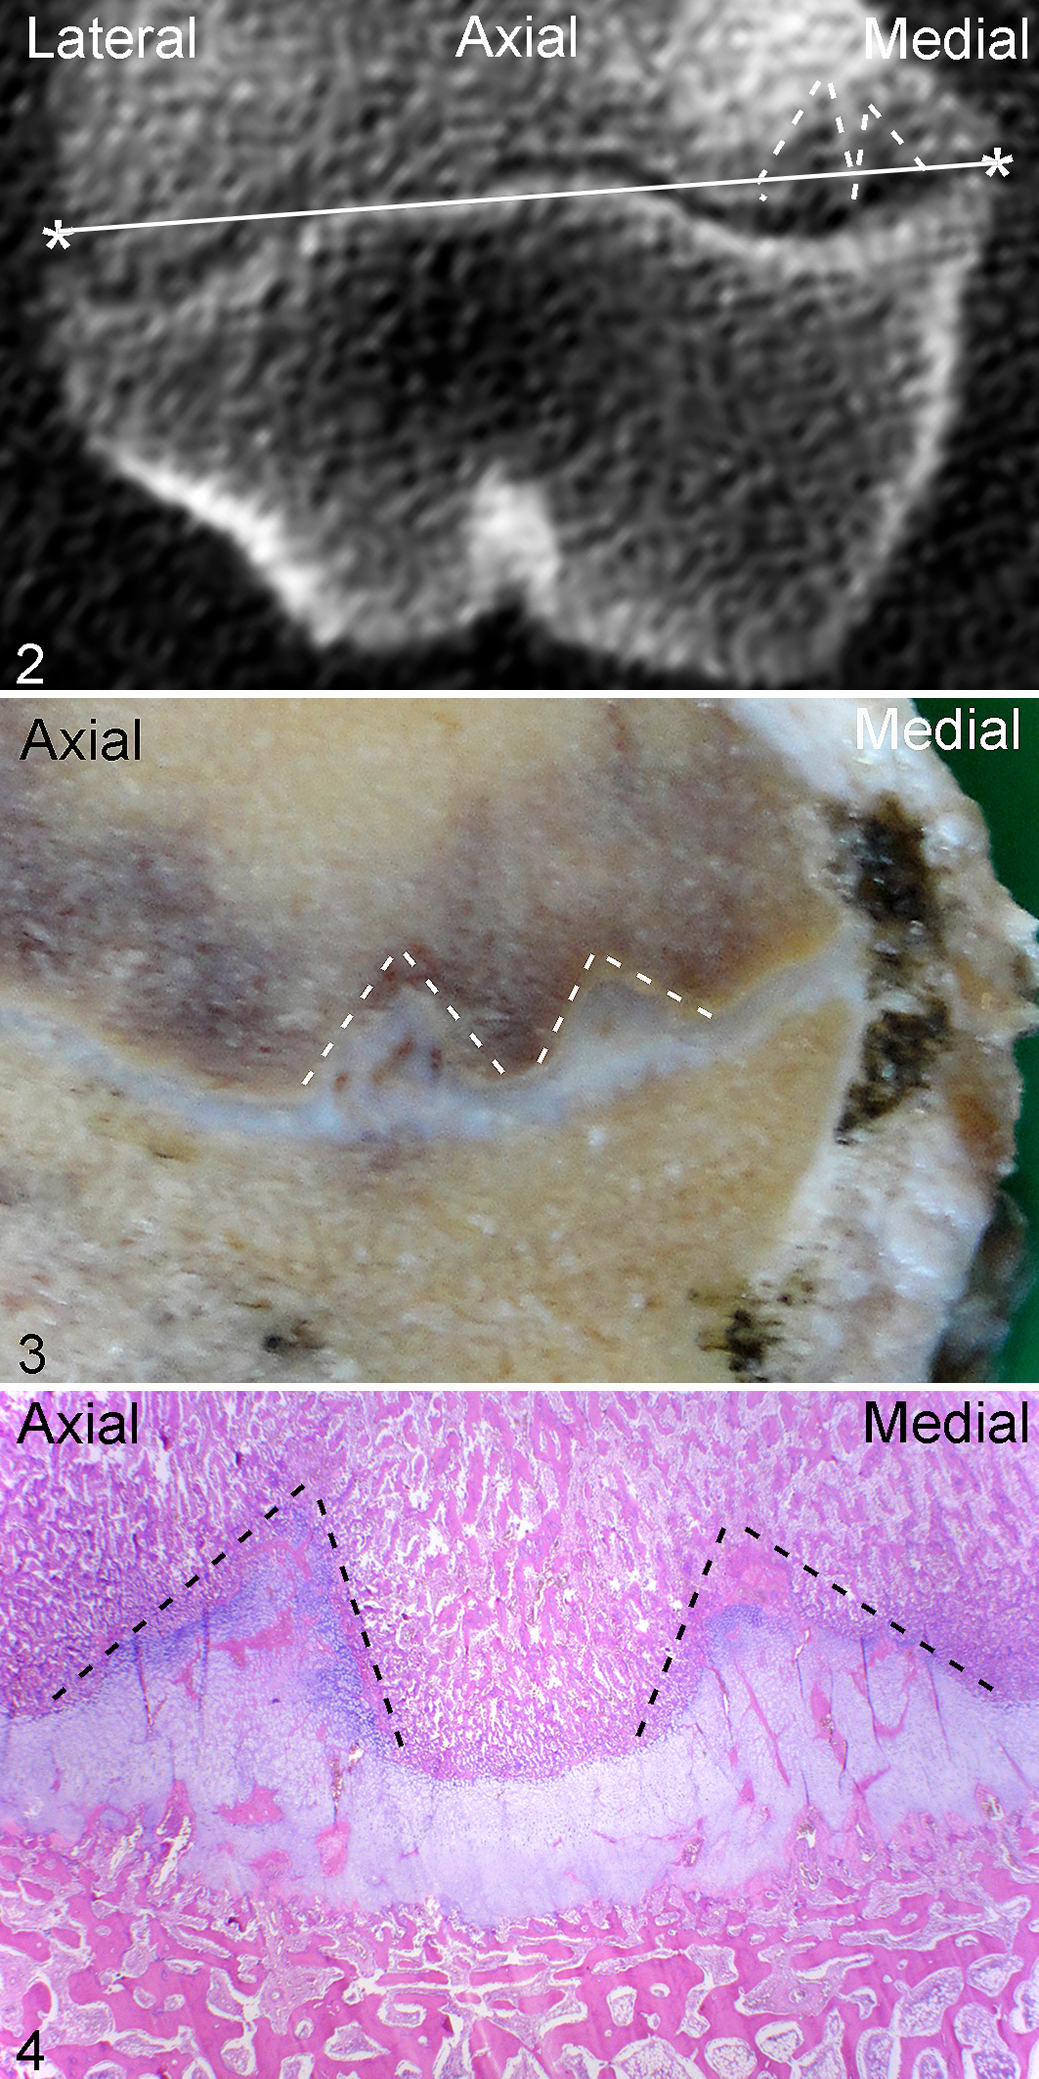
Methods for evaluating physeal osteochondrosis by computed tomography and histopathology. Physeal osteochondrosis, distal femur, pig N, lesion 23, caudal third, medial half of physis.
Each femur was assessed in the frontal, sagittal, and transverse plane. Lesions of OC were defined as focal, sharply demarcated areas of soft tissue hypodensity in or near the epiphyseal-side and metaphyseal-side ossification fronts of the physis (Fig. 2). 27 Lesions consisted of a single area, referred to as a lobe, or multiple areas close together in the frontal or sagittal plane, referred to as multilobulated lesions. Changes had to be present in all 3 planes and in 2 or more consecutive CT slices to be counted as lesions. Changes that were separated by more than 4 normal CT slices were counted as separate lesions. Recording of the location of lesions was divided into 6 regions: cranial third, central third, or caudal third of the femur and medial or lateral half of the femur. Each lesion was identified by the letter of the pig from A to S and an Arabic numeral that ascended in the same order as the lettering of the pigs (Suppl. Table S1). In pigs with multiple lesions, lesion number ascended in order of decreasing region prevalence (see Results). Secondary responses were recorded, consisting mainly of different patterns of mineral hyperdensity interpreted as ossification. 25,27
The maximum mediolateral width of lesions was measured by scrolling to the frontal slice where this dimension subjectively appeared widest. The software calipers were placed at the most medially and laterally extreme points of the lesion, and the straight line between the 2 points was measured. The maximum craniocaudal length of lesions was measured by scrolling to the sagittal slice where this dimension subjectively appeared longest. The software calipers were placed at the most cranially and caudally extreme points of the lesion, and the straight line between the 2 points was measured. If the widest or longest part of a lesion was located in a frontal or sagittal slice where the lesion was multilobulated, the normal tissue between adjacent lobes was included in the measurement. Measurements therefore represented the maximal span of the lesion, rather than the sum of the width or length of individual lesion lobes. The maximum proximodistal depth of lesions was measured by scrolling to the frontal slice where this dimension subjectively appeared deepest. A line was drawn between the medial and lateral extreme points of the lesion at the level of the ossification front, and the right-angle distance between this line and the deepest point of the lesion was measured.
Histology
Nine femurs were unavailable for histological validation because they had been used in previous studies. 8 –10 The 10 available femurs (Suppl. Table S1) were fixed in 4% phosphate-buffered formaldehyde for 48 hours. The distal third of each femur was sawed into approximately 3-mm-thick slabs in the frontal plane (Fig. 3), and the slabs were decalcified in 10% ethylenediaminetetraacetic acid. All regions of the physis with macroscopically visible changes (eg, focally increased thickness) (Fig. 3) were trimmed to fit into cassettes measuring 32 × 25 × 5 mm. After paraffin embedding, a minimum of two 4-μm-thick sections were prepared from each block and stained with hematoxylin and eosin for histological examination (Fig. 4). The blood supply was evaluated according to previously published criteria for identification of patent, chondrifying, and necrotic cartilage canals, 5 whereas growth cartilage and bone were evaluated for primary lesions and secondary responses. 25
Results
Number, Location, and Definition of Lesions
The 19 examined femurs contained 31 CT lesions confirmed in 3 planes, and all lesions matched the definition of OC given in the Materials and Methods section. In the sawed slabs, an additional lesion (M22) was visible on the cut surface of the slab that was only confirmed in the frontal and sagittal plane in CT scans, and thus the total number of CT and macroscopic lesions was 32 (Suppl. Table S1). The lesions were distributed as follows: 12 caudomedial lesions, 6 combined centro- and caudomedial lesions, 6 centrolateral lesions, 5 centromedial lesions, 2 caudolateral lesions, and 1 lesion that was located caudally in the midline (L20). The 10 available femurs had 15 CT and macroscopic lesions, and 12 of the lesions were visible on the surface of sawed slabs and could be processed for histological validation (Suppl. Table S1).
Lesions were initially defined as defects in the physeal ossification fronts (Figs. 2–4). During histological examination, it was discovered that when metaphyseal-side defects were present, the entire thickness of the physis superficial to lesions contained only abnormal cartilage canals and eosinophilic streaks (Fig. 4; described further below; superficial: toward articular surface). When epiphyseal-side defects were present, the physis deep to lesions contained either normal or abnormal canals and streaks (deep: away from articular surface). The histological definition of lesions was therefore revised to include focal defects in the physeal ossification fronts and all adjacent cartilage containing abnormal canals and streaks.
Categories of Cartilage Canal and Eosinophilic Streak Morphological Changes
Categories of cartilage canal and eosinophilic streak morphological changes followed a consistent pattern of distribution from the metaphyseal to the epiphyseal side of the physis in all lesions (Figs. 5–9, Suppl. Table S2). Nearest the metaphysis, there were thin, eosinophilic streaks that were acellular or contained erythrocytes, compatible with necrotic vessel branches (Fig. 6). Superficial to this, there were wider eosinophilic streaks with necrotic or lysed/absent endothelium, ghost remnant outlines of normal or dilated vessels, and necrotic perivascular cells, compatible with necrotic vessel trunks (Fig. 7). Toward the epiphysis, there were chondrifying canals (Fig. 8). Nearest the epiphysis, there were canals with increased perivascular mesenchymal cells that were continuous with cells in bone marrow, interpreted as repopulation of necrotic canals (Fig. 9). The pattern of distribution was therefore compatible with failure of end arteries coursing from the epiphysis toward the metaphysis in all lesions.
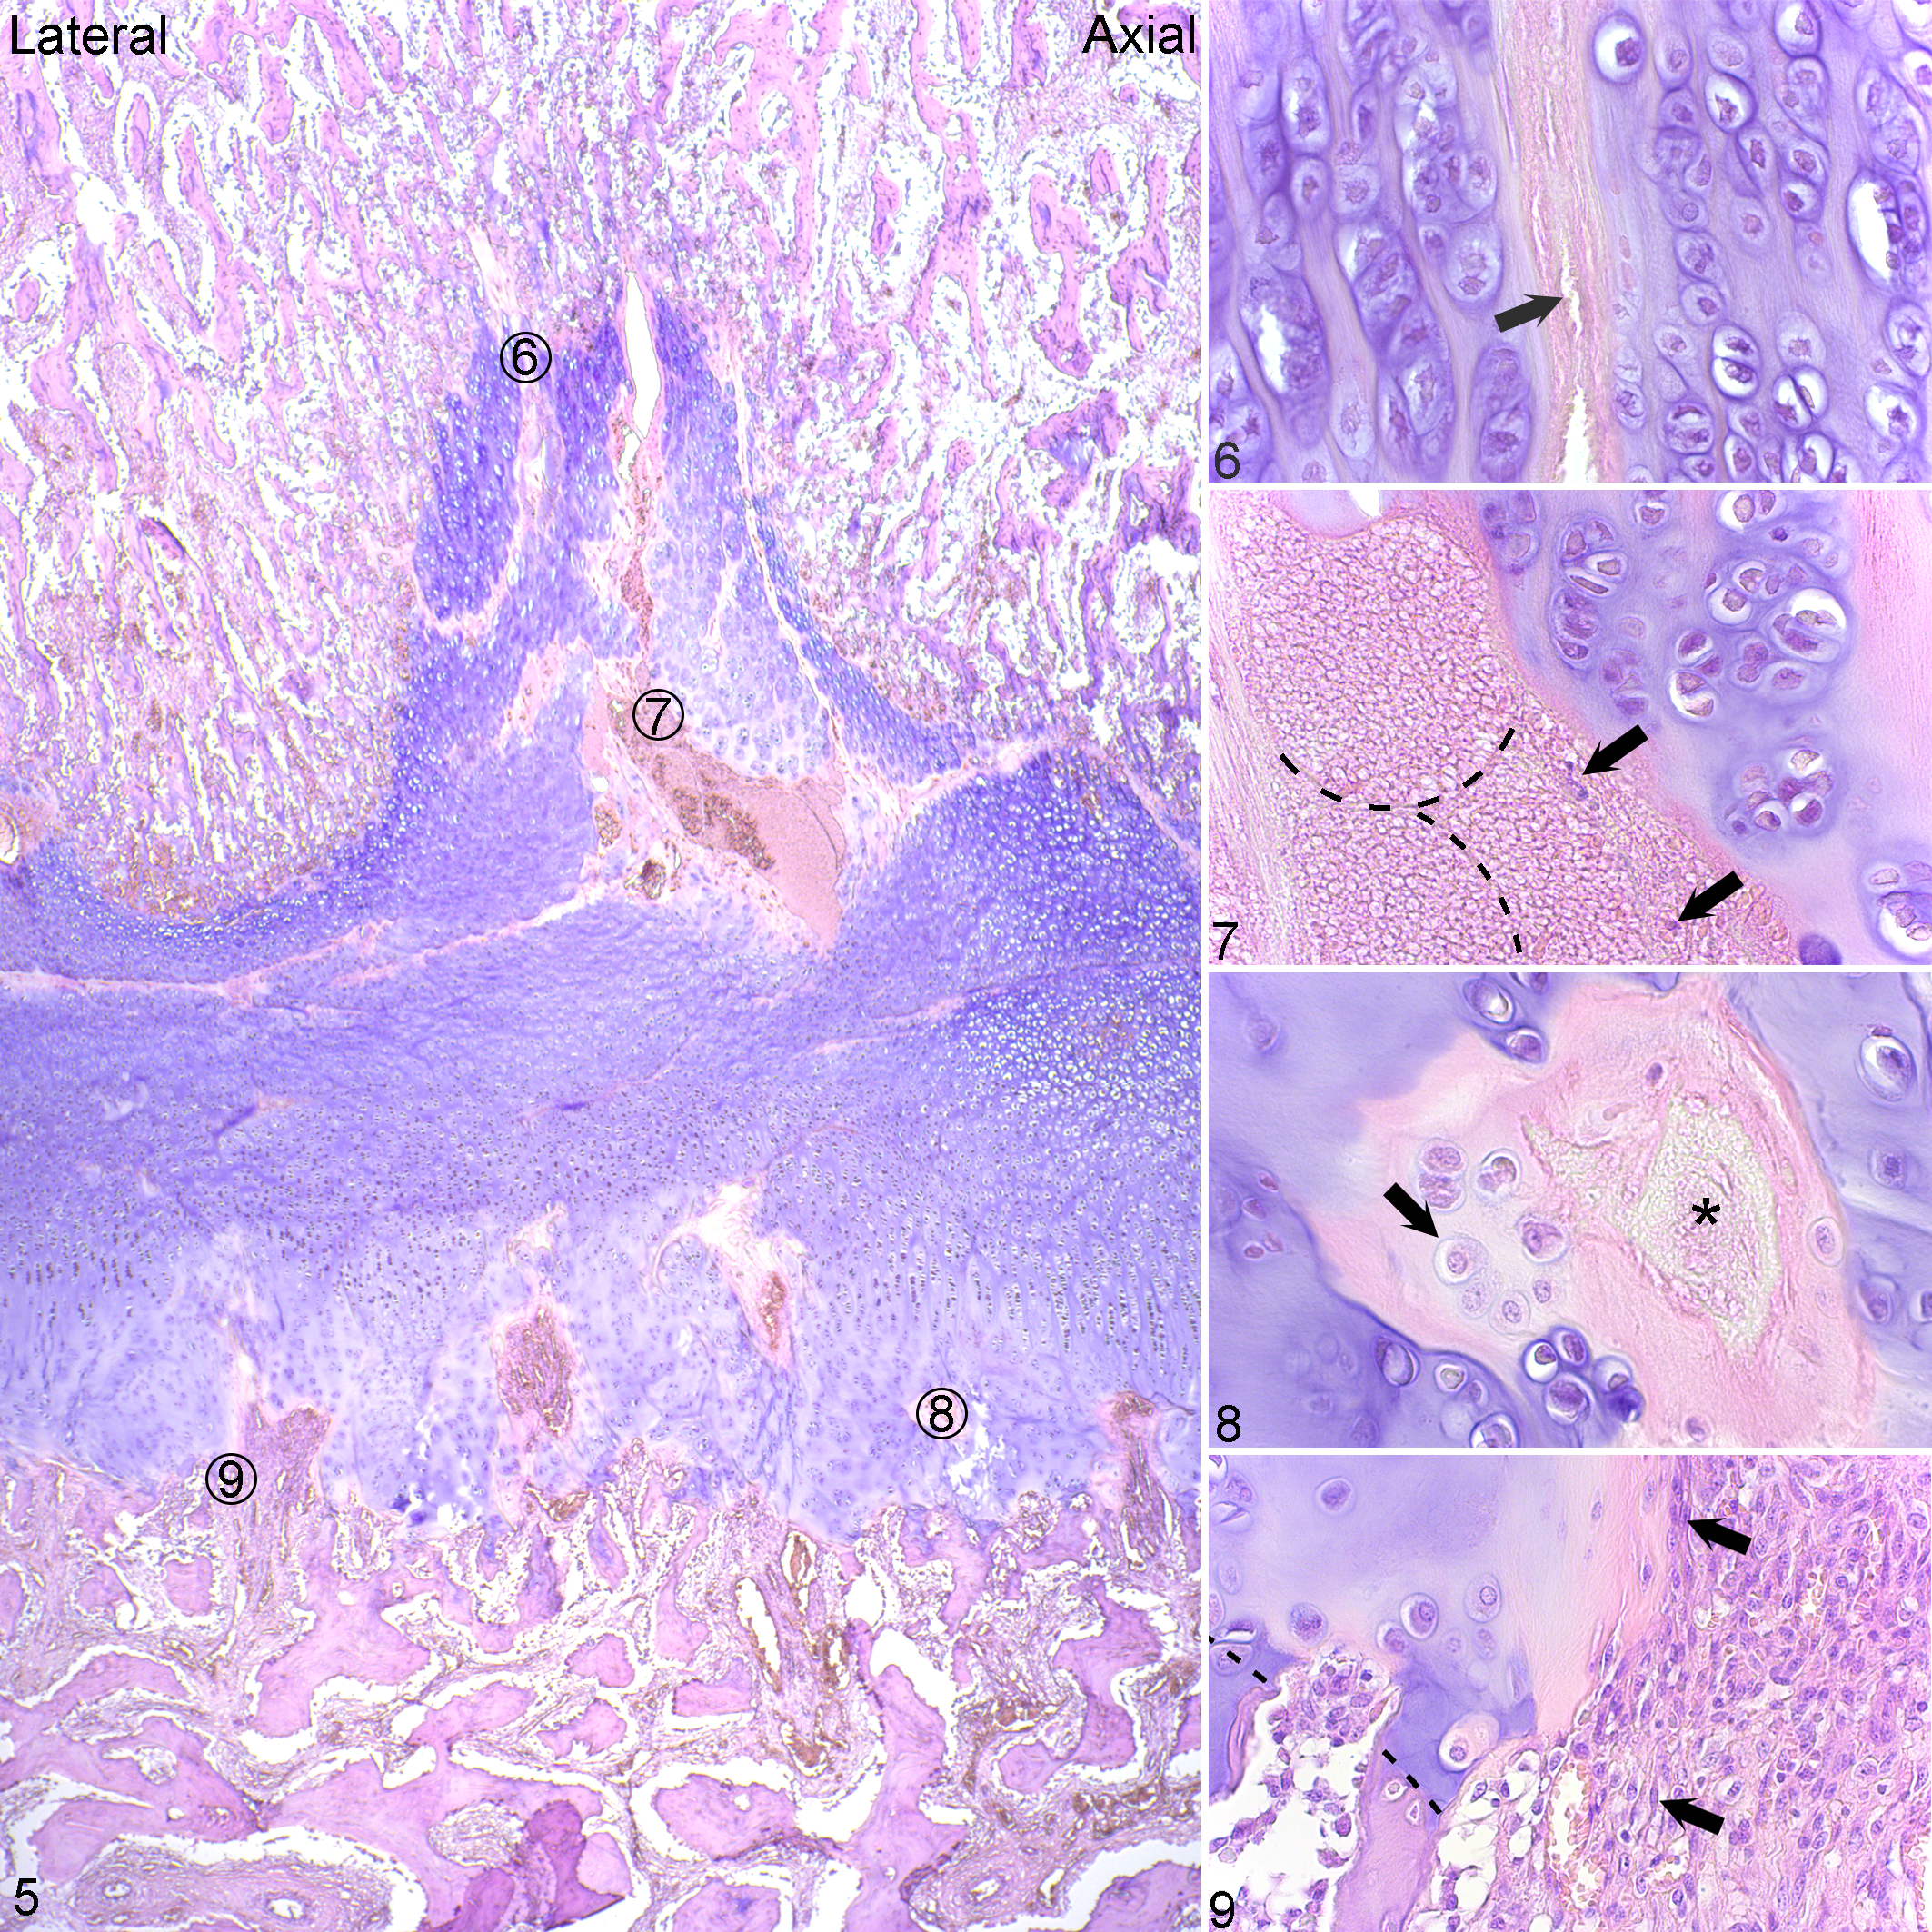
Physeal osteochondrosis, distal femur, pig M, lesion 22, central third, lateral half of the physis. Hematoxylin and eosin.
Photomicrographs were printed and lines were drawn on the printouts joining adjacent, aligned canal/streak remnants to compare these to the vessel configurations in Fig. 1. The results indicated that the 28 lesion blocks contained remnants of 59 failed vessels (Suppl. Table S3). Two of the remnants corresponded to vessels that entered the physis peripherally and coursed roughly perpendicular to the epiphyseal-side ossification front, referred to as peripheral-perpendicular vessels (Fig. 1). A further 16 remnants corresponded to vessels that entered the physis centrally and coursed perpendicular to the ossification front, referred to as central-perpendicular vessels (Fig. 1). Five remnants corresponded to vessels that entered the physis centrally and continued in an axially oblique direction, referred to as central-axial vessels (Fig. 1), and 36 remnants corresponded to vessels that entered the physis peripherally and continued in an abaxially oblique direction, referred to as peripheral-abaxial vessels (Fig. 1, Suppl. Table S3). The majority of canal/streak remnants were therefore compatible with failure of peripheral-abaxial vessels.
Vascular Failure Was Associated With Delayed Ossification
Nineteen of 28 blocks with lesions contained metaphyseal-side defects, 2 of 28 blocks contained epiphyseal-side defects, and 7 of 28 blocks contained both, and thus there were 26 metaphyseal-side and 9 epiphyseal-side defects (Suppl. Table S3). The 9 epiphyseal-side defects included 4 peripheral defects and 5 central defects. The 4 peripheral epiphyseal-side defects were considered to represent early changes near the point of vessel incorporation into bone and are described further under Causes of Vascular Failure. The 26 metaphyseal-side defects contained 51 separate lobes of delayed ossification (Suppl. Table S3). Twenty-two defect lobes were central and their proximodistal axes were perpendicular to the metaphyseal-side ossification front, whereas 29 lobes were peripheral and their proximodistal axes were obliquely angled from superficial-axial toward deep-abaxial, mirroring the configuration of peripheral-abaxial vessels. The main reason for the discrepancy between 59 failed vessels and 51 defect lobes was that multiple vessels contributed to single lobes. Both central and peripheral defect lobes had different shapes (Suppl. Table S3). Twenty-five of the 51 defect lobes were triangular (Figs. 10, 11). Triangular lobes were centered on a perpendicular, failed vessel (Fig. 10) or framed by adjacent oblique and converging vessels (Fig. 11). Twenty-four of the 51 defect lobes were rectangular (Fig. 10). Rectangular lobes were centered on a perpendicular vessel that branched toward the deep corners of the rectangle, or failed vessels ran obliquely across the rectangle (Fig. 10). Six of the 24 rectangles were irregular and appeared to represent 2 adjacent, confluent defects, resulting in a bilobed appearance (Fig. 12). Two of the 51 defect lobes were circular and surrounded by relatively more metaphyseal bone than the other defects and could therefore be described as pseudocyst-like defects (Fig. 13). The above observations suggested that there was a close relationship between the configuration of failed vessels and the shape of resultant areas of delayed ossification.
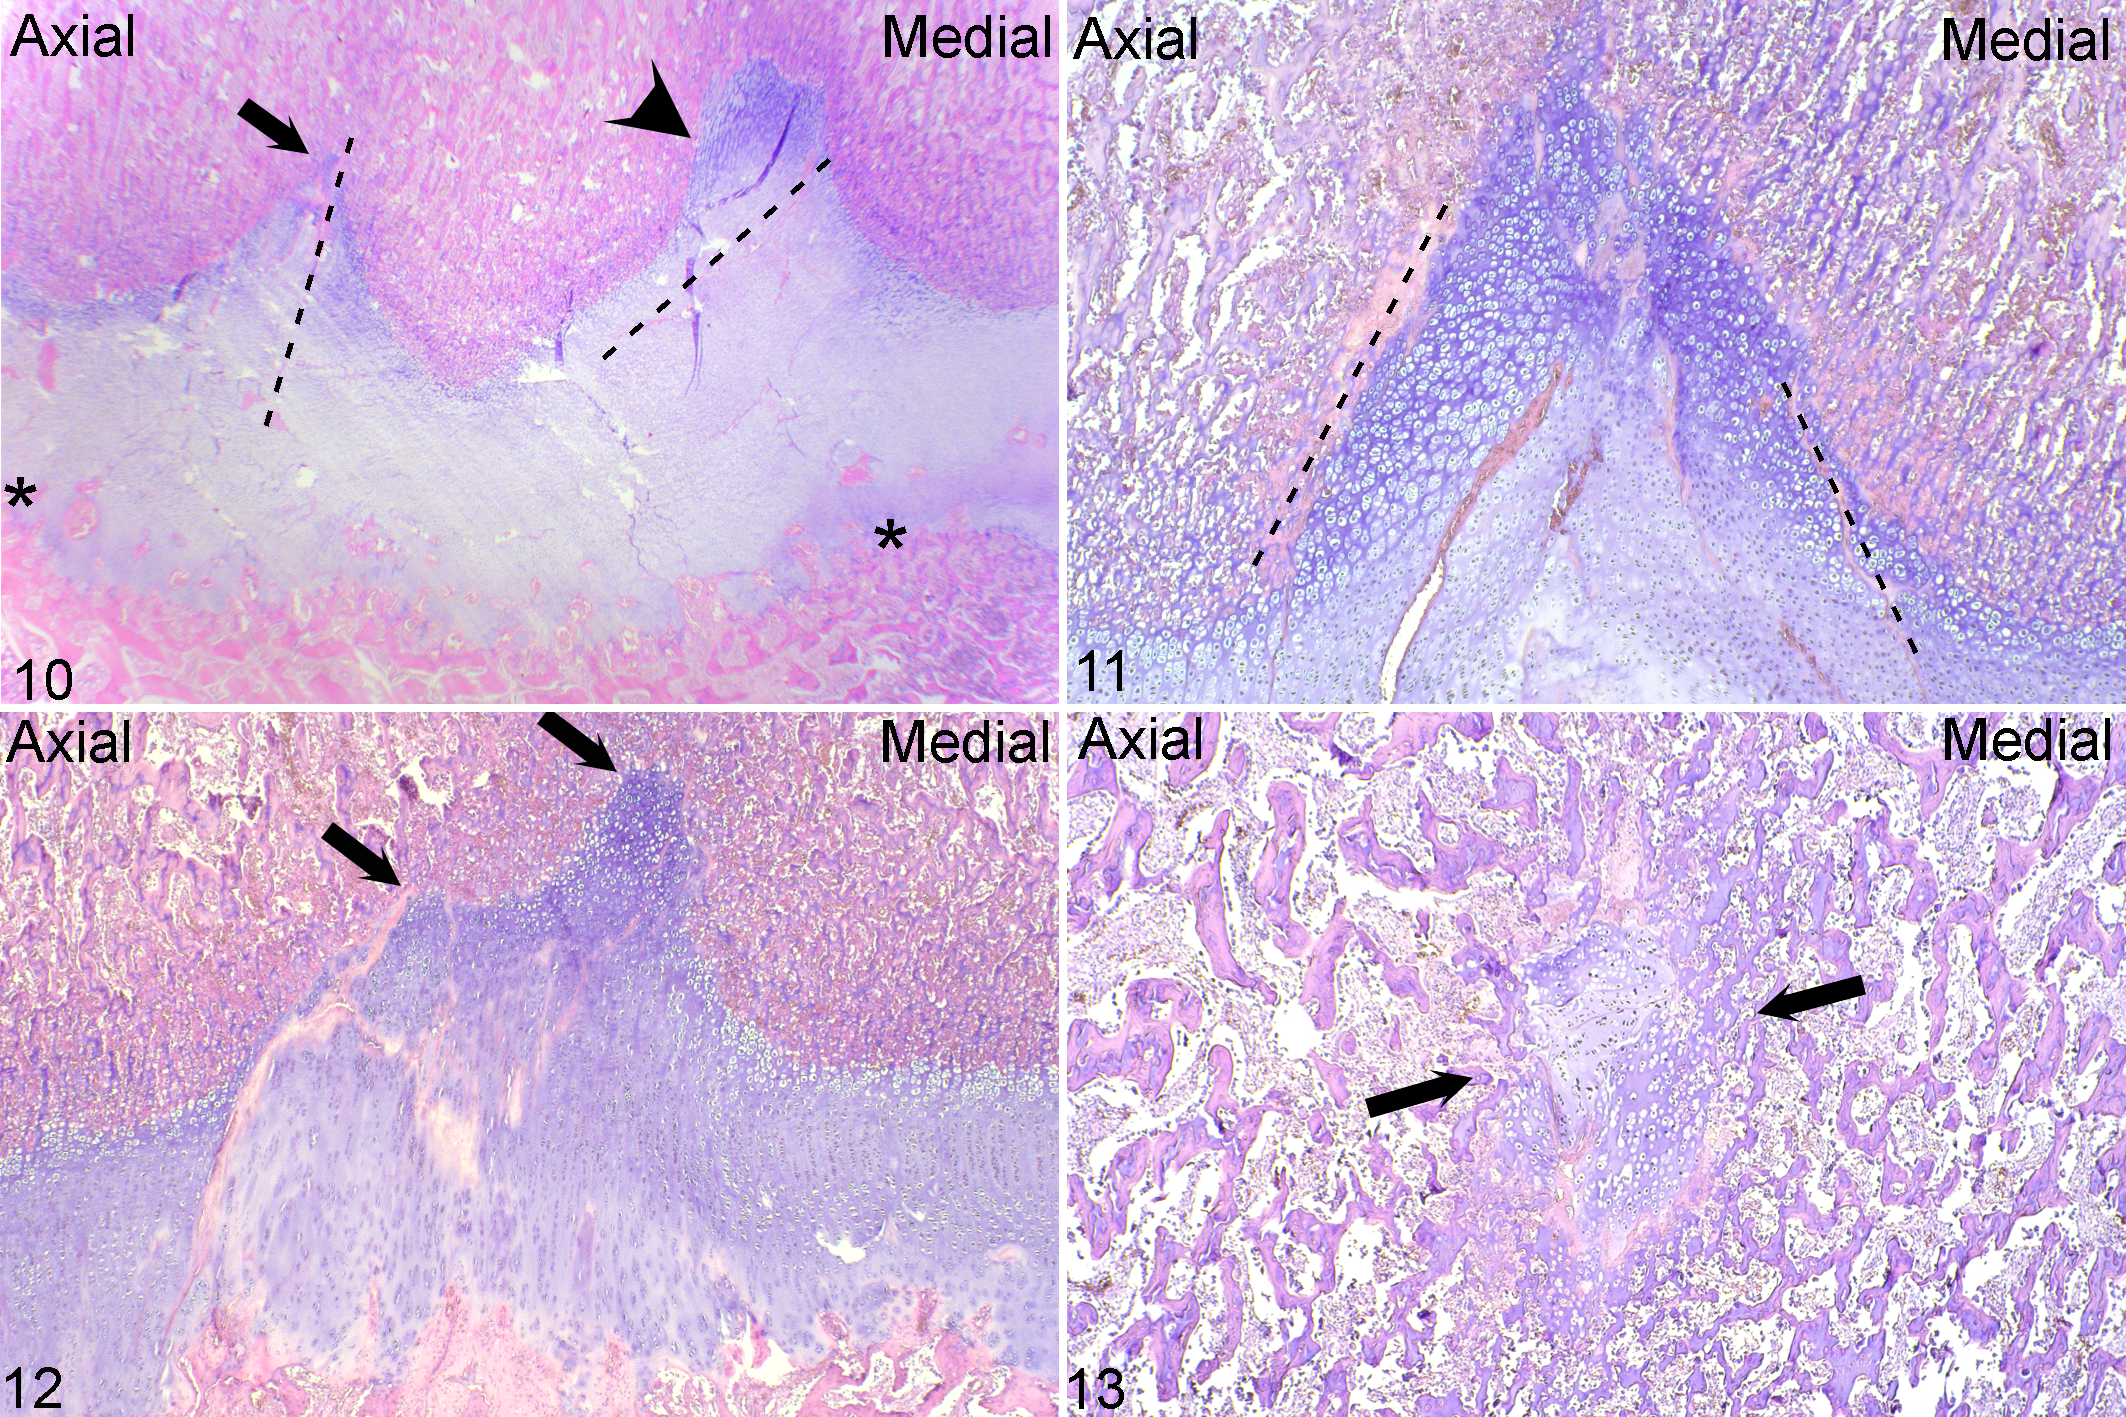
Physeal osteochondrosis. Distal femur. Hematoxylin and eosin.
Metaphyseal-side defects contained chondrocytes with the same morphology as the adjacent, normal metaphyseal-side hypertrophic and proliferative growth cartilage zones, except that the number of cells was typically doubled and that columns were sometimes oblique, rather than perpendicular to the ossification front. Chondrocytes tended to be nucleated and morphologically viable.
The 5 central epiphyseal-side defects tended to be semicircular and wider, shallower, and more dish-like than metaphyseal lobes (Fig. 10). In addition to viable hypertrophic and proliferative zone chondrocytes, central epiphyseal defects contained repopulated canals engaged in repair as described below. Metaphyseal-side defects were observed in the absence of central epiphyseal-side defects, whereas the reverse did not occur. Lesions with both central epiphyseal-side and metaphyseal-side defects were therefore interpreted as more chronic than lesions with metaphyseal-side defects only.
It was possible to identify frontal CT slices with defects that corresponded perfectly to the number, shape, and angulation of defects in histological sections (Figs. 2, 4). Lesion F9 contained a single lobe but was located in the same femur as lesion F8, and thus all lesions were either multilobulated or multiple. Detailed descriptions of the CT lesions are available in Supplemental Table S4.
Causes of Vascular Failure
The path of peripheral-abaxial end arteries was followed retrograde from early physeal lesions via epiphyseal bone toward the site of original perichondrial entry to look for evidence of causes of vascular failure (Fig. 14). The aforementioned 4 peripheral epiphyseal-side defects were roughly triangular and sharply angled in the same direction as peripheral-abaxial vessels, and the opposing metaphyseal-side ossification front was normal. Peripheral epiphyseal-side defects contained failed canals/streaks with the same distribution of morphological changes as described for metaphyseal lesions, above, of necrotic branches, necrotic trunks, and chondrifying and repopulated canals (Figs. 15, 16). The defects contained normal chondrocytes, and lesion N22 contained a small amount of fibrous tissue.
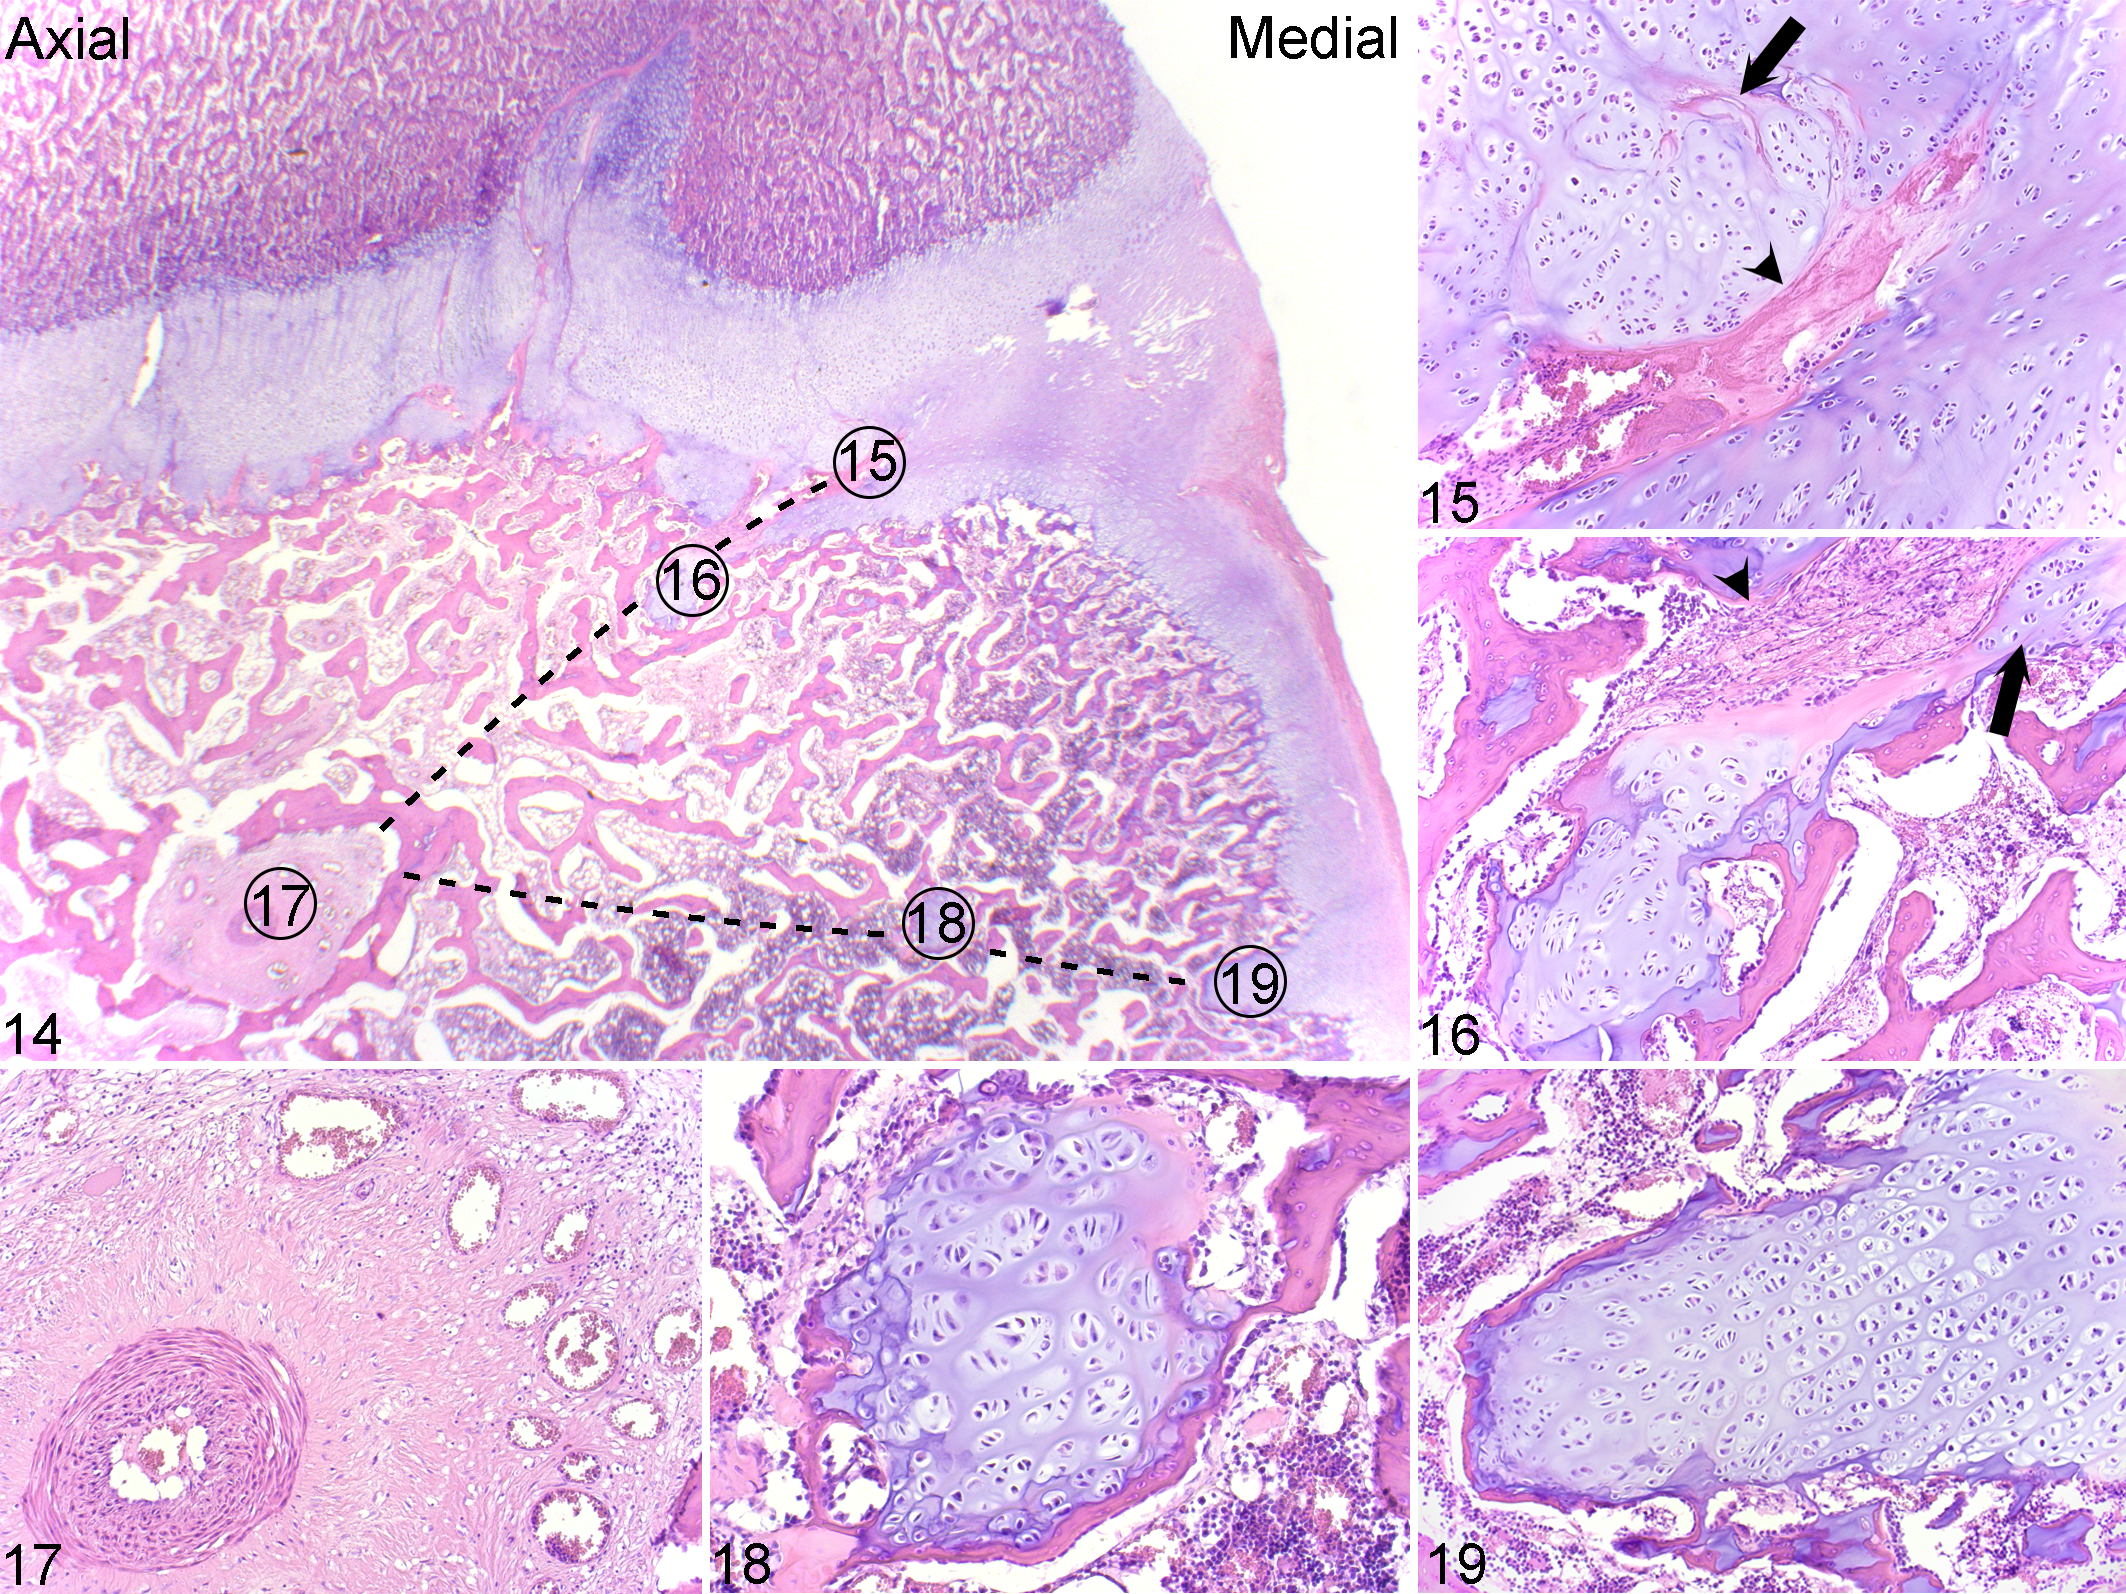
Physeal osteochondrosis, distal femur, pig G, lesion 10, caudal third, medial half of physis. Hematoxylin and eosin.
Within epiphyseal bone, there were conspicuously large vessels surrounded by fibrous tissue in 24 of 28 blocks (Fig. 17) and small islands of normal growth cartilage in 7 of 28 blocks (Fig. 18, Suppl. Table S3). The islands sometimes lined up with peninsulas of normal growth cartilage (Fig. 19), present at 1 to 3 depth levels in the side of the epiphysis facing the perichondrium in 8 of 28 blocks. Canal/streak remnants in lesions F8 and F9 contained perivascular neutrophils, compatible with septic vascular failure. All other peninsulas and adjacent perichondrium contained only remnants of chondrifying, fibrosing, necrotic, or repopulated canals (Suppl. Table S3). Changes along the path of peripheral-abaxial vessels were therefore nonspecific for causes of vascular failure. Hematomas, lipid emboli, microfractures, abscesses, or osteomyelitis were not detected.
Secondary Reparative Responses and Computed Tomographic Visibility
The main secondary response within cartilage was repopulation of failed canals with cells from epiphyseal bone marrow. The cells inside repopulated canals were most often fibroblast-like (Fig. 9) but could be undifferentiated, osteoblast-like, or chondrocyte-like (Suppl. Table S2). In the CT scans of lesions E7, J15, M21 (Suppl. Figs. S1, S2), N23, O24, and P27, there were hyperdense lines that matched the location, size, shape, and number of repopulated canals (Suppl. Table S5). This was surprising because although lesions J15, M21, N23, and P27 possibly contained some osteoblast-like cells, lesions E7 and O25 contained only fibroblast-like cells that were expected to have similar attenuation to cartilage. In several lesions, there were larger areas of overt ossification (ie, osteoblasts, osteoid, and trabeculae) in the location of repopulated canals, and such areas corresponded to mineral hyperdense foci in the CT scans of lesions C5 (Suppl. Figs. S3, S4) and J15 (Suppl. Table S5).
The bone adjacent to lesions sometimes contained increased numbers of multinucleated giant cells interpreted as chondroclasts, but the main secondary response within bone was different patterns of ossification. In lesions G10, M21, and O25, there was sclerosis on the margins of lesions in CT scans that corresponded to increased trabecular density in histological sections (Suppl. Table S5). In the metaphyseal defect lobes of lesions E7, J15, M22, P27, Q28, and Q29, there were linear, mineral hyperdensities that advanced horizontally into the lesion at the level of the metaphyseal-side ossification front in CT scans. The lines impinged on rectangular defects, causing them to take on a reverse-C shape and was confirmed to correspond to ossification in histological sections from lesions M22 (Suppl. Figs. S5, S6) and P27. The density of lesions D6, Q28, R30, and S31 was similar to surrounding bone (Suppl. Table S4), and the lesions therefore appeared to be undergoing spontaneous resolution by reparative ossification.
Lesion Size and Outcome
The relative width and length of lesions ranged from 1.1% to 45.6% (average: 12.3%) of physeal width and 1.4% to 38.9% (average: 12.5%) of physeal length (Suppl. Table S6). The absolute smallest lesion was L19 at 166 days, the relative smallest lesion was N23 at 171 days, and the absolute and relative largest lesion was B4 at 96 days, and thus there was no apparent simple, linear relationship between lesion size and age (Suppl. Table S6). Angular limb deformity was not detected in any pig.
Discussion
Physeal Osteochondrosis Starts With Vascular Failure
Cross-sectional studies can only generate limited information about which changes occurred first and which came second. Three current observations nevertheless support the same interpretation. All lesions were focal. Growth cartilage consists of chondrocytes, extracellular matrix, and cartilage canal blood supply, and the only anatomical component that is focally distributed is the cartilage canals. 5,27,49 It is therefore difficult to explain focal growth cartilage lesions in any other way than that they represent primary involvement of the blood supply. 27 All ossification defects were centered on or framed by abnormal vessels/eosinophilic streaks. The vascular hypothesis for the pathogenesis of articular OC originates from cross-sectional studies, where the observation that lesions were centered on necrotic cartilage canals led to the interpretation that they were caused by vascular failure. 4,20,43 This was later confirmed by experimental studies where transection of vessels produced identical lesions. 5,47 With the exception of lesion F9, all lesions were multilobulated. For articular OC, it has been documented that multiple lobes appear at the same time, 26 and the longitudinal data from the current lesions (published elsewhere) indicate that the same is true for physeal OC. The only plausible way to generate multilobulated lesions from a single insult is through failure of 1 vascular trunk, leading to lesions around multiple smaller branches simultaneously. 24,26 Together, these 3 observations support the interpretation that physeal OC starts with vascular failure.
As for articular OC, the vascular hypothesis for the pathogenesis of physeal OC could be tested by experimental transection of vessels. The blood supply to the physis has already been blocked or transected in several studies. 12,39 The problem with these studies is that the blood supply was interrupted to a wider area than 1 vessel trunk and that the studies focus on late effects on ossification, rather than on early changes in growth cartilage. If the vascular pathogenesis of physeal OC was to be tested in future, one should probably make use of recently developed advanced imaging techniques that enable visualization of individual vessel trunks prior to transection, as well as monitoring of resultant lesions. 37
For articular OC, the hypothesis that vascular failure was associated with incorporation of vessels into bone was based on studies combining arterial contrast perfusion and histology. 30,50 The perfusion showed that the midportion of end arteries was incorporated into bone at the periphery of the secondary center of ossification, and the histology showed that the lesions were located axial to the point of incorporation. 30,50 The current examined pigs were not perfused, but comparison to Hill et al 16 confirms that all current lesions were located at or axial to the point of incorporation of physeal vessels into bone. Incorporation of physeal vessels should probably be studied in more pigs in future, but until then, the comparison to Hill et al 16 supports that vascular failure in the physis was morphologically identical to vascular failure in epiphyseal growth cartilage, including axial location of lesions. 30,50 Vascular failure can therefore be associated with incorporation of vessels into bone in both physeal and articular OC.
When the morphology of the vascular failure is identical, the heritable predisposition may also be the same. 2,33 This is probably the single-most important implication of the current study because the heritable predisposition is the aspect of OC where there is still the most information left to discover. The current results contribute by indicating that the predisposition may be associated with the same set of genes for both physeal and articular OC, compared to if the pathogenesis had been different and the predisposition therefore was associated with different sets and a greater total number of genes. If discovered, specific genes can potentially be used to refine genomic selection against OC. Also, causes of vascular failure have been easier to discover in acquired than in heritably predisposed lesions (eg, bacteria/perivascular neutrophils in septic vascular failure). 24,45 Following the path of failed vessels has so far only revealed nonspecific changes as described in the Results. 9 Thus, discovering specific genes, researching their functions, and linking these to morphological changes may be the only way to determine the exact cause of vascular failure in heritably predisposed OC.
Physeal Vascular Failure Did Not Lead to Ischemic Chondronecrosis
The vast majority of chondrocytes within the current lesions were morphologically viable. This agrees with Farnum et al, 7 where results were corroborated by transmission electron microscopy, and other studies where necrosis of chondrocytes was observed in only very chronic lesions. 7,15,31 Following vascular failure in epiphyseal growth cartilage, it is chondrocytes at intermediate depth that undergo necrosis. 5,25,47 The proposed explanation is that they are outside the diffusion distance from alternative sources. 5 The physis is responsible for elongation of a cylinder, whereas the epiphyseal growth cartilage is responsible for expansion of a sphere. There may be better access to diffusion from alternative sources following vascular failure within a cylinder, compared to in a sphere. Intermediate depth also corresponds to the resting and proliferative zones of growth cartilage, 29 whereas chondrocytes within the current lesions were hypertrophic. Vascular failure may therefore affect different chondrocyte zones in the physis than in epiphyseal growth cartilage. Growth plate chondrocytes are described as having entered a path of terminal differentiation, and hypertrophic chondrocytes may have reached a stage from which they are able to continue independent of blood supply. Chondrocyte survival following physeal vascular failure may ultimately be due to a combination of factors, and experimental vascular transection could provide more definitive answers. In the meantime, the fact that vascular failure leads to retention of viable chondrocytes in the physis and chondrocyte necrosis in epiphyseal growth cartilage implies that after lesion initiation, diagnostic markers and staging may be different between OC in the 2 sites.
Physeal Vascular Failure Was Nevertheless Associated With Delayed Ossification
Endochondral ossification is a carefully coordinated process that relies on events on the growth cartilage and bone sides of the ossification front. 12 When both physeal and epiphyseal lesions occur due to failure of intra-cartilaginous vessels, this suggests that events on the growth cartilage side may be primarily responsible for the ossification delay in OC. In epiphyseal OC, chondrocytes underwent necrosis before the time they were expected to hypertrophy 5,25,49 and failed to carry out the associated cellular and matrix changes required for ossification to proceed. 12 In physeal OC, chondrocytes underwent hypertrophy, yet ossification was still delayed. The fate of hypertrophic chondrocytes in normal growth cartilage has been much debated.
As others before us, 11,36 we noted that hypertrophic chondrocytes within lesions failed to undergo apoptosis and vacate lacunae. We considered that this might constitute a temporary physical obstacle to osteoblast invasion. 11,12,36 Several studies also document that hypertrophic chondrocytes can transition into osteoblasts. 34,35,46 At present, the relative contribution of apoptosis and osteoblast transition to normal endochondral ossification in pigs is not known. It is therefore not yet possible to speculate which mechanism is responsible for delaying ossification within lesions. More research is needed, and it would be especially interesting to discover the extent to which either mechanism relies upon a vascular signal or gradient, in which case this would explain why the mechanism was upset following vascular failure.
Outcome
Several of the current observed lesions were expected to resolve. Both human 23,41 and animal 28 studies indicate that whether lesions are able to resolve is determined partly by size. In the current study, there was a striking range in terms of lesions affecting from 1.1% to 45.6% of physeal width. Some lesions were expected to resolve based on size alone. Other lesions like D6, Q28, R30, and S31 were expected to resolve due to extensive evidence of secondary, reparative ossification. 3,14 Vessels are spaced at regular intervals within growth cartilage. 42 If the current observed cartilage peninsulas represented points of vessel entry, they were separated by ∼0.4 mm of bone (Suppl. Table S4). After vascular failure, the ossification front could therefore meet with a second, intact vessel in the time it takes to advance 0.4 mm, and this could restore the vascular signals or gradients required for endochondral ossification to resume, as discussed above. This potentially also fits with how ossification was observed to advance horizontally into lesions at the level of the metaphyseal-side ossification front (Suppl. Figs. S5, S6). 14
Large lesions affecting up to 45.6% of physeal width were expected to persist and potentially cause clinical signs. Angular limb deformity was not observed in any of the current examined 82- to 180-day-old pigs. Histologically, changes represented early lesions, and based on experimental studies of articular OC, a lag phase is expected before clinical signs develop. 29 This is supported by limb deformity becoming manifest from 5 months onward in historical studies. 14,17,18,31 Several studies document limb deformities emanating from the physes around the hock, 1,6 but deformities of the distal femur are difficult to discover in vivo due to the large hams these pigs are bred for. Contemporary finishing pigs also reach slaughter weight by 5 months, but the observation that 23 of the 32 current lesions (72%) were located in the central and caudal thirds of the medial half of the femur agrees with the medial and caudal femoral shortening, angulation, and rotation seen in 8- to 9-month-old Landrace pigs in Figs. 1 and 2 of Reiland. 31 The mechanism for how lesions lead to deformity will have to be studied in older individuals, and with the current histological validation, this can be done by longitudinal CT scanning of sedated pigs.
The pathogenesis of physeal OC started with vascular failure that was morphologically identical to articular OC, and the heritable predisposition may therefore be the same in both sites. Vascular failure in the physis led to retention of viable chondrocytes, compared to chondrocyte necrosis in epiphyseal growth cartilage, and lesion markers and staging may therefore be different between the 2 sites. The mechanism for how lesions lead to angular limb deformity should be studied further in older pigs in future. The authors (would like to) dedicate this article to the memory of Associate Professor Sven Reiland (1935-2016).
Supplemental Material
Supplemental Material, DS1_VET_10.1177_0300985819843685 - Osteochondrosis in the Distal Femoral Physis of Pigs Starts With Vascular Failure
Supplemental Material, DS1_VET_10.1177_0300985819843685 for Osteochondrosis in the Distal Femoral Physis of Pigs Starts With Vascular Failure by Kristin Olstad, Bjørn Wormstrand, Jørgen Kongsro and Eli Grindflek in Veterinary Pathology
Footnotes
Acknowledgements
The authors are grateful to the skilled technicians at the Norsvin Delta test station; Torunn Aasmundstad, Norsvin; Sigrid Lykkjen, Norwegian University of Life Sciences; and Stina Ekman, Swedish University of Agricultural Sciences, for constructive discussions of the manuscript.
Declaration of Conflicting Interests
The author(s) declared no potential conflicts of interest with respect to the research, authorship, and/or publication of this article.
Funding
The author(s) disclosed receipt of the following financial support for the research, authorship, and/or publication of this article: The current study was funded by Norsvin and grant number 244212 from the Research Council of Norway. The work was not subject to any conflicts of interest.
Supplemental material for this article is available online.
References
Supplementary Material
Please find the following supplemental material available below.
For Open Access articles published under a Creative Commons License, all supplemental material carries the same license as the article it is associated with.
For non-Open Access articles published, all supplemental material carries a non-exclusive license, and permission requests for re-use of supplemental material or any part of supplemental material shall be sent directly to the copyright owner as specified in the copyright notice associated with the article.