
Abstract
The analysis and description of the appearance of cell death in tissue sections can add valuable information to research studies. The scoring/grading and quantification of cell death can be used either as part of a larger scoring scheme or as the final end point of a study. The degree of precision needed is study dependent and will be determined by the question being addressed and the complexity of the model. The methods one uses to quantify cell death are often guided by the tissue of interest. For example, in the brain, it is sometimes necessary to examine death of specific neuronal populations, whereas in more homogeneous tissue such as a tumor xenograft, quantification can be done on a whole-slide basis. In addition to examination of hematoxylin and eosin (HE)–stained sections, immunohistochemistry can be employed to highlight areas of cell death or to identify specific types of cell death, for example, when differentiating apoptosis from necrosis. Automated quantification can be useful in generating statistically comparable data from HE-stained or immunolabeled samples. The rapidly expanding classification of cell death requires the use of multiple techniques to identify them in vivo. This article will provide examples of how different methods of examining and quantifying cell death are used in a variety of research areas, ranging from semiquantitative evaluation in HE-stained intestine to automated quantification of immunohistochemistry-immunolabeled brain and tumor xenografts. The recently described process of necroptosis will be discussed briefly, with the description and example of the methods used to differentiate this from apoptosis.
Traditionally, when studying cell death, the primary role of the veterinary pathologist has been the morphological classification of cell death, specifically and most commonly the identification of necrosis vs apoptosis in hematoxylin and eosin (HE)–stained sections. This continues to provide integral information about pathogenesis, especially in providing evidence for in vivo mechanisms of cell death. Recently, a comprehensive review and recommendations for the differentiation and diagnosis of cell death in HE-stained sections have been published by the INHAND Apoptosis/Necrosis Working Group 3 in which specific criteria are explained to help differentiate these 2 morphologic subtypes of cell death. While imaging by electron microscopy is still considered the “gold standard” for the morphological identification of apoptosis vs necrosis, immunohistochemical labeling is often used as a surrogate method (ie, cleaved caspase-3, hereafter referred to as simply caspase-3). An increasing number of types of cell death are defined by their molecular mechanisms but cannot be differentiated morphologically in HE-stained sections. 6 The development of antibodies to identify these types of cell death in tissue sections is necessary in these instances, and it is important for the antibodies to be validated by rigorous methods such as those described in a recent consortium recommendation. 8 This article discusses the identification of necroptosis, which morphologically resembles necrosis but is mechanistically different. Other important types of cell death can be identified using immunohistochemical methods such as the labeling of LC3B and p62 for autophagy; examples of this are not included in this article, and the reader is directed to other references. 21,22
Semiquantitative Scoring/Grading of Cell Death
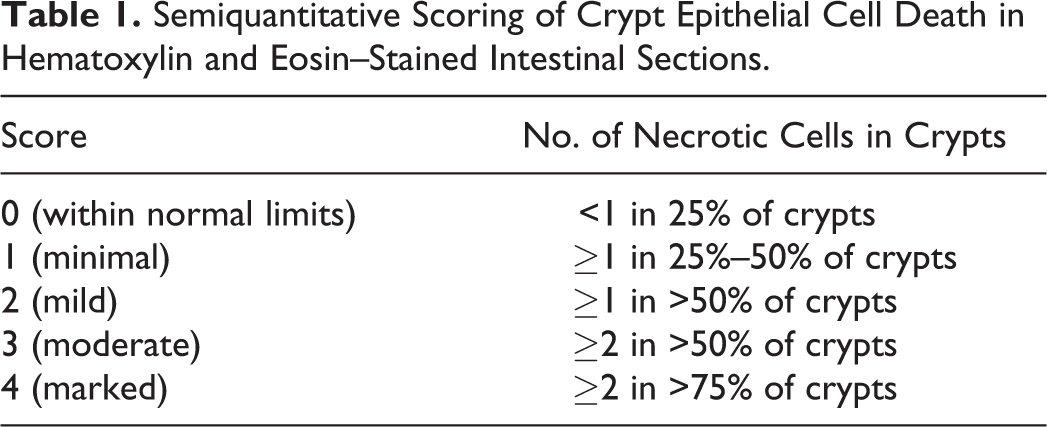
The terms scoring and grading are often used interchangeably in the literature, but it is considered by some that grading refers to a categorical descriptor (mild, moderate, etc), whereas scoring is the application of a number to that assessment. For the purposes of this article, the term scoring will be used to designate both. Depending on the model under investigation, the identification and scoring of cell death on an ordinal scale of minimal, mild, moderate, and severe may be sufficient. The approach used can depend on the tissue one is evaluating. For example, scoring of cell death in the small intestine is based on the evaluation of its entire length or specific regions thereof (duodenum, jejunum, and ileum) and can include the crypts and/or villi. The distribution of dead cells can be patchy, and therefore one must score based on an overall impression of the area of interest, and this procedure can make it difficult to obtain a focal representative image of the entire length. The example shown in Figs. 1–4 involves grading of cell death of the small intestinal crypt epithelium in a chemotherapy toxicology study where multisystemic effects were observed and cell death of the crypt epithelium was just one of the lesions evaluated. Scoring was performed on HE-stained tissue sections, with the semiquantitative scores based on both the number of dead cells per intestinal crypt and the percentage of all crypts affected, as detailed in Table 1. For this particular study, semiquantitative scoring provided enough information for the investigator without the need for further quantification.
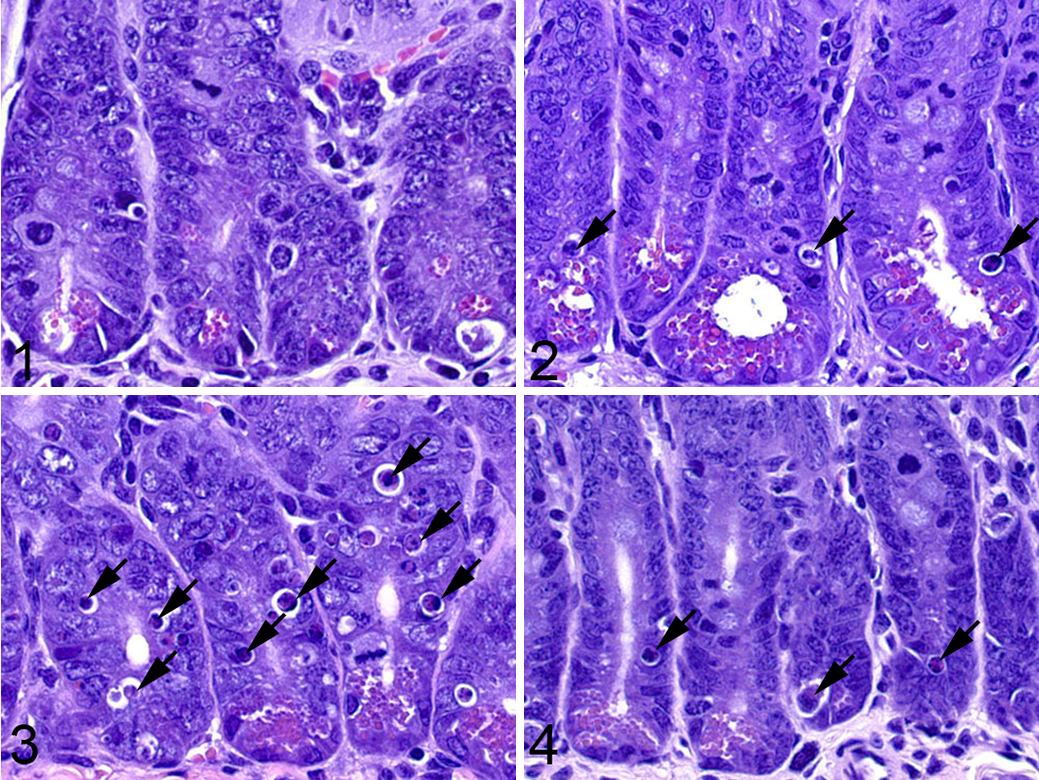
Semiquantitative scoring of crypt epithelial cell death in small intestine sections from a study examining drug effects in wild-type (WT) and knockout (KO) mice for the gene of interest.
Semiquantitative Scoring of Crypt Epithelial Cell Death in Hematoxylin and Eosin–Stained Intestinal Sections.
In studies where more extensive cell death involves larger areas of tissue rather than individual cells, it is often helpful to quantify lesions based on the percent area affected, either based on the whole tissue or a specific tissue compartment. A semiquantitative scoring method may be sufficient if there are large differences in severity between study groups, but precise quantitation of necrotic areas should be obtained using image analysis in studies where differences between groups are not as profound. In the example of cisplatin-induced acute renal tubular necrosis shown in Figs. 5–8, the percentage of necrotic renal cortical tubules within the whole section was estimated and scored. These semiquantitative estimates of necrotic area provided sufficient information to permit statistical evaluation of differences between mice of different genotypes and between treatment interventions. 17
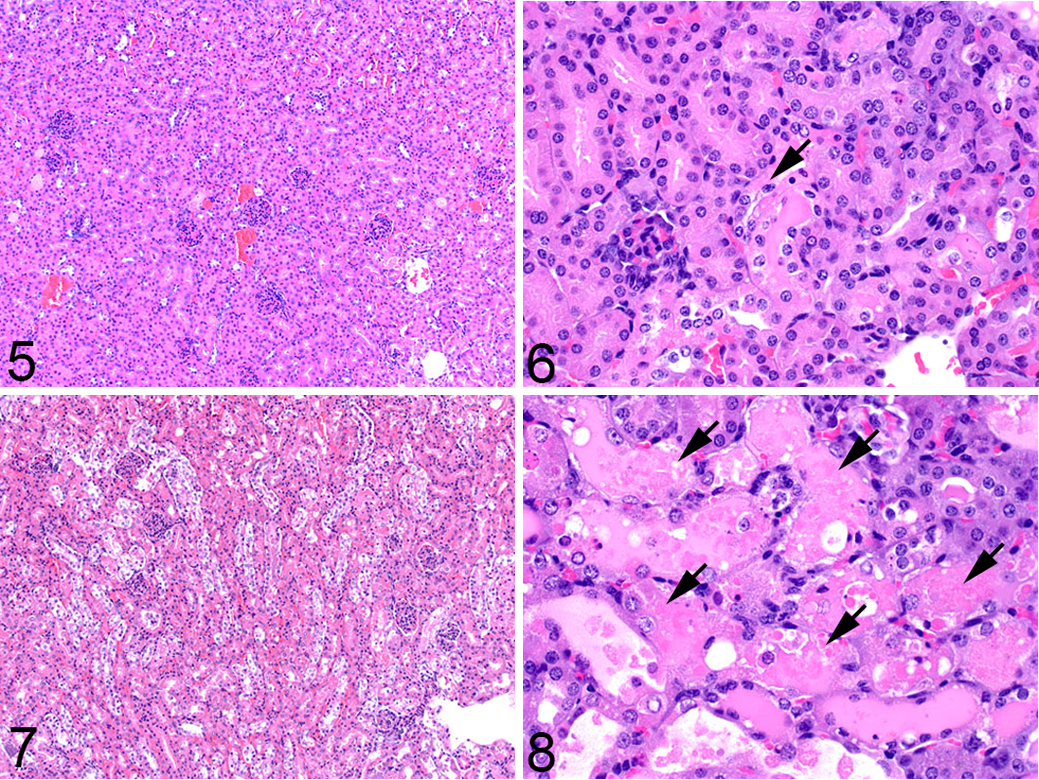
Semiquantitative scoring of necrosis in cisplatin-induced acute renal tubular necrosis in mice.
Quantification of Apoptosis
After apoptosis was identified as a type of cell death separate from necrosis, specific techniques were developed to identify it in tissue sections. The first was the terminal deoxynucleotidyltransferase-mediated dUTP nick end labeling (TUNEL) assay that labels the 3′-hydroxyl termini in the double-strand DNA breaks generated during apoptosis. Subsequently, an immunohistochemistry (IHC) method was developed to detect cleaved caspase-3 (hereafter referred to as simply caspase-3), which is one of the main executioners of apoptosis; this assay is a more specific marker of apoptosis than TUNEL (discussed below) and is now the most commonly used assay for apoptosis in tissue sections.
Quantification of IHC labeling may be done in a semiquantitative or quantitative manner, both of which have validity as long as one adheres to key principles, which have been reviewed elsewhere. 15 Labeling for TUNEL or caspase-3 can be very useful in studies that require more precision, as it allows for automated quantification. The end point can be expressed either as a percent area or as a percentage of cells (including apoptotic bodies and dying cells). The labeling is dependent on the model, as the staining pattern and thus the resulting data are influenced by factors such as tissue heterogeneity (sporadic apoptosis vs large areas of apoptosis admixed with secondary necrosis) and timepoint of the study (early vs late). The example shown in Figs. 9–12 is from a study in which mouse embryonic fibroblasts (MEFs) from mice of different genotypes were used to generate flank tumors. IHC for caspase-3 was performed, slides were scanned using the Aperio ScanScope (Leica Biosystems Inc, Buffalo Grove, IL), and the image was analyzed using the positive pixel count algorithm in ImageScope software. In this algorithm, each pixel within a defined region of interest (the entire tumor in this example) was labeled as weak, moderate, or strong, and a markup image was generated. The data end point may be chosen to include any combination of those intensities, and in this example, moderately and strongly labeled pixels were considered positive. As the flank tumors are relatively homogeneous, a simple positive pixel count algorithm was sufficient to quantify the percentage of the tumor labeled. In other cases where the labeling pattern may be more discrete, a nuclear count algorithm can be used and the data expressed as percent positive cells. 11,28
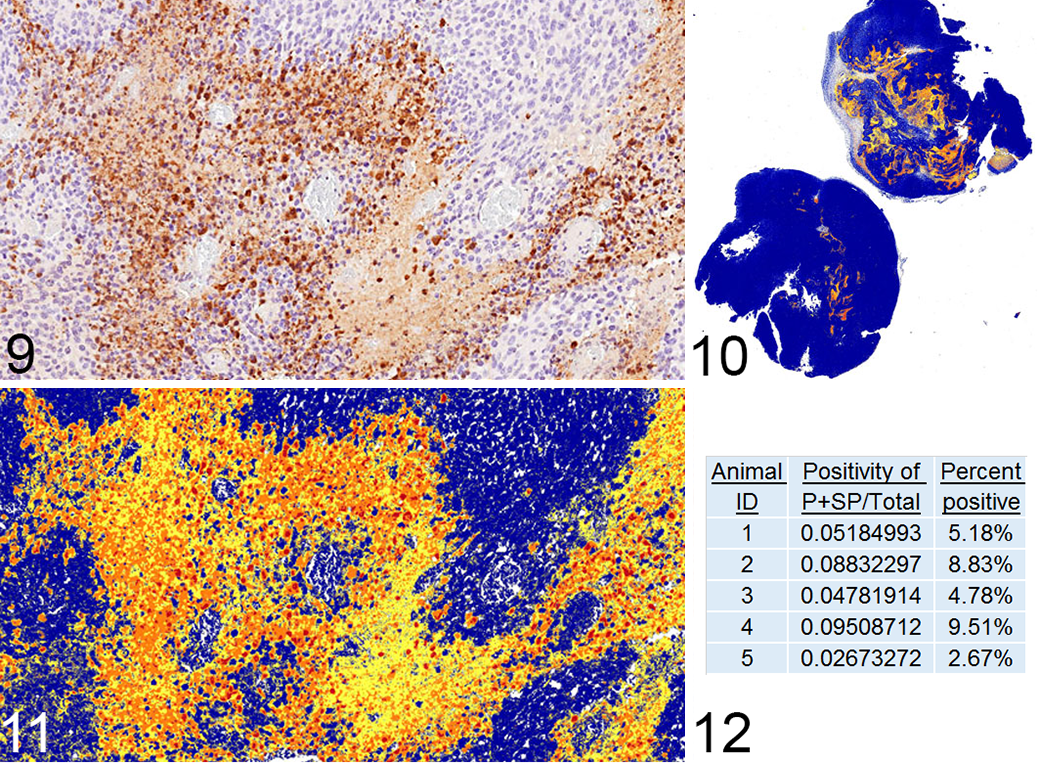
Use of image analysis to quantify apoptosis in mouse flank tumors on a percent area basis.
In cases where the output is the number of labeled cells per unit area, the number of cells in a specific number of high-power fields (HPFs) can be counted. In cases where one wishes to quantify the entire section or large areas of a slide, digital slide scanning can be helpful for determining area measurements and/or subsequent automated cell counting. This is especially useful in studies quantifying cell death in the brain, as in the example shown in Figs. 13–15, which investigated global changes in the brain when leukemia was present in the meninges, with and without a dietary intervention. Three sections from each brain were labeled for caspase-3 and digitally imaged; the brain tissue was outlined to obtain the total brain area present on the slide (Fig. 13). This particular study was not amenable to automated cell quantification, so manual counting of cells was performed (Fig. 14), and these data were combined to obtain the number of labeled cells per square millimeter (Fig. 15). Quantification within anatomically complex tissues such as the brain can require more precision in defining the specific area of analysis. In an example from the literature, the amount of caspase-3 labeling in different brain regions of neonatal rats was quantified. 18 In this study, researchers collected sections at 3 levels corresponding to specific figures in the P7 rat brain atlas and then selected specific regions of interest at those levels. Image analysis was performed using a customized macro that ran in ImageJ (FIJI 20 ) to automatically count the labeled cells in each region, and the data were expressed as positive cells per square millimeter. These previous examples demonstrate the traditional approaches by which cell death can be quantified, ranging from the more simple semiquantitative measures to increasingly complex systems that require the use of image analysis. Numerous image analysis software programs are commercially available, in addition to those noted above. The reader is referred to an article describing various platforms and their utility. 28
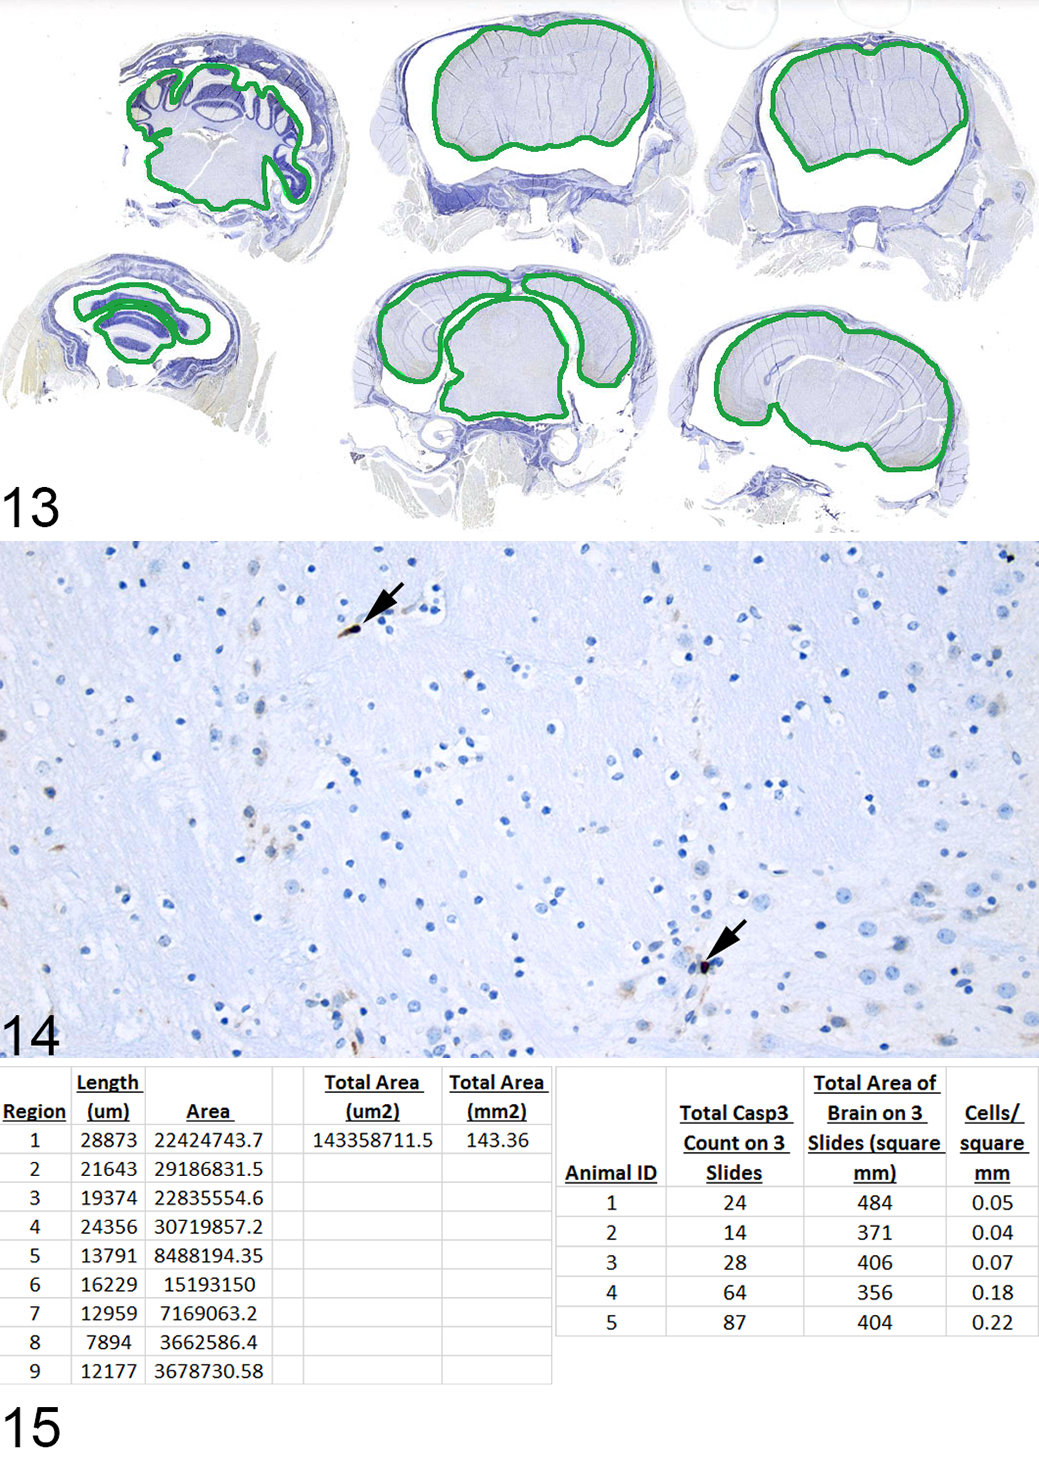
Use of whole-slide scanning to measure tissue area when quantifying the number of labeled cells per unit area. Brain, mouse.
Methods for Classifying the Types of Cell Death
The classification of cell death has become increasingly complex, and the characterization of cell death has moved beyond the use of morphology alone as the defining parameter. As different types of cell death began to be described, a unified set of criteria for the definition of cell death and of different cell death morphologies was needed, hence the creation of the Nomenclature Committee on Cell Death (NCCD), which published its first set of recommendations in 2005. 12 At that time, an emphasis was placed on apoptosis, autophagy, and necrosis. However, in that same year, the term necroptosis was coined to describe the process of death receptor–induced nonapoptotic cell death; 1 the characterization of necroptosis was made possible by the discovery of a specific inhibitor, necrostatin 1. This was an important discovery because it contradicted the long-held view that cell death consists of a dichotomy defined by morphologic features. Necrosis had been considered “accidental cell death,” which induces an immune response, whereas apoptosis was the sole type of programmed cell death and was immunologically silent. 7 Numerous examples have since demonstrated that the morphologic and functional aspects of cell death are not necessarily linked. Programmed cell death does not always manifest with an apoptotic morphology and can indeed induce inflammation. Similarly, even cases of cell death that do manifest an apoptotic morphology can activate an immune response. 5 The NCCD published further recommendations in 2009, 13 2012, 7 and 2015, 5 with its most recent update in 2018. 6 The classification of cell death is now defined predominately by its molecular features rather than morphology.
The most exciting aspect of programmed cell death is that it occurs as a result of specific genetically encoded molecular events and is thereby subject to modulation by genetic and/or pharmacologic interventions. It is for this reason that numerous diverse diseases are being investigated to specifically define the types of cell death involved in their pathogenesis. Necroptosis has been identified to have a role in a variety of conditions, most convincingly in sepsis, neurodegeneration, and ischemia-reperfusion injury. 29,32 To answer the questions being asked in such studies, the method of classifying cell death needs to go beyond morphology, especially in those specifically examining the role of different molecules in the necroptotic pathway. One example of this involves studies looking at the differential contribution of 2 modulators of cell death, caspase-8 and RIPK3, to adult tissue homeostasis. 30 Deletion of caspase-8, a main initiator in the apoptotic pathway, is embryonic lethal, but this lethality can be rescued by concurrent deletion of RIPK3, suggesting that the lethality in caspase-8 knockout (KO) mice is due to RIPK3-induced necroptosis. 16 Since caspase-8 deletion is embryonic lethal, the systemic acute deletion of caspase-8 in adults was examined in a conditionally inducible model. 30 Rosa26.CreER, casp8 f/f mice, with or without the RIPK3 gene, were gavaged with tamoxifen to induce the deletion of caspase-8. This resulted in severe weight loss and lethality in Rosa26.CreER+, casp8 f/f, ripk3 +/+ (CreER+, RIPK3WT) mice due to marked enterocyte death in the intestine with secondary inflammation. Cell death in the intestine was examined by TUNEL staining and IHC labeling of caspase-3 with subsequent quantification of each. To quantify and further define the type of cell death occurring in the enterocytes, the number of TUNEL-positive (Figs. 16–19) or caspase-3–positive cells in 100 complete, well-oriented crypts was counted. This method of counting the number of positive cells within a specified number of crypts is the standard practice for quantification of labeling in intestinal tissue sections. 14,24,26 An alternative method would be to quantify based on the percentage of positive cells per total cell number in either a specified number of crypts or length of intestine. 10,31 The number of TUNEL-positive cells increased to the greatest degree in Rosa26.CreER+, casp8 f/f, ripk3 +/+ (CreER+, RIPK3WT) mice. In the Rosa26.CreER+, casp8 f/f, ripk3 –/–(CreER+, RIPK3–/–) mice, there was still an increase in TUNEL-positive cells but at a significantly lower level than with the caspase-8 alone deletion, indicating that RIPK3 deficiency protects from the effects of acute deletion of caspase-8 (see Fig. 2d in Weinlich et al 30 for data). In all cases, the TUNEL counts were much higher than those for caspase-3. At that time, there were no specific markers for the process of necroptosis in tissue sections, and the presence of TUNEL-positive/caspase-3–negative labeling was considered indicative of necroptosis. It is now known that TUNEL labels cells dying by all forms of regulated necrosis (ie, necroptosis, ferroptosis, pyroptosis, and apoptosis). 23 It is also suspected to artifactually label necrotic cells, or cells dying by “accidental cell death.”
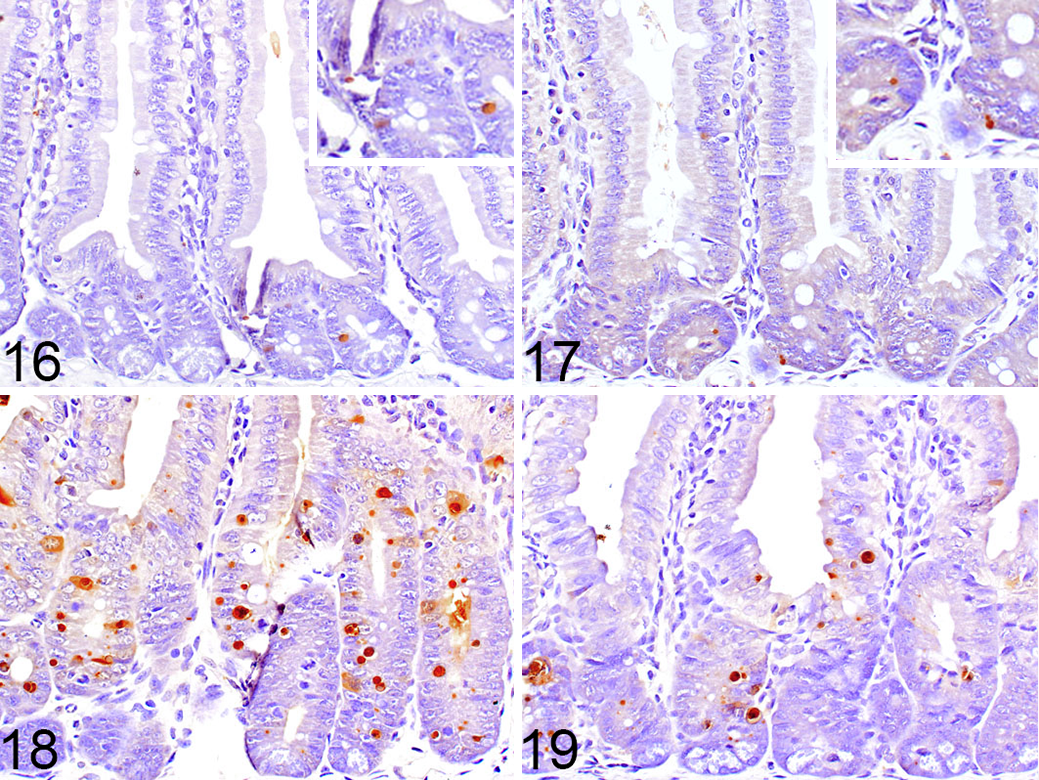
Terminal deoxynucleotidyltransferase-mediated dUTP nick end labeling (TUNEL) labeling of intestines from mice of different genotypes.
Since then, a more specific marker of necroptosis has been identified, phosphorylated MLKL, which is a downstream target of RIPK3 and acts as the final effector of necroptosis by forming pores in the plasma membrane. 2,25 Antibodies to human and mouse phosphorylated MLKL have been developed; however, in mice, the available antibodies currently only work well for Western blotting, 19 whereas in humans, they have been used for immunohistochemistry to label for necroptosis in tissue sections. 4,25 At present, the best indicator of necroptosis in mouse tissues is the presence of TUNEL-positive/caspase-3–negative labeling. Therefore, although it is often preferable to avoid TUNEL due to the technical difficulties this assay can present, for now, it is necessary in mouse studies characterizing cell death.
It is especially important in these situations to ensure the highest quality tissue fixation as possible. The various difficulties in interpreting the TUNEL assay due to artifacts and nonspecific labeling have been discussed elsewhere, 9,27 and inadequate tissue fixation has been postulated to be one contributing factor. We tested the effect of perfusion vs delayed fixation for 5, 20, and 60 minutes after death on the amount and quality of TUNEL labeling in the intestine. We found that the villous enterocytes are especially sensitive to the effects of delayed fixation. Ideal fixation and labeling were obtained when the mice were perfused (Fig. 20), whereas a slightly increased amount of nonspecific labeling occurred with a fixation delay as short as 5 minutes (Fig. 21). A 20-minute delay in fixation caused significant nonspecific labeling (Fig. 22), and a 60-minute delay resulted in uninterpretable labeling with unacceptably high levels of background staining (Fig. 23). The effects of delayed fixation on TUNEL staining appear to be tissue specific, as spleen and thymus were processed similarly, and they showed no significant difference in the amount of TUNEL labeling between the different time points in samples of spleen, the average number of positively labeled cells in 10 HPFs was 61, 38, 65, and 43 in perfused tissue and tissues fixed after a delay of 5, 20, and 60 minutes, respectively, P = .11; thymus data not shown).
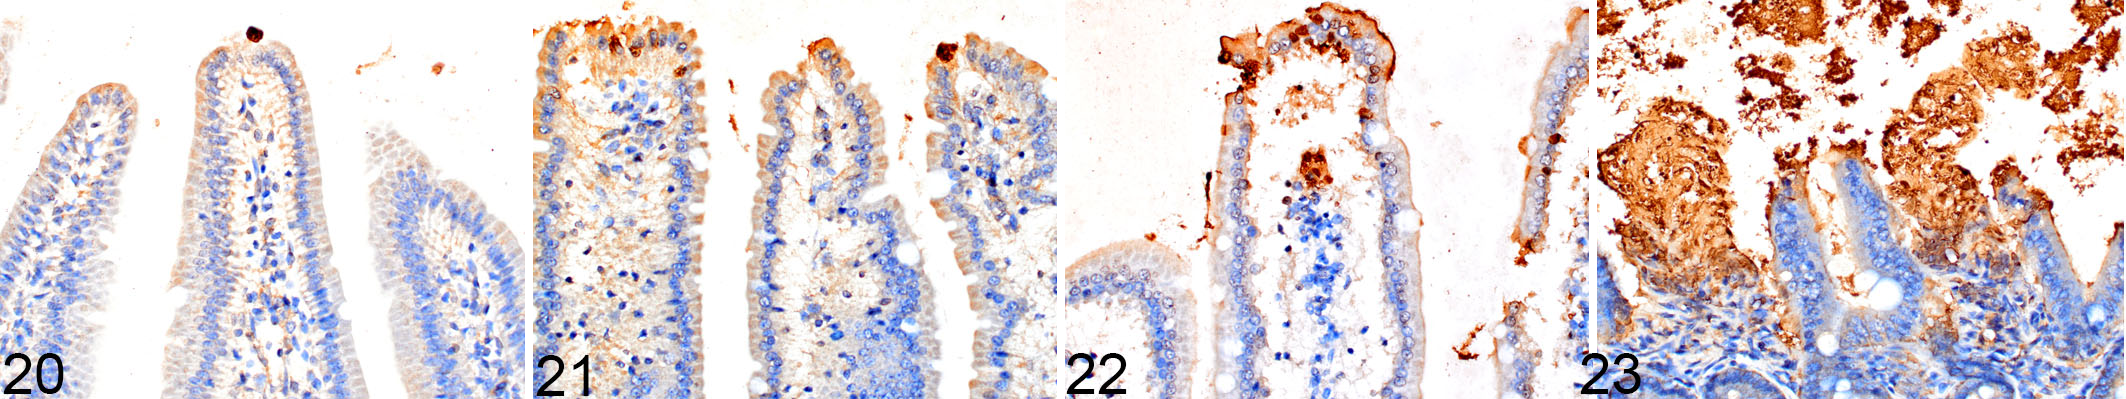
Terminal deoxynucleotidyltransferase-mediated dUTP nick end labeling (TUNEL) labeling of mouse small intestinal villi after perfusion compared to delayed fixation.
As the number of different types of cell death continues to increase, so will the markers that define them. The ability to quantify these specific types of cell death in tissue sections will depend on the production of target-specific antibodies that have been validated for use in immunohistochemical assays. The involvement of a pathologist in studies on cell death will help to define the in vivo significance of these different types of cell death and the mechanisms that underlie them.
Footnotes
Declaration of Conflicting Interests
The author(s) declared no potential conflicts of interest with respect to the research, authorship, and/or publication of this article.
Funding
The author(s) received no financial support for the research, authorship, and/or publication of this article.