
Abstract
Integration of new technologies, such as digital microscopy, into a highly standardized laboratory routine requires the validation of its performance in terms of reliability, specificity, and sensitivity. However, a validation study of digital microscopy is currently lacking in veterinary pathology. The aim of the current study was to validate the usability of digital microscopy in terms of diagnostic accuracy, speed, and confidence for diagnosing and differentiating common canine cutaneous tumor types and to compare it to classical light microscopy. Therefore, 80 histologic sections including 17 different skin tumor types were examined twice as glass slides and twice as digital whole-slide images by 6 pathologists with different levels of experience at 4 time points. Comparison of both methods found digital microscopy to be noninferior for differentiating individual tumor types within the category epithelial and mesenchymal tumors, but diagnostic concordance was slightly lower for differentiating individual round cell tumor types by digital microscopy. In addition, digital microscopy was associated with significantly shorter diagnostic time, but diagnostic confidence was lower and technical quality was considered inferior for whole-slide images compared with glass slides. Of note, diagnostic performance for whole-slide images scanned at 200× magnification was noninferior in diagnostic performance for slides scanned at 400×. In conclusion, digital microscopy differs only minimally from light microscopy in few aspects of diagnostic performance and overall appears adequate for the diagnosis of individual canine cutaneous tumors with minor limitations for differentiating individual round cell tumor types and grading of mast cell tumors.
Keywords
Recent technical advancements in digital pathology enable a quick acquisition of high-resolution whole-slide images (WSI) by digitalization of glass slides with slide scanners. These digital slides allow for the management, interpretation, and annotation of histologic sections with standard computer screens, a technology referred to as digital microscopy (DM) or digital pathology. 6 In contrast to static digital images, DM enables the observer to explore the slides in a more dynamic way that is comparable with light microscopy (LM), including the options to move horizontally at different magnifications on WSI with extremely high resolution almost equivalent to a glass slide.
With the development of high-performance slide scanners and user-friendly image viewing and analysis software, DM has become increasingly feasible for many applications in veterinary pathology, especially in teaching and research. Recently, many human pathology diagnostic laboratories and an increasing number of veterinary pathology diagnostic laboratories have integrated DM as their main modality for routine diagnostic work on-site but also off-site for telepathologic diagnosis and secondary consultation. 2,8,29,30
However, there are limitations of DM, which occasionally creates skepticism among some pathologists and therefore still limits implementation of DM as the main modality for diagnosing histopathologic specimens in many institutions. Among others, these include that most slides are scanned at a low magnification of 200× and that only 1 focal plane of the slide is usually scanned because of the otherwise huge file size, required data storage capacity, and the tremendous scanning time of multiple planes by z-scanning. 6 Digital fine focusing and magnifications similar to LM are therefore usually not available although technically possible. Many pathologists thus fear a loss of cell details because of inferior resolution and subsequent inferior diagnostic reliability.
Nevertheless, DM is increasingly used in many diagnostic veterinary laboratories, although there are no validation studies of this technology available in this field. Usually, a new technology should be validated before its integration into a standardized laboratory routine to ensure a consistent performance, reliability, specificity, and sensitivity. 24 In human pathology, guidelines have already been developed for the technical requirements of digital pathology and their validation for diagnostic purposes. 12,24 In recent validation studies available in human pathology, there is evidence that DM has high concordance with LM in many applications, such as dermatopathology. 1,3,13,18,22,24,27 However, the feasibility of DM is still controversial for some fields, such as cytology. 34
In veterinary medicine, a validation study of DM is currently lacking but is crucial to facilitate implementation of DM for routine diagnosis. The aim of the current study was to validate the suitability of DM in terms of diagnostic accuracy, speed, and confidence for histopathologic diagnosis of various common canine cutaneous tumors compared with classical LM. In addition, we determined possible differences in differentiating individual tumor types within the categories of round cell, epithelial, and mesenchymal tumors and the impact of magnification of WSI scanned at 200× or 400× magnification.
Materials and Methods
Specimens
Surgical biopsies of 17 different types of common canine cutaneous tumors were selected from the archive of the Institute of Veterinary Pathology at the Freie Universität Berlin according to their initial diagnosis made during routine diagnostic service going backward in their archival order (Suppl. Table S1). The tumor types were mast cell tumors, cutaneous histiocytoma, lipoma, perianal gland adenoma, sebaceous gland adenoma, squamous cell carcinoma, melanocytic tumors, basal cell tumors, malignant peripheral nerve sheath tumors, papilloma, apocrine adenocarcinoma, hemangioma, hemangiosarcoma, fibroma, fibrosarcoma, plasmacytoma, and lymphoma. For all cases, the initial routine diagnosis was at least 1 year prior to the start of the study to exclude case recall by the pathologists. Specimens with poor tissue quality were excluded. A total of 60 cases including 26 cases of 6 different types of epithelial tumors, 14 cases of 6 different types of mesenchymal tumors, and 20 cases of 3 different types of round cell tumors were chosen as mandatory slides, which all participating pathologists were required to examine. An additional 20 cases of 5 different round cell tumors were selected as optional slides, which the participating pathologists could examine voluntarily. Participants were blinded to the included tumor types and frequency of occurrence in the study. For each case, a single representative tissue block was chosen, and slides were prepared following standard protocols: slides were prepared at a thickness of 0.5–1 μm by the same technical assistant on the same day and stained with hematoxylin and eosin (HE) by a tissue stainer (ST5010 Autostainer XL, Leica, Germany). An additional slide stained with toluidine blue was prepared for the 20 cases of voluntary round cell tumors. All glass slides were digitalized to produce WSI using a linear scanner (ScanScope CS2, Leica) in 1 focal plane by default settings. Thirty of the mandatory tumors were scanned at a magnification of 200× (image resolution: 0.5 μm/pixel), and the other 30 mandatory slides were scanned at 400× (image resolution: 0.25 μm/pixel) with the same composition of cases of different tumor types. The 20 voluntary slides of round cell tumors were scanned exclusively at 400× magnification. The quality of scanned slides was considered adequate when the quality factor provided by the Leica digital pathology software was greater than 95%. If it was below 95%, sufficient glass and digital slide quality was confirmed manually or the slide was rescanned in 4 cases (scan failure rate: 5%).
Tissue Samples and Chronology
Each slide was examined 4 times by the participating pathologists, twice as a glass slide and twice as a WSI at 4 different examination time points. Between each of the 4 time points, there was a time lag of at least 4 weeks. The order of slides was randomized for each time point. Time points 3 and 4 were exact repeats of time points 1 and 2, respectively.
The slides were separated into 2 groups, group A and B for mandatory slides and group C and D for voluntary slides, with the same number of different tumor types in each group (Table 1). Slides of group A and C were examined as glass slides using a light microscope at examination time points 1 and 3 and as WSI at examination time points 2 and 4. Accordingly, slides of group B and D were examined as WSI at examination time points 1 and 3 and as glass slides at time points 2 and 4. WSI of the mandatory slides were further subdivided into 2 groups of slides that were scanned at a magnification of 400× (group A1 and B1) or 200× (group A2 and B2), respectively. Both group A and B as well as C and D had a similar composition of tumor types. In total, each pathologist examined 60 mandatory slides (including glass slides and WSI) and potentially 20 voluntary slides (including glass slides and WSI) at each time point.
Study Design, Including the Schedule for Examination of Whole-Slide Images (WSI) and Glass Slides at the 4 Time Points.a
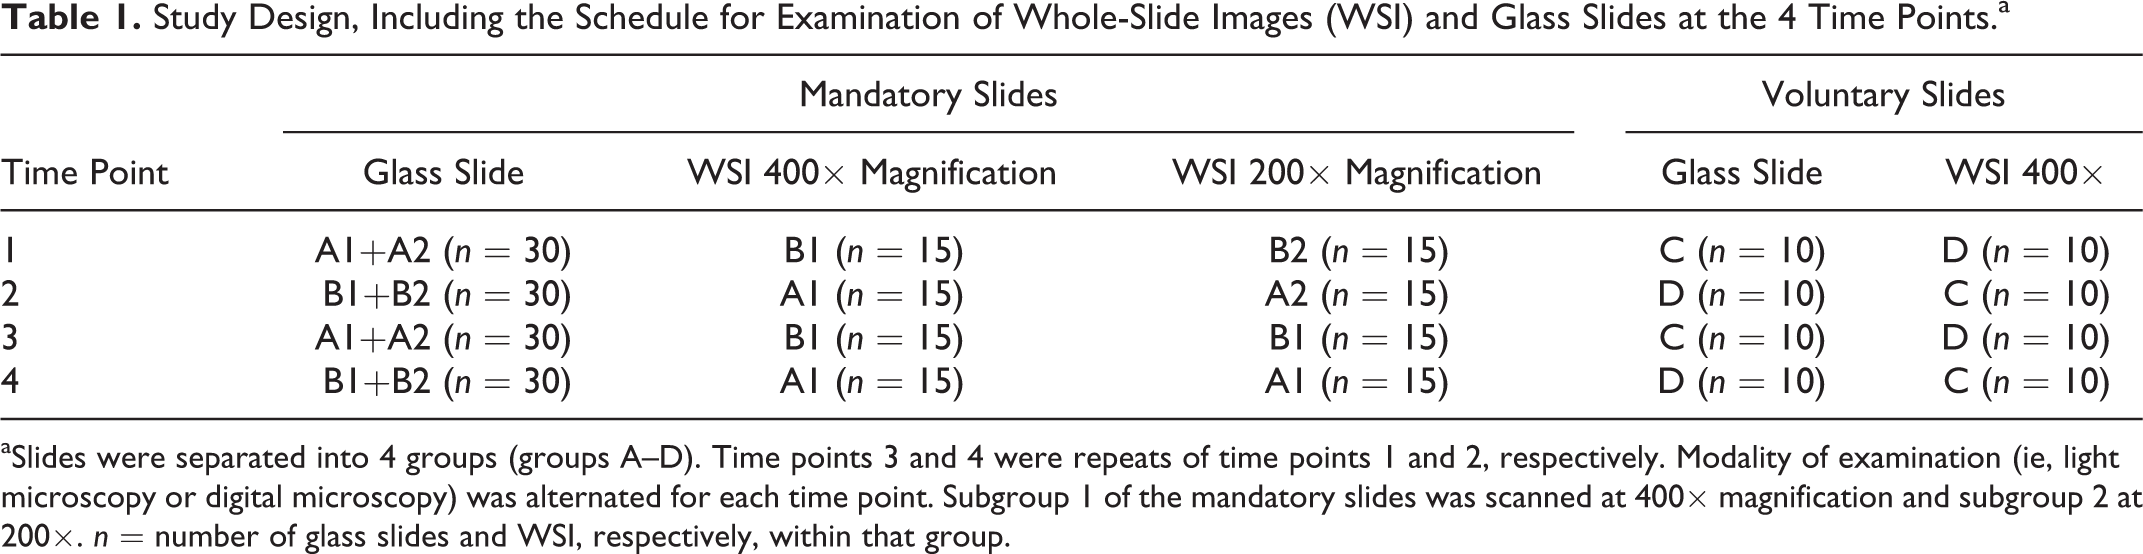
aSlides were separated into 4 groups (groups A–D). Time points 3 and 4 were repeats of time points 1 and 2, respectively. Modality of examination (ie, light microscopy or digital microscopy) was alternated for each time point. Subgroup 1 of the mandatory slides was scanned at 400× magnification and subgroup 2 at 200×. n = number of glass slides and WSI, respectively, within that group.
Participants
Six pathologists (5 European or American board-certified and 1 German national-certified specialists for veterinary pathology) participated in the study. Five of them (participants 1–5) examined the 20 voluntary slides of round cell tumors in addition to the 60 mandatory slides. Three participants were highly experienced in routine diagnosis of cutaneous tumors; 1 pathologist had moderate and 2 pathologists had only little experience in the diagnosis of canine cutaneous tumors.
The pathologists involved had used DM sometimes (n = 2), rarely (n = 1), or never (n = 2) for diagnosis of tissue sections before the study. The sixth pathologist had used DM before the study on a regular basis but mainly for quantitative pathologic assessment of laboratory animal research studies. Accordingly, participants estimated their confidence in DM as moderate (n = 2), little (n = 1), or very little (n = 3) prior to the study. In contrast, they were very much (n = 4), much (n = 1), or moderately (n = 1) confident in diagnosing with LM.
Technical Equipment
Glass slides were examined at the pathologist’s individual light microscopes at a maximum magnification of 400×. The fields of view of the microscopes varied between the different pathologists, ranging from field number 22 to 25 (Suppl. Table S2).
WSI were viewed with web viewer (Aperio eSlide Manager, Leica) or Image Scope (Aperio Image Scope, Leica) software depending on the participant’s preferences. Prior to the study, participants were encouraged to familiarize themselves with the software by viewing a training slide of healthy canine skin scanned at 400× magnification. WSI were examined from the on-site personal computer of the participant and accessed via Internet connection (1.0 GBit) by 4 pathologists (participants 1–4), accessed through an external hard disk drive (participant 5) or off-site by a laptop computer at home (participant 6) via a 100-Mbit Internet connection. All 6 pathologists used a common computer mouse with a scroll wheel as input device. Monitor size and resolution varied slightly between participants (Suppl. Table S2). Monitors had not been color calibrated prior to the study. Of note, color calibration has not yet been shown to have a significant impact on diagnostic performance for HE-stained WSI. However, color calibration may improve diagnostic speed and confidence. 10,17
Examination of Slides
Five participants examined the exact same glass slide that was used to produce WSI; 1 pathologist examined the immediate consecutive glass slide of the one that had been digitalized. The pathologists were not provided with any additional information other than the animal species. It is acknowledged that the lack of clinical data may reduce concordance in comparison with the gold standard diagnosis. 20 Participants were blinded for the included tumor types and their frequency of occurrence in the study. In addition, they were blinded to their previous specific diagnoses of the respective case and the diagnoses of the other participants throughout the examination time points. Histopathologic diagnosis of the specific tumor types (eg, lymphoma, mast cell tumor, squamous cell carcinoma, etc) was entered into a form sheet (Suppl. Table S3). Diagnosis was not predefined in form and extent; however, participants were asked to establish an individual diagnosis as specific as they would provide it to clinicians, consistently throughout the 4 examination time points. In cases of the diagnosis “mast cell tumor,” the participants were asked to perform a 2-tier tumor grading into low or high grade according to Kiupel et al. 16 For each diagnosis, the required time was measured. The suspected confidence level of the diagnosis was assessed by a 5-choice interval scale (1 = 100%–95%, 2 = 94%–75%, 3 = 74%–50%, 4 = 49%–25%, 5 ≤ 24%). Technical quality of each digital and glass slide was evaluated by a Likert-type scale question with 5 response options (1 = perfect; 2 = sufficient; 3 = questionable; 4 = insufficient; 5 = unfeasible). Slide quality parameters included tissue and glass slide preparation, and in the case of WSI, it also included the scanning process and viewing monitor (resolution, color reproduction). It was not possible to order additional sections or slides or to request a rescan if the quality of the WSI was considered poor. Mitotic figures were determined for the 20 voluntary round cell tumors by 5 participants (groups C and D).
Survey
Participants filled out a short initial survey prior to the first time point and a concluding survey after the fourth time point to determine their perception on DM (Suppl. Table S4).
Data Analysis and Statistics
Intraobserver concordance or discordance was analyzed exclusively, while interobserver comparison was disregarded. The diagnosis was not compared with the initial diagnosis of the routine diagnostic service, and a gold standard diagnosis was not taken into consideration. Concordance was defined as complete agreement between 2 diagnoses of specific tumor types between 2 time points within the same pathologist. A paired diagnosis was considered discordant with any disagreement between the 2 diagnoses of specific tumor types. A total of 1840 diagnoses were available for statistical analysis, with 920 diagnoses (480 non–round cell tumors [240 at 200× and 240 at 400× magnifications] and 440 round cell tumors [120 at 200× and 320 at 400× magnification]) examined with each modality (ie, DM and LM), respectively. Diagnostic performance was evaluated in 3 different pairs: performance between LM and DM, performance of LM and LM, and performance of DM and DM.
For statistical analysis, SPSS Statistics 24 for Windows (IBM, New York, NY) was used. Intraobserver agreement of diagnosis of specific tumor types and mast cell tumor grading were analyzed by the κ value for paired diagnoses. The Kappa (κ) value is a measure of the level of agreement that is corrected by chance and was evaluated as poor = 0, slight = 0.01–0.20, fair = 0.21–0.40; moderate = 0.41–0.60, substantial = 0.61–0.80, almost perfect = 0.81–1.00. Noninferiority of diagnostic performance between the 2 modalities was determined by a 1-sided binominal test with a noninferiority margin of 5%. The noninferiority test determines whether efficiency of the tested subject (here DM) is equivalent or noninferior to the method currently used (here LM). Required diagnostic time, diagnostic confidence, and technical quality were analyzed by a multivariable generalized linear mixed model using the specimen number within the time point as a random effect to account for repetition of slides for each time point. Risk factors tested for diagnostic time in the model were the modality used (ie, LM and DM), study participant, diagnostic confidence, technical quality, and the category of tumor (ie, epithelial and mesenchymal tumor as well as round cell tumor). Categories 4 and 5 of the 5-choice scale of diagnostic concordance and technical quality were combined into 1 category for statistical analysis because of the low number of category 5 choices. The logarithm of 10 was taken of the diagnostic time, and a confidence interval of 95% (95% CI) was indicated. Intraobserver correlation of mitotic figure numbers counted by DM and LM was determined by regression line of the scatterplot and concordance correlation coefficient. In total, mitotic figures were assessed in 345 cases. Agreement between participants (interobserver) was assessed by 1-factorial variance analysis (Tukey test). The logarithm of 10 was taken of the mitotic figures for statistical analysis.
Results
Diagnostic Concordance
Overall diagnostic concordance with DM in comparison to LM (LM to DM) for differentiating and diagnosing individual tumor types was 85.7% for all 80 tumor cases, 91.4% for diagnoses of individual tumor types within the category epithelial and mesenchymal tumor, and 80.0% for diagnoses and differentiating of individual tumor types within the category round cell tumor (Fig. 1). There was an increase of diagnostic concordance from the early time point to the late time point (Table 2). DM was noninferior to LM for all cases combined (Table 2; for results of each participant, see Suppl. Table S5). Comparing the different tumor groups, differentiating individual tumors types within the category epithelial and mesenchymal tumors were noninferior with DM compared with LM (Table 3; for results of each participant, see Suppl. Table S6), while differentiating individual tumor types within the category round cell tumors showed a slightly lower concordance with DM than by LM (Table 4; for results of each participant, see Suppl. Table S7). However, κ values showed substantial agreement between the 2 modalities for tumors of the category round cell tumors (κ = 0.721), while agreement was almost perfect for tumor cases of the category epithelial and mesenchymal tumors (κ = 0.911) and for all tumor cases of both categories combined (κ = 0.848).
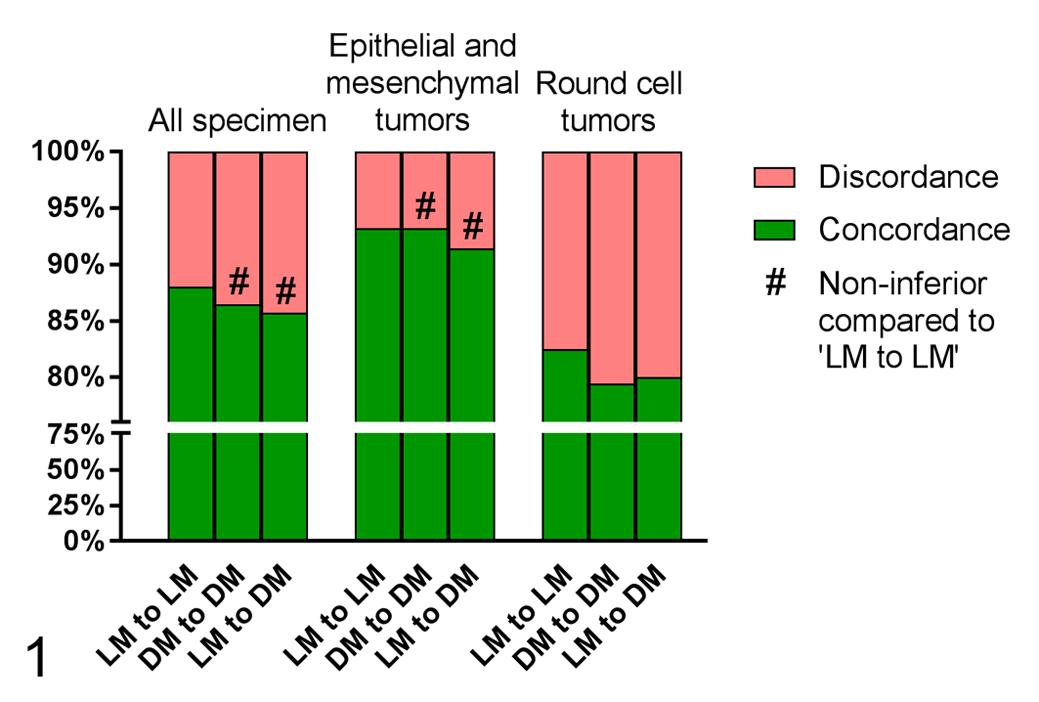
Comparison of intraobserver diagnostic concordance and discordance between the 2 modalities light microscopy (LM) and digital microscopy (DM) for diagnoses of specific tumor types. Shown are the findings for all 80 tumor cases, including 17 different tumor types, separated into the categories epithelial and mesenchymal tumors (40 cases with 12 different tumor types) or round cell tumors (40 cases with 5 different tumor types). Concordance was defined as complete agreement between paired diagnoses of individual tumor types.
Comparison of Intraobserver Diagnostic Concordance of LM Against DM for Differentiation of Specific Tumor Types.a
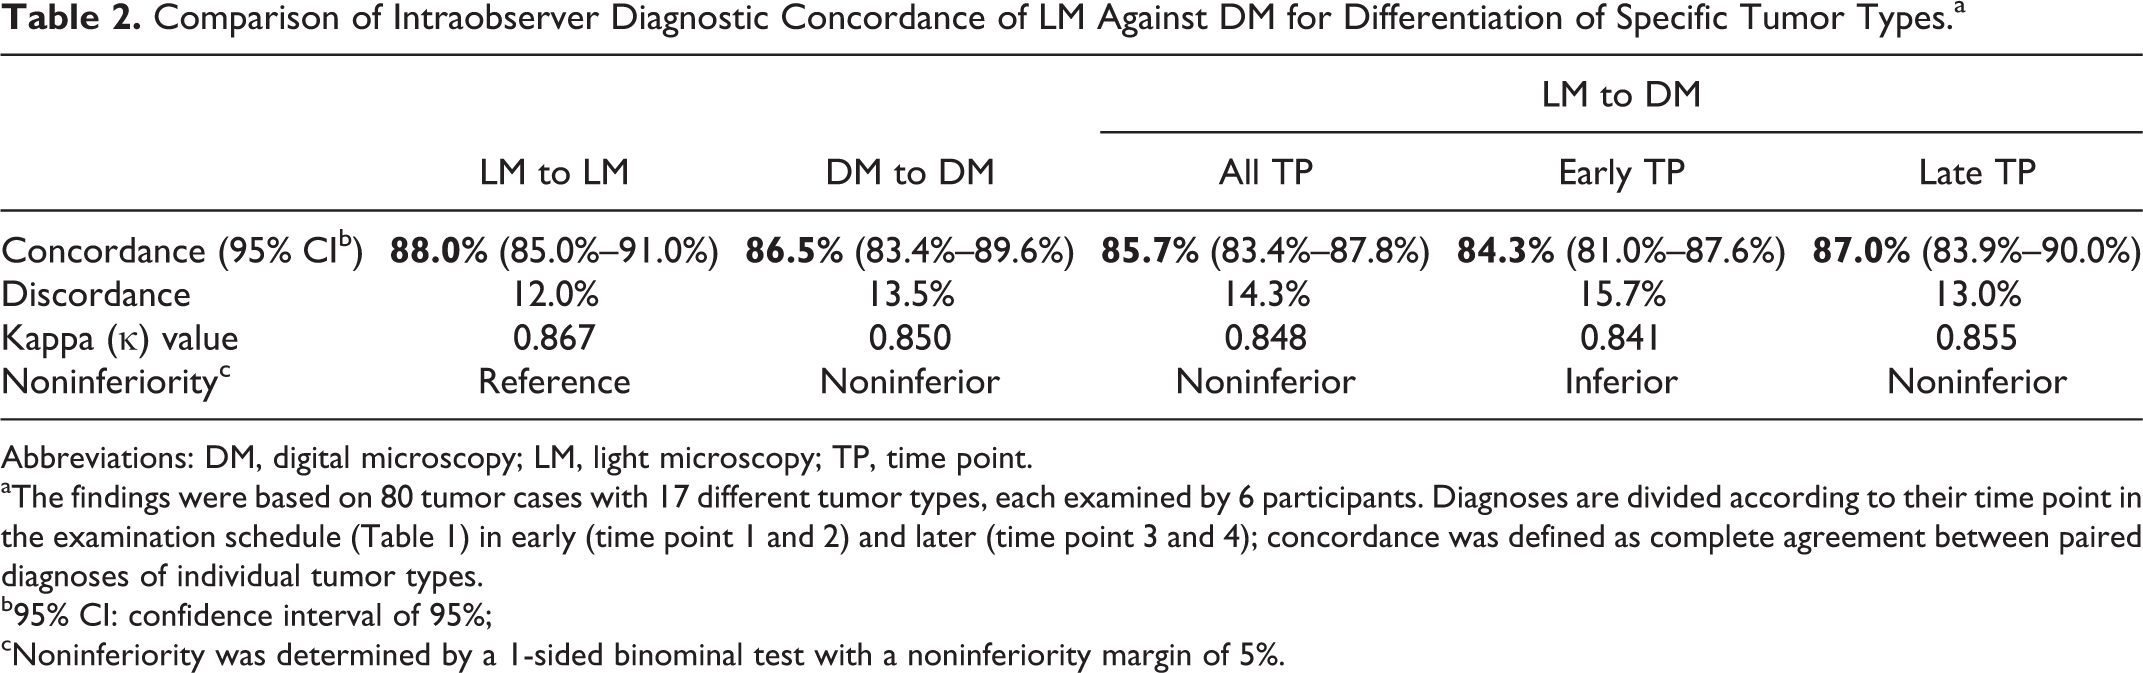
Abbreviations: DM, digital microscopy; LM, light microscopy; TP, time point.
aThe findings were based on 80 tumor cases with 17 different tumor types, each examined by 6 participants. Diagnoses are divided according to their time point in the examination schedule (Table 1) in early (time point 1 and 2) and later (time point 3 and 4); concordance was defined as complete agreement between paired diagnoses of individual tumor types.
b95% CI: confidence interval of 95%;
cNoninferiority was determined by a 1-sided binominal test with a noninferiority margin of 5%.
Comparison of Intraobserver Diagnostic Concordance of LM Against DM for Epithelial and Mesenchymal Tumors.a
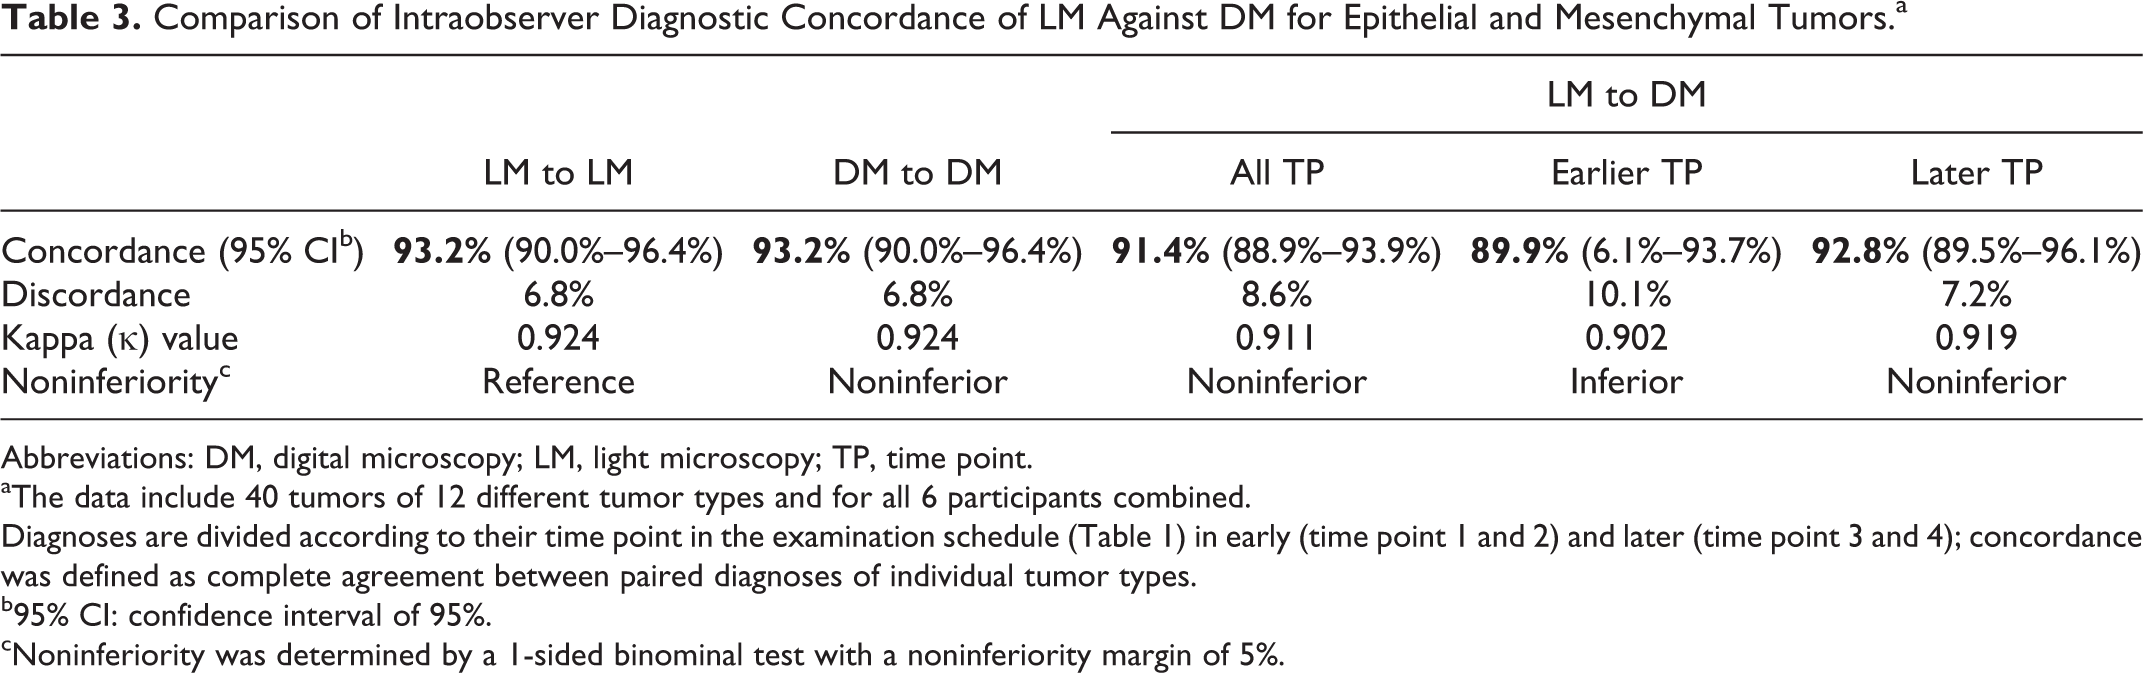
Abbreviations: DM, digital microscopy; LM, light microscopy; TP, time point.
aThe data include 40 tumors of 12 different tumor types and for all 6 participants combined.
Diagnoses are divided according to their time point in the examination schedule (Table 1) in early (time point 1 and 2) and later (time point 3 and 4); concordance was defined as complete agreement between paired diagnoses of individual tumor types.
b95% CI: confidence interval of 95%.
cNoninferiority was determined by a 1-sided binominal test with a noninferiority margin of 5%.
Comparison of Intraobserver Diagnostic Concordance of LM Against DM for Round Cell Tumors.a
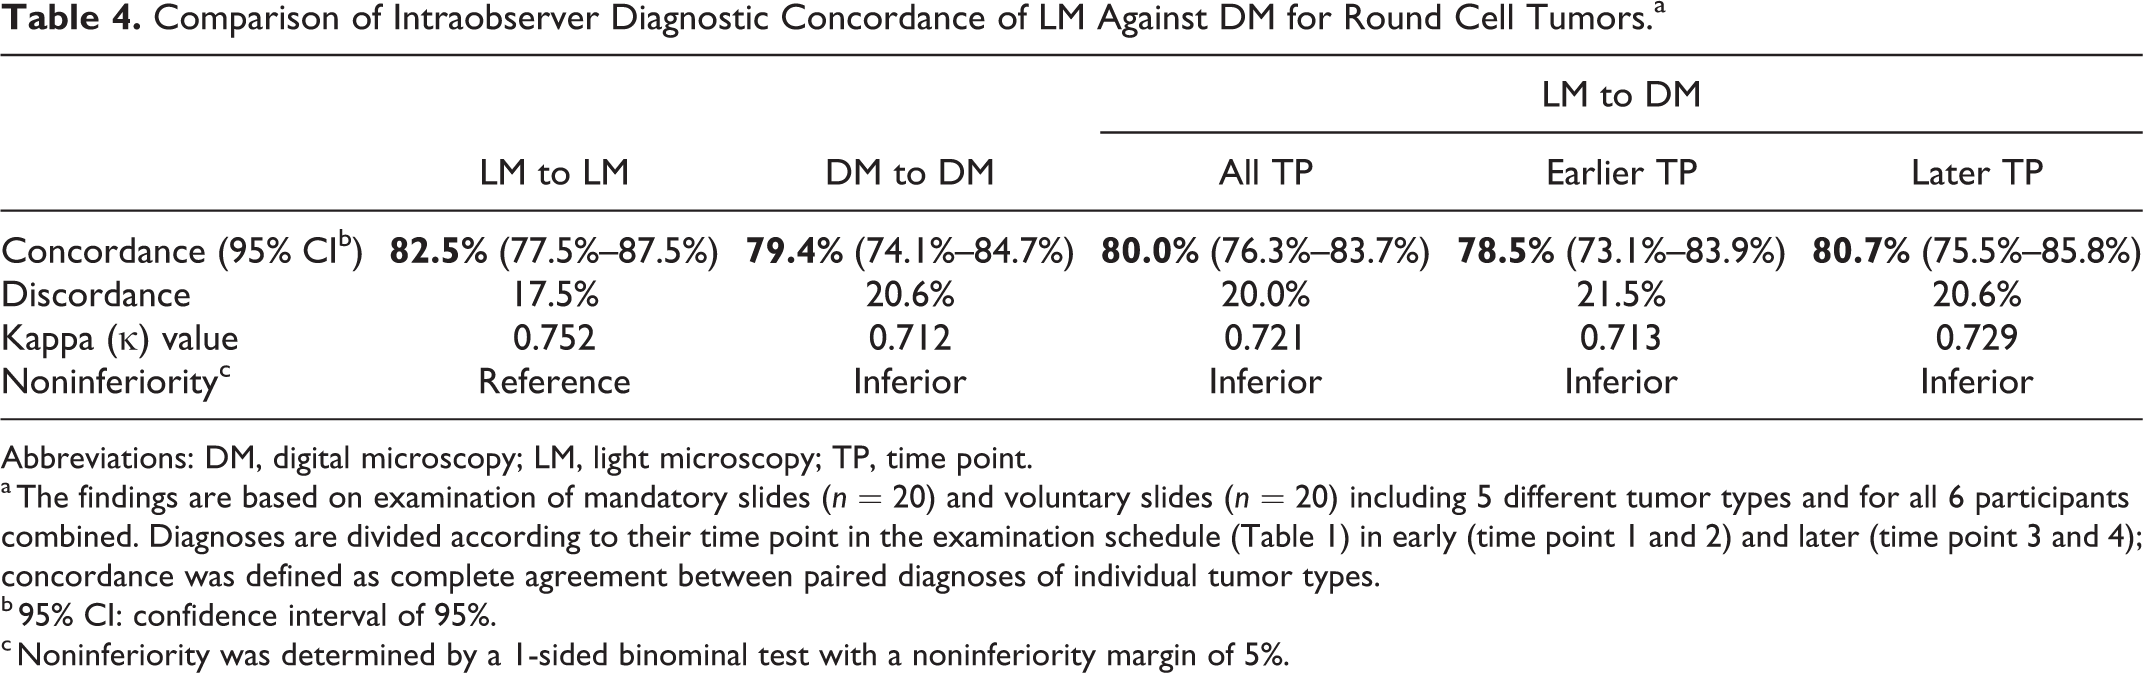
Abbreviations: DM, digital microscopy; LM, light microscopy; TP, time point.
a The findings are based on examination of mandatory slides (n = 20) and voluntary slides (n = 20) including 5 different tumor types and for all 6 participants combined. Diagnoses are divided according to their time point in the examination schedule (Table 1) in early (time point 1 and 2) and later (time point 3 and 4); concordance was defined as complete agreement between paired diagnoses of individual tumor types.
b 95% CI: confidence interval of 95%.
c Noninferiority was determined by a 1-sided binominal test with a noninferiority margin of 5%.
In general, the evaluation of round cell tumors led to a considerably lower concordance in the differentiation of individual tumor types (ranging from 67.5% to 87.8% in this category) compared with the differentiation of individual epithelial and mesenchymal tumor types (87.5%–97.4% in these categories) regardless of the modality used (ie, DM and LM) and for all participating pathologists (Tables 3 and 4; Suppl. Tables S6 and S7). Pathologists with greater diagnostic experience generally had higher diagnostic concordance with both modalities.
Surprisingly, when considering all specimens (including the category round and non–round cell tumors) scanned at different magnifications (ie, 200× and 400×), there was a significantly higher diagnostic concordance and higher κ values for WSI scanned at 200× (κ: 0.860) compared with WSI scanned at 400× magnification (κ: 0.811; Table 5; Suppl. Tables S8 and S9). Concordance of specific digital diagnoses was noninferior for WSI scanned at 200× magnification in comparison with conventional diagnoses made by LM, while it was inferior (1-sided binominal test) but still almost perfect (κ = 0.811) for WSI scanned at 400× magnification in comparison with LM.
Comparison of Intraobserver Diagnostic Concordance of DM Using Whole-Slide Images (WSI) Scanned at 200× and 400× Magnification Versus LM (Maximum 400× Magnification).a
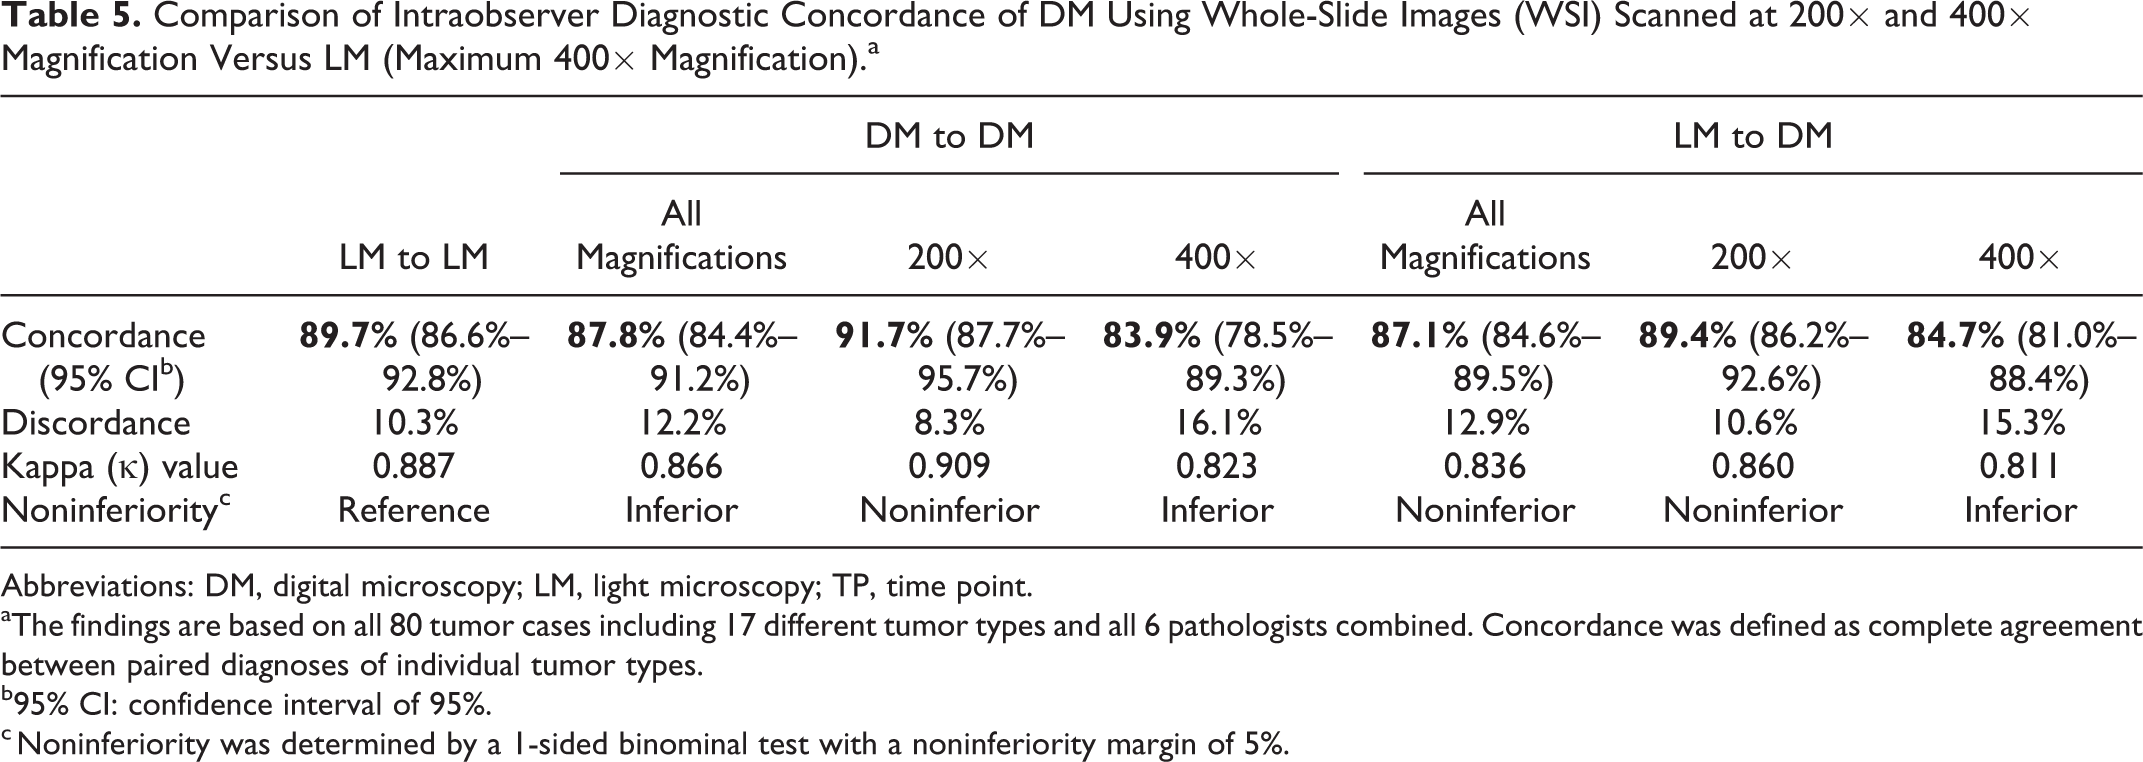
Abbreviations: DM, digital microscopy; LM, light microscopy; TP, time point.
aThe findings are based on all 80 tumor cases including 17 different tumor types and all 6 pathologists combined. Concordance was defined as complete agreement between paired diagnoses of individual tumor types.
b95% CI: confidence interval of 95%.
c Noninferiority was determined by a 1-sided binominal test with a noninferiority margin of 5%.
Mast Cell Tumor Grading and Mitotic Figure Count
Concordance of mast cell tumor grading was lower for DM (83.1%; 95% CI: 90.9%–75.3%; κ: 0.593) than for the reference modality LM (90.3%; 95% CI: 96.3%–84.3%; κ: 0.776; Table 6). The kappa (κ) value for concordance of mast cell tumor grading was higher for WSI scanned at 400× than at 200× magnification (Suppl. Table S10). However, statistical evaluation of the differences of diagnostic performance of 200× versus 400× magnification WSI was of limited validity because of the restricted number of mast cell tumors scanned at 200× magnification (5 cases examined twice per participant). Nevertheless, participants reported that they clearly favored the availability of 400× magnification with higher image resolution and therefore better visualization of cellular details of the round cells.
Comparison of Intraobserver Diagnostic Concordance of LM and DM in Mast Cell Tumor Grading With a 2-Tiered System.a
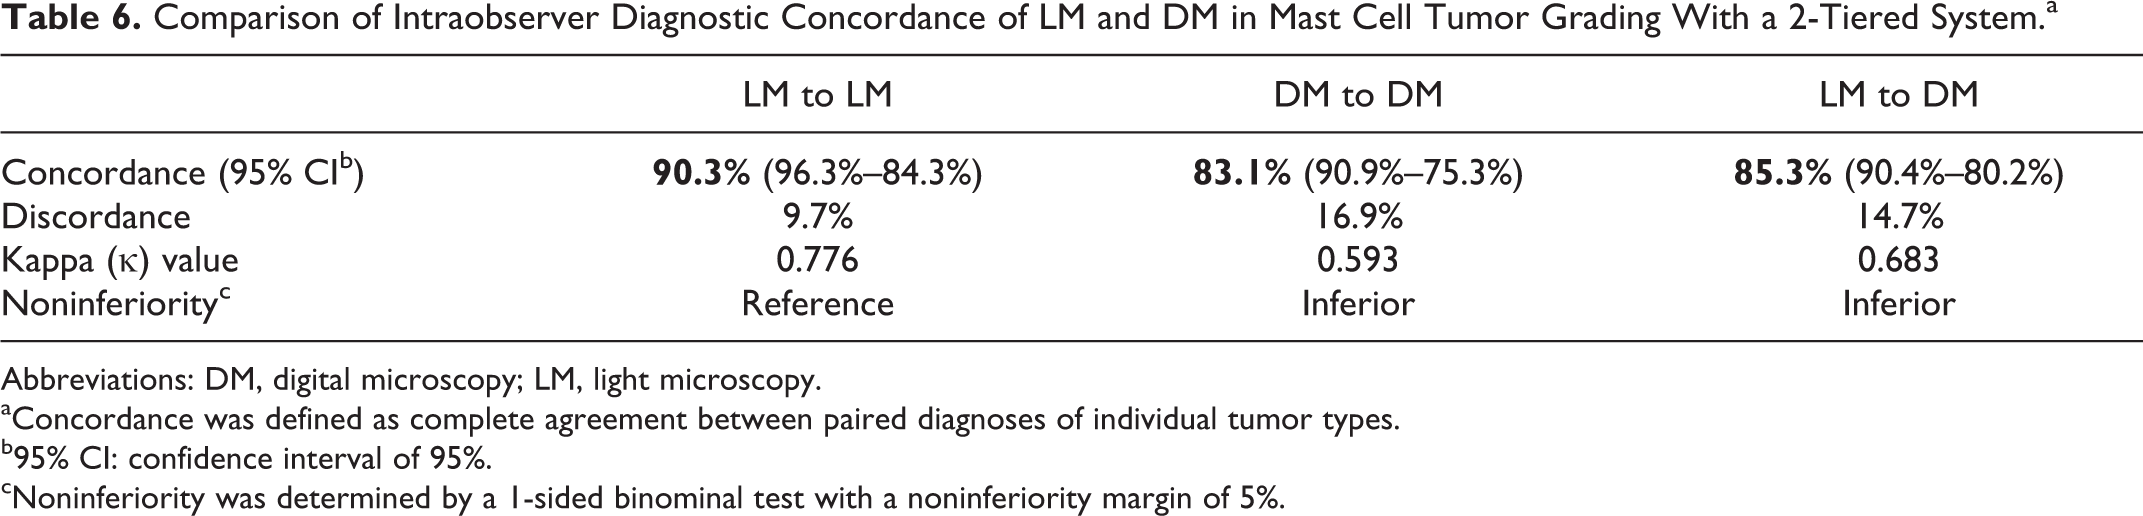
Abbreviations: DM, digital microscopy; LM, light microscopy.
aConcordance was defined as complete agreement between paired diagnoses of individual tumor types.
b95% CI: confidence interval of 95%.
cNoninferiority was determined by a 1-sided binominal test with a noninferiority margin of 5%.
The results of the mitotic count (MC; number of mitotic figures per 10 hpf) and mitotic activity index (MAI; number of mitotic figures per unit area) showed substantial intraobserver correlation between and within the 2 modalities (Fig. 2; Suppl. Fig S1; Suppl. Table S11). The usage of MAI (Rc = 0.692) significantly improved correlation between the modalities compared with the MC (Rc = 0.648) as the field area of LM and DM varied substantially within the participants (Suppl. Table S2). Interobserver correlation of counting mitotic figures partially differed significantly between the individual pathologists (Suppl. Fig. S2).
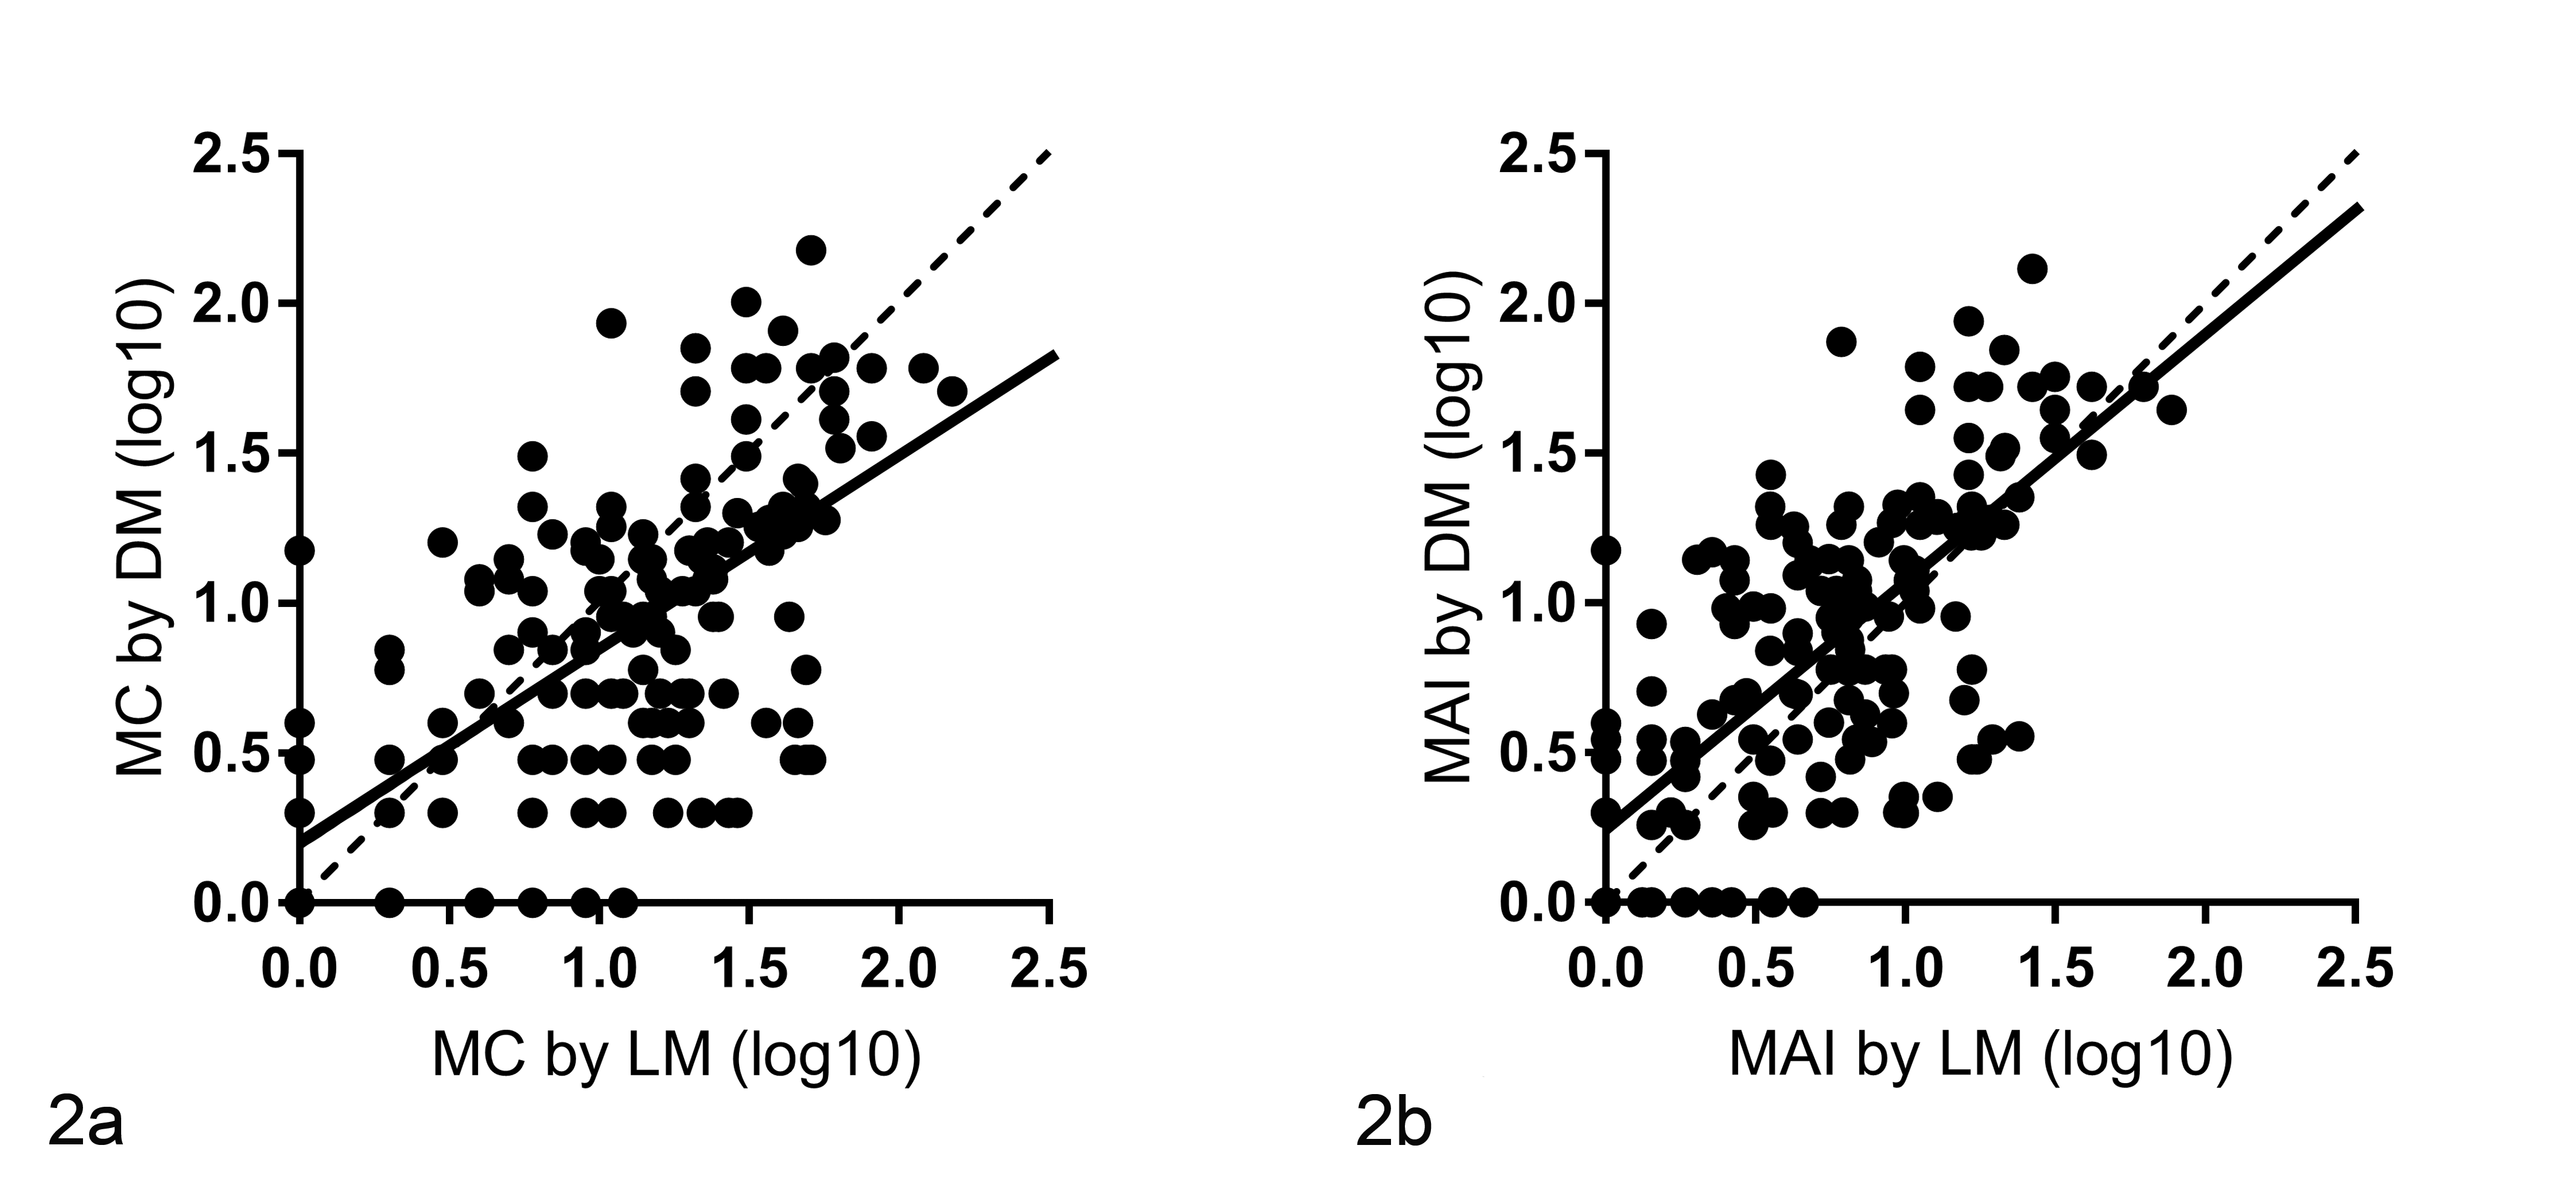
Correlation of (a) mitotic counts (MC; number of mitotic figures in 10 high-power fields) or (b) mitotic activity indices (MAI; number of mitotic figures divided by the field area) as measured in 345 cases of round cell tumors by 5 pathologists by light microscopy (LM) and digital microscopy (DM). The results of the 2 modalities showed a substantial correlation, with a concordance correlation coefficient (Rc) of 0.648 for the MC and of 0.692 for the MAI. The Rc measures the strength of agreement between 2 variables (no agreement: Rc = 0; perfect agreement: Rc = 1). The continuous line is the regression line of the scatter plot (correlation of mitotic figures), and the broken line is the reference line (hypothetical perfect correlation). The logarithm of 10 was taken of the mitotic figures for statistical analysis to produce a normally distributed data set and for the figure. Log10 = logarithm of 10.
Diagnostic Time
Diagnostic time was significantly (P = .003) shorter for DM (mean: 38.5 seconds; 95% CI: 32.4–45.5 seconds) than for LM (mean: 44.8 seconds; 95% CI: 37.5–53.3 seconds) when all 6 participants and all tumor cases were combined (Suppl. Fig. S3). Improvement of diagnostic speed for DM was even greater for round cell tumors than for epithelial and mesenchymal tumors (Suppl. Table S13; Suppl. Fig. S4). However, diagnostic time depended on several risk factors (Fig. 3; Suppl. Figs. S5–S7). First, the time until diagnosis was made significantly (P < .001) depended on the individual pathologist and her or his level of experience with DM. Four pathologists who had some experience with DM were faster with DM, while the 2 participants who had never used DM for diagnosis of tissue sections before were slower with DM in comparison with LM (Fig. 4; Suppl. Table S12). Second, slides of groups A and B (Table 1) scanned at 400× magnification required significantly (P < .001) more time to diagnose (mean: 31.3 seconds; 95% CI: 25.9–37.9 seconds) than slides scanned at 200× magnification (mean: 17.4 seconds; 95% CI: 13.6–22.2 seconds; Suppl. Fig. S5). Third, cases with higher diagnostic confidence were diagnosed significantly (P < .001) faster than cases with lower diagnostic confidence (Suppl. Fig. S6). Lastly, there was a significant (P < .001) influence of the perceived technical quality of the slide on the time to diagnosis (Suppl. Fig. S7), with faster diagnosis when using slides with higher quality. Diagnostic time was significantly shorter in later time points regardless of the modality used (Suppl. Table S14; Suppl. Fig. S8).
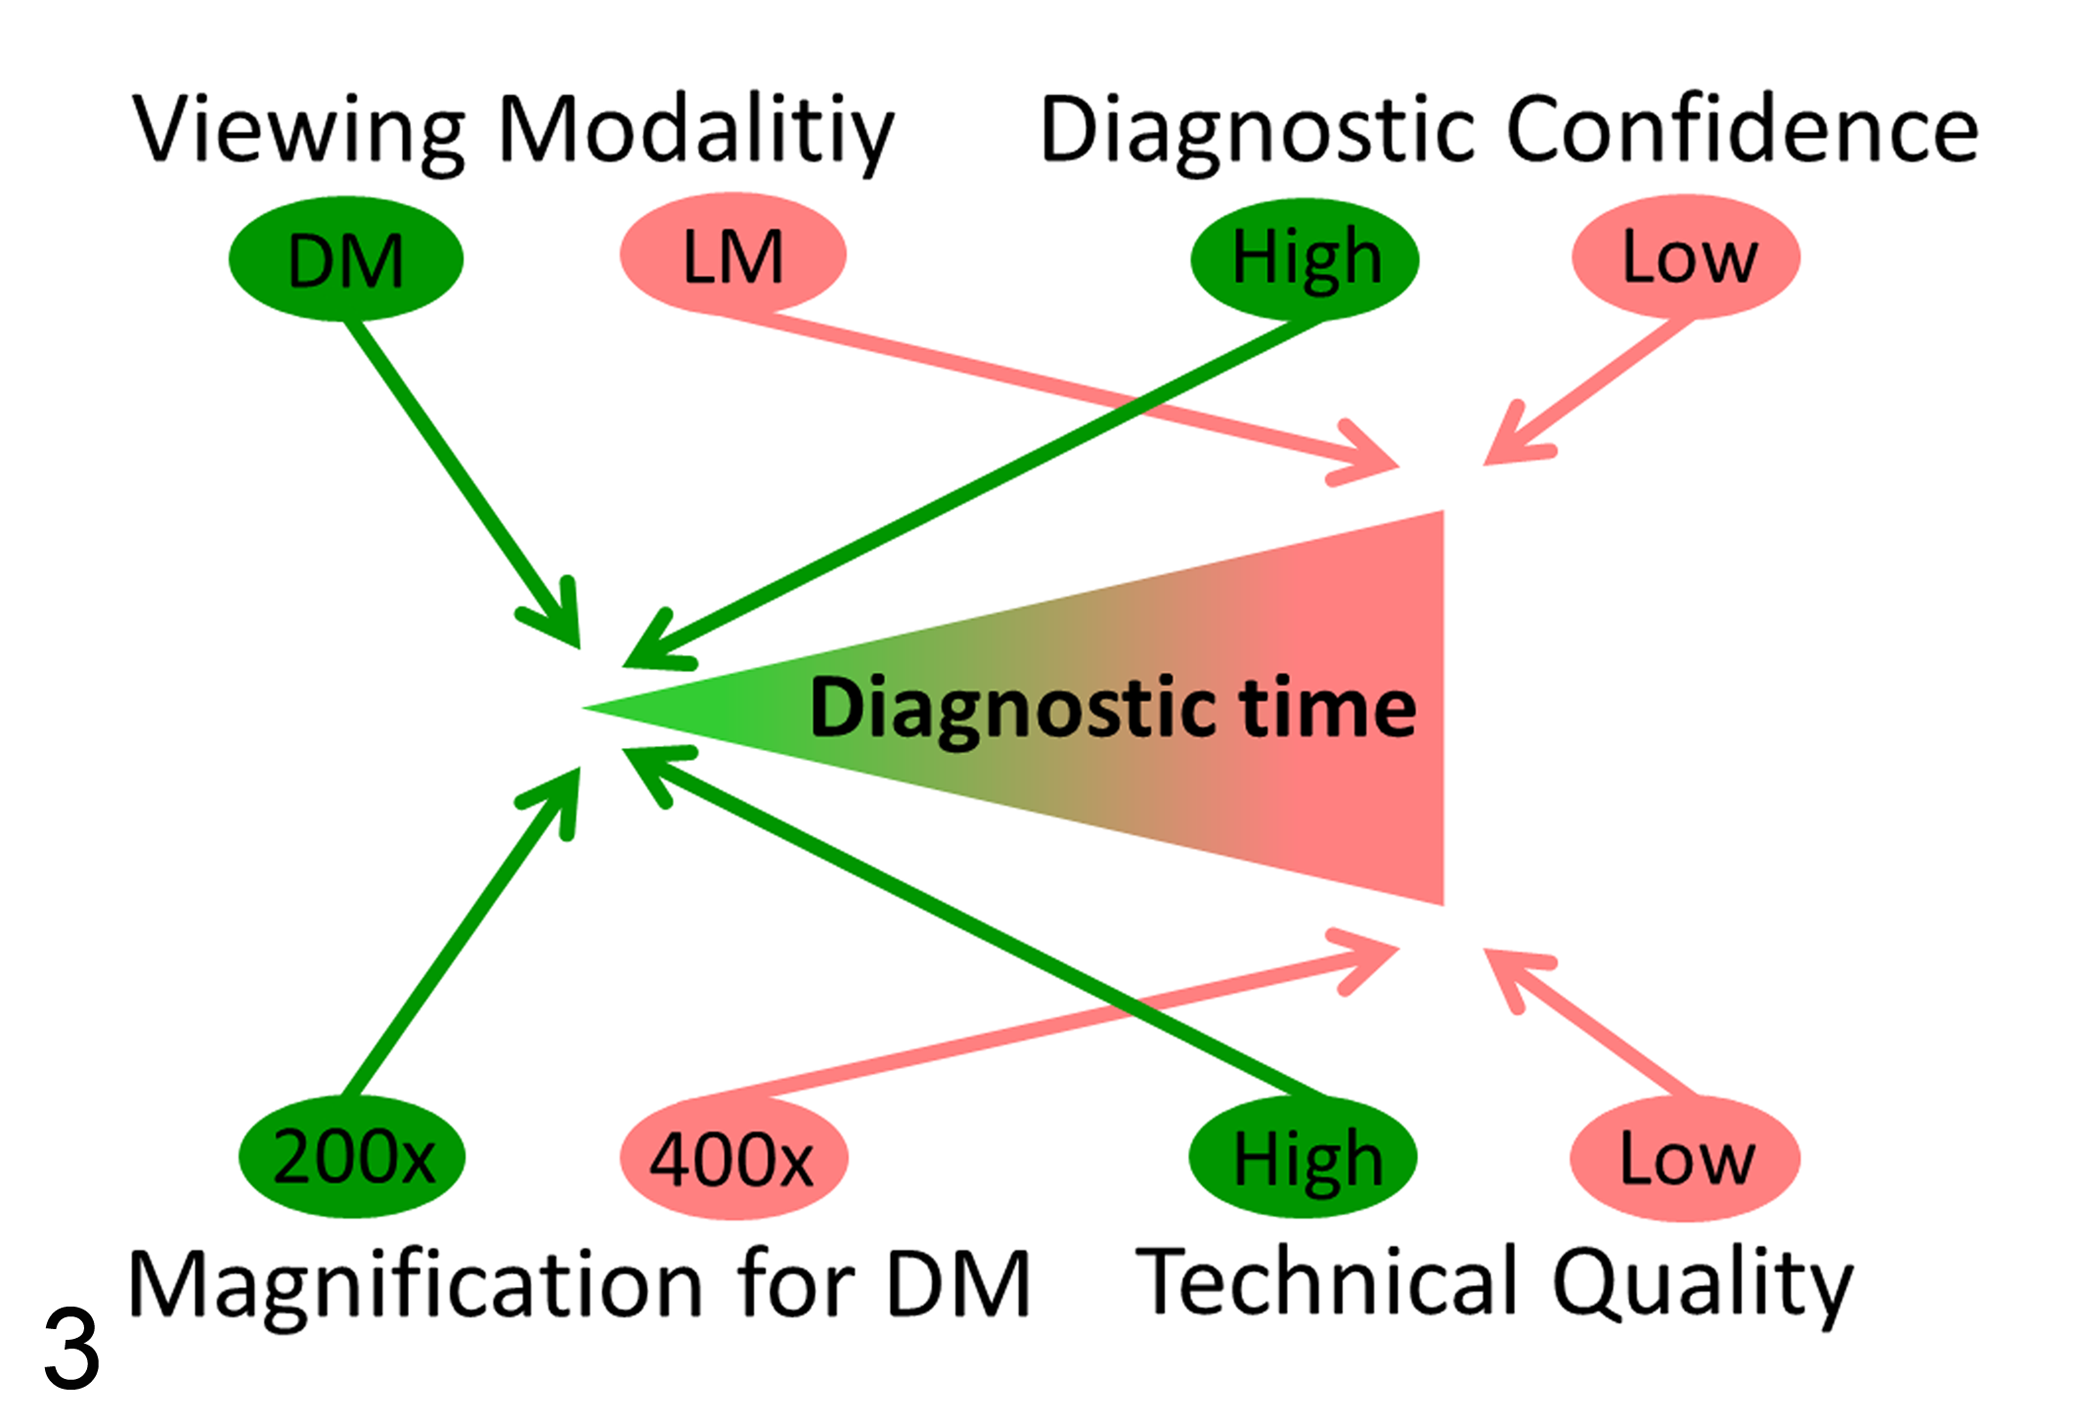
Factors influencing the required diagnostic time for diagnosis of canine cutaneous tumors. The factors illustrated in green (use of DM, scanning at low magnification [200×], cases with high confidence, and slides with high technical quality) had a positive effect of significantly reducing the required diagnostic time, while factors illustrated in red (use of LM, scanning at high magnification [400×], cases with low confidence, and slides with low technical quality) significantly increased the required diagnostic time. DM = digital microscopy; LM = light microscopy.
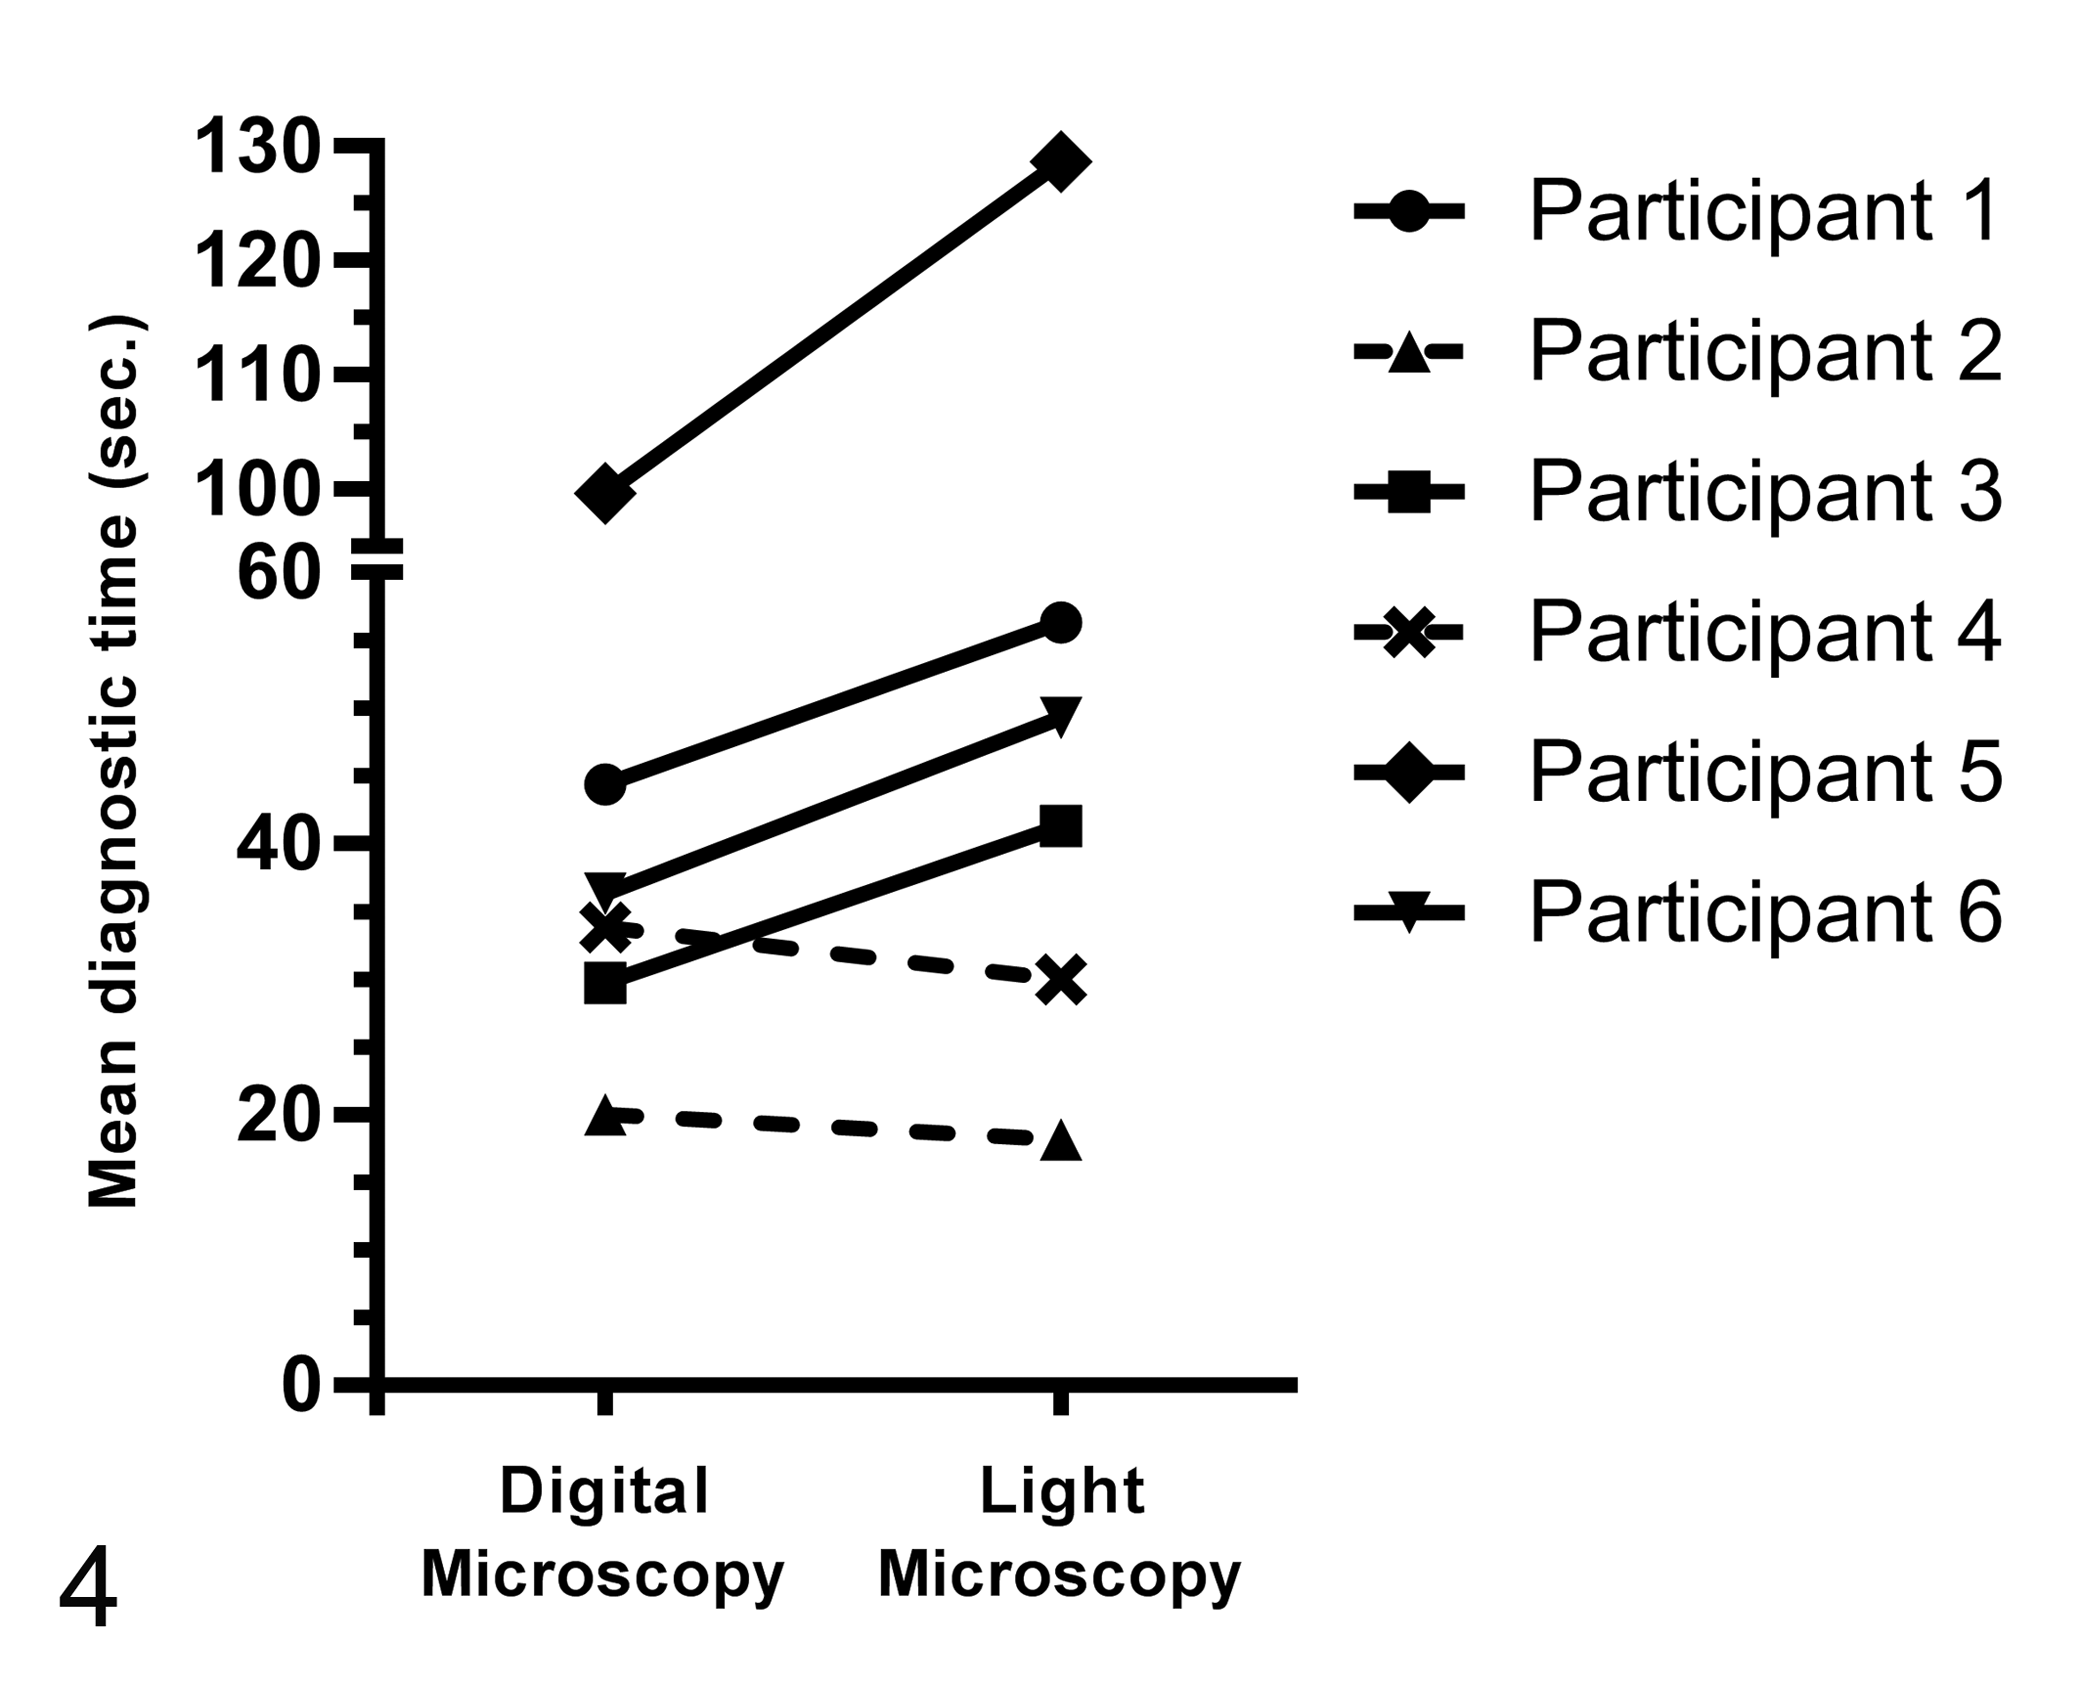
Influence of the individual pathologists (No. 1–6) on the difference in diagnostic time between digital microscopy (DM) and light microscopy (LM). Four pathologists, who were somewhat experienced with DM, required less time to make a diagnosis with DM than with LM (continues lines). The 2 pathologists who had the least experience with DM were slightly slower with DM than with LM (broken lines).
Diagnostic Confidence
Participants were slightly but significantly (P < .001) more confident in their diagnosis when using LM (mean: 1.6 on a Likert-type scale from 1 to 4; 95% CI: 1.5–1.7) than with DM (mean: 1.7; 95% CI: 1.6–1.9). There was no difference in diagnostic confidence between earlier and later time points for both methods (for LM: early 1.6, late 1.6; and for DM: early 1.7, late 1.7).
Technical Quality
Although the technical quality of glass and digital slides stained by HE was generally considered sufficient for primary diagnosis, it differed significantly (P < .001) between the 2 modalities. Glass slides (mean: 1.6 on a Likert-type scale from 1 to 4; 95% CI: 1.5–1.7) were generally appreciated to be of better technical quality than WSI (mean: 1.9; 95% CI: 1.8–2.0). Some participants nevertheless reported faintly stained glass slides during the later time points and concluded that a fading process of the glass slides occurred over the entire examination period of more than 4 months. Even more than HE-stained slides, WSI stained by toluidine blue were considered to be of significantly (P < .001) inferior technical quality (mean: 2.2; 95% CI: 2.1–2.3) compared with glass slides (mean: 1.6; 95% CI: 1.5–1.8). Participants regularly commented that WSI stained by toluidine blue were colored too intensively and darkly.
Scanning Magnification
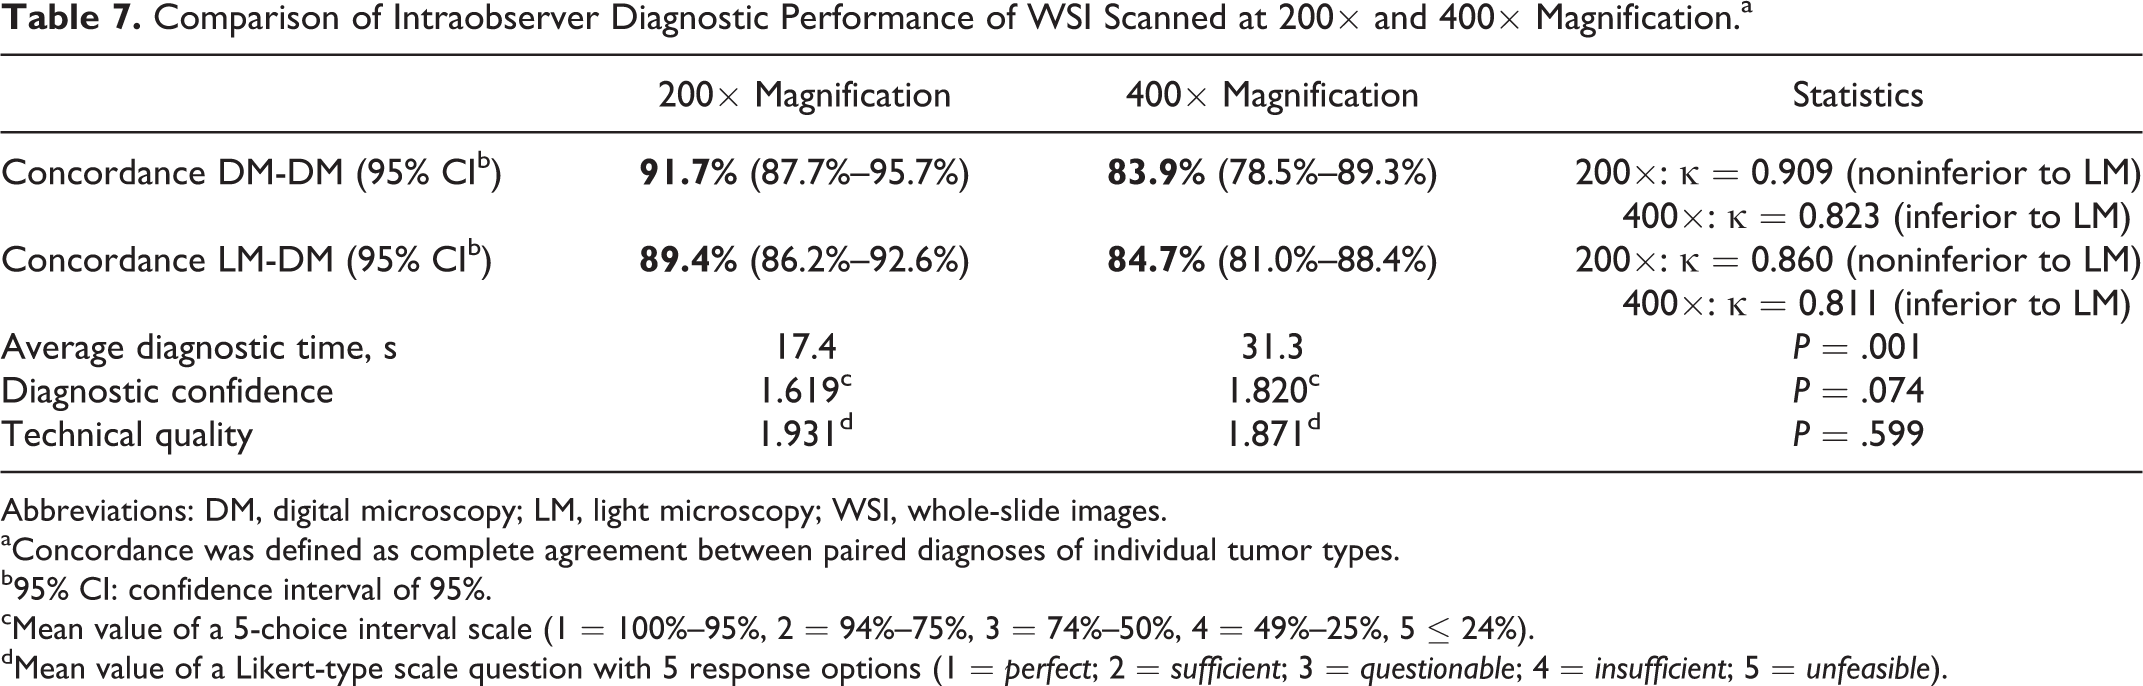
The available maximum magnification of the WSI had a significant influence on the diagnostic concordance, diagnostic time, and diagnostic confidence (Table 7). As has been mentioned above, diagnostic concordance and diagnostic speed were higher for WSI scanned at 200× (Suppl. Table S6). Furthermore, the diagnostic confidence in the diagnosis was higher for WSI scanned at 200× magnification (mean: 1.6; 95% CI: 1.5–1.8) than at 400× magnification (mean: 1.8; 95% CI: 1.7–2.0). However, this was not significant (P = .074). In contrast, concordance for mast cell tumor grading in a 2-tiered system 16 was higher for WSI scanned at higher magnification (ie, 400×). Although all pathologists repeatedly mentioned inadequate resolution of slides scanned at 200× especially for the diagnosis of round cell tumors, the perceived mean technical quality of WSI scanned at 200× and 400× magnification did not differ significantly.
Comparison of Intraobserver Diagnostic Performance of WSI Scanned at 200× and 400× Magnification.a
Abbreviations: DM, digital microscopy; LM, light microscopy; WSI, whole-slide images.
aConcordance was defined as complete agreement between paired diagnoses of individual tumor types.
b95% CI: confidence interval of 95%.
cMean value of a 5-choice interval scale (1 = 100%–95%, 2 = 94%–75%, 3 = 74%–50%, 4 = 49%–25%, 5 ≤ 24%).
dMean value of a Likert-type scale question with 5 response options (1 = perfect; 2 = sufficient; 3 = questionable; 4 = insufficient; 5 = unfeasible).
Discussion
The current study intended to determine whether DM is valid for routine diagnosis and differentiation of canine skin tumor types in veterinary pathology laboratories. For this reason, the intraobserver concordance for differentiation of a selection of 17 different common skin tumor types within the categories epithelial, mesenchymal, and round cell tumors were compared between DM and LM as the current gold standard of histopathologic diagnosis. An evaluation of the interobserver concordance was not intended since it depends more on the skills, training, and the general reliability of human observers than on the technology used. In addition, we investigated the effects of the modality used (ie, LM and DM) on diagnostic speed, diagnostic confidence, and technical quality.
A major result was the noninferiority of DM compared with LM for differentiating individual tumor types within the category epithelial and mesenchymal tumors. All participants had a very high diagnostic concordance in both modalities ranging from 87.5% to 97.4% for differentiating individual tumor types within the category epithelial and mesenchymal tumor. However, the concordance between the observers strongly correlated with the diagnostic experience of the pathologists regardless of the modality used and was higher with increasing experience. Clinical data were not provided for any case, only the one most representative slide was provided, and the participants were unable to order additional sections and stains; thus, the total concordance may be higher in daily routine practice when clinical data and further sections are usually available. 20
Not surprisingly, diagnostic concordances were significantly lower for differentiating types of round cell tumors (when compared with epithelial and mesenchymal tumors) regardless of the examination modality used. Furthermore, concordance of DM for differentiating individual round cell tumors was slightly lower and inferior compared with LM, but there was still substantial agreement between the modalities. In addition, mast cell tumor grading was inferior for DM compared with LM. Differentiating individual round cell tumors in general is more demanding than differentiating non–round cell tumors since the differentiation of mesenchymal and epithelial tumors is largely based on distinct overall growth patterns and less dependent on the identification of cellular details. The reasons for the tumor type–dependent differences might thus include the lack of a “fine focus” feature and the generally lower perceived technical quality of WSI in comparison with the glass slides. In addition, the availability of only lower (200×) magnification for some round cell tumors in the study may have been a disadvantage for DM in our study. As mentioned above, low resolution (ie, scan magnifications of <400×) is generally considered to be problematic for the sufficient identification of cellular details in round cell tumors and cytology diagnosis in WSI and was also criticized by some participating pathologists in our study. However, surprisingly, WSI scanned at 200× magnification were not inferior to WSI scanned at 400× for diagnosing the different round cell tumor types in the present study.
A second major finding was the significantly reduced diagnostic time required for DM compared with LM for all tumor categories combined but also for the tumor categories epithelial and mesenchymal tumors, and round cell tumors separately. Diagnostic speed is an important aspect of cost-effectiveness of commercial laboratories and therefore has been often investigated in validation studies on DM. Most previous studies have determined a longer diagnostictime with DM when compared with LM. 7,14,15,19,31,34 Only few other and rather recent studies indicate that required diagnostic time using DM may be similar or even faster than using LM, similar to our study. 26,32 Those studies concluded that an appropriate workstation and network connectivity are essential factors influencing diagnostic speed. The current study additionally identified tremendous differences in the required time for both modalities between different pathologists, which we found not surprising. Beside personal preferences and aptitude, the degree of familiarization and confidence with DM varied greatly throughout the individual participants while all participants were trained by and regularly used LM. In the present study, participants with higher familiarization with DM generally required less time with DM relative to LM.
Despite the noninferiority of DM to LM in terms of diagnostic concordance, on average all participants regarded the technical quality of WSI lower than that of glass slides. In addition, all participants stated a lower confidence in their diagnoses when using DM than with LM. Although we are unable to fully explain these obviously contradictory results in objective and perceived diagnostic quality, it can be assumed that increasing experience, better training, and adaptation of pathologists to DM would lead to a different appreciation of technical quality and diagnostic confidence. In addition, the technical quality of the slides has tremendously improved recently and is likely to improve further in the near future since hardware and image processing and viewing software are developing rapidly. Although it is beyond the scope of the present article to validate the suitability of special stains, the participants have identified particular difficulties in scanning slides stained by toluidine blue by default settings. Participants noticed that WSI stained by toluidine blue were colored more intensively, making it sometimes difficult to detect the presence of intracytoplasmic granules in round cell tumors (ie, mast cell tumors). Whether similar difficulties exist for WSI with other special stains needs to be determined by future studies. Although some methods have been developed to control color reproduction of WSI, there is no fully satisfying method available yet to re-create color composition identically to the digitalized glass slide. 10,11,17 Further development of color calibration targeting the scanning process (internal color calibration) and the display (external color calibration) will be required, especially for standardizing of special stains. 11 In addition, the lack of pathologists with long-term experience in DM is a limitation of our study. Since a learning curve for DM has been shown before in human pathology, it can be hypothesized that our study probably underestimates the full potential of DM in terms of diagnostic speed, accuracy, and reliability. 22,23 Also, our results supports this hypothesis since the performance of all participants in DM slightly improved during the study. However, a case recall cannot be fully excluded regardless of the washout time of 4 weeks, which is consistent with current guidelines. 24 Participants with higher experience with DM prior to the study generally had a greater benefit in diagnostic speed in favor of DM in the present study.
The intraobserver quantification of mitotic figures by the 5 pathologists in this study showed a substantial correlation between the 2 modalities, DM and LM. This is in accordance with a previous study that also confirmed a comparable potential of DM and LM for counting mitoses in human pathology. 4 Mitotic figures in neoplasia are usually determined in 10 high-power fields (HPF) at a magnification of 400×, which is defined as the MC. 16,25 Recently, Meuten et al. 21 proposed that the MC, defined by fields of view, is an insufficiently standardized field parameter since the associated absolute field area varies significantly between different light microscopes with different field numbers. In our study, the field area of WSI at the different computer screens and light microscopes of the participants also differed by 1.7- to 3.1-fold. The validity of the MC findings of this study should therefore be regarded as somewhat imprecise. Nevertheless, this shows again that improved standardization of the area used for counting mitotic figures is necessary for LM and DM. The use of the MAI, which is the MC divided by the area actually analyzed, may improve standardization. 21 In the current study, correlation of MAI was also higher than correlation of MC, when LM was compared with DM. It should also be kept in mind that an MC is only possible in WSI scanned at 400× magnification, since MC is determined in HPF, thus at a 400× magnification by definition. This has to be considered if the tumor type requires quantification of mitotic figures, such as for canine mast cell tumors or human breast cancer. 16,30 However, both MC and MAI differed significantly between the different participants (interobserver correlation). The approach to counting mitotic figures should therefore be further standardized in general as variability in counting mitotic figures can tremendously influence tumor grading.
The debate as to which maximum magnification is required for a reliable histopathologic diagnosis is still controversial, independent of the special situation when mitotic figures are to be quantified. Currently, most laboratories and validation studies routinely scan at a magnification of 200×. 1,3,5,20,22,23,29,30,32 The decision to avoid higher magnification (ie, 400×) is usually made to avoid the higher costs and overtly large file sizes and scanning time but at the expense of reduced resolution and thus inferior visualization of cellular details. Some studies acknowledge that scanning at 400× magnification or higher is required for some specimens to improve diagnostic reliability and speed. 18,28,32 For example, identifying microorganisms or granulocytic inflammation and counting mitotic figures may benefit from higher magnifications and thereby higher digital resolution. 18,28,30 However, Vyas et al 33 concluded from their results that WSI scanned at 200× magnification are adequate to detect most histopathologic features of inflammatory skin disease in comparison with glass slides, with only some limitations for detecting cellular features. Also, intraobserver concordance between 200× and 400× magnification of WSI of human breast needle biopsies did not differ significantly in a previous study. 9 Similarly, our study showed that WSI scanned at 200× magnification were not inferior in terms of diagnostic concordance, time, and confidence compared with WSI scanned at 400× magnification. Nevertheless, participants repeatedly mentioned that 200× magnification was not sufficient to differentiate individual tumor types of the category round cell tumor. A high resolution was considered necessary for an adequate visualization of nuclear and cytoplasmic details for the cases of round cell tumors. In contrast to these concerns, diagnostic concordance for specific diagnoses of tumor types within the category round cell tumor, and the other tumor categories, was greater for WSI scanned at 200× magnification. WSI scanned at 200× magnification were therefore adequate for an accurate and fast diagnosis of the specimens used in the current study. However, limitations of the low resolution of WSI were evident for mast cell tumor grading.
In conclusion, the overall diagnostic performance of DM was noninferior to LM in terms of diagnostic concordance of paired diagnoses of differentiating individual tumor types and diagnostic speed for several canine cutaneous tumors. Interestingly, digital slides scanned at 200× magnification resulted in noninferior performance compared with slides scanned at 400× magnification in terms of tumor typing. The results of the current study suggest that DM is an appropriate technology for the primary differentiation and diagnosis of several types of canine cutaneous tumors, with some minor limitations for the differentiation of individual round cell tumors and for grading mast cell tumors.
Supplemental Material
Supplemental Material, DS1_VET_10.1177_0300985818755254 - Validation of Digital Microscopy Compared With Light Microscopy for the Diagnosis of Canine Cutaneous Tumors
Supplemental Material, DS1_VET_10.1177_0300985818755254 for Validation of Digital Microscopy Compared With Light Microscopy for the Diagnosis of Canine Cutaneous Tumors by Christof A. Bertram, Corinne Gurtner, Martina Dettwiler, Olivia Kershaw, Kristina Dietert, Laura Pieper, Hannah Pischon, Achim D. Gruber, and Robert Klopfleisch in Veterinary Pathology
Footnotes
Declaration of Conflicting Interests
The authors declared no potential conflicts of interest with respect to the research, authorship, and/or publication of this article.
Funding
The authors received no financial support for the research, authorship, and/or publication of this article.
Supplementary material for this article is available online.
References
Supplementary Material
Please find the following supplemental material available below.
For Open Access articles published under a Creative Commons License, all supplemental material carries the same license as the article it is associated with.
For non-Open Access articles published, all supplemental material carries a non-exclusive license, and permission requests for re-use of supplemental material or any part of supplemental material shall be sent directly to the copyright owner as specified in the copyright notice associated with the article.