
Abstract
Canine osteosarcoma is highly resistant to current chemotherapy; thus, clarifying the mechanisms of tumor cell resistance to treatments is an urgent need. We tested the geldanamycin derivative 17-AAG (17-allylamino-17-demethoxygeldanamycin) prototype of Hsp90 (heat shock protein 90) inhibitors in 2 canine osteosarcoma cell lines, D22 and D17, derived from primary and metastatic tumors, respectively. With the aim to understand the interplay between cell death, autophagy, and mitophagy, in light of the dual effect of autophagy in regulating cancer cell viability and death, D22 and D17 cells were treated with different concentrations of 17-AAG (0.5 μM, 1 μM) for 24 and 48 hours. 17-AAG-induced apoptosis, necrosis, autophagy, and mitophagy were assessed by transmission electron microscopy, flow cytometry, and immunofluorescence. A simultaneous increase in apoptosis, autophagy, and mitophagy was observed only in the D22 cell line, while D17 cells showed low levels of apoptotic cell death. These results reveal differential cell response to drug-induced stress depending on tumor cell type. Therefore, pharmacological treatments based on proapoptotic chemotherapy in association with autophagy regulators would benefit from a predictive in vitro screening of the target cell type.
Dogs are increasingly being identified as good animal models for translational studies on cancer biology because of their well-known similarities to human counterparts. 20,28 Current treatments include complete surgical excision and/or radiotherapy associated with drug therapy, but the most effective chemotherapy drug and the ideal timing to start the adjuvant chemotherapy have not been identified. 5,23 Autophagy is an evolutionarily conserved and dynamic catabolic process in which cells degrade long-lived or misfolded proteins and damaged organelles, such as mitochondria (mitophagy), endoplasmic reticulum, peroxisomes, ribosomes, and nuclei, to recycle nutrients and increase cellular energy. Dysregulated autophagy is involved in several pathological processes, including cancer. 8 However, targeting autophagy as an anticancer treatment is complex due to its dual role: activation of autophagy could either inhibit apoptosis or contribute to its induction, thus promoting cell survival or cell death, respectively. 4,36,37
Heat shock protein 90 (Hsp90), an adenosine triphosphate (ATP)–driven molecular chaperone, is a pivotal player in the regulation of cell apoptosis and autophagy. In cancer cells, Hsp90 regulates oncogenesis by stabilizing the functional shape of labile oncogenic signaling proteins and by maintaining homeostasis in a hostile environment. Hsp90 is overexpressed in cancer, as demonstrated by the 100-fold increase of its N-terminal ATPase activity in neoplastic cells of various origins compared with healthy cells. 15 In canine osteosarcoma (OSA), Hsp90 is expressed both in the primary tumor and in lymphatic emboli without a significant association with the histologic type. 27
Furthermore, Hsp90 appears to be involved in mitochondrial homeostasis by maintaining the mitochondrial membrane potential (Δψm) since its inhibition leads to mitochondria-mediated apoptosis. 6,14 Mitochondria are frequently altered in neoplastic cells (Warbung effect), thus making cancer metabolism highly dependent on glycolysis. 13 In healthy cells, mitochondria form a dynamic interconnected network of tubular structures that are involved in fission and fusion processes. 38 Under cell stress or dysfunction, these organelles undergo asymmetric fission or fusion to spare stressed mitochondria to some extent by splitting them into both a normally functioning and a dysfunctional part, the latter removed by mitophagy. Mitophagy is an important prosurvival mechanism, since dysfunctional mitochondria may consume ATP and/or generate excessive amounts of harmful reactive oxygen species, thus contributing to the overall loss of cell homeostasis. 7,25,26
17-AAG (17-allylamino-17-demethoxygeldanamycin), also called tanespimycin, is a benzoquinone antineoplastic antibiotic derived from geldanamycin, the progenitor of the Hsp90 inhibitors’ family. 17-AAG interacts with the ATP binding site in the N-terminus of Hsp90 and prevents the Hsp90 chaperone cycle, resulting in the proteasome-mediated degradation of Hsp90 client proteins and the consequent collapse of multiple signaling pathways. 3,11,31
17-AAG is a potent inducer of apoptosis through the mitochondrial membrane depolarization. 6 The aim of the present study is to evaluate the effect of 17-AAG on primary (D22) and metastatic (D17) canine OSA cell lines, in terms of apoptosis, necrosis, autophagy, and mitophagy and the impact of tumor phenotype on cell response to treatment.
Materials and Methods
Reagents
17-AAG (ant-agl5; InvivoGen, San Diego, CA) was dissolved (1 mM) in dimethylsulfoxide (DMSO, 472301; Sigma-Aldrich, St Louis, MO) for storage. All the reagents used for cell culture were purchased from Euroclone (Pero, Milan, Italy): Dulbecco’s modified Eagle’s medium (DMEM)/F12 (ECM0096 L), fetal bovine serum (FBS; ECS0180 L), penicillin/streptomycin (ECB3001D), glutamine (ECB3000D), and trypsin (ECB3052D). All the reagents used for the immunoreactions were purchased as follows: LC3B/MAP1LC3B antibody (NB100-2331; Novus Biologicals, Littleton, CO), Hsp90α/β monoclonal antibody (AC88; StressGen/Assay Designs, Victoria, BC, Canada), biotinylated goat anti–rabbit IgG (Ba-1000; Vector Laboratories, Peterborough, UK), β-actin (SC-47778; Santa Cruz Biotechnology, Dallas, TX), biotinylated goat anti–mouse IgG (Ba-9200; Vector Laboratories), Vectastain Elite ABC Kit (PK6100; Vector Laboratories), DuoLux Chemiluminescent/Chemifluorescent Horseradish Peroxidase Substrate (HRP) (SK6604; Vector Laboratories), and Texas Red Avidin (A2016; Vector Laboratories).
Cell Culture and Treatment
To evaluate basal Hsp90 expression, 6 primary canine OSA cell lines (Dark, Desmon, Penny, Pedro, Lady, Lord), used in a previous study of the authors, 20 as well as canine OSA cell lines D22, from a primary tumor of a Collie, and D17, from a secondary tumor of a Poodle, obtained from the American Type Culture Collection (CRL-6250 and CCL-183), were used. Cell cultures were grown as monolayers in DMEM/F12 supplemented with 10% FBS, 1% penicillin (50 U/ml), 1% streptomycin (50 U/ml), and 1% glutamine in a humidified incubator at 37°C and 5% CO2.
D22 and D17 cell lines were then selected to perform 17-AAG treatment. For this purpose, 17-AAG was diluted in DMEM/F12 and added to the culture medium after 24 hours of cell seed up to a final concentration of 0.01 μM, 0.025 μM, 0.5 μM, and 1 μM for 24 hours and 48 hours. 10,22 As a vehicle control, 0.1% DMSO alone was used. To evaluate the autophagic flux, cells were treated with 1 μM of the lysosomal inhibitor hydroxychloroquine (HCQ) (H0915; Sigma-Aldrich) for 24 hours. 21
Total RNA Extraction and Reverse Transcription–Quantitative Polymerase Chain Reaction Expression Analysis
Total RNA was obtained from all investigated OSA cell lines. Complementary DNA (cDNA) was synthesized from 1 μg total RNA using the QuantiTect Reverse Transcription kit (Qiagen, Valencia, CA), including genomic DNA removal reagent. To determine the relative amounts of specific Hsp90 transcript, the cDNA was subjected to reverse transcription–quantitative polymerase chain reaction (RT-qPCR) using the IQ SYBR Green Supermix (Bio-Rad, Hercules, CA) and the IQ5 detection system (Bio-Rad). Forward and reverse primers employed were as follows: Hsp90, 5′-CTGCGTCCTGCTGACCTTC-3′, 5′-ACATCGACTTCATCGTCAGCT-3′; GAPDH, 5′-GGCACAGTCAAGGCTGAGAAC-3′, 5′-CCAGCATCACCCCATTTGAT-3′. The level of gene expression was calculated using a relative quantification assay corresponding to the comparative cycle threshold (Ct) method: the amount of target, normalized to the endogenous housekeeping gene (GAPDH) and relative to the calibrator (control sample), was then transformed by 2–ΔΔCt (fold change), where ΔΔCt = ΔCt (sample) − ΔCt (control) and ΔCt is the Ct of the target gene subtracted from the Ct of the housekeeping gene. GAPDH was selected as housekeeping gene among the 6 following common endogenous normalizer genes (GAPDH, HPRT, RP13A, β-actin, RP32, RP18 S).
Transmission Electron Microscopy
Cells were harvested using trypsin-EDTA, and then 1 000 000 cells were seeded, exposed to treatment, and processed for transmission electron microscopy (TEM). Cell pellets were fixed with 2% glutaraldehyde in 0.1 M cacodylate buffer (pH 7.2) for 3 hours at 4°C, postfixed in 1% osmium tetroxide (OsO4), dehydrated through an ascending concentration of ethanol, and embedded in epoxy resin (Durcupan ACM, 44610-1EA; Fluka, Sigma-Aldrich, Inc.). Semi-thin sections (1 μm) were stained with toluidine blue and examined under the light microscope. Ultrathin sections were double-stained with uranyl acetate followed by lead citrate to be examined by means of an EM 900-ZEISS electron microscope (Zeiss, Oberkochen, Germany).
Cell Viability (MTT Assay)
To determine the cell proliferation, 40 000 cells were seeded onto 96-well plates and exposed to treatment as previously described. After 24 and 48 hours, cells were incubated with 0.5 mg/ml MTT (Sigma-Aldrich) for 3 hours. Formazan crystals (MTT metabolic product) were solubilized by DMSO and quantified using a spectrophotometer (Thermo Fisher Scientific, Waltham, MA) at a wavelength of 570 nm.
Quantification of Apoptosis and Necrosis
Annexin V–fluorescein isothiocyanate and propidium iodide
In total, 1 000 000 cells were seeded, exposed to treatment, and stained with the Annexin V–fluorescein isothiocyanate (FITC) kit (PN IM3546; Beckman Coulter, Brea, CA). Briefly, cell samples were washed with ice-cold phosphate-buffered saline (PBS), centrifuged, and resuspended in ice-cold 1× binding buffer to 500 000 cells/ml, followed by incubation with 1 μl Annexin V–FITC solution and 5 μl dissolved propidium iodide (PI) to 100 μl of the cell suspensions for 15 minutes in the dark. Then, 400 μl of ice-cold 1× binding buffer was added to the suspensions, and cells were analyzed by flow cytometry (Beckman Coulter).
Autophagy and mitophagy quantification
Autophagy and mitophagy were evaluated by means of chemoluminescence and fluorescence techniques. The covalent lipidation of the ubiquitin-fold protein microtubule-associated protein light chain 3 (LC3) is essential for macroautophagy induction. The unconjugated LC3-I form is diffuse within the cytosol, whereas the phosphatidylethanolamine-conjugated LC3-II is localized to autophagic vacuoles and exhibits greater mobility by sodium dodecyl sulfate–polyacrylamide gel electrophoresis (SDS-PAGE). 16
Western blot analysis
In total, 1 000 000 cells were seeded, exposed to treatment and then collected, washed twice with ice-cold PBS, and centrifuged. Cells were lysed in lysis buffer (1% Triton X-100, 10% glycerol, 50 mM Tris, 150 mM sodium chloride, 2 mM EDTA [pH 8.0], and 2 mM magnesium chloride with the complete Protease Inhibitor Cocktail [P8340, Sigma-Aldrich]). Protein concentrations were determined using the Bradford protein assay (B6915; Bio-Rad). Total cell lysates were separated using SDS-PAGE and transferred onto a polyvinylidene fluoride (PVDF) membrane (162-0176; Bio-Rad) overnight at 4°C. The membrane was blocked with 5% nonfat dried milk buffer containing 0.1% Tween-20 for 30 minutes before incubation with rabbit polyclonal anti-LC3 antibody (1:4000) and mouse monoclonal anti-Hsp90 (1:1000) at 4°C overnight. The biotinylated anti–rabbit IgG (1:4000, for LC3) and biotinylated anti-mouse (1:10 000, for Hsp90) were used as secondary antibodies for 1.5 hours at room temperature. Normalization was performed against β-actin (1:10 000). The Vectastain ABC system and the DuoLux Chemiluminescent/Chemifluorescent HRP Substrate (Vector Laboratories) were used to detect LC3 and Hsp90 bonds to the PVDF membranes. The band intensities were analyzed by densitometry using the ImageJ (National Institutes of Health, Bethesda, MD) software.
Autophagy: LC3 immunofluorescent dots
In total, 400 000 cells were seeded onto glass coverslips placed in 35-mm culture dishes and exposed to treatment. Cell cultures were fixed with 4% paraformaldehyde, permeabilized with 0.2% Triton X-100 for 10 minutes, blocked with 5% normal goat serum for 30 minutes, and incubated with the rabbit polyclonal anti-LC3 antibody (1:200) at 4°C overnight, followed by the biotinylated goat anti–rabbit secondary antibody (1:200) for 30 minutes at room temperature. The reaction was visualized using the Texas Red–conjugated avidin diluted 1:100 in sodium bicarbonate buffer 0.1 mol/L and sodium chloride 0.15 mol/mol (pH 8.2–8.5) for 10 min at room temperature and analyzed by fluorescent microscopy. To quantify the autophagic process, high-quality images were captured at a high magnification (60×) and the number of dots/cell was counted in 30 cells/group using the “Analyze Particles” function of the ImageJ software. Since LC3-II localized within the autophagosome membrane appears as puncta, the autophagic vacuoles were expressed as average number of dots/cell. Those particles larger than the background pixelation but smaller than the average nuclear size were counted.
Mitophagy: LC3 dots and mitochondria colocalization
To evaluate the colocalization of LC3 dots and mitochondria, cell cultures were incubated with 600 nM Mitotracker Green (M7514; Sigma-Aldrich) for 60 minutes at 37°C, fixed with 4% paraformaldehyde, and then exposed to the previously described immunofluorescence protocol. High-quality images were captured at a high magnification (60×). Only green and red colocalized puncta/cell were counted in 30 cells/group using the “Analyze Particles” function of the ImageJ software. Mitophagy was expressed as the percentage of LC3 puncta that colocalize with mitochondria within a given length unit.
Statistical Analysis
Results were statistically analyzed using the GraphPad Prism 5 (GraphPad Software, La Jolla, CA). The apoptosis and necrosis data were expressed as a mean percentage from 3 experiments, and multiple group comparisons were performed through the Fisher exact test. Other results were expressed as mean ± SEM, representing 3 independent experiments, and the statistical analysis was performed using univariate analysis of variance (ANOVA). Results of RT-qPCR were statistically analyzed by the Student t test.
Results
Osteosarcoma Cell Lines Express Hsp90 and Its Expression Is Regulated by 17-AAG Dosage
All investigated cell lines overexpressed Hsp90 (Suppl. Fig. S1). Statistically, overexpression was found in D17, D22, Penny, Wall, Pedro, and Lady cell lines if compared with the Lord cell line (power = 1), which was used as control. Furthermore, we evaluated the effects of 17-AAG on Hsp90 expression by RT-qPCR and Western blotting in D17 and D22 cell lines after 48 hours of treatment. 17-AAG was able to induce a decrease of Hsp90 messenger RNA (mRNA) in the D17 cell line, while in D22, the same treatment induced an increase of Hsp90 mRNA in a dose-dependent manner (Fig. 1). These dose-dependent changes of Hsp90 expression were moderate (1.5- to 2-fold increase of transcript) and thus not appreciable on Western blot analysis (Suppl. Fig. S2).
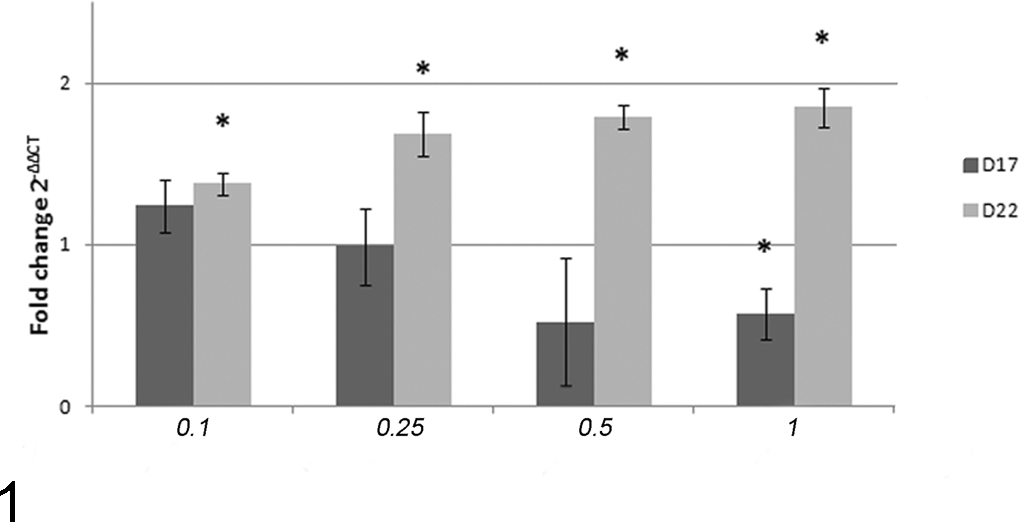
Hsp90 gene expression in D17 and D22 cell lines after 48 hours of 17-AAG (17-allylamino-17-demethoxygeldanamycin) treatment. The increase in HSP90 gene expression based on quantitative RT-PCR is represented on the y-axis. DMSO-treated cells were used as control. 17-AAG dosages, on the x-axis, are expressed in μM. The error bars indicate the standard deviation of experimental triplicates. Statistically significant differences are shown by asterisks (*P < .05).
Ultrastructural Analysis Showed Morphological Features of Apoptosis, Necrosis, Autophagy, and Mitophagy in D22 and D17 Cell Lines
After treatment, D22 cells showed ultrastructural features of autophagy and related cytoplasmic rearrangements, mitochondrial swelling with loss of cristae, mitochondrial condensation, and mitophagy. Apoptosis, necrosis, lamellipodia alterations, blisters and bubbles, and glycogen particles were also observed. D17 cells presented similar features, including ring-shaped mitochondria, mitochondrial matrix vacuolation, and large autophagosomes (Suppl. Fig. S3).
17-AAG Inhibited Cell Growth in Both Cell Lines in a Time-Dependent Manner
The ability of 17-AAG to arrest proliferation in D22 and D17 cells was examined using the MTT assay. There was a significant reduction of the cell viability after 48 hours of treatment in both cell lines (P < .05), although at different 17-AAG doses, represented by 0.5 μM and 1 μM in the D17 and D22 cell lines, respectively (Suppl. Fig. S4).
17-AAG Induced Apoptosis in D22, but Not in the D17 Cell Line, in a Dose- and Time-Dependent Manner
The effects of 17-AAG on cell death were dependent on the cell type, 17-AAG dosage, and time of exposure. 17-AAG induced cell death predominantly in the D22 cell line that showed higher drug sensitivity compared with the D17 cell line. After 48 hours of treatment, at the dosages of 0.5 μM and 1 μM, the percentage of D22 dead cells was 21.7% (P < .05) and 44.2% (P < .001), respectively. These results were statistically significant compared with control cells treated with DMSO. Most cells were apoptotic (23.9% and 28.1%, respectively) (P < .001). In the D17 cell line, drug-dependent cell death after 48 hours of treatment at 0.5 μM and 1 μM was 19.9% (P < .001) and 14.6% (P < .05), respectively, but only a smaller percentage was represented by apoptotic cells (7.2% and 3.2%, respectively) (Suppl. Fig. S5).
Autophagy and Mitophagy Increased After 17-AAG Treatment in Both Cell Lines in a Dose-and Time-Dependent Manner
The 17-AAG treatment induced increased the LC3-II/β-actin ratio, especially in D22 cells after 48 hours of treatment (P < .01) (Fig. 2a,b). HCQ, which inhibits autolysosomal degradation, 22 confirmed the intact autophagic flux in treated cultures (P < .01) (Fig. 2c). The number of dots/cell significantly increased in 17-AAG–treated cells compared with controls (Fig. 3; Suppl. Figs. S6, S7). Both cell lines showed a constitutive level of autophagy, with 13.3 dots/cell in D22 and 4.8 dots/cell in D17. After treatment, autophagy significantly increased, especially at the dosage of 1 μM with 25.5 dots/cell in the D22 cell line (P < .001) and 10.9 dots/cell in the D17 cell line after 24 hours (P < .001) and 67.3 dots/cell in D22 and 11.7 dots/cell in D17 after 48 hours of treatment (P < .001 and P < .01) (Fig. 4a,b). Regarding mitophagy, in the D22 cell line, the percentage of LC3 puncta colocalizing with mitochondria significantly increased after treatment with 55.3% at 1 μM after 24 hours and 53% and 63.7% after 48 hours at 0.5 μM and 1 μM, respectively (P < .001). In the D17 cell line, the percentage of colocalized puncta was 14% at 0.5 μM and 1 μM after 24 hours and significantly increased after 48 hours of treatment with 18.2% and 16.8% at 0.5 μM and 1 μM, respectively (Fig. 4c,d).
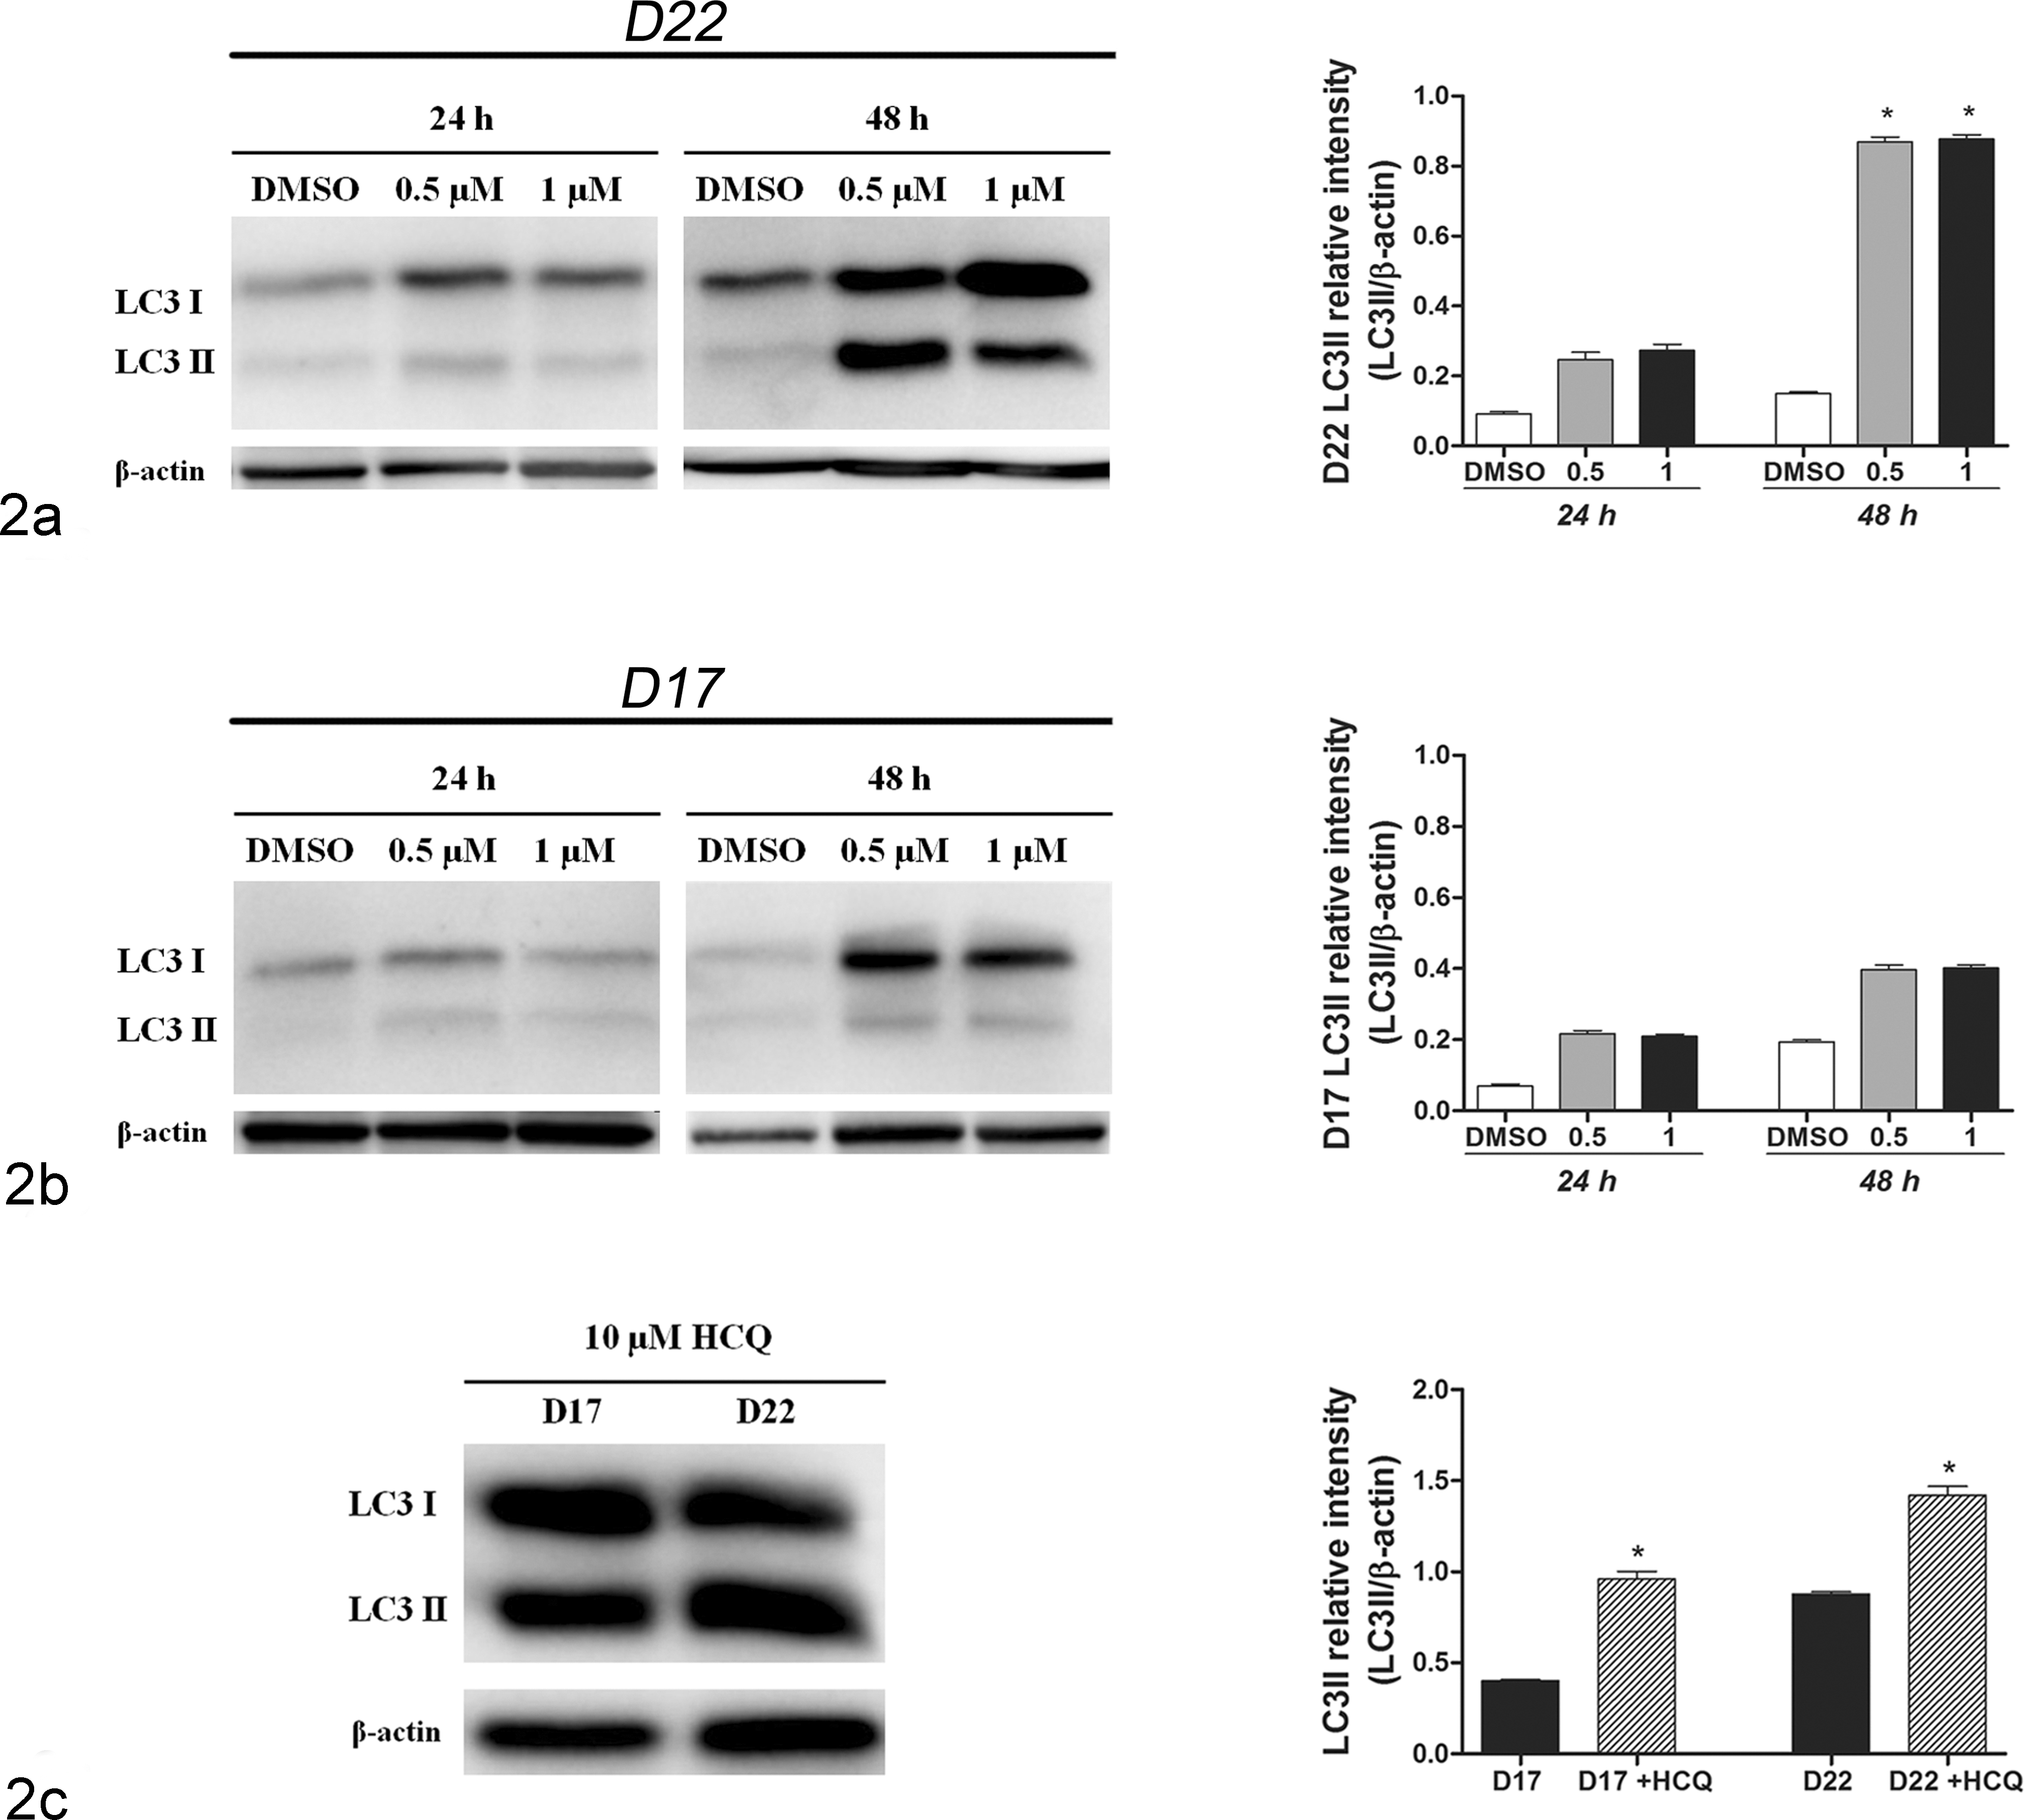
Autophagy quantification: treated cell cultures were immunoblotted for detecting the LC3 protein. Bar graph represents means ± SEM of LC3-II relative intensity (LC3-II/β-actin) in the treated D22 and D17 cell lines from 3 independent experiments. 17-AAG (17-allylamino-17-demethoxygeldanamycin) dosages, on the x-axis, are expressed in μM. Statistically significant differences between treated and unstimulated control cells are shown by asterisks (*P < .05). (a) LC3 immunoblotting and quantification of 17-AAG–treated D22 cells. (b) LC3 immunoblotting and quantification of 17-AAG–treated D17 cells. (c) LC3 immunoblotting and quantification of D17 and D22 cells treated with 1 μM 17-AAG for 48 hours followed by 10 μM hydroxychloroquine (HCQ) for 24 hours.
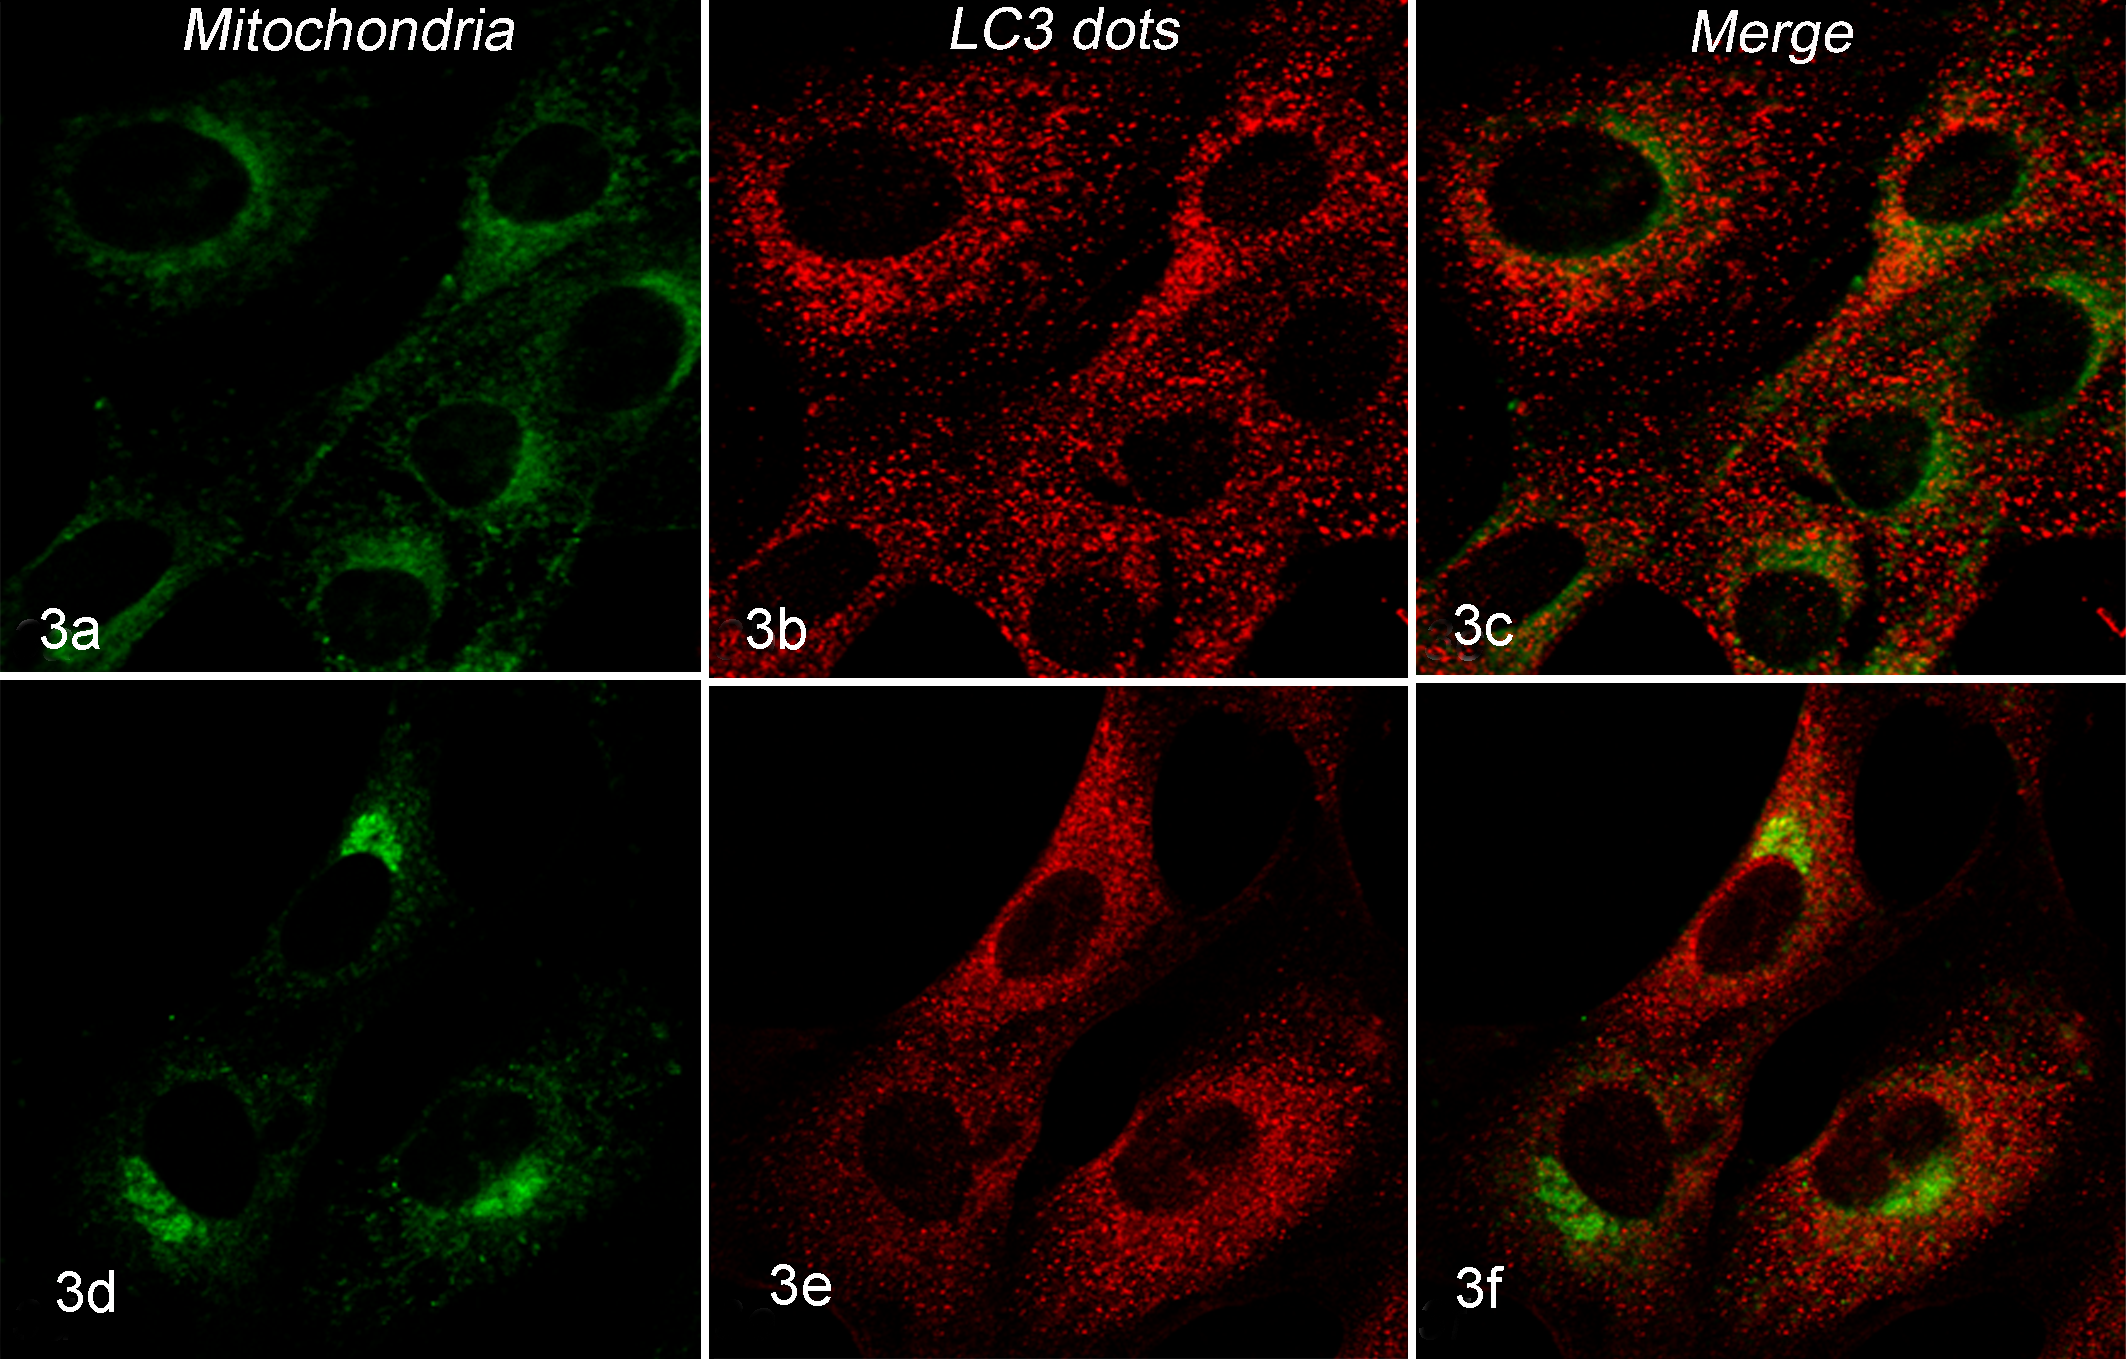
Mitochondrial localization of LC3-II in D22-treated culture. Figures show, from left to right, green mitochondria, red LC3-II dots, and merge (mitochondria + LC3-II dots). LC3-II dots and their colocalization with mitochondria increased after 17-AAG (17-allylamino-17-demethoxygeldanamycin) treatment in D22 cell lines in a dose-dependent manner. (a–c) D22 cells treated for 48 hours with 0.5 μM 17-AAG. (d–f) D22 cells treated for 48 hours with 1 μM 17-AAG.
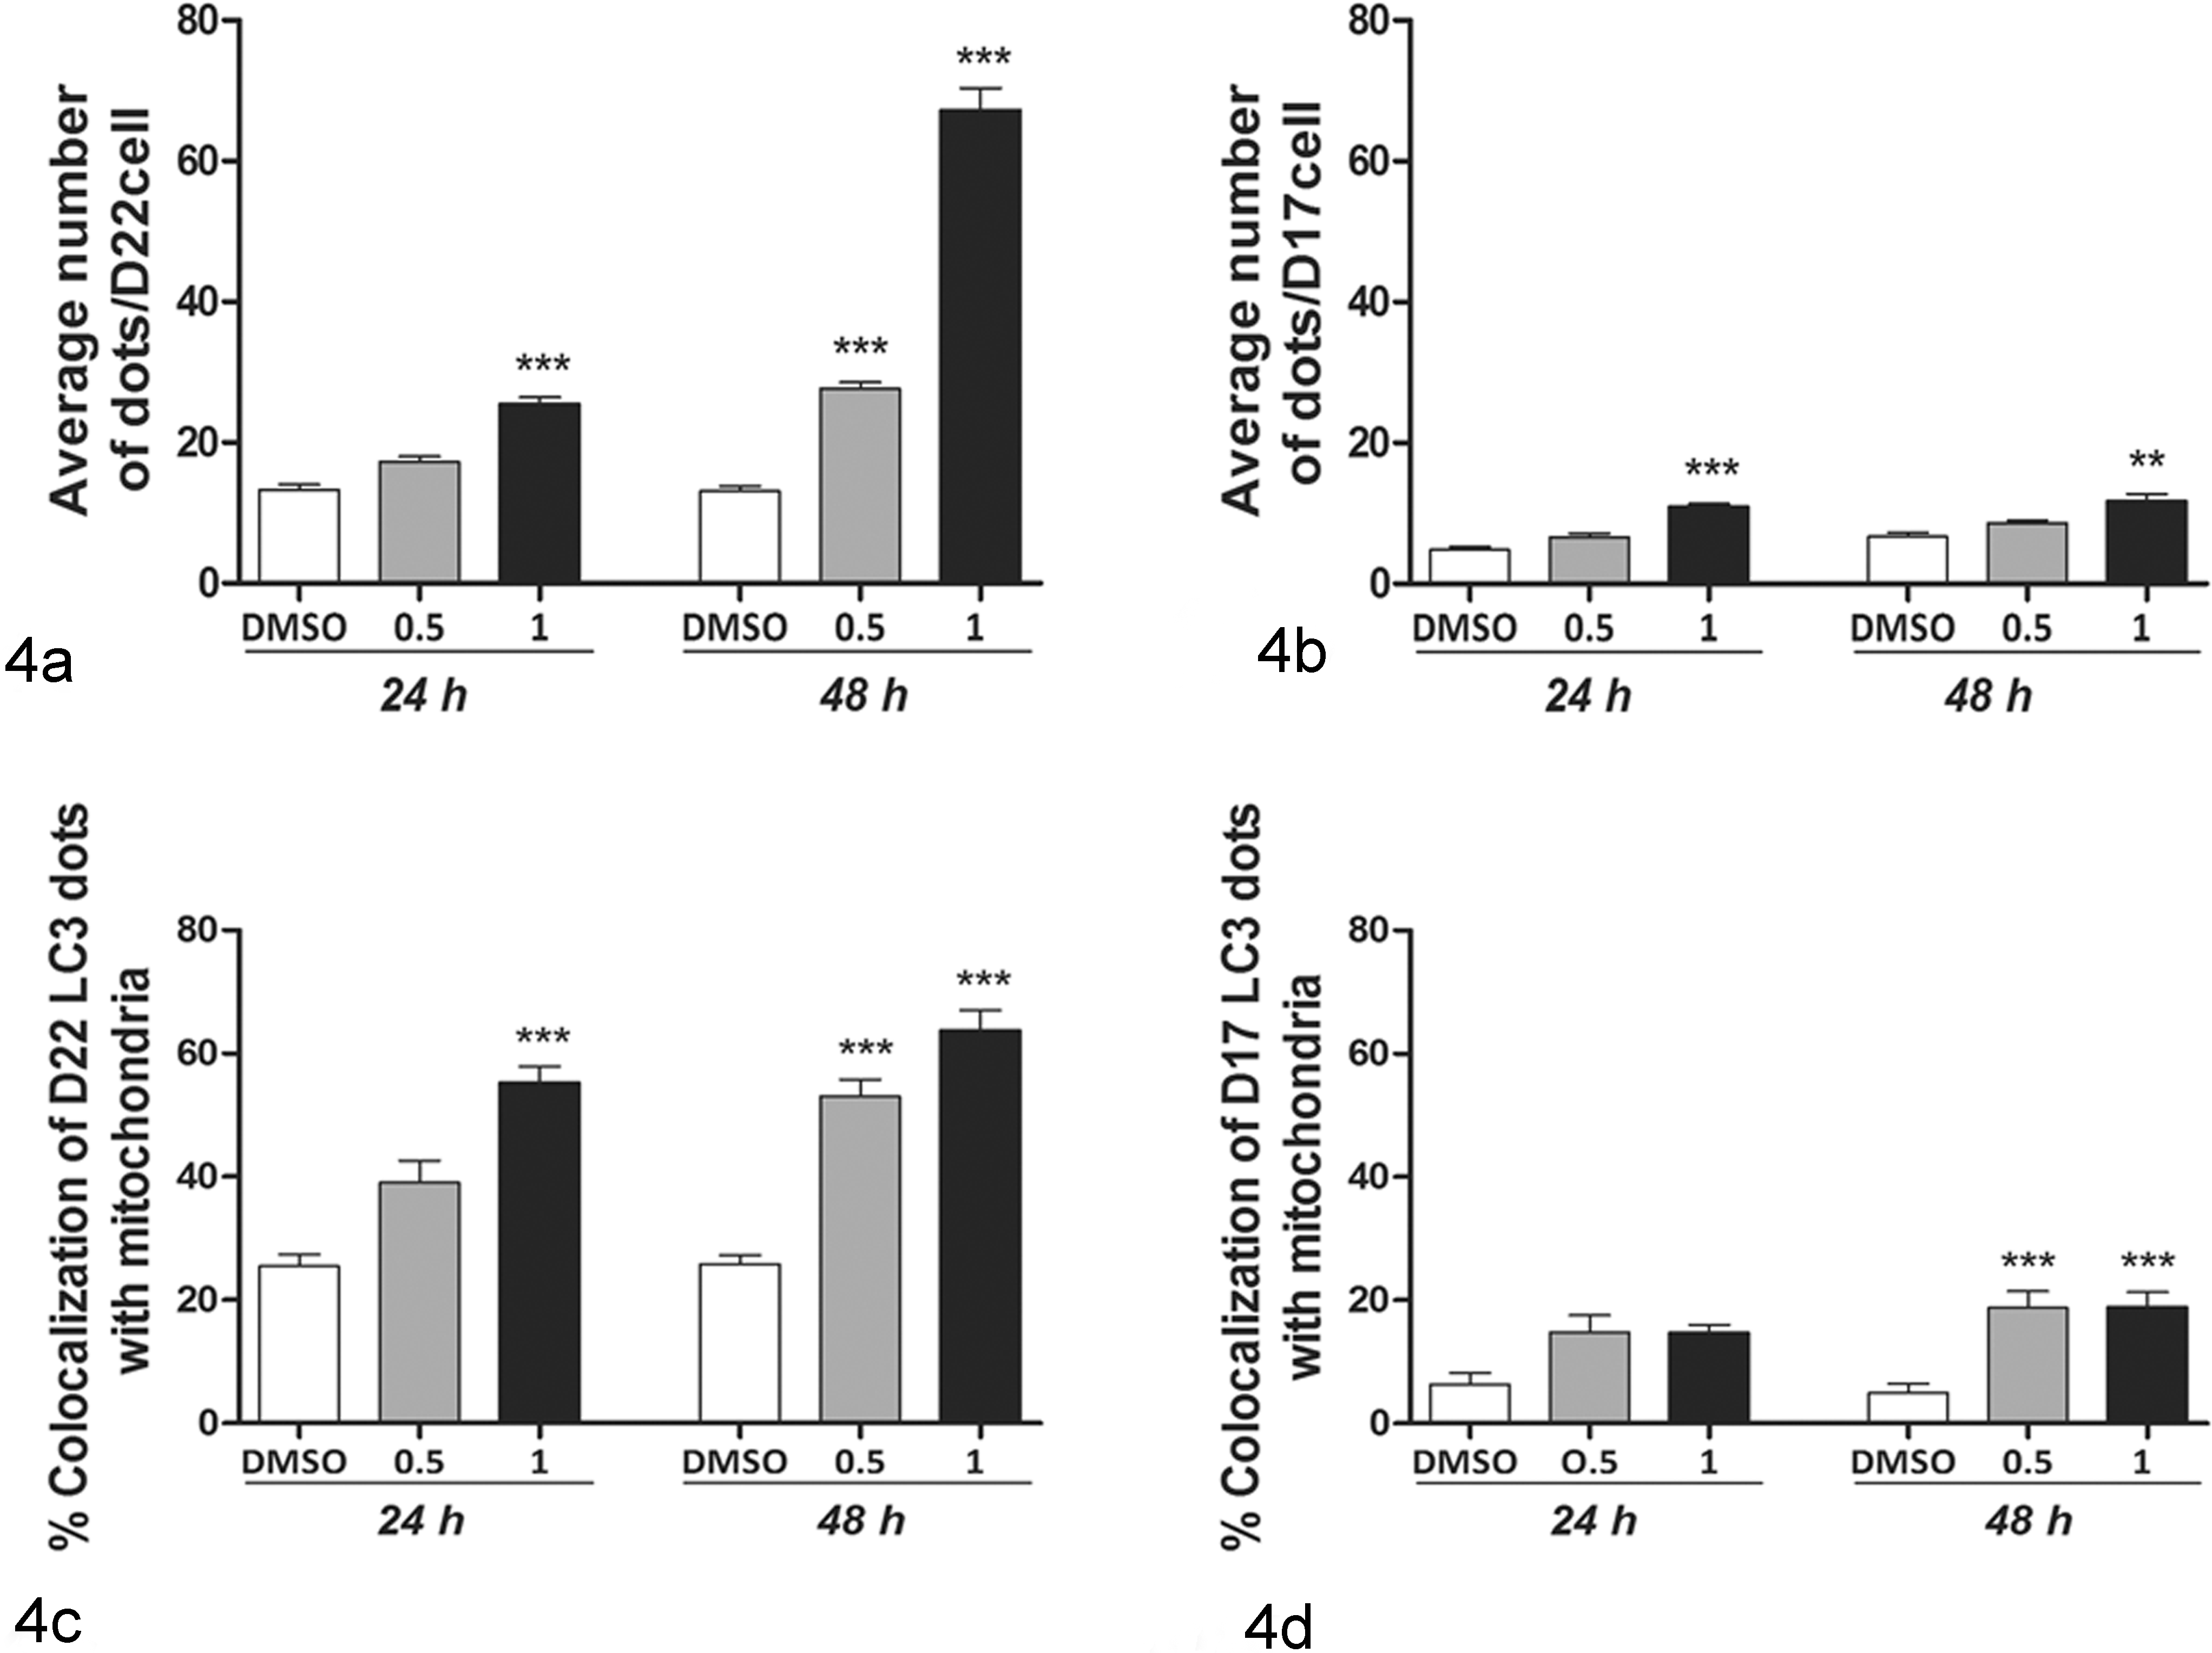
Autophagy and mitophagy quantification following 17-AAG (17-allylamino-17-demethoxygeldanamycin) treatment. Bar graph represents means ± SEM (30 cells analyzed per group) from 3 independent experiments. 17-AAG dosages, on the x-axis, are expressed in μM. Statistically significant differences between treated and unstimulated control cells are shown by asterisks (**P < .01, ***P < .001). Autophagy and mitophagy increased in both cell lines in a dose- and time-dependent manner. Figures show (a) average number of LC3 dots/cell in the D22-treated cell line, (b) average number of LC3 dots/cell in the D17-treated cell line, (c) percentage of LC3 puncta colocalizing with mitochondria in the D22-treated cell line, and (d) percentage of LC3 puncta colocalizing with mitochondria in the D17-treated cell line.
Discussion
This study reconfirms the ability of 17-AAG to induce apoptosis and autophagy in OSA cells, 22 and, in particular, the results identified a different rate of 17-AAG–induced autophagy and apoptosis between D22 and D17 canine OSA cell lines. The autonomous growth of metastatic cancer cells is associated with decreased apoptosis potential, and suppression of autophagy is a frequent feature of the malignant transformation. 9,39 Although both cell lines showed a constitutive level of autophagy, the average number of LC3 dots/cell in the D17 cell line, before and after treatment, was significantly lower compared with the D22 cell line. The absence of programmed cell death in the metastatic cell–derived (D17) canine OSA cell line usually associated with the expression of stem cell markers, such as Nanog and Oct4, may result from the heterogeneity and genetic instability acquired during cell reprogramming after detachment. 33 The latter may explain the lack of a clear interaction between autophagy and apoptosis in the D17 cell line, which was instead observed in the D22 cell line. In the primary tumor-derived D22 cell line, the 17-AAG–induced autophagy is likely to assist the proapoptotic activity of the drug. 29 In fact, during excessive cellular stress, apoptosis and autophagy crosstalk and cooperate to determine cell death. The autophagy-regulating proteins Beclin1, class III PI3 K (phosphatidylinositide 3-kinase), and ATG4D (autophagy related 4D) can all be cleaved by caspases and translocate into mitochondria, where they acquire new functions and can amplify the mitochondria-mediated apoptosis. 1,34 The molecular coupling of both events, autophagy and apoptosis, may suggest that the cellular response to stress is determined not only by the severity and duration of the insult 25 but also by specific cellular features. For example, caspase-3 expression showed a progressive decrease in canine OSA tissue from grade I to grade III. 2
Mitochondrial stress represents a switch between autophagy and apoptosis, because mitophagy could recycle damaged mitochondrial components preventing the initiation of the apoptotic pathway. 8 During stress conditions causing membrane potential depolarization, mitochondria remain in a postfissional state, and the continuous failure to fuse back into the mitochondrial network eventually leads to elimination through autophagy. 32 If the insult is not lethal and only a fraction of the mitochondrial pool is damaged, mitophagic degradation could rescue the cell and prevent cell death. 18
In D22 and D17 cell lines, mitophagy increased with autophagy in a dose- and time-dependent manner, confirming the ability of 17-AAG to reduce the mitochondrial membrane potential. 6 Mitophagy and autophagy increased simultaneously with apoptosis in D22 cells. On the other hand, 17-AAG treatment had significant effects on cell viability and death at low doses in the D17 cell line, suggesting that the increased drug-induced autophagy has a protective role at high doses. Despite this, mitophagy did not protect the D17 cell line from necrosis, since necrotic cells represented a small percentage of the cell population (up to 12.8%) after treatment. In the D22 cell line, a high level of necrosis was also observed in the control after 48 hours of culture, probably due to the lack of an efficient “Warburg effect” that supports the intense proliferation. 17
As shown in Figure 2, D22 and D17 cell lines also responded in a different manner to 17-AAG treatment, regarding Hsp90 expression. From a biochemical and molecular aspect, the tendency of D22 to slightly increase the Hsp90 transcript after 17-AAG treatment may be due to a “stress response” event mediated by Hsp90 inhibition, which causes increased degradation of its client proteins and co-chaperones. In this respect, similar data have been observed in the D17 OSA cell line after treatment with the Hsp90 inhibitor, STA-1474. 22
Furthermore, in OSA cells, both induction and inhibition of autophagy have been observed to enhance the pharmacologically induced apoptosis. 12,19,35,40 In this study, the correlation between autophagy and apoptosis was dependent on the cell type. The 17-AAG–induced autophagy was insufficient to drive effective apoptosis in the D17 cell line. On the other hand, the same process was probably able to reduce the mitochondria-mediated apoptosis. Previous studies carried out on a D17 cell line detected overexpression of proto-oncogenes inducing autophagy that promote resistance to chemotherapy. 24,30 Despite this, drug response evaluation of a greater number of primary and metastatic cells would be necessary to confirm that autophagy does not trigger apoptosis in metastatic cells, and instead has a cytoprotective role. More in general, the lower response of D17 cells to treatment can be determined by a lower binding affinity of Hsp90 to 17-AAG, which is strictly correlated to drug cytotoxic activity and may depend on the cell type and presence of Hsp90 in multichaperone complexes, which are the active and more druggable form of Hsp90. 15
The present study demonstrated a synergism between autophagy, mitophagy, and apoptosis in the 17-AAG–treated D22 canine OSA cell line, whereas D17 cells appeared to escape cell death programs induced by external stimuli, further confirming that the cell response to drug-induced stress may be dependent on the tumor cell phenotype. Additional investigations are necessary to better understand the molecular mechanisms influencing the different response of OSA cells to treatment and the interplay between autophagy and apoptosis.
Footnotes
Acknowledgements
We appreciate the generosity of Dr Anna Rita D’Angelo (Istituto Zooprofilattico Sperimentale dell’Abruzzo e del Molise) and Professor Luisa Gioia (Faculty of Veterinary Medicine, University of Teramo) for confocal microscopy image acquisition.
Declaration of Conflicting Interests
The author(s) declared no potential conflicts of interest with respect to the research, authorship, and/or publication of this article.
Funding
The authors disclosed receipt of the following financial support for the research, authorship, and/or publication of this article: The study was self-founded and partially supported by the Consorzio Interuniversitario Nazionale per la Bio-Oncologia (CINBO), Italy.
References
Supplementary Material
Please find the following supplemental material available below.
For Open Access articles published under a Creative Commons License, all supplemental material carries the same license as the article it is associated with.
For non-Open Access articles published, all supplemental material carries a non-exclusive license, and permission requests for re-use of supplemental material or any part of supplemental material shall be sent directly to the copyright owner as specified in the copyright notice associated with the article.