
Abstract
Feline injection-site sarcoma (FISS) is an aggressive tumor believed to arise from the proliferation of fibroblasts and myofibroblasts in areas of chronic inflammation, particularly at sites of injection. Local recurrence is frequent after surgical excision. Gelatinases (MMP-2 and MMP-9) and their inhibitor (TIMP-2) are endopeptidases pivotal in extracellular matrix remodeling and therefore in tumor invasiveness. The aim of this study was to investigate the immunohistochemical expression of MMP-2, MMP-9, and TIMP-2 in FISS to assess their usefulness as prognostic factors. Size, soft tissue sarcoma (STS) grading system, depth of infiltration, surgical margins, and Ki-67 index were evaluated as additional prognostic markers. Twenty-four cases of primary FISS were classified according to clinical follow-up as nonrecurrent (NR, n = 14; 58.3%) and recurrent (R, n = 10; 41.7%). MMP-2, MMP-9, and TIMP-2 were variably expressed in the FISS examined, confirming their role in tumor invasiveness, yet they did not show significant differences between the R and NR groups. These results could be due to different tumor stages or to the multiple activities of these enzymes, not limited to ECM remodeling. The immunohistochemical expression of these enzymes considered alone does not seem to be useful as a prognostic marker. STS grading system, depth of infiltration, surgical margins, and Ki-67 index did not relate to recurrence. Instead, the size of the tumor, measured after formalin fixation, with an optimal cutoff of 3.75 cm (accuracy = 86%; P < .05), and the mitotic count, with an optimal cutoff of 20 mitoses/10 HPF (accuracy = 80%; P < .05), could be evaluated as useful prognostic markers.
Keywords
Feline injection-site sarcoma (FISS) is a subcutaneous tumor that rarely arises in the dermis. 17 It commonly develops at sites of vaccination; hence, in the past it was named “vaccine-associated fibrosarcoma” or “postvaccinal sarcoma.” 9,18,22 Recent studies postulate that, besides vaccines, several different stimuli, such as injection of foreign material, trauma, and microchip implantation, induce chronic inflammation in the subcutis or in the muscle and can be responsible for neoplastic transformation and FISS occurrence. 6,10,25,26 Feline injection-site sarcomas are characterized by the proliferation of atypical spindle cells and often by a variable amount of multinucleated giant cells. Histologically, the majority of these tumors are fibrosarcomas, but other histologic variants such as rhabdomyosarcoma, myxosarcoma, chondrosarcoma, osteosarcoma, and histiocytic sarcoma have been recognized. 9,17 Lymphocytic aggregates can be seen mostly at the periphery of the tumor; necrosis is often prominent. 15 Feline injection-site sarcomas show high local aggressiveness and tend to recur frequently after surgical excision. Metastases are rare. 25
The aggressiveness of a tumor is directly related to its ability to invade and infiltrate the surrounding healthy tissue and to metastasize to distant organs. Alterations in extracellular proteolysis can lead to unregulated tumor growth, tissue remodeling, inflammation, tissue invasion, and metastasis. 23 Extracellular matrix (ECM) turnover is finely regulated in physiological conditions, but when deregulation occurs, it becomes a cause of many diseases, including invasive cancer. 30 Matrix metalloproteinases (MMPs) are proteolytic enzymes involved in ECM remodeling and tumor invasion. 4 Since their activity can allow cancer cell spread, they have been widely investigated as prognostic factors and possible therapeutic targets in different types of tumors, including sarcomas, both in human and veterinary oncology. 1,3,12,14,34 Gelatinases, namely MMP-2 and MMP-9, are a subgroup of MMPs that cleave gelatin (denatured collagen), different types of collagen, and other extracellular matrix components. 7,24 These proteases are inhibited by tissue inhibitors of matrix metalloproteinases (TIMPs). TIMP-2 inhibits both MMP-2 and MMP-9 activity and is important in regulating ECM remodeling, since it can inhibit tumor cell invasion and migration. 29 Altered expression of these enzymes is critical in different physiological and pathological processes and has been investigated in numerous feline conditions. 2,31,32,39,41 Sorensen et al 36 evaluated a group of MMPs on fresh FISS biopsies with reverse transcriptase-polymerase chain reaction (RT-PCR), showing that MMP-2 and membrane type-MMP-16 were correlated with survival time.
The soft tissue sarcoma (STS) grading system was derived from human guidelines; 8,42 adapted to dogs, 11 it is based on 3 parameters: degree of differentiation, mitotic count, and tumor necrosis. It has also been applied to FISS but showed variable prognostic significance. 9,15,33
Another interesting prognostic factor seems to be the status of surgical margins. 15 However, the possibility of recurrence despite clean excisional margins suggests that an aggressive surgical excision could not nullify the risk of local recurrence. 33
The purpose of this retrospective study were to evaluate the prognostic value of the immunohistochemical expression of gelatinases (MMP-2, MMP-9) and their inhibitor (TIMP-2) in FISS. Prognostic significance of size (major diameter), tumor grade according to the STS grading system, depth of infiltration, status of surgical margins, and Ki-67 expression were evaluated.
Materials and Methods
Case Selection
Formalin-fixed and paraffin-embedded (FFPE) specimens from 24 cats with primary FISS were selected from the archive of the Department of Veterinary Medicine (University of Perugia, Italy). Patients were diagnosed between 2008 and 2013 and followed through December 2015. Selection criteria were as follows: localization of the tumor (interscapular/dorsal); type of treatment (curative excisional surgery); the availability of follow-up information (telephone interview with referring veterinarian); a minimum 24-month follow-up period, considering FISS disease-free intervals reported in literature;
5,15,19,27
and consensual diagnosis of FISS, based on typical histologic features.
9
Age, breed, sex, and spaying/neutering state of the animals were collected from the department’s database. The size (major diameter) of the tumors was measured after formalin fixation (24 to 48 hours depending on specimen size) with a caliper and recorded at the moment of trimming due to the lack of available clinical information on all cases.
Histologic Evaluation
All specimens were cut into 5-μm sections, routinely stained with hematoxylin and eosin, and examined by light microscopy. Blind histologic evaluations were performed for each sample by 3 operators (IP, CB, MS), with re-evaluation in case of disagreement. The initial diagnosis of FISS was confirmed and tumors were graded and classified based on the STS grading system 40 (Table 1). Mitotic count (MC) was blindly evaluated, counting the number of mitoses on 10 contiguous high power fields (HPF) (field number of the ocular of 22 and a 40× objective 28 ), starting from hotspots and avoiding areas with necrosis or severe inflammation. The total number of mitoses was recorded and the mean value for the 3 operators was assessed. Depth of infiltration was recorded (D = dermal; S = subcutaneous; M = muscular). Evaluation of margins was possible on 19 of 24 cases (79.2%): the specimens were trimmed in 3-mm slices, with parallel slicing at regular intervals. 21 The most representative sections, in particular the ones where the tumor macroscopically approached the surgical margins, were selected. The number of histologic cassettes obtained was related to the dimension of the tumor (from 2 to 10 cassettes). Histologically, margins were classified as suggested in the literature 11 into I (infiltrated = specimens where neoplastic cells were continuous with at least 1 surgical margin in any plane) and NI (noninfiltrated = tumor cells did not reach surgical margins). Close margins (<3 mm) and clean margins (distance of at least 3–5 mm) were considered as NI. 11
Histologic Criteria Used for Soft Tissue Sarcoma Grading.a
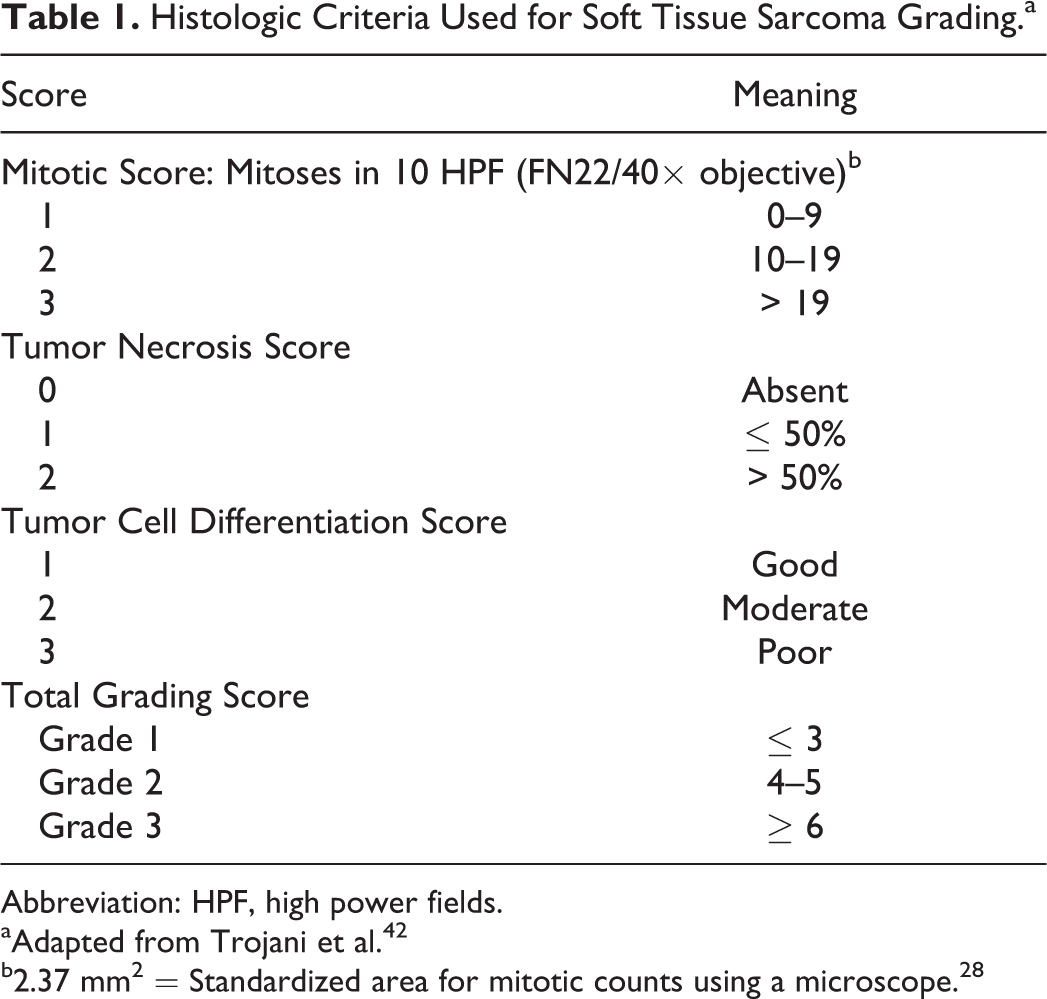
Abbreviation: HPF, high power fields.
aAdapted from Trojani et al. 42
b2.37 mm2 = Standardized area for mitotic counts using a microscope. 28
Immunohistochemistry
Samples were cut into slices of 5 μm and mounted on positively charged slides, dewaxed, and rehydrated. Immunohistochemistry was performed with standard protocols 32 using antibodies against MMP-2, MMP-9, TIMP-2, and Ki-67. Protocols for each antibody are summarized in Supplementary Table 1. Briefly, after incubation with primary antibodies, slides were treated with an ABC ready-to-use kit (Abcam, Cambridge, UK) following the manufacturer’s instructions. Positive reaction was revealed with 3-amino-9-ethilcarbazole (Dako, Glostrup, Denmark). Carazzi’s hematoxylin was used as a counterstain. Feline healthy myocardium was used as a positive control for MMPs and TIMP-2 as previously described. 2 Vimentin immunostaining was performed as a control of mesenchymal origin of the tumors. Negative controls were incubated with TBS, omitting the primary antibody. Immunostaining of MMP-2, MMP-9, and TIMP-2 was blindly evaluated by 3 operators (IP, AR, CB) and positive cells were given a percentage value (0%–100%) on the total number of neoplastic cells. Nuclear positivity stain for Ki-67 was evaluated in 10 randomly selected HPF, avoiding areas of inflammation and necrosis. The number of positive nuclei was recorded by each operator and a mean value was calculated for each case.
Statistical Analysis
Diagnostic graphics and Levene’s test were used to test assumptions and outliers. 13 At the end of the follow-up period, cases were assigned to recurrent (R) or nonrecurrent (NR) groups. Differences in age, tumor size, and number of mitoses as well as in MMP-2, MMP-9, TIMP-2, and Ki-67 expression between R and NR groups were preliminarily analyzed using Mann–Whitney tests. Correlation between mitoses/HPF and Ki-67 were examined using Spearman rank correlations (ρ). Values are expressed as mean ± standard deviation (SD), and median (Mdn) with interquartile range (IQR). Data classified into categories (breed, sex, spaying/neutering status, mitotic score, differentiation score, necrosis score, STS grade, completeness of margins, depth of infiltration) were preliminarily compared between R and NR groups using Fisher exact test and were expressed as number and percentage. We used the Life Table method to determine survival probabilities and Kaplan–Meier method to calculate disease-free and survival times. The differences of survival rate between R and NR groups were evaluated by the log-rank test. Cats lost to follow-up and cats that died from causes unrelated to FISS were censored and included for survival analysis. The prognostic significance of each variable in recurrence and survival was further evaluated by the univariate Cox proportional hazards model (Cox regression) and expressed as hazard ratio (HR) with corresponding 95% confidence intervals (CIs) and P values (from Wald statistic). The receiver operating characteristic (ROC) analysis methodology was used to assess the diagnostic accuracy of the parameters to detect recurrence. On the basis of the AUC statistic, the diagnostic test can be noninformative (AUC = 0.5), less accurate (0.5 < AUC ≤ 0.7), moderately accurate (0.7 < AUC ≤ 0.9), highly accurate (0.9 < AUC < 1), or perfect (AUC = 1). 16,40 Optimal cutoff values were determined as points on the curve closest to (0, 1) and by the Youden index. ROC curves were compared by a critical ratio z. 16 Statistical analysis was performed using SPSS 20.0 (SPSS Inc., Chicago, IL) and P < .05 was considered statistically significant.
Results
Clinical Data
The age of the cats at the moment of the diagnosis ranged between 6 and 16 years, with a mean value of 11 ± 3 years (Mdn = 11, IQR = 10–13). Twenty-two of 24 (91.7%) were domestic shorthair and 2 of 24 (8.3%) were Siamese cats. Of the 24 cats included in the study, 10 (41.7%) were males whereas 13 (54.2%) were females. The sex of 1 cat was not recorded. Particularly, 6 of 10 males (60.0%) were neutered and 7 of 13 females (53.8%) were spayed. No statistically significant differences between the R and NR groups were observed regarding age, breed, sex, and spaying/neutering status. Follow-up at the end of the study ranged from 739 to 2467 days, with a median follow-up of 1222 days. More than 70% of the study population had a follow-up at the end of the study > 3 years, with 30% of cases being followed for > 4 years. The 6-month, 1-year, and 2-year estimated probabilities of not developing recurrence of cats that experienced primary FISS (n = 24) were 79% ± 8%, 67% ± 10%, and 62% ± 10%, respectively, whereas their estimated survival probabilities were 96% ± 4%, 75% ± 9%, and 75% ± 9%, respectively (mean ± SD). The follow-up recorded after a minimum period of 24 months after surgical excision showed that FISS recurred in 10 out of 24 cases (41.7%). No metastases were detected. For cats that experienced recurrence (R group, n = 10), the median disease-free interval was 162 days (IQR = 93–245 days), whereas the median survival time was 327 days (IQR = 273–994 days). The 6-month, 1-year, and 2-year estimated survival probabilities of R cats were 90% ± 9%, 37% ± 16%, and 37% ± 16%, respectively. At the end of the study, 7 cats (70%) of the R group died from causes related to FISS and 3 (30%) were censored (2 cases lost to follow-up and 1 dead from causes unrelated to FISS) (Fig. 1a). As the NR group had no deaths due to tumor-related causes, survival time statistics were not calculated, whereas log-rank test showed significant differences in survival time between R and NR groups (χ2 = 17.6, P < .001).
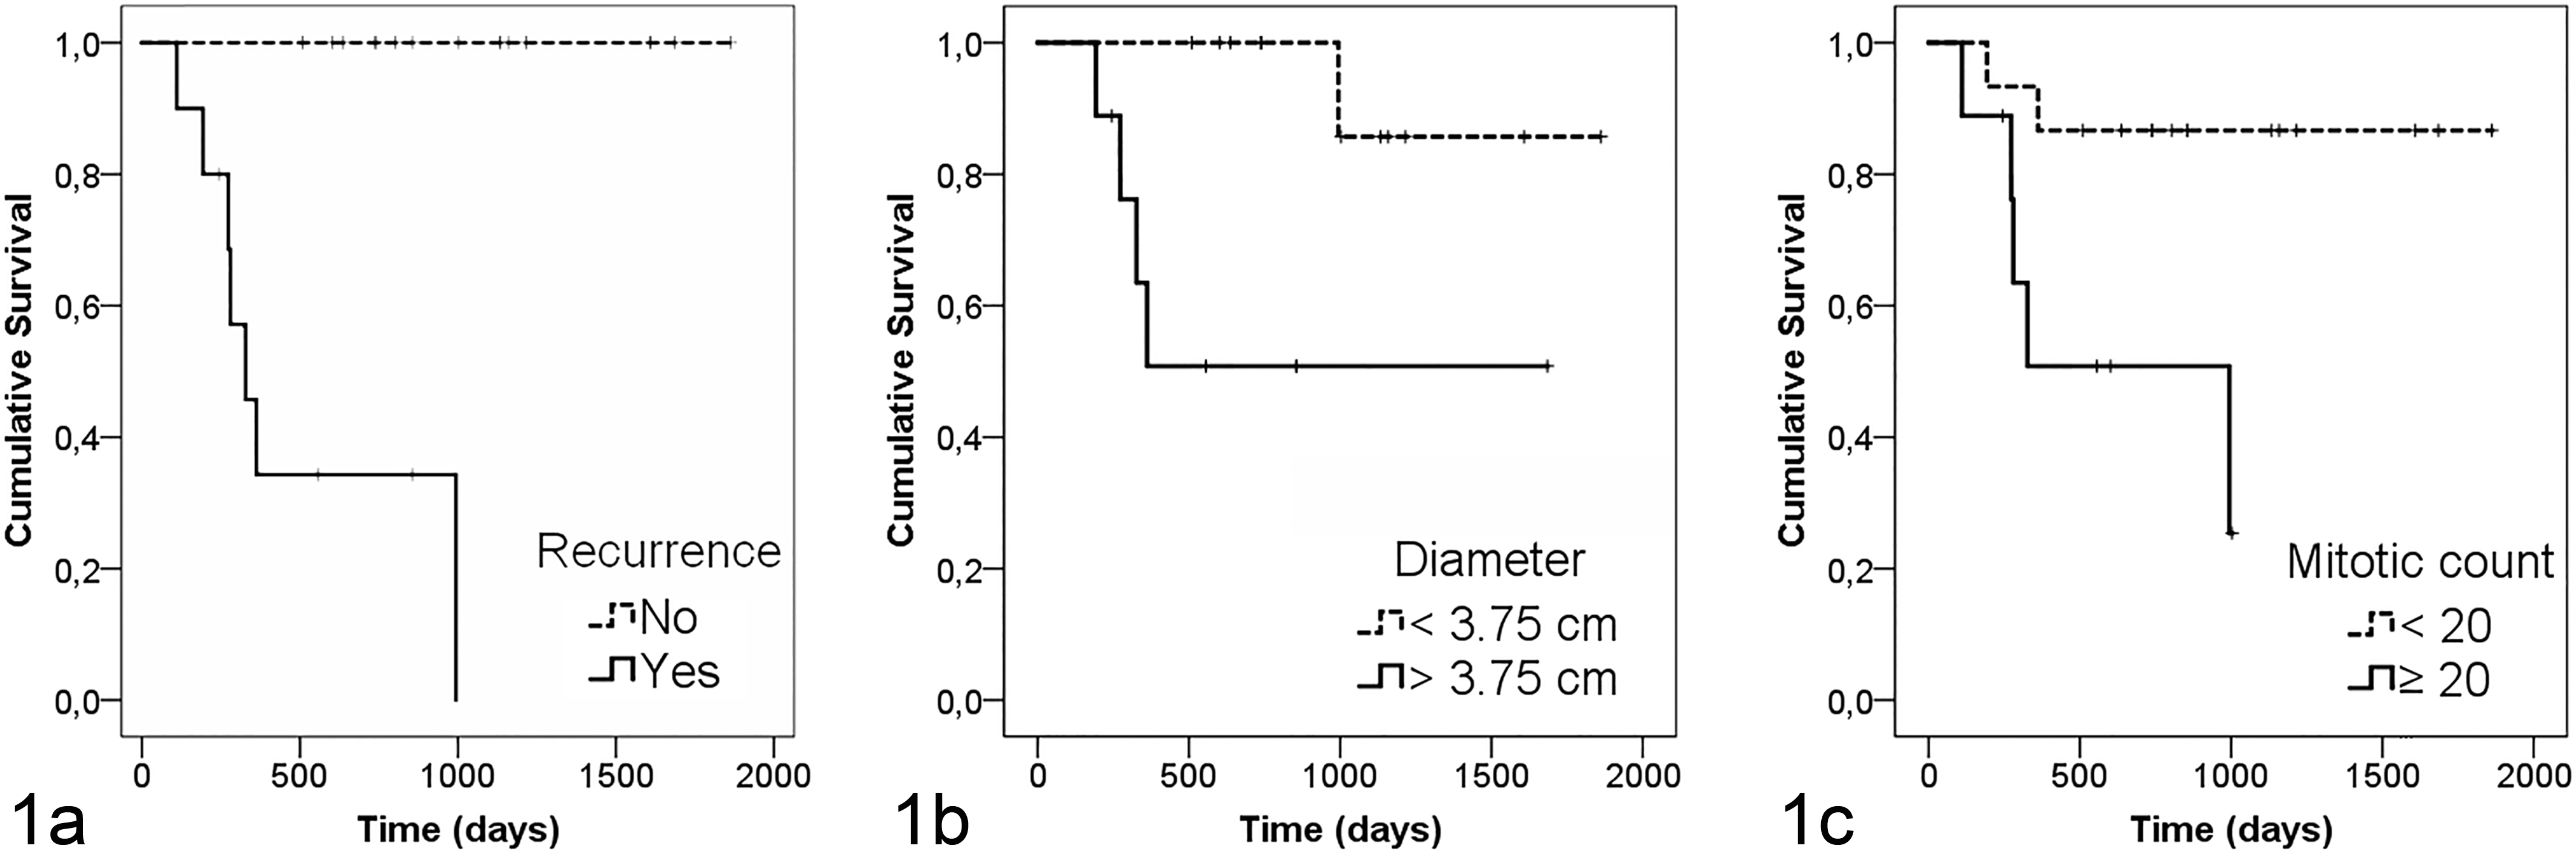
Kaplan–Meier overall survival curves in relation to recurrence (a), diameter (b), and mitotic count (c). Cats that experienced recurrence (n = 10; continuous line) showed reduced overall survival compared with cats that did not experience recurrence (n = 14; dashed line; P < .001). With regard to histologic evaluations, the median survival time was lower in cats with tumors ≥ 3.75 cm (n = 9; continuous line) than in those with tumors < 3.75 cm (n = 12; dashed line; P < .05) or in cats with mitotic count ≥ 20 (n = 9; continuous line) compared with those with mitotic count < 20 (n = 15; dashed line; P < .05). Ticks represent censored observations.
Tumor size (major diameter) of formalin fixed samples ranged between 1.5 and 8.0 cm. R tumors were larger (mean ± SD = 5.3 ± 2.1 cm; Mdn = 5.0 cm, IQR = 4.5–7.0 cm) than NR tumors (mean ± SD = 2.7 ± 1.1 cm; Mdn = 2.5 cm, IQR = 2.0–3.0 cm; P = .005) and the difference was statistically significant (P < .05), with the highest values of major diameter (+50%) in the R group. For each unit increase in tumor diameter, cats were 1.72 times more likely to have recurrence (HR = 1.72, 95% CI = 1.20–2.47; P = .003) and 1.88 times more likely to have tumor-related mortality (HR = 1.88, 95% CI = 1.10–3.20; P = .020).
Histologic Examination
Tumors were graded according to the STS grading system. Results are shown in Table 2. Two of 24 cases were classified as grade 1 sarcoma (1 R and 1 NR), 10 of 24 cases as grade 2 sarcoma (5 R and 5 NR), and 12 of 24 cases as grade 3 sarcoma (4 R and 8 NR). The STS grade did not differ statistically between R and NR groups (P = .830) and was not predictive of the risk of local recurrence (P = .885) or survival (P = .762). Only the mitotic score showed a statistically significant difference between the R and NR groups, with 7 of 10 animals in the R group (70%) having a mitotic score of 3 (P < .05). Hence, the number of mitoses was further investigated using MC values. MC was higher for the R group (mean ± SD = 27 ± 10 mitoses/HPF; Mdn = 29 mitoses/HPF, IQR = 19–33 mitoses/HPF) compared to the NR group (mean ± SD = 13 ± 6 mitoses/HPF; Mdn = 12 mitoses/HPF, IQR = 9–19 mitoses/HPF; P = .001). Cox models confirmed that MC was a good predictor of both recurrence (HR = 1.09, 95% CI = 1.04–1.14; P = .001) and mortality (HR = 1.07, 95% CI = 1.01–1.14; P = .017).
Soft Tissue Sarcoma Parameters and Grading.a
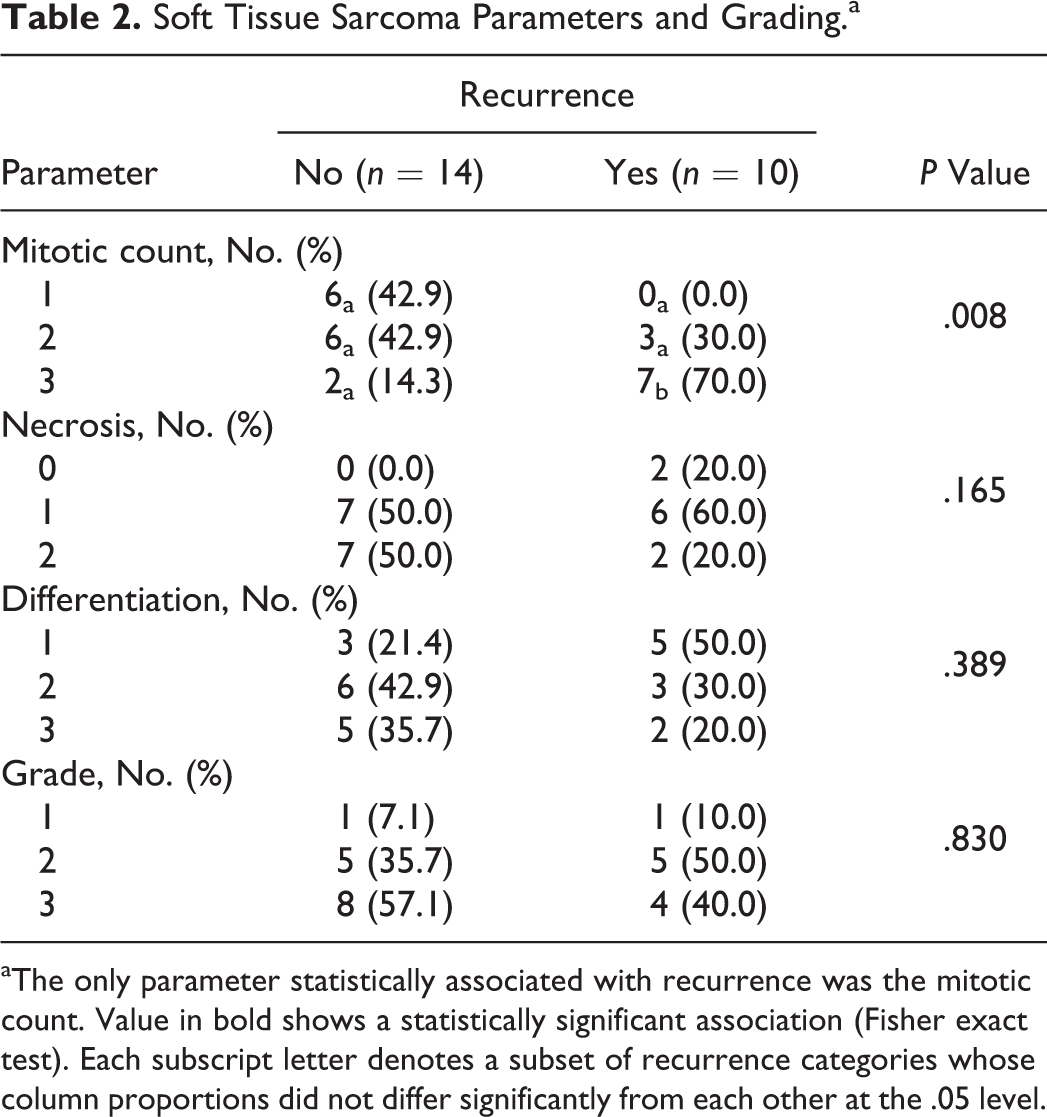
aThe only parameter statistically associated with recurrence was the mitotic count. Value in bold shows a statistically significant association (Fisher exact test). Each subscript letter denotes a subset of recurrence categories whose column proportions did not differ significantly from each other at the .05 level.
Depth of infiltration was assessed in 23 out of 24 cases (95.8%). None of the tumors was confined to the dermis; 15 of 23 FISSs infiltrated the subcutis (65.2%: 9 NR and 6 R) and 8 of 23 extended to the muscle layer (34.8%: 5 NR and 3 R). No associations between depth of infiltration and recurrence risk (P = .714) or survival (P = .283) were evidenced.
Margins were evaluated in 19 out of 24 tumors and were infiltrated in 6 of 19 cases (31.6%; 3 R and 3 NR) and not infiltrated in 13 of 19 cases (68.4%; 5 R and 8 NR). No association between completeness of surgical margins and recurrence risk was evidenced (P = 1.000).
Immunohistochemistry
MMP-2
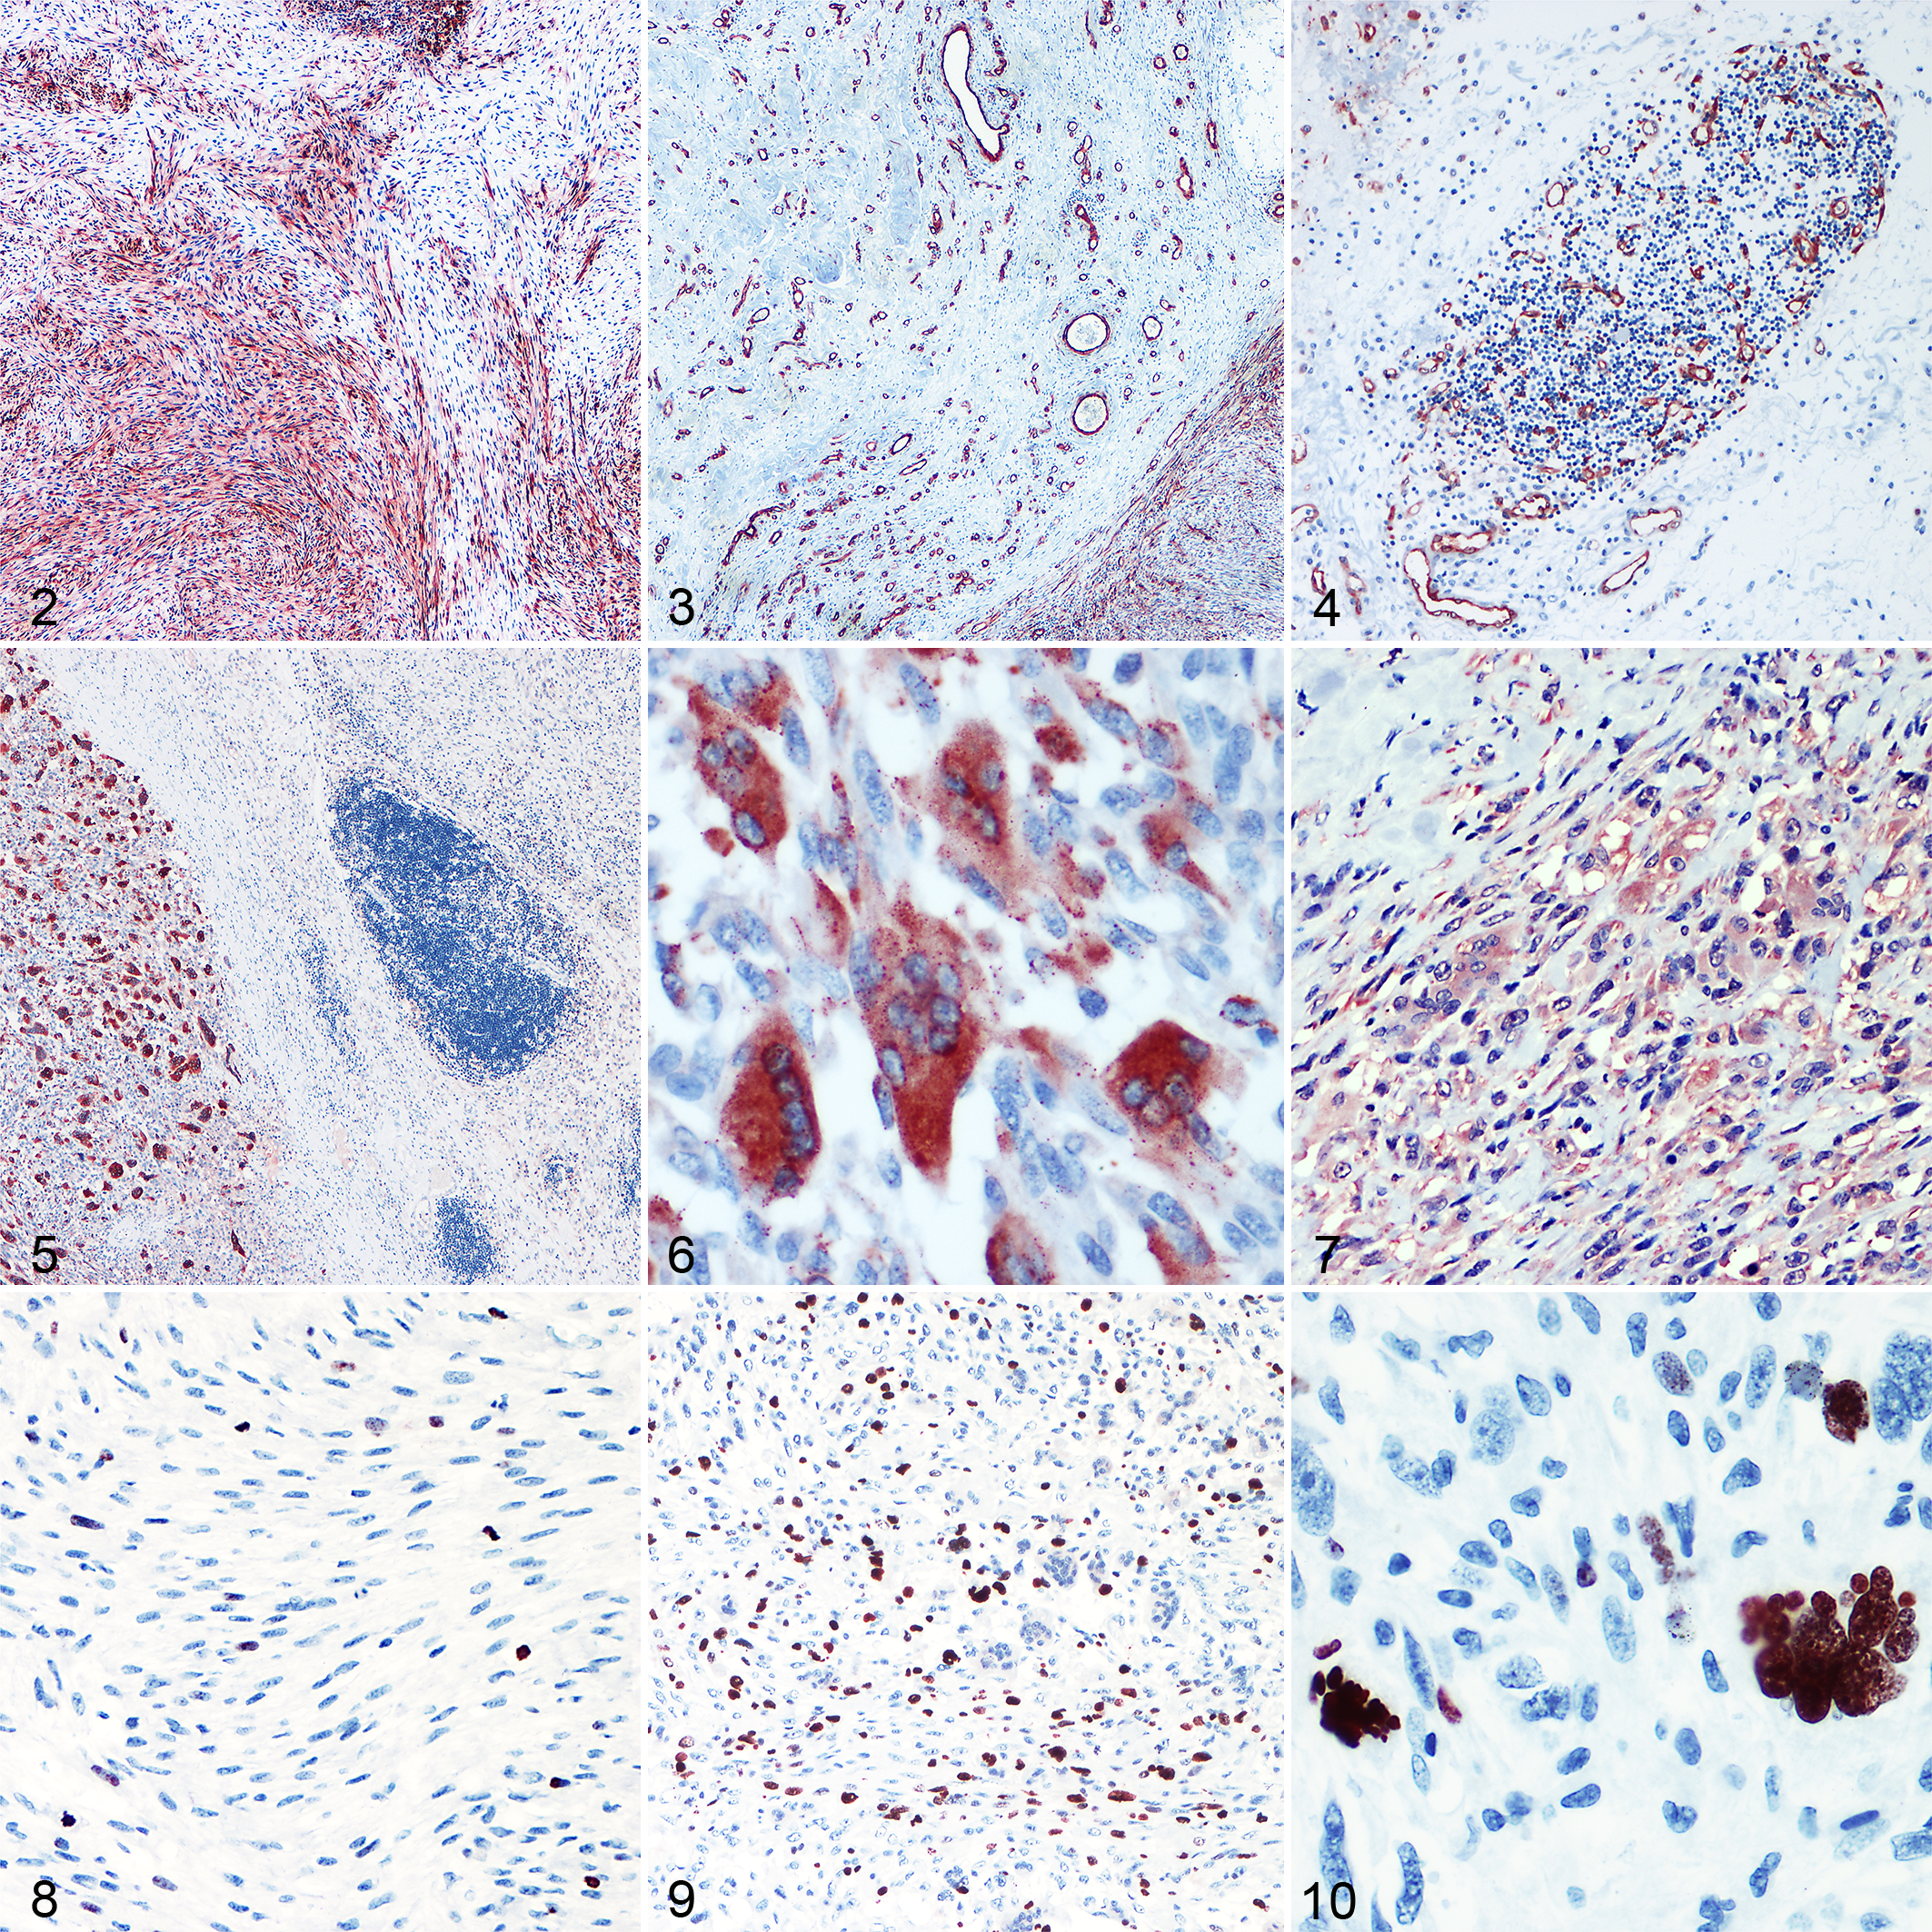
MMP-2 showed a highly variable percentage of cellular expression in both the R and NR groups. It was expressed in multifocal to coalescent areas in 22 of 24 cases (91.6%). The 2 negative tumors were in the R group (8.4%). R tumors showed a percentage of positive neoplastic cells between 0% and 83.3% (mean ± SD = 44.8% ± 33.9%; Mdn = 46.7%, IQR = 18.3%–80.0%). In the NR group, the percentage of positive cells ranged from 1.7% to 96.7% (mean ± SD = 37.6% ± 32.6%; Mdn = 25.8%, IQR = 11.7%–66.7%). The expression of this gelatinase was seen predominantly in the cytoplasm of mononucleated spindle cells (Fig. 2), with rare positivity in multinucleated giant cells. No difference in the percentage of MMP-2 expression between the R and NR groups was observed (P = .666; Fig. 11). Cox models confirmed that it was not a prognostic factor for recurrence (HR = 1.00, 95% CI = 0.99–1.03; P = .653) or survival (HR = 1.01, 95% CI = 0.99–1.01; P = .405). As an additional finding, positive staining was seen in intraneoplastic and peritumoral endothelial cells of small vessels (Fig. 3), particularly in the capillaries within lymphocytic aggregates (Fig. 4).
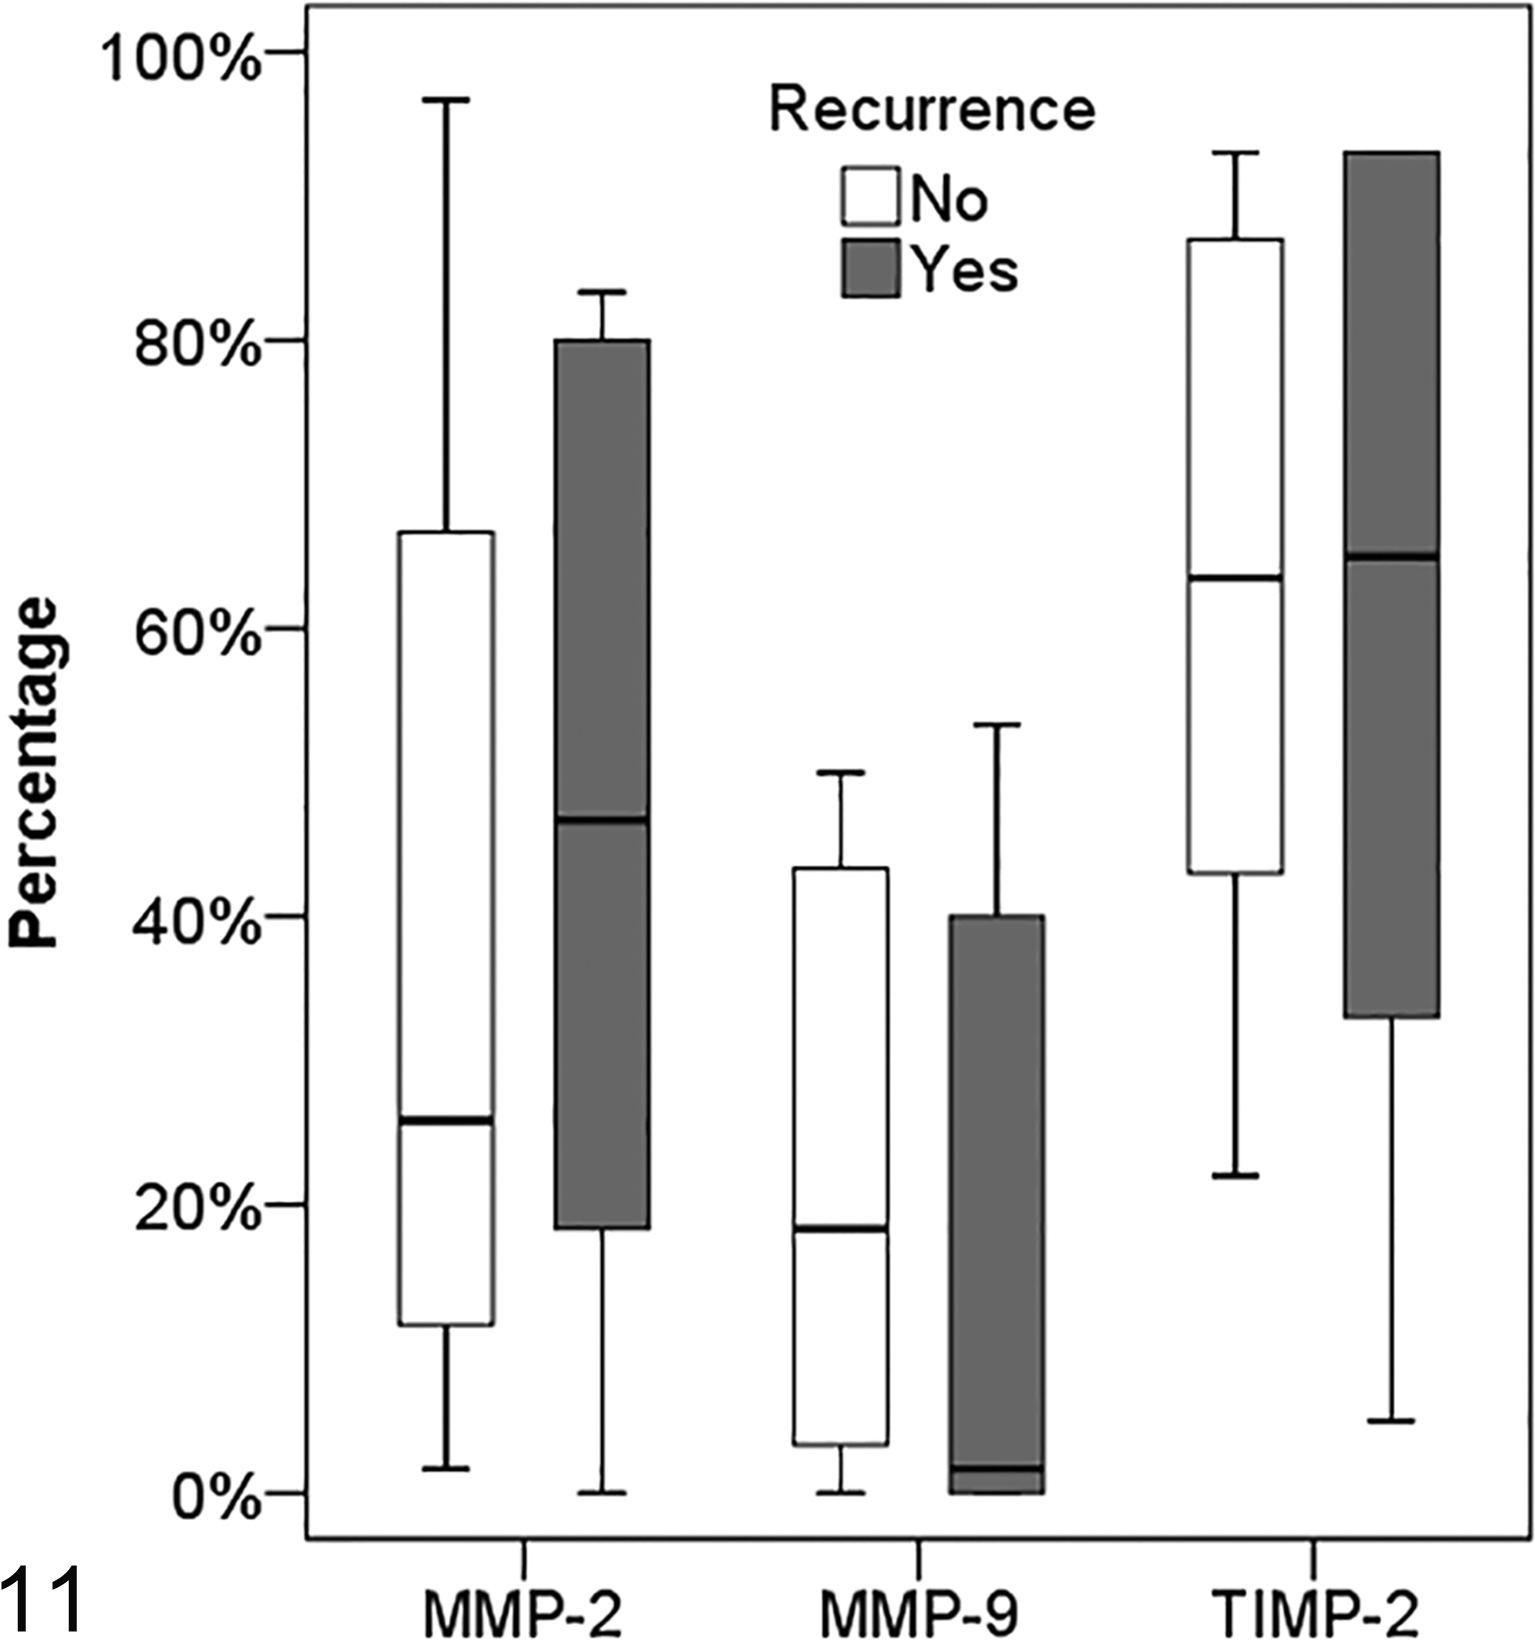
Box plots comparing MMP-2, MMP-9, and TIMP-2 expression in feline injection-site sarcomas according to clinical follow-up (recurrent: n = 10; nonrecurrent: n = 14).
MMP-9
MMP-9 expression was extremely variable and positive in multifocal to coalescent areas (Fig. 5). Five FISSs were completely negative (2 R and 3 NR). The percentage of positive cells in the R group ranged from 0.0% to 55.0% (mean ± SD = 14.9% ± 22.9%; Mdn = 1.7%, IQR = 0.0%–40.0%). Percentage values ranged from 0.0% to 50.0% in the NR group (mean ± SD = 21.2% ± 19.1%; Mdn = 18.3%, IQR = 3.3%–43.3%). Positive immunostaining was predominantly seen in the cytoplasm of multinucleated giant cells (Fig. 6) and seldom in mononucleated spindle cells with a weak staining intensity. No difference in the percentage of MMP-9 expression between the R and NR groups was observed (P = .235; Fig. 11). Cox models confirmed that the percentage of MMP-9 expression was not associated with the hazards of tumor recurrence (HR = 0.99, 95% CI = 0.96–1.03; P = .630) or death (HR = 0.99, 95% CI = 0.95–1.04; P = .750).
TIMP-2
TIMP-2 expression (Fig. 7) was seen in every tumor with a percentage of positive neoplastic cells ranging from 5.0% to 93.3% in the R group and from 22.0% to 93.0% in the NR group (R: mean ± SD = 59.1% ± 31.9%; Mdn = 65.0%, IQR = 33.0%–93.0%; NR: mean ± SD = 63.1% ± 26.1%; Mdn = 63.5%, IQR = 43.0%–87.0%). Positive immunostaining of cells was seen in the cytoplasm of both spindle and multinucleated giant cells. TIMP-2 expression did not differ between R and NR groups (P = .886; Fig. 11). Cox models confirmed that TIMP-2 was not a prognostic factor for recurrence (HR = 0.99, 95% CI = 0.97–1.02; P = .527) or survival (HR = 0.99, 95% CI = 0.96–1.01; P = .287).
Ki-67
Ki-67 immunostaining was predominantly seen in mononucleated cells (Figs. 8, 9) and only rarely in multinucleated giant cells (Fig. 10). The number of Ki-67 positive nuclei ranged from 4 to 38 for HPF (R: mean ± SD = 21.4 ± 14.4; Mdn = 18.7, IQR = 12.4–25.0; NR: mean ± SD = 23.7 ± 17.3; Mdn = 26.5, IQR = 8.5–43.1) but did not correlate with mitoses/HPF (ρ = 0.173; P = .418). There was no difference in the number of Ki-67+ nuclei between R and NR groups (P = .752). Ki-67 was not predictive of recurrence (HR = 0.99, 95% CI = 0.96–1.03; P = .736) or survival (HR = 1.00, 95% CI = 0.95–1.05; P = .975).
ROC analysis
Variables with a P value of < .05 from the bivariate analyses were considered candidate variables for detecting recurrence and submitted to ROC analysis (ie, tumor size and mitoses, expressed as both MC value and 1–3 score). Area under ROC for major diameter was 0.861 (95% CI = 0.653–1.000; P = .007; Fig. 12) and Youden index analysis revealed that the optimal cutoff for predicting recurrence was 3.75 cm (sensitivity = 88%, specificity = 85%, accuracy = 86%). We found a lower median survival time in cats with tumors ≥ 3.75 cm than in cats with tumors < 3.75 cm (medians not reached; log rank test: χ2 = 5.7, P = .017; Fig. 1b). The area under ROC for MC was 0.882 (95% CI = 0.747–1.000; P = .002; Fig. 12). The optimal cutoff of MC = 20 was associated with a sensitivity of 70%, a specificity of 86%, and an accuracy of 80%. Median survival time was greater in cases with MC < 20 (median not reached) than in cases with MC ≥ 20 (Mdn = 994 days, 75th percentile = 280 days; log rank test: χ2 = 5.8, P = .016; Fig. 1c). The sensitivity and specificity of MC for the prediction of recurrence were 70% and 86%, respectively (AUC = 0.800; 95% CI = 0.610–0.990; P = .014), whereas accuracy was 83%. There was no significant difference in AUC between diameter and MC (z = 0.16, P > .05) or between MC and mitotic score (z = 0.69, P > .05).
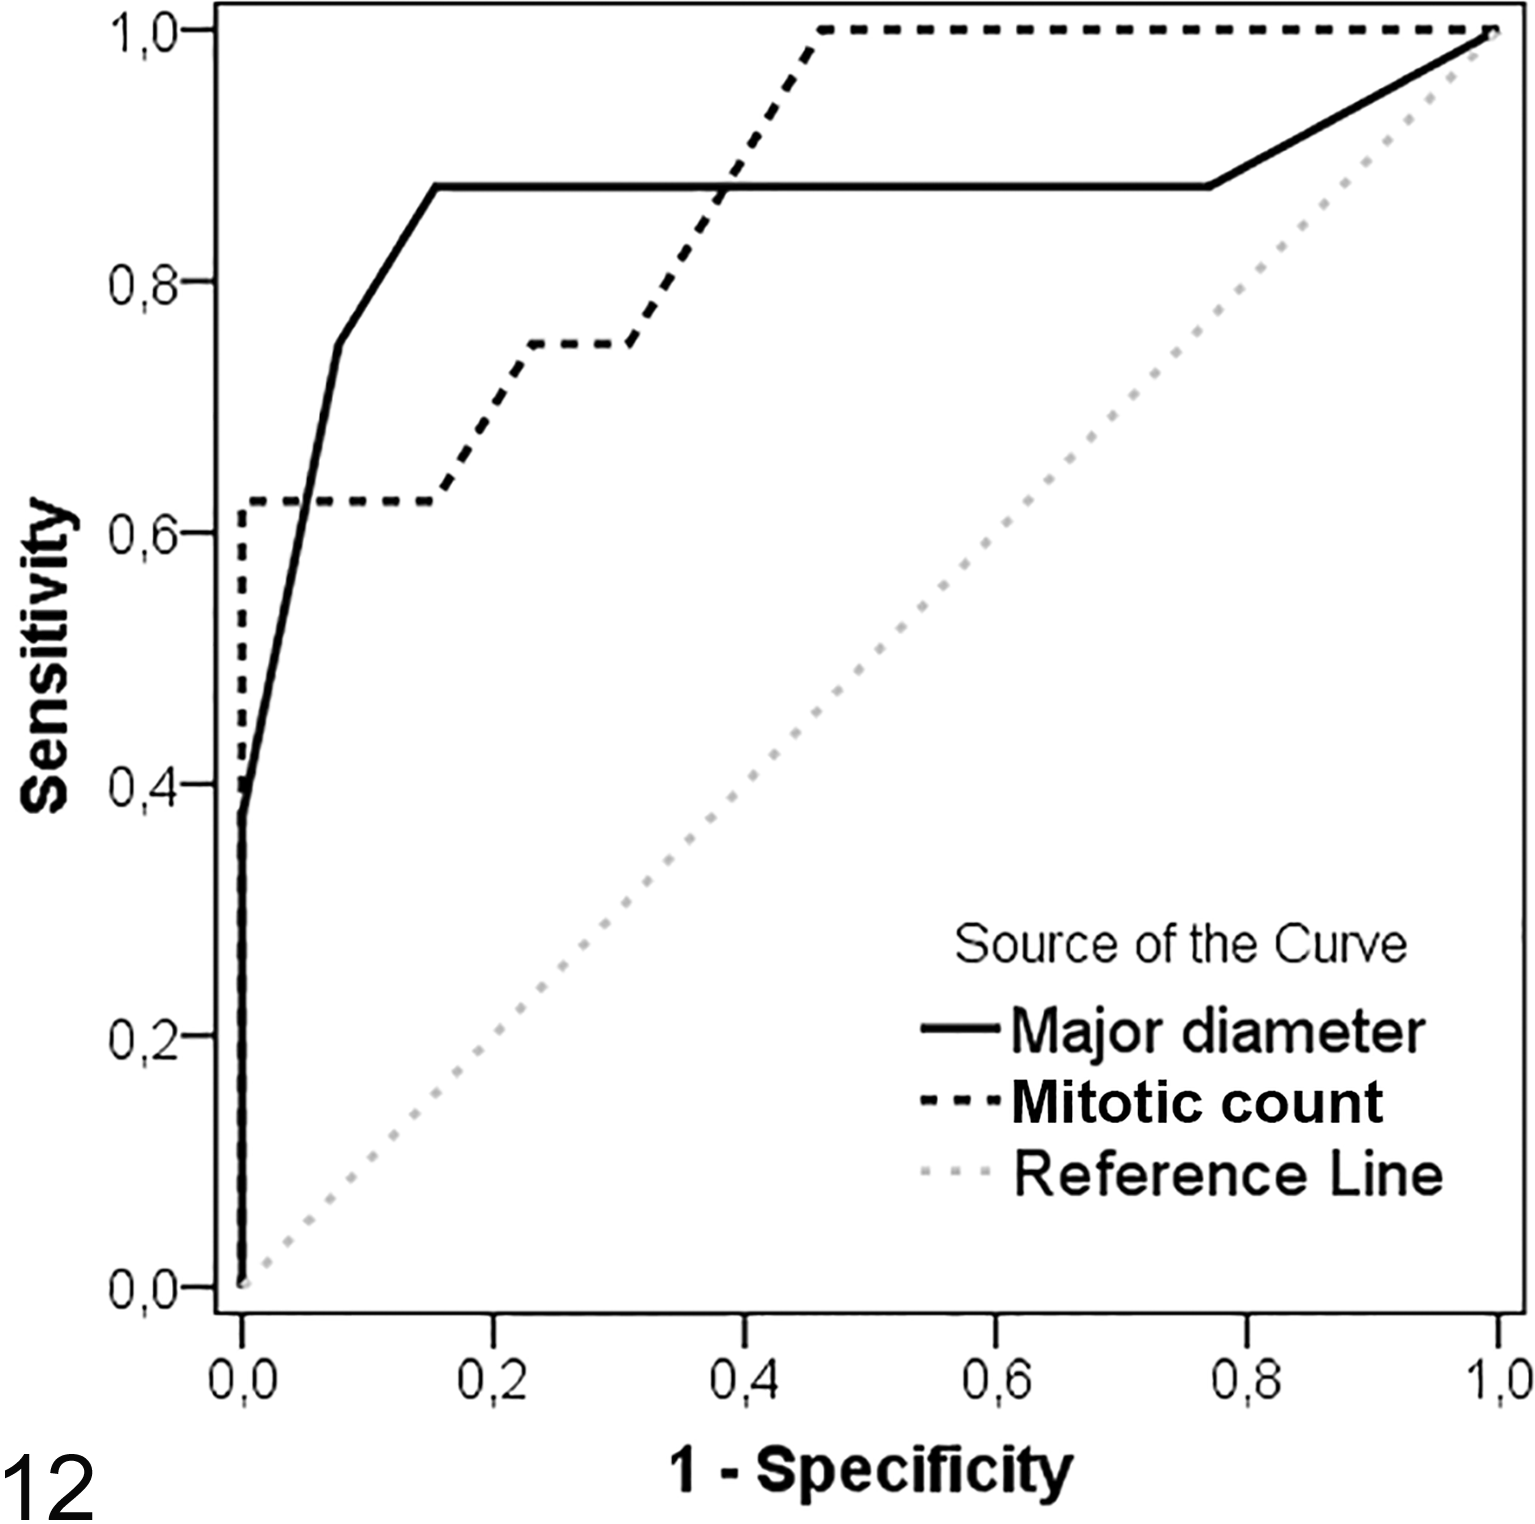
Receiver operating characteristic curves of mitotic count (AUC = 0.882) and major diameter (AUC = 0.861) for predicting recurrence.
Discussion
The aim of this retrospective study was to investigate the expression of MMP-2, MMP-9, and one of their inhibitors, TIMP-2, by neoplastic cells to assess their possible role in predicting the biological behavior of the tumor. In addition, the prognostic value of size, STS grade, depth of infiltration, status of excisional margins, and Ki-67 index was investigated.
MMPs and TIMPs have been recognized in numerous studies as critical factors in tumor aggressiveness. 1,3,12,14,34 MMP-2 is a gelatinase that can cleave different substrates, in particular gelatine (denatured collagen). It was expressed by tumor cells in almost all FISSs examined, except in 2 cases, both recurrent. However, we did not find associations between MMP-2 and recurrence or survival. The role of MMP-2 in angiogenesis is controversial; in fact, it can both enhance cell survival and promote angiogenesis or induce apoptosis and inhibit neovascularization. 35 In our study, the endothelial expression of MMP-2 was seen in all cases, particularly at the periphery of the tumor, supporting the hypothesis of its pro-angiogenetic role in FISS. A strong endothelial immunostaining was also seen in the middle of lymphocytic aggregates, confirming its role in leukocyte migration. 37 MMP-9 is capable of degrading almost the same substrates of MMP-2, except collagen I. Its expression can be induced in different cell types by inflammation and its increase has been demonstrated in malignant cell lines. 24 Mmp9-deficient mice had a reduced cell-cancer proliferation compared to wild-type mice, indicating that MMP-9 produces growth-promoting signals. 12 As with MMP-2, no statistical difference between R and NR groups was evident. The variable results of MMP-2 and MMP-9 could have different explanations. First of all, the expression of MMPs can show high variability during different cancer stages. The disappointing results obtained in clinical trials with MMP inhibitors led to the hypothesis that MMPs could be more important in the early steps of cancer development than in late phases. 12 Moreover, in the past few years, it has been shown that MMP function is more complex than initially thought and goes beyond degradation of physical barriers. Indeed, MMP-2 and MMP-9 can also exhibit tumor-suppressing effects in several circumstances. 23 Considering that there are more than 20 known MMPs, MMP-2 and MMP-9 could contribute to tumor invasiveness yet not be critical factors. Our results suggest that the only immunohistochemical evaluation of MMP-2 and MMP-9 expression is not enough in defining FISS prognosis.
The MMP inhibitor TIMP-2 was expressed in every tumor investigated with no statistical difference between the 2 groups. This was an unexpected finding because TIMPs regulate MMP activity and the extent of tissue remodeling. Accumulating evidence demonstrates that TIMPs have physiologic function independent of their ability to block MMP activity. Particularly, TIMP-2 can promote differentiation of endothelial cells and fibroblasts, 20,38 perhaps contributing to tumor progression.
The lack of metastatic tumors in this study could be due to the fact that not all cats were evaluated with radiographs or computed tomography before death.
The size of the R FISSs was significantly higher than the NR ones (P < .05), confirming that a prompt intervention could be critical in determining the prognosis. The optimal cutoff was set at 3.75 cm. This cutoff point provides a sensitivity of 88% and a specificity of 85% in predicting tumor recurrence. However, it must be noted that this threshold refers to formalin fixed samples, due to the lack of clinical measurement for all cases, and therefore cannot be extrapolated to clinical measurements.
Feline injection-site sarcomas are often considered as soft-tissue sarcomas and several studies tried to evaluate the applicability of the STS grading system in prognosis assessment. 15,33 According to our results, the STS grading system was not predictive of lesion recurrence (P = .627). Indeed, the only statistically significant histologic parameter between the R and the NR tumors was the mitotic score (P < .05). Hence, the number of mitoses was further investigated using values of MC. Cox models showed that MC was a good predictor of both recurrence (P < .01) and mortality (P < .05). ROC curve confirmed that MC could be considered a useful prognostic parameter to predict FISS recurrence (P < .01) at the optimal cutoff of MC = 20. Patients with MC > 20 had a higher risk of recurrence and a lower median survival time. Necrosis and degree of differentiation were not significantly different between the 2 groups. Our data suggest that they should not be considered useful morphologic data in prognosis assessment, as already hypothesized in other studies. 15
No significant difference was observed between FISSs with I and NI margins. Cases where neoplastic cells were continuous with at least 1 surgical margin in any plane were classified as “I.” 11 Instead, tumors with “close” margins and “complete” margins were grouped together as NI, considering the small sample of this study. Our results seem to show that this 2-tier classification is not useful as a prognostic marker and to confirm that a wide excisional margin is recommended.
The Ki-67 index did not show statistical differences between the R and NR groups and the percentage of positive nuclei did not correlate with MC. The independence of Ki-67 fraction and MC has been recognized in different studies in both human and veterinary medicine. 20,43
In conclusion, MMP-2, MMP-9, and TIMP-2 seem to be important in FISS behavior because of their high expression, but none of them is sufficient as a unique prognostic marker. On the other hand, our study suggests that size (major diameter) and the MC should be taken into consideration as prognostic markers in the assessment of a useful grading system for FISS. Data from our study suggest 3.75 cm (major diameter of the formalin fixed tumor) and MC of 20 as threshold values to predict recurrence and define a prognosis in FISS. Since this is a retrospective study on a relatively small caseload, further investigations are needed to better assess additional useful prognostic markers.
Footnotes
Authors’ Note
This article was prepared in the Uniform Requirements format. For any additional inquiry on research materials, please contact the first author via e-mail:
Acknowledgements
We would like to thank Dr Giovanni Angeli, Dr Emilia del Rossi, Dr Marica Stazi, and Luca Stefanelli for their precious technical assistance.
Declaration of Conflicting Interests
The author(s) declared no potential conflicts of interest with respect to the research, authorship, and/or publication of this article.
Funding
The author(s) received no financial support for the research, authorship, and/or publication of this article.
References
Supplementary Material
Please find the following supplemental material available below.
For Open Access articles published under a Creative Commons License, all supplemental material carries the same license as the article it is associated with.
For non-Open Access articles published, all supplemental material carries a non-exclusive license, and permission requests for re-use of supplemental material or any part of supplemental material shall be sent directly to the copyright owner as specified in the copyright notice associated with the article.