
Abstract
Amyloid A (AA) amyloidosis is characterized by the extracellular deposition of AA amyloid and results in the irreversible dysfunction of parenchymal organs. In experimental models, AA amyloid deposits are cleared following a decrease in circulating serum amyloid A (SAA) concentrations. Additional inflammatory stimuli during this recovery process may induce more severe amyloid redeposition. In the present study, we confirmed the deposition, clearance, and reinduction of AA amyloid deposits in interleukin 1 receptor antagonist knockout mice (IL-1raKO) and studied the SAA levels and amyloid-enhancing factor activity based on the time-dependent changes of amyloid deposition. Histopathologically, following initial (day 0) injection of amyloid-enhancing factor in combination with an inflammatory stimulus (silver nitrate [AgNO3]), amyloid deposition peaked by day 20, and its deposition gradually decreased after day 35. SAA concentrations in serum were precipitously elevated on day 1 but returned to normal levels by day 10, whereas the SAA dimer was detected in serum after day 45. An additional AgNO3 injection was administered to mice with amyloidosis on day 5, 10, 35, or 50, and all mice developed large amyloid deposits. Amyloid deposition was most severe in mice treated with AgNO3 on day 35. The inoculation of sera from mice with AA amyloidosis, combined with AgNO3, induced AA amyloidosis. Serum samples collected on days 35 and 50, which contained high concentrations of the SAA dimer, induced amyloidosis in a high proportion (83%) of mice. Therefore, increased SAA and/or its dimer in serum during the recovery process may markedly exacerbate the development of AA amyloidosis.
Keywords
Amyloid A (AA) amyloidosis is characterized by the extracellular deposition of AA amyloid and the precursor of amyloid, serum amyloid A (SAA), an acute-phase protein. 2,22 AA amyloidosis has been experimentally induced in mice by inflammatory stimuli, such as a subcutaneous (SC) injection of silver nitrate (AgNO3), 13 azocasein, 17,23 or Freund’s complete adjuvant. 17 The additional administration of an amyloid-enhancing factor (AEF), such as the homogenate of an amyloid-laden tissue, was previously shown to markedly shorten the period until onset of AA amyloidosis. 13,24 Experimental models of acute phase AA amyloidosis are commonly employed in studies examining the pathomechanism of AA amyloidosis. However, the severity and distribution pattern of amyloid deposits in experimental models differ from those in the end stage of human AA amyloidosis. 4,6,29 We recently reported the utilization of interleukin 1 receptor antagonist knockout (IL-1raKO) mice, 32 which spontaneously develop chronic arthritis in their limbs, 7 as an acute phase model of AA amyloidosis. IL-1raKO mice consistently maintain SAA concentrations that are 10-fold higher than those in BALB/c mice and also develop more severe AA amyloidosis than BALB/c mice following an injection of AEF and inflammatory stimuli. 32 These immunological and serological characteristics of IL-1raKO mice may be beneficial for research on AA amyloidosis.
In the medical field, a decrease in serum SAA levels to less than 4 μg/ml was previously reported to be effective for recovery from AA amyloidosis 11 and may also contribute to smaller AA amyloid deposits. 5,33 Reductions in AA amyloid deposits have also been confirmed in experimental models of acute phase AA amyloidosis. 19 Kuczynski 10 reported that splenic and hepatic AA amyloid deposits were cleared after the cessation of a casein treatment. Shirahama and Cohen 19 revealed that the rate of amyloid clearance was different in each organ; renal amyloid deposits were particularly difficult to clear. In acute phase experimental AA amyloidosis models, AA amyloid deposits were almost completely eliminated within 6 to 8 months after the cessation of stimuli, while an additional inflammatory stimulus reinduced excessive amyloid deposition. 16,19,25 Moreover, the additional inflammatory stimulus induced larger AA amyloid deposits, and a unique pattern of AA amyloid deposition, such as the glomerular amyloid deposits that appear in end-stage human AA amyloidosis, was observed. 16 The mechanisms underlying amyloid clearance and reinduction currently remain unclear. 14,16,25 We herein examined the clearance and reinduction of AA amyloid deposition in IL-1raKO mice to elucidate the mechanisms involved.
Materials and Methods
Animals
The study was approved by the Institutional Animal Care and Use Committee (IACUC) of the University of Tokyo. Eight-week-old IL-1raKO mice were used. The genetic information and physiological features of IL-1raKO mice have previously been described. 7,32 Five to 10 mice were housed in a cage with free access to food (MS food; Oriental Yeast, Tokyo, Japan) and drinking water.
Experimental Design
This study consisted of 3 experiments. Detailed experimental designs are presented in Figure 1 and Tables 1 to 3.
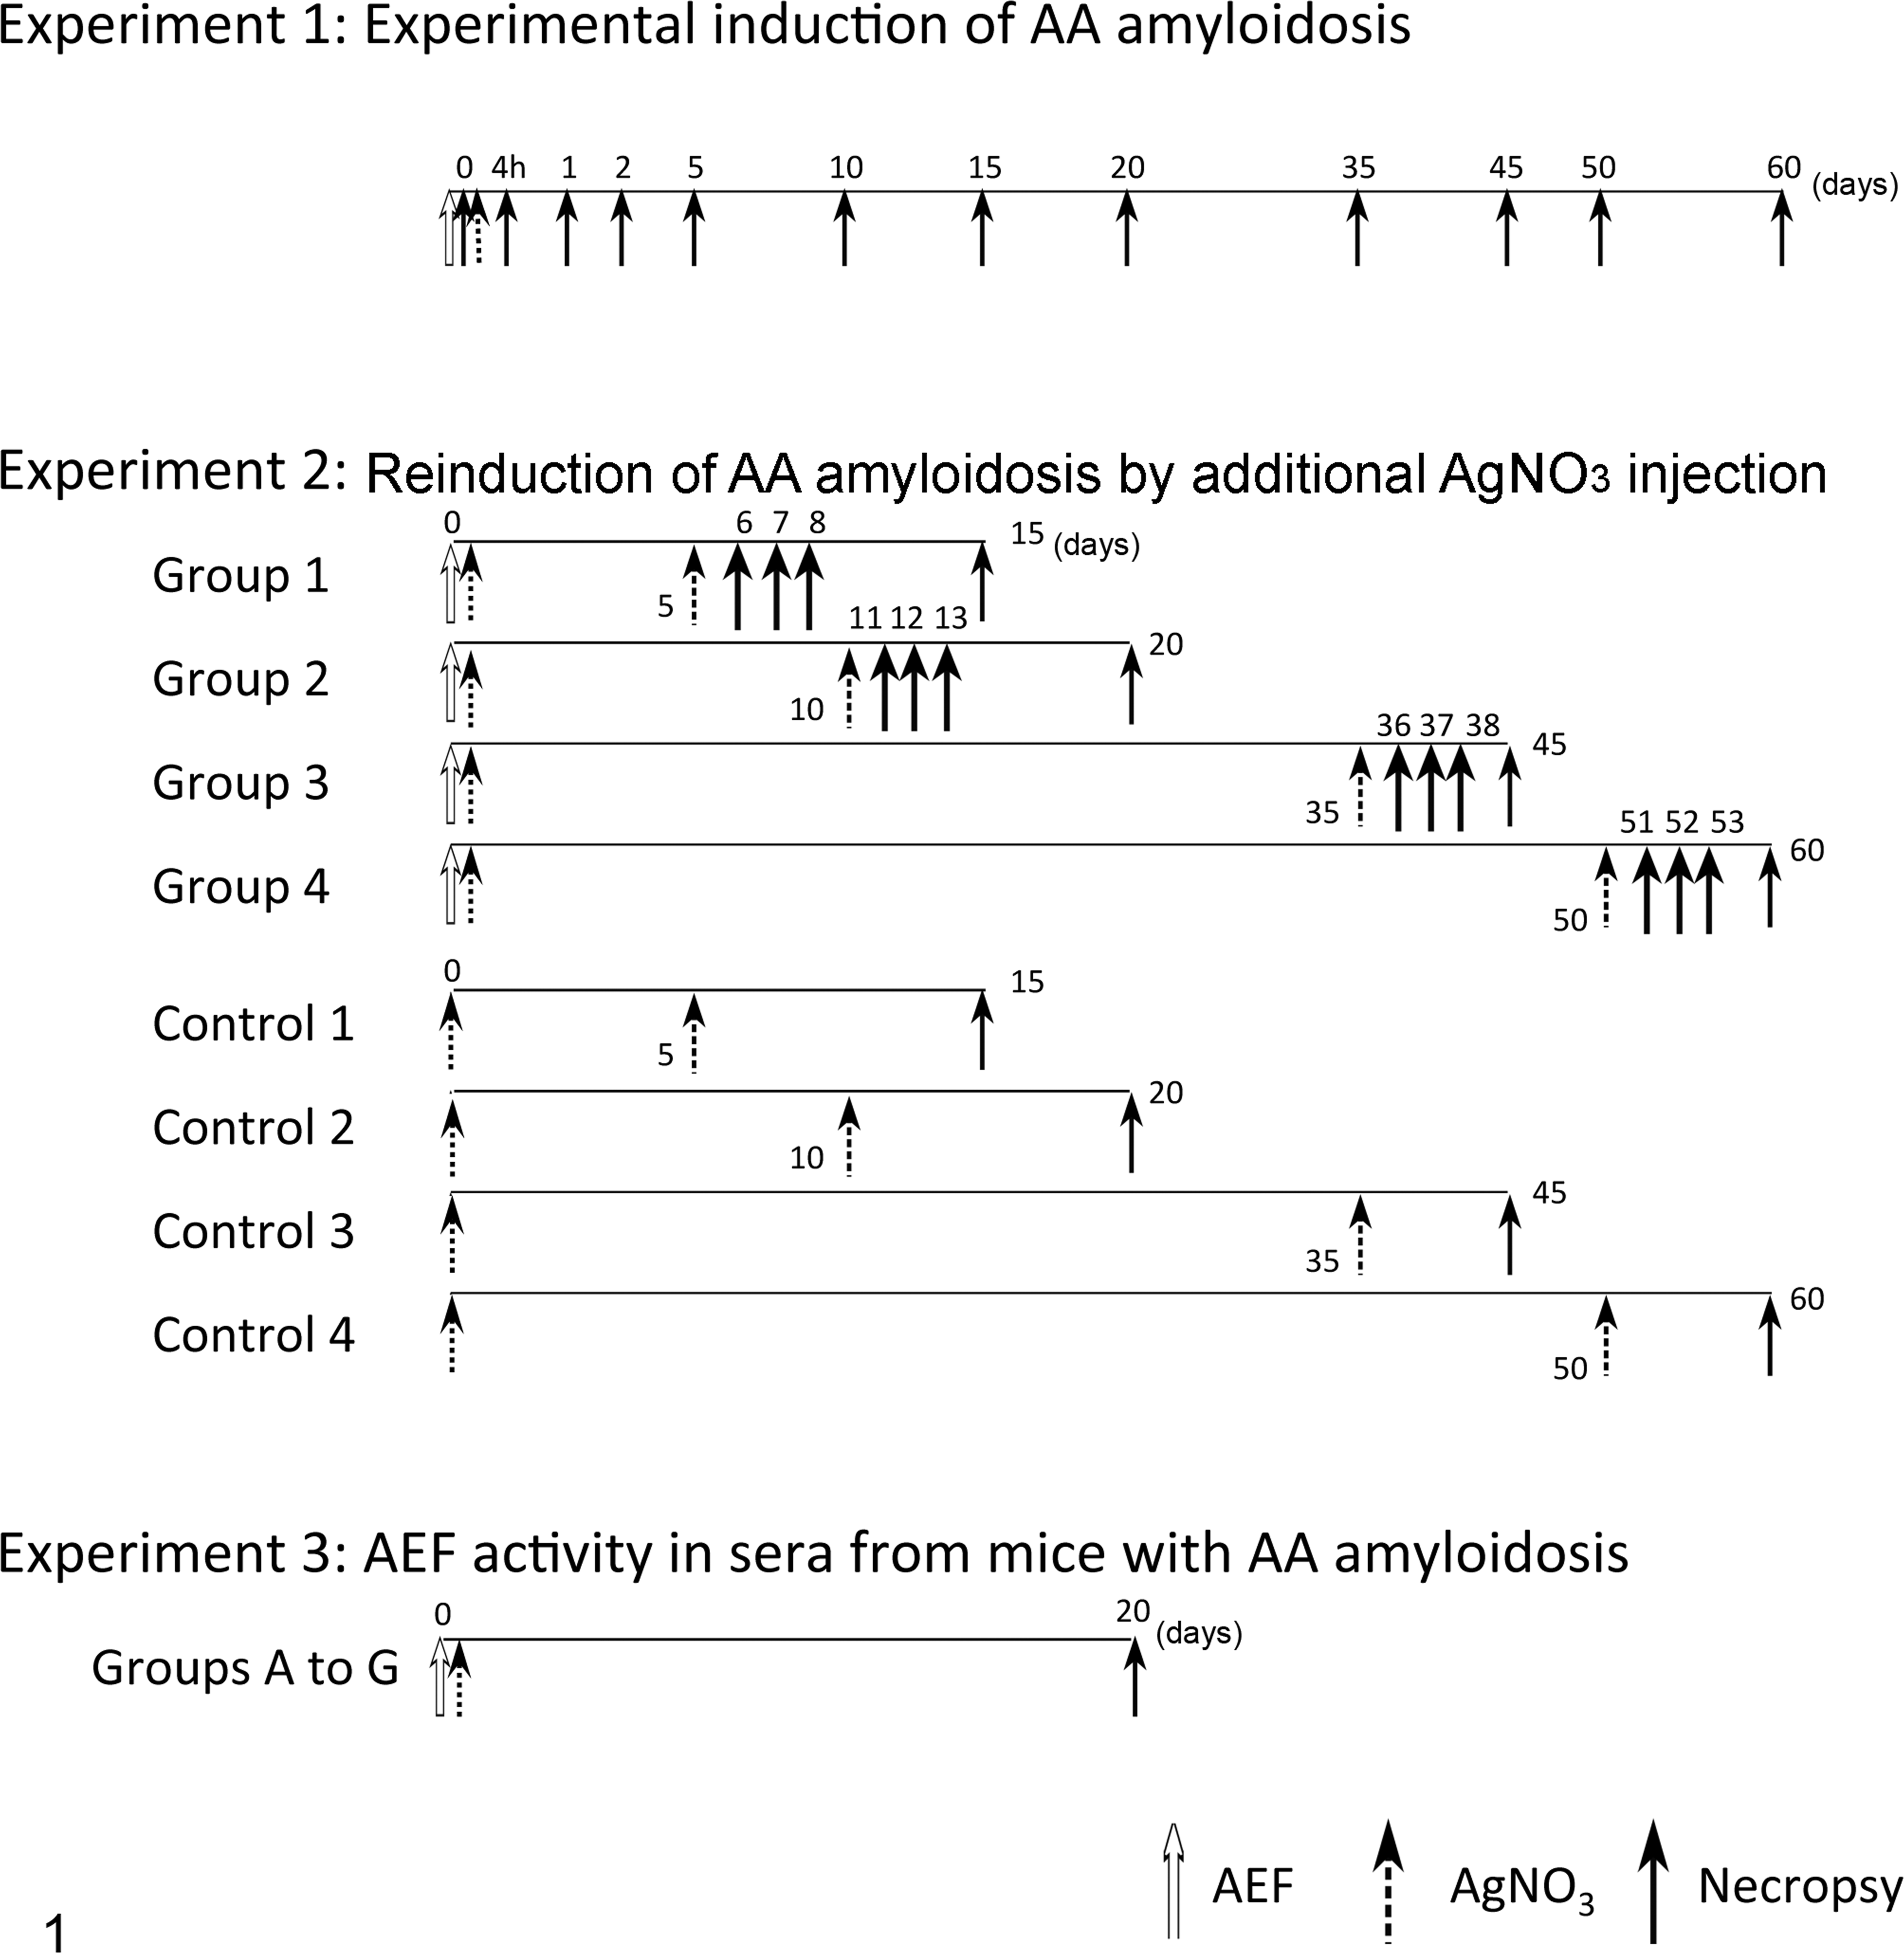
Experimental designs.
Longitudinal Study of Experimentally Induced AA Amyloidosis in IL-1raKO Mice, Induced by Intraperitoneal Injection of Amyloid-enhancing factor and Subcutaneous Injection of AgNO3 (Experiment 1).a
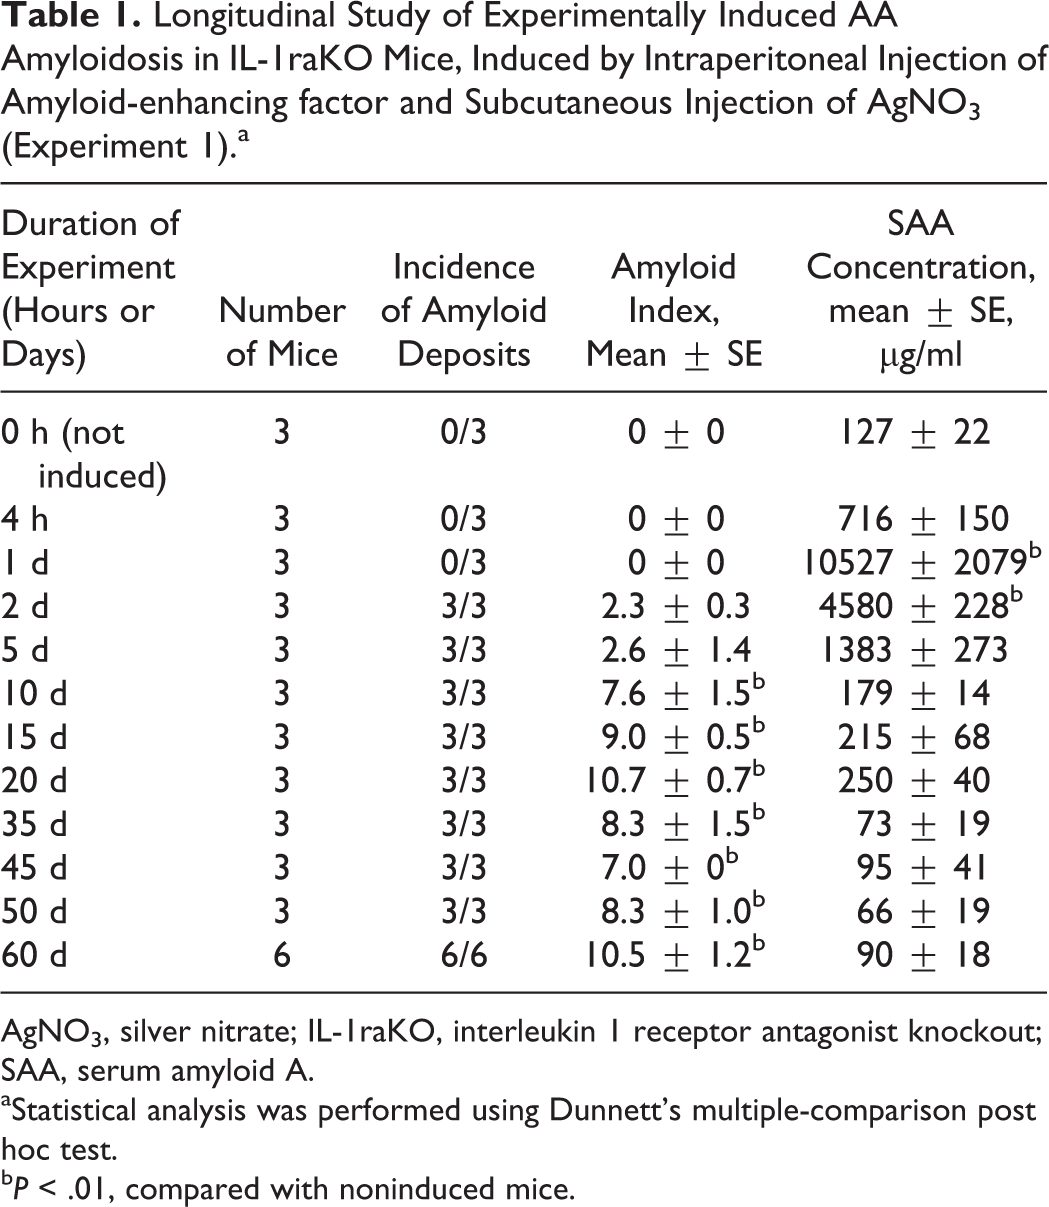
AgNO3, silver nitrate; IL-1raKO, interleukin 1 receptor antagonist knockout; SAA, serum amyloid A.
aStatistical analysis was performed using Dunnett’s multiple-comparison post hoc test.
bP < .01, compared with noninduced mice.
Reinduction of AA Amyloidosis in IL-1raKO Mice (Experiment 2).a
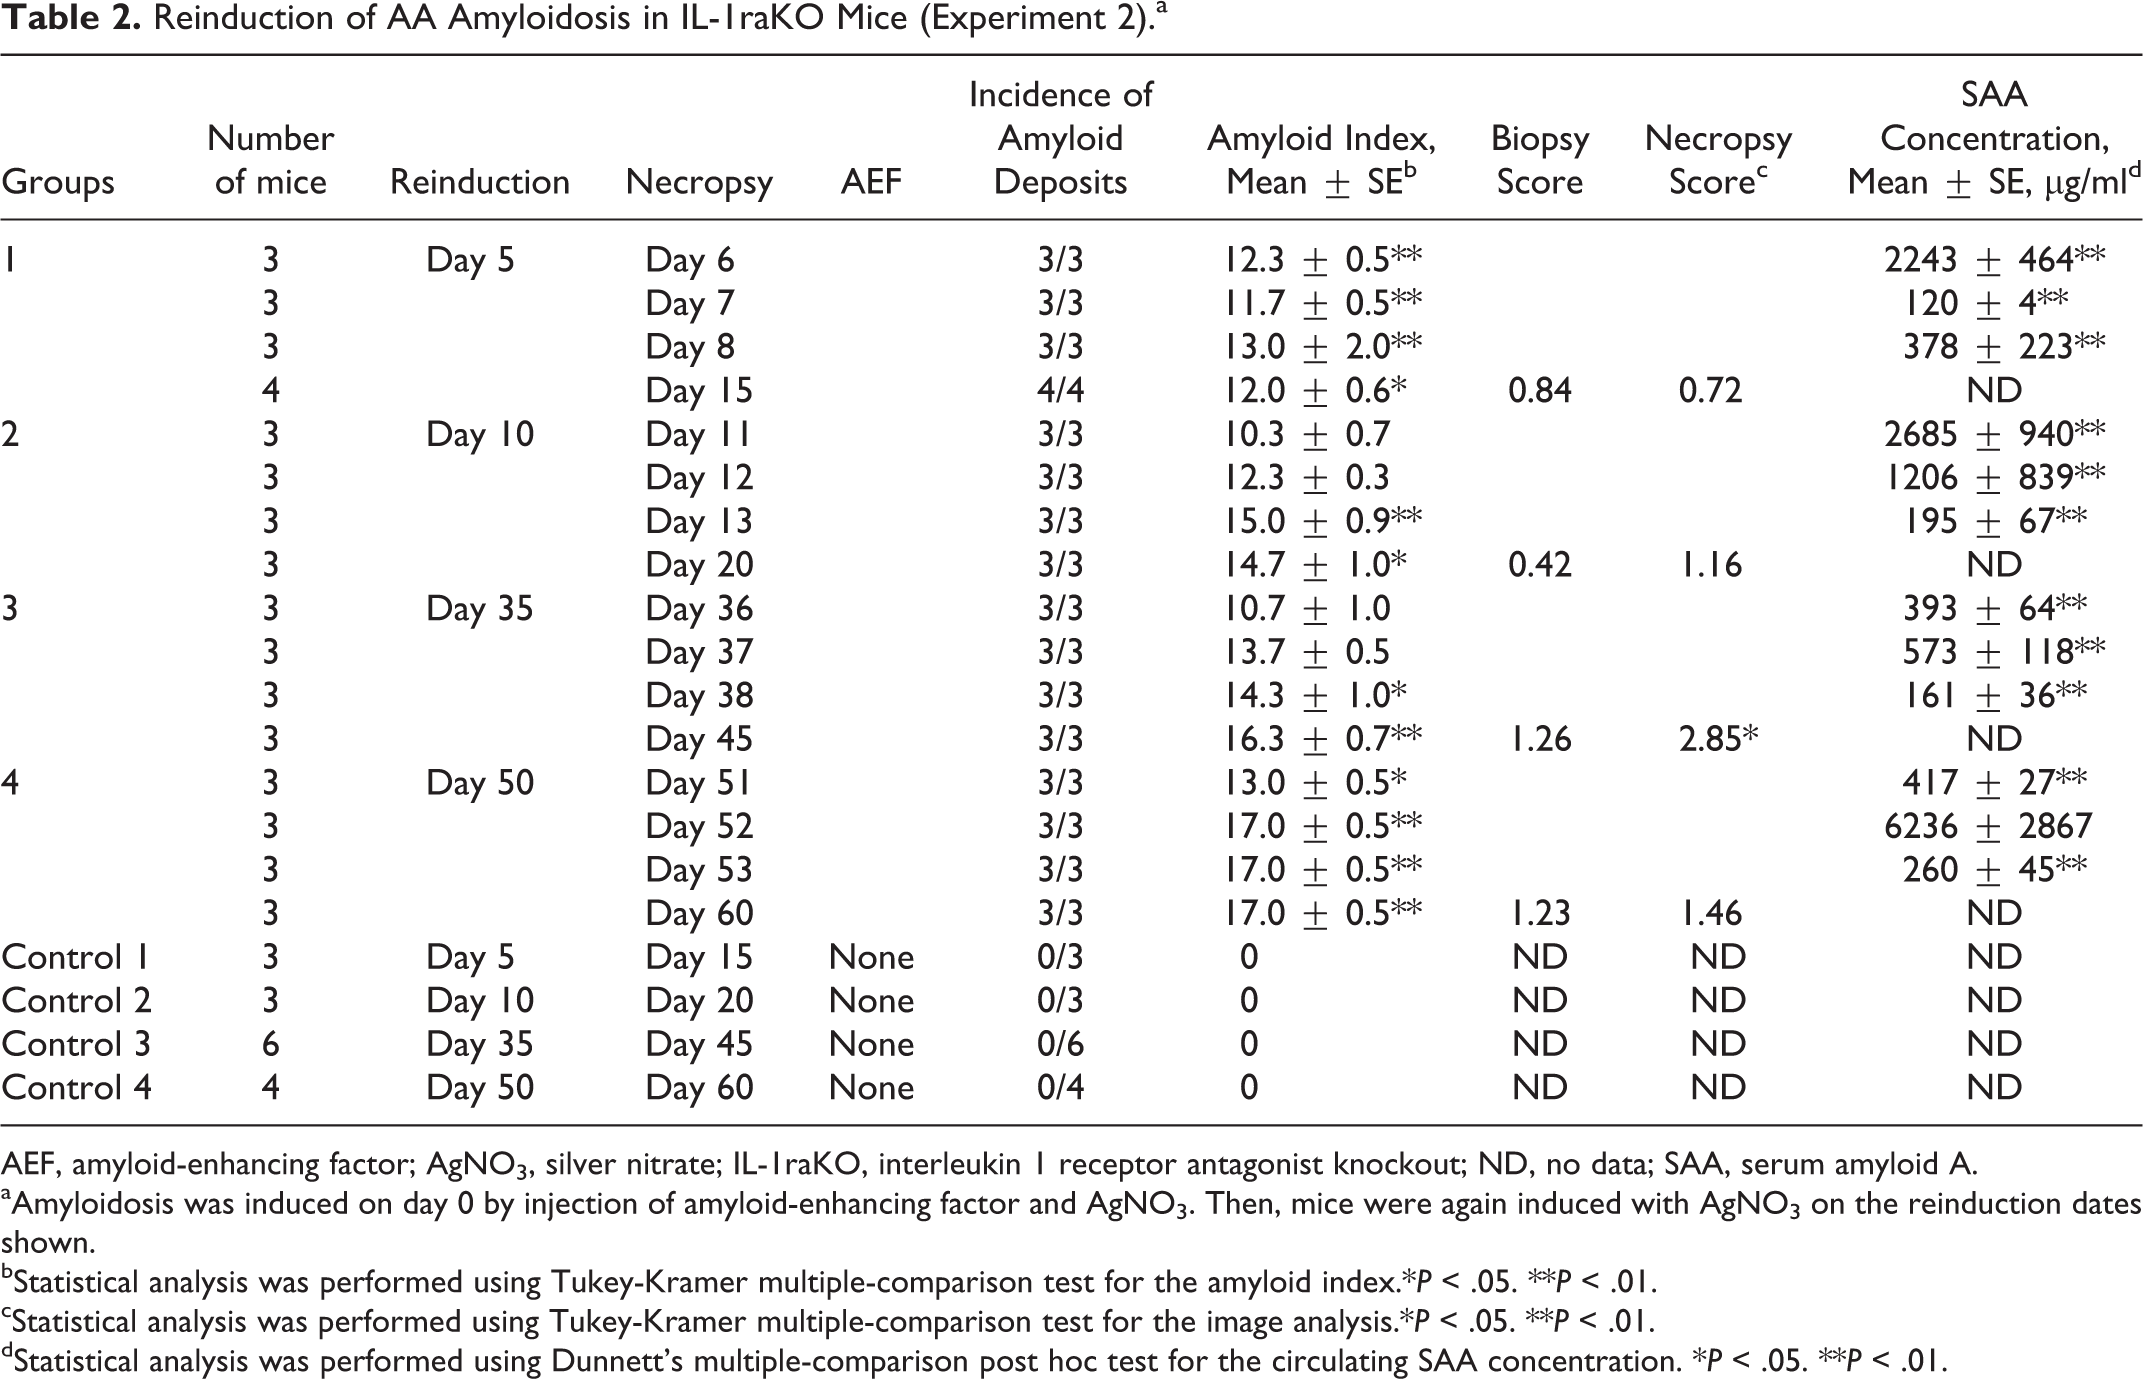
AEF, amyloid-enhancing factor; AgNO3, silver nitrate; IL-1raKO, interleukin 1 receptor antagonist knockout; ND, no data; SAA, serum amyloid A.
aAmyloidosis was induced on day 0 by injection of amyloid-enhancing factor and AgNO3. Then, mice were again induced with AgNO3 on the reinduction dates shown.
bStatistical analysis was performed using Tukey-Kramer multiple-comparison test for the amyloid index.*P < .05. **P < .01.
cStatistical analysis was performed using Tukey-Kramer multiple-comparison test for the image analysis.*P < .05. **P < .01.
dStatistical analysis was performed using Dunnett’s multiple-comparison post hoc test for the circulating SAA concentration. *P < .05. **P < .01.
AEF Activity in Sera From Mice With AA Amyloidosis (Experiment 3).a
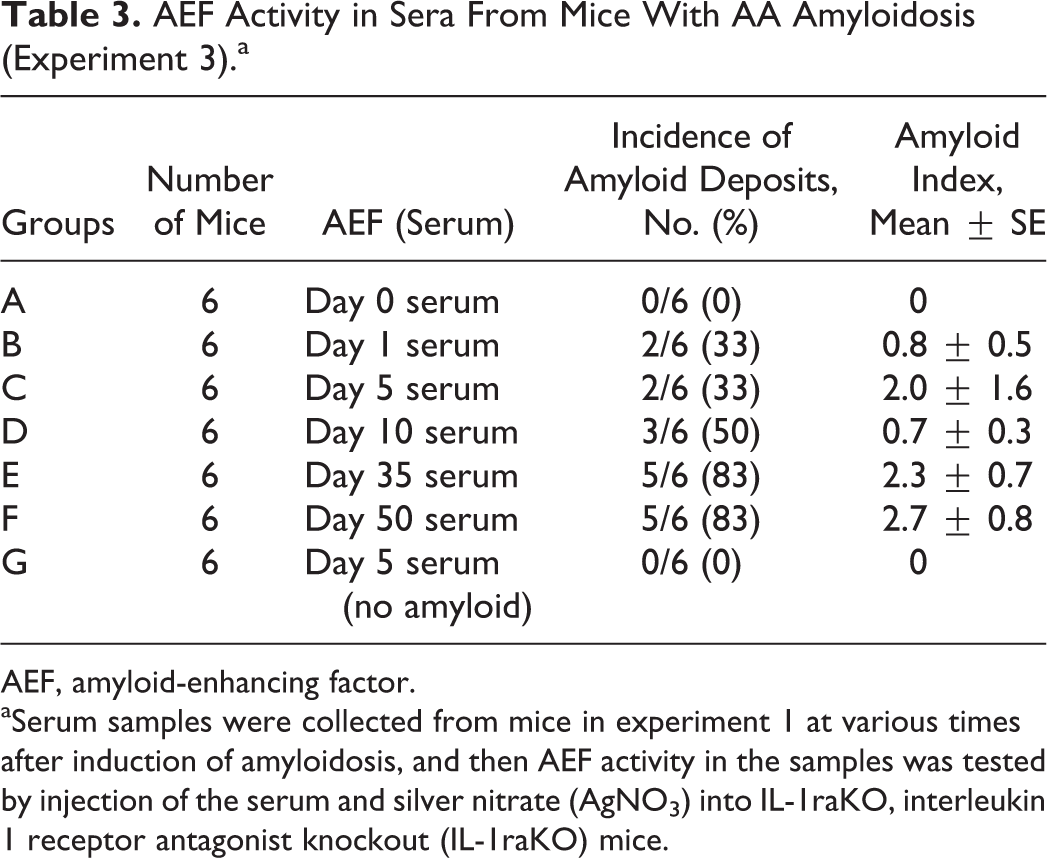
AEF, amyloid-enhancing factor.
aSerum samples were collected from mice in experiment 1 at various times after induction of amyloidosis, and then AEF activity in the samples was tested by injection of the serum and silver nitrate (AgNO3) into IL-1raKO, interleukin 1 receptor antagonist knockout (IL-1raKO) mice.
Experiment 1: Experimental induction of AA amyloidosis
AA amyloidosis was induced in 36 mice as previously described by intraperitoneal (IP) injection of 500 μg AEF (described later) and SC injection of 500 μl of 2% AgNO3. (Fig. 1). 32 Three untreated mice were used as controls. Three to 6 mice were examined at each of 0 hours, 4 hours, and on days 1, 2, 5, 10, 15, 20, 35, 45, 50, and 60. Mice were euthanized at each time point with isoflurane, and whole blood was collected from the right ventricle. Serum samples were stored at –80°C for later analysis of SAA and its oligomers. The liver, spleen, kidneys, heart, adrenal glands, thyroid glands, and intestines were dissected at necropsy and fixed in 10% neutral buffered formalin. In this experiment, we evaluated the distribution and severity of AA amyloid deposition, as well as time-dependent changes in the concentrations of SAA and its oligomers.
Experiment 2: Reinduction of AA amyloidosis by additional AgNO3 injection
Mice were divided into 4 groups (groups 1–4), with 15 to 18 mice in each group. AA amyloidosis was induced in experimental mice on day 0 as in experiment 1. Three to 6 mice from each group served as negative controls, receiving only SC injection of 500 μl of 2% AgNO3 on day 0 (controls 1–4). After the initial induction of AA amyloidosis, mice later received an additional SC injection of 300 μl of 2% AgNO3 on day 5, 10, 35, or 50. In each experimental and control group, 3 to 4 mice had 30% of their spleen biopsied under isoflurane anesthesia at the same time as this second administration of AgNO3. These mice were euthanized 10 days after reinduction. Three to 4 mice from each group that did not undergo biopsy were euthanized at 1, 2, or 3 days after reinduction. All samples were collected as previously described. The severity of AA amyloid deposition was measured using image analysis and the amyloid index (described below).
Experiment 3: AEF activity in sera of AA amyloidosis mice
Mice were divided into 7 groups (groups A–G) of 6 mice each. All mice received SC injection of 500 μl of 2% AgNO3 and IP injection of 300 μl sera (collected in experiment 1) diluted in 3 volumes of phosphate-buffered saline (PBS). Mice in groups A to F were treated with sera collected on day 0, 1, 5, 10, 35, or 50, respectively, and mice in group G were injected with serum from a nonamyloidosis mouse. All mice were euthanized on day 20, and samples were collected as previously described.
Preparation of AEF
AEF was prepared from the liver of a mouse with AA amyloidosis as previously described. 32 One gram of the liver was homogenized in 10 ml PBS for 30 seconds on ice. The supernatant of the tissue homogenate was stored as AEF at –80°C until use.
Laboratory Analyses
Histopathology and amyloid index
Two serial sections were made from formalin-fixed, paraffin-embedded tissues and stained with Puchtler’s alkaline Congo red and immunostained with a goat anti–mouse SAA polyclonal antibody (R&D Systems, Minneapolis, MN). Both sections were counterstained with hematoxylin. AA amyloid deposits were identified with Congo red stain under polarized microscopy to detect apple green birefringence and immunopositivity with a goat anti–mouse SAA polyclonal antibody (R&D Systems). The severity of amyloid deposition in the liver, spleen, intestines, thyroid glands, kidneys, heart, and adrenal glands was semiquantitatively determined as follows: 0, none; 1+, mild; 2+, moderate; and 3+, severe (Suppl. Figs. S1–S21). The sum of the scores given to each organ was defined as the amyloid index.
Image analysis of amyloid deposition
The percentage of splenic amyloid deposition was determined using quantitative image analysis. After immunostaining with a goat anti–mouse SAA polyclonal antibody (R&D Systems), immunopositive areas were measured using ImageJ software (National Institutes of Health, Bethesda, MD). Ten images at 200× magnification were randomly taken in the spleen. The severity of amyloid deposition was determined as the number of immunopositive pixels per total pixels in the fields and reported as the immunopositive area (%).
Measurement of circulating SAA concentrations
An enzyme-linked immunosorbent assay (ELISA) kit (BioSource International, Camarillo, CA) was used to measure circulating SAA concentrations. Serum samples that had been stored at –80°C were thawed, and ELISA was performed according to the manufacturer’s instructions.
Immunoblot analysis of sera
Proteins in sera diluted with 10 volumes of PBS were separated on a 5% to 20% gradient polyacrylamide gel (ATTO, Tokyo, Japan) and transferred onto a polyvinylidene membrane (PVDF) (Merck Millipore, Billerica, MA). The membrane was treated with 1% w/v skim milk in tris-buffered saline (TBS) buffer with Tween 20 (0.1% v/v). The primary antibody used was a rabbit antiserum against the mouse C-terminal SAA2.1 peptide (1:5000, produced in house). The immunogen of the antiserum was a synthetic partial peptide of mouse SAA2.1, amino acid residues 90 to 101 (-GHEDTMADQEAN-) [79.3% purity; KLH-conjugated] (Eurofins Genomics, Tokyo, Japan). The secondary antibody used was a horseradish peroxidase (HRP)–conjugated sheep anti–rabbit IgG (GE Healthcare UK Ltd, Little Chalfont, Buckinghamshire, UK). Blots were developed using the ECL Prime Western Blotting Detection Reagent (GE Healthcare). Immunoreactive bands were detected with the ChemiDoc XRS+ System (Bio-Rad Laboratories, Hercules, CA) and quantified using Image Lab software (Bio-Rad Laboratories).
Dot blot analysis for SAA oligomers
A dot blot analysis to detect soluble amyloid oligomers was performed as previously described. 8,26 Serum samples were diluted with 1000 volumes of PBS and blotted on a PVDF membrane (Merck Millipore) using the DHM-96 dot blot hybridization manifold (Scie-Plas Ltd, Cambridge, UK). The membrane was treated with 1% w/v skim milk in TBS buffer with Tween 20 (0.1% v/v). The primary antibody used was a rabbit anti–amyloid oligomer polyclonal antibody (1:5000; Merck Millipore), and secondary antibody was HRP-conjugated sheep anti–rabbit IgG (GE Healthcare). Blots were developed as above. The amount of soluble-amyloid oligomers was determined as the number of immunopositive pixels surrounded by the circular area in each dot.
Statistical Analysis
SAA concentration, serum amyloid oligomer, and Amyloid Index (AI) were subjected to 1-way analyses of variance (ANOVAs) with Dunnett’s multiple-comparison post hoc tests. The data obtained in image analysis were subjected to 2-way ANOVA and analyzed using the Tukey-Kramer multiple-comparison test.
Results
Experiment 1: Experimental Induction of AA Amyloidosis
Amyloid deposition began on day 2. The progression of amyloid deposition was divided into 4 periods, according to the shift of amyloid index and histopathological features (Fig. 2, Table 1). In the first period, days 2 to 5, AA amyloid deposition began in the liver and/or spleen, and the amyloid index was very low (amyloid index: 2.3–2.6). In the second period, days 10 to 20, amyloid deposits were multifocal, and the amyloid index significantly increased and peaked on day 20 (amyloid index: 7.6–10.7). In the third period, days 35 to 45, the amount of amyloid deposits in the liver and spleen gradually decreased. Consequently, the amyloid index also gradually decreased during this period (amyloid index: 7.0–8.3). In the fourth period, days 50 to 60, hepatic and splenic amyloid deposits became milder; on the other hand, amyloid deposition in other organs was exacerbated during this period, particularly in the kidney, thyroid gland, and adrenal gland. The amyloid index gradually increased again (amyloid index: 8.3–10.5) (Fig. 2).
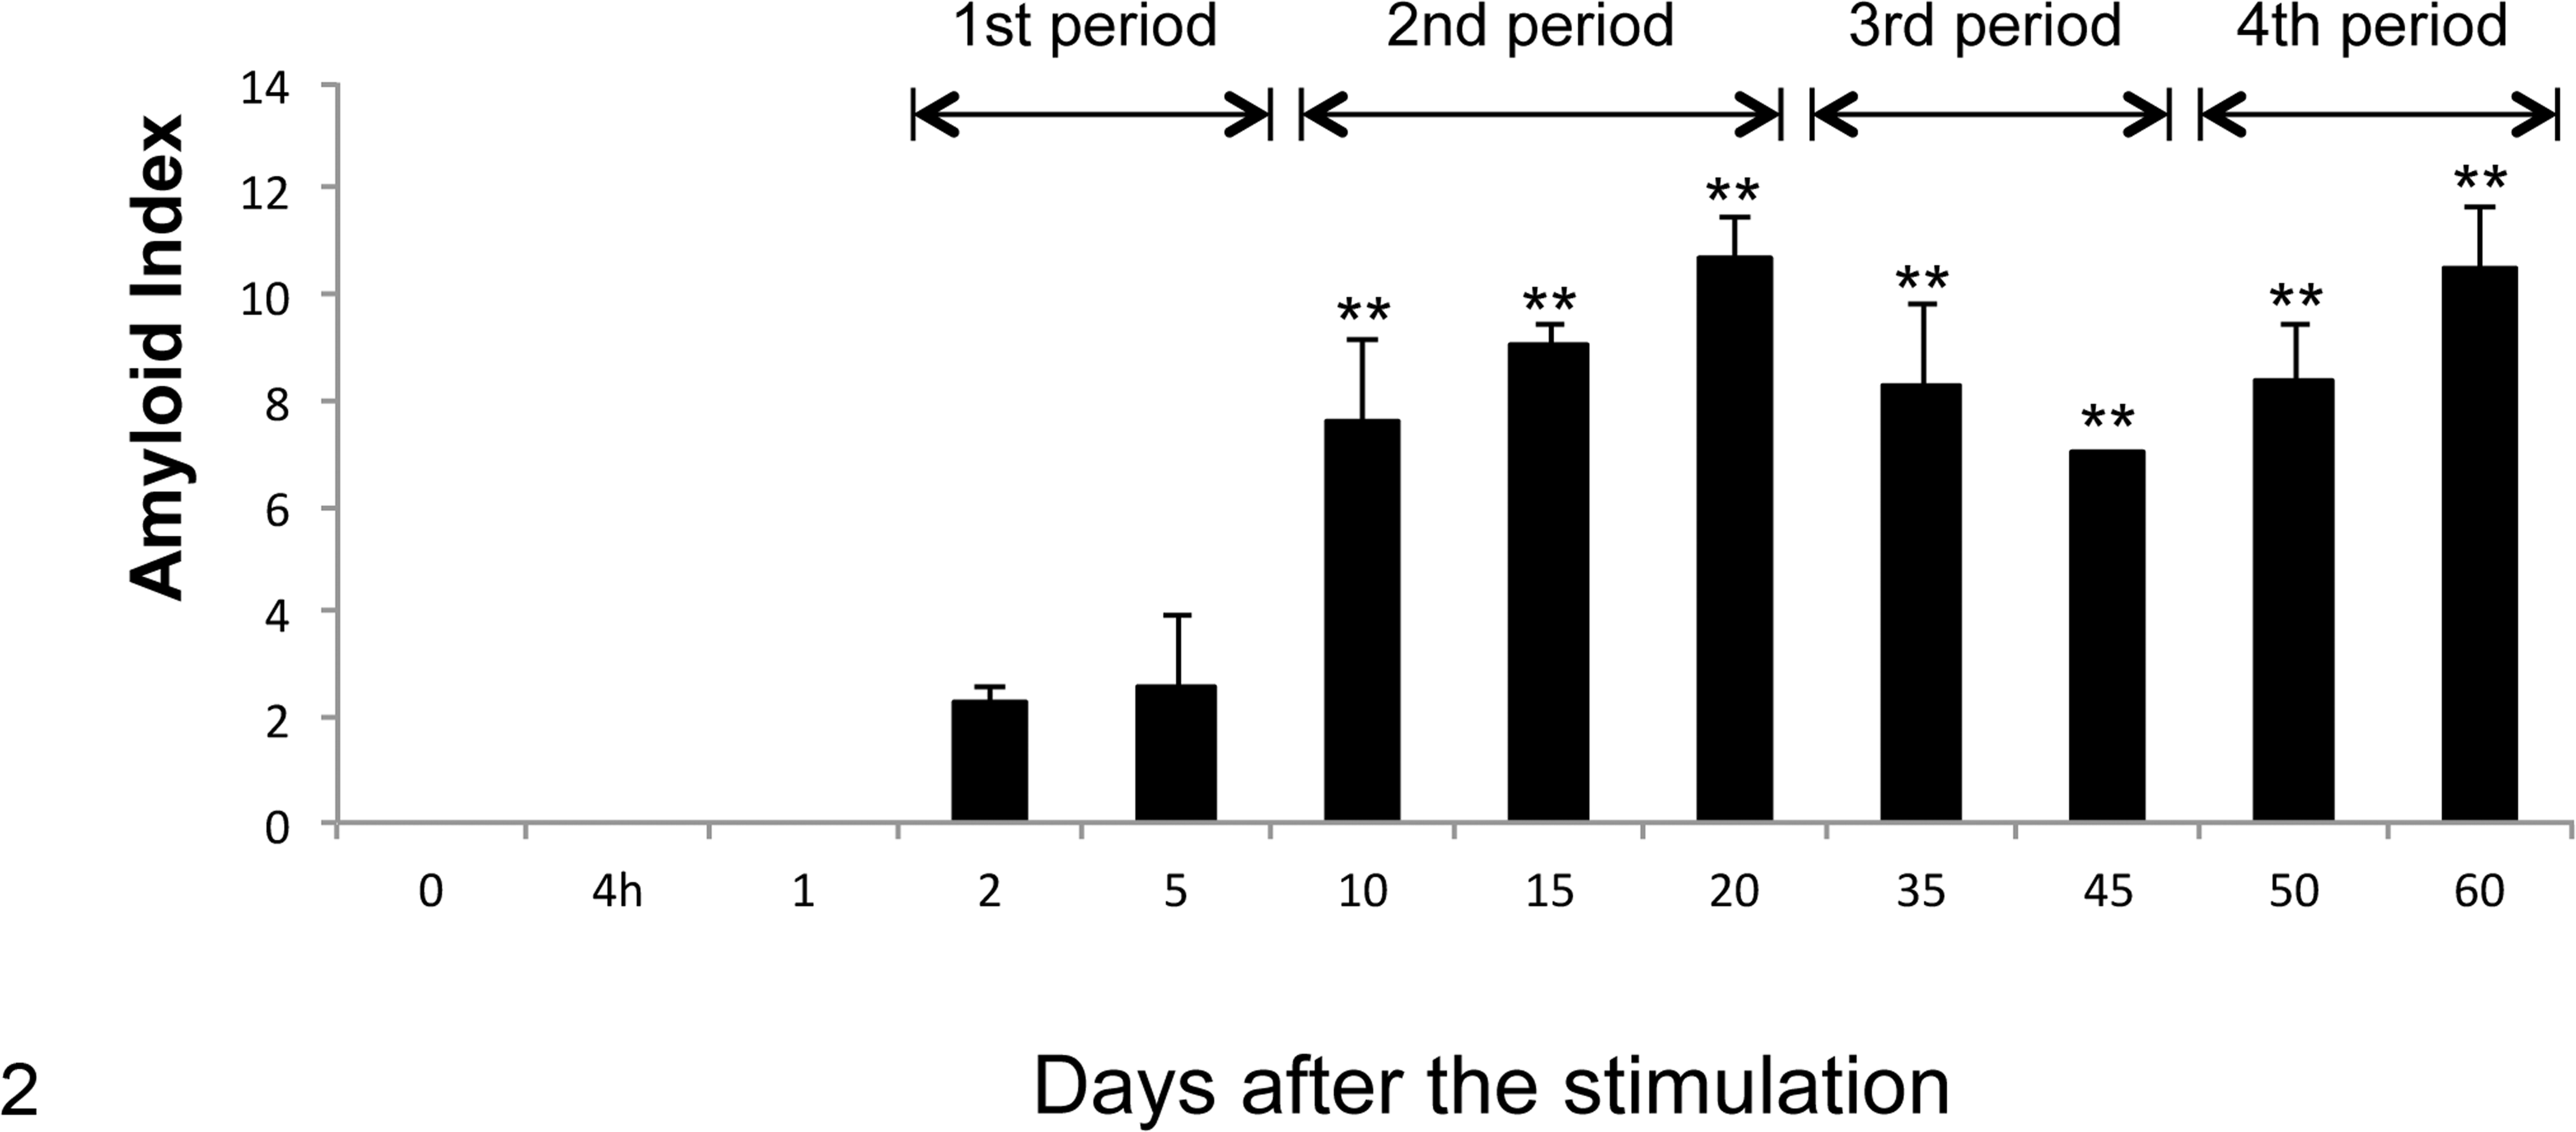
Time-dependent changes in the amyloid index. The histopathological scores of amyloid deposition in the spleen, liver, kidneys, heart, adrenal glands, thyroid glands, and ileum were determined as 0 to 3+. The total of each index in each mouse was calculated as the amyloid index. Amyloid index began to increase on day 2 and was maintained at high levels by day 60. Amyloid index was significantly higher on days 10 to 60 than the control group. The process of amyloid deposition was classified into 4 periods, according to the shift of amyloid index and histopathological features. **P < .01, 1-way analysis of variance with Dunnett’s multiple-comparison post hoc tests.
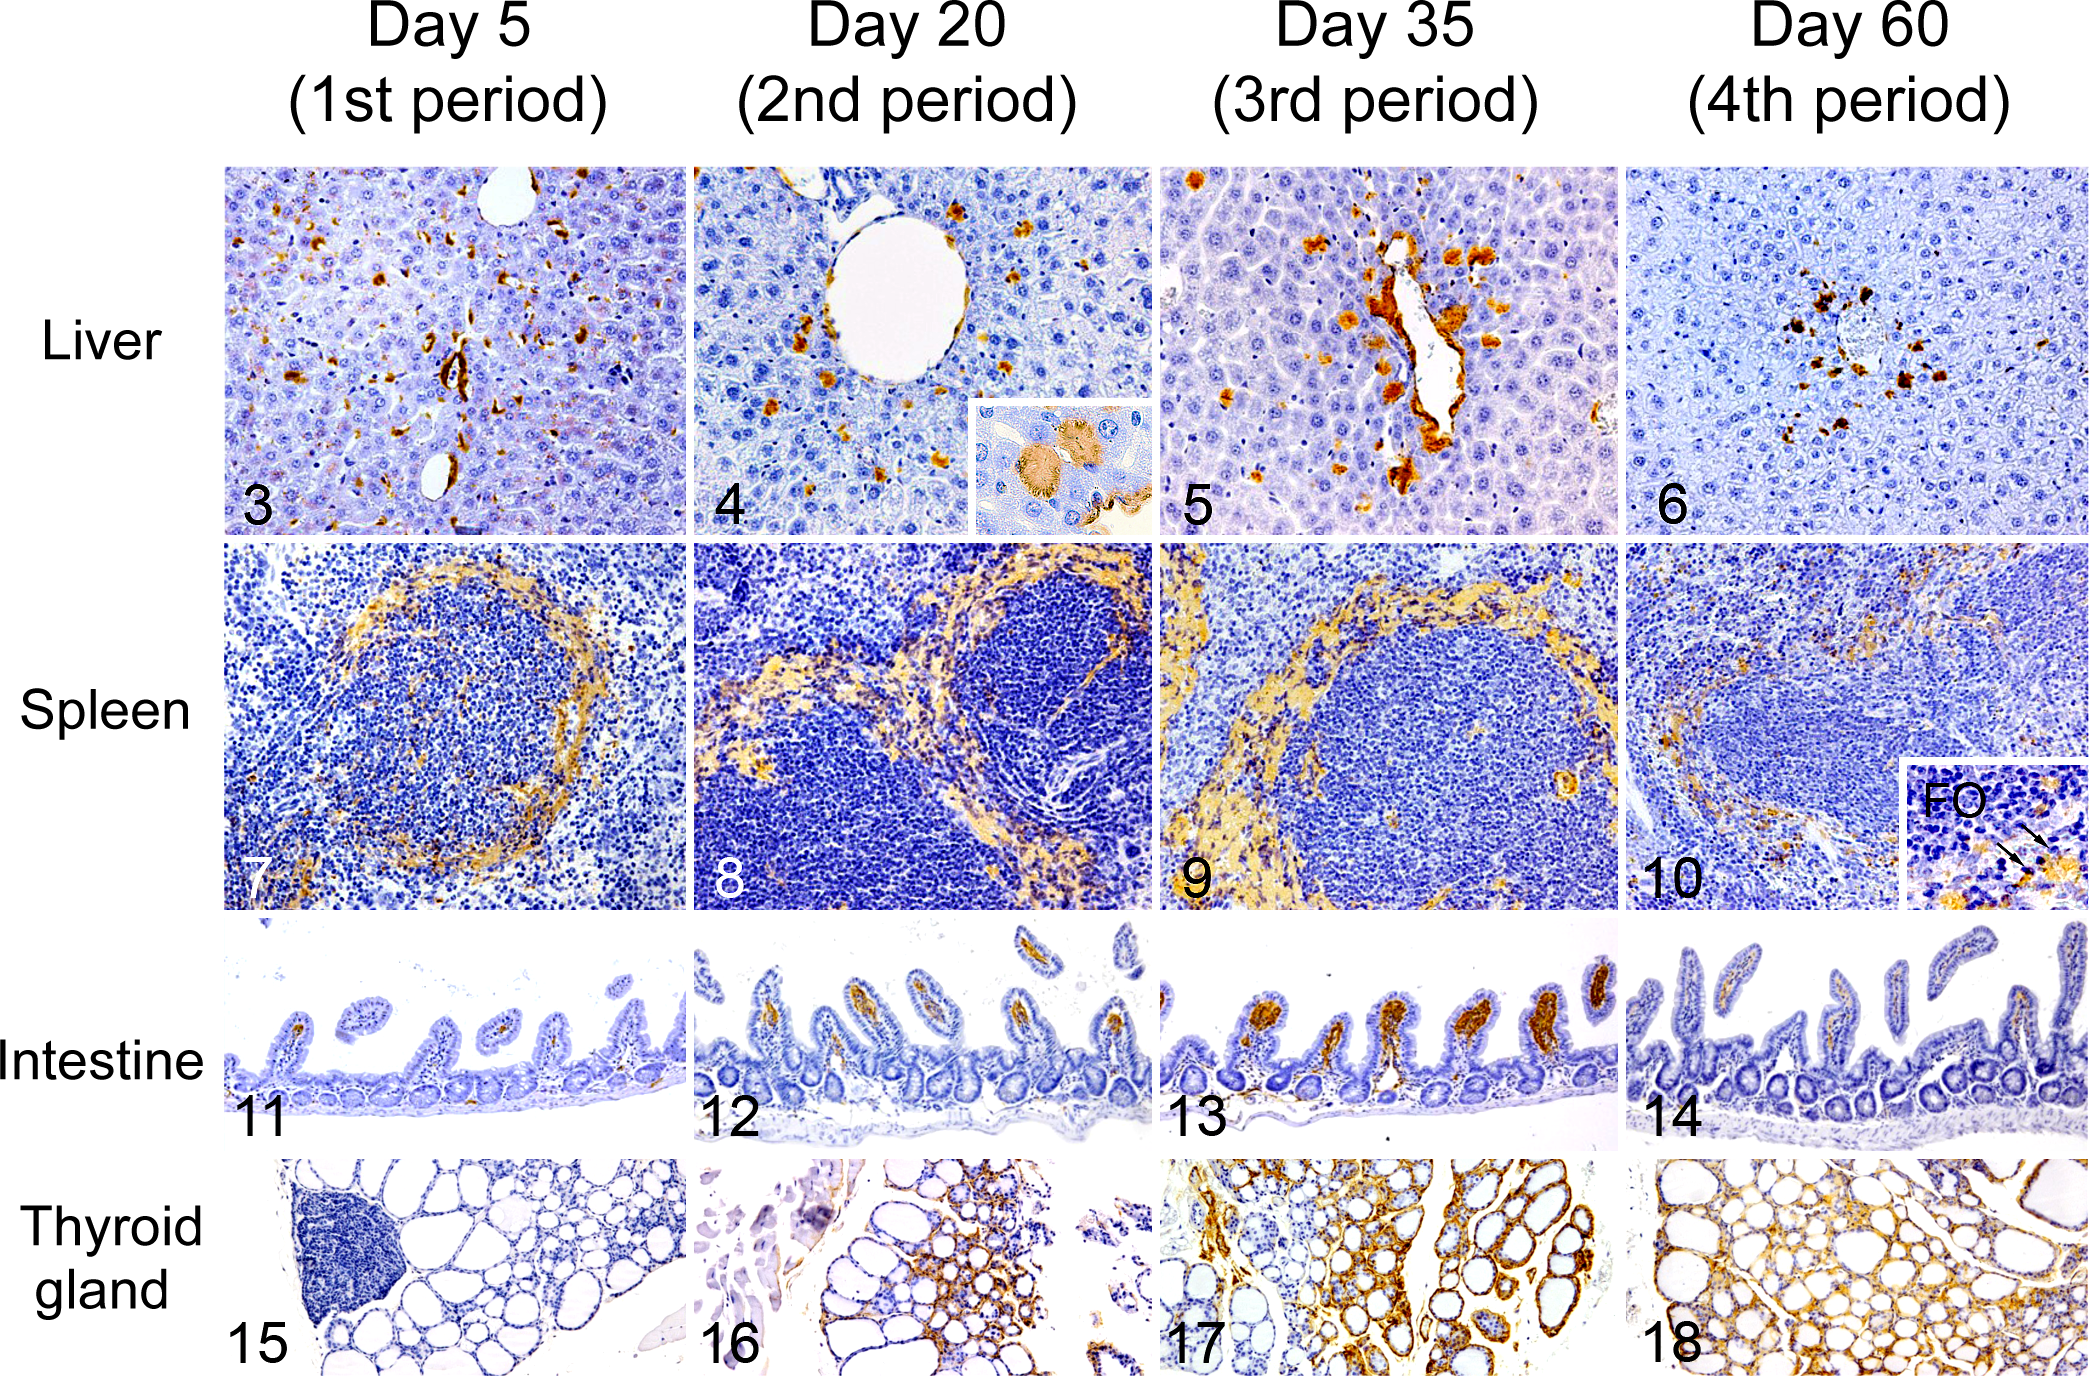
Longitudinal changes of the distribution patterns of amyloid deposits were observed in each organ. In the liver, diffuse amyloid deposition was observed in the space of Disse on day 2 (Fig. 3). As the deposition progressed, granular and nodular hepatic amyloid deposits appeared (Fig. 4). During the third and fourth periods, the amount of amyloid deposits decreased, and amyloid nodules accumulated around the central veins and portal tracts (Figs. 5, 6). We also observed amyloid deposits surrounding the splenic follicles on day 2, which further increased as the deposition progressed (Figs. 7–9). However, by the fourth period, most splenic amyloid deposits had diminished. The amyloid deposits were segmental around the follicles and spread into the red pulp. Then, mononuclear cells appeared in the areas of amyloid deposition in the spleen (Fig. 10). Amyloid deposits were also observed around capillaries in the small intestinal villi, particularly the ileocecal junction. These also diminished along with the diminution of hepatic and splenic amyloid deposits (Figs. 11–14). Thyroid amyloid was observed at the interstitium of follicles during the second period and progressed following the clearance of hepatic and splenic amyloid deposits (Figs. 15–18). Mild amyloid deposition was also observed at the myocardial interstitium and at the border of the adrenal cortex and medulla (Suppl. Figs. S1–S21).
Circulating SAA levels were increased 4 hours after the initial stimulation (716 ± 150 μg/ml; mean ± SE), quickly peaked on day 1 (10500 ± 2079 μg/ml), and then gradually decreased to normal levels (179 ± 14 μg/ml) by day 10 (Fig. 19). The circulating SAA level was significantly higher on day 1 and day 2 compared with 0 hours and later time points. The amounts of serum amyloid oligomers were higher than baseline on days 1 to 60 but did not significantly differ (Fig. 19). The results of the immunoblot analysis of serum revealed 6 differently sized immunopositive bands for mouse SAA2.1 C-terminal. The lowest molecular weight bands, at 12.6 kDa, were distinct in sera on days 1 to 2 and weak on days 5 to 15 (Fig. 20, black arrow). The next higher molecular weight bands, approximately 28 kDa to 30 kDa, were weak on days 10 to 35 and distinct on days 45 to 60 (Fig. 20, white arrow) but were not detected on days 0 to 5. Bands at 40 kDa were distinct on days 1 to 2. The other 3 bands, at 30 kDa to 38 kDa, were common in all sera and may represent nonspecific bands.
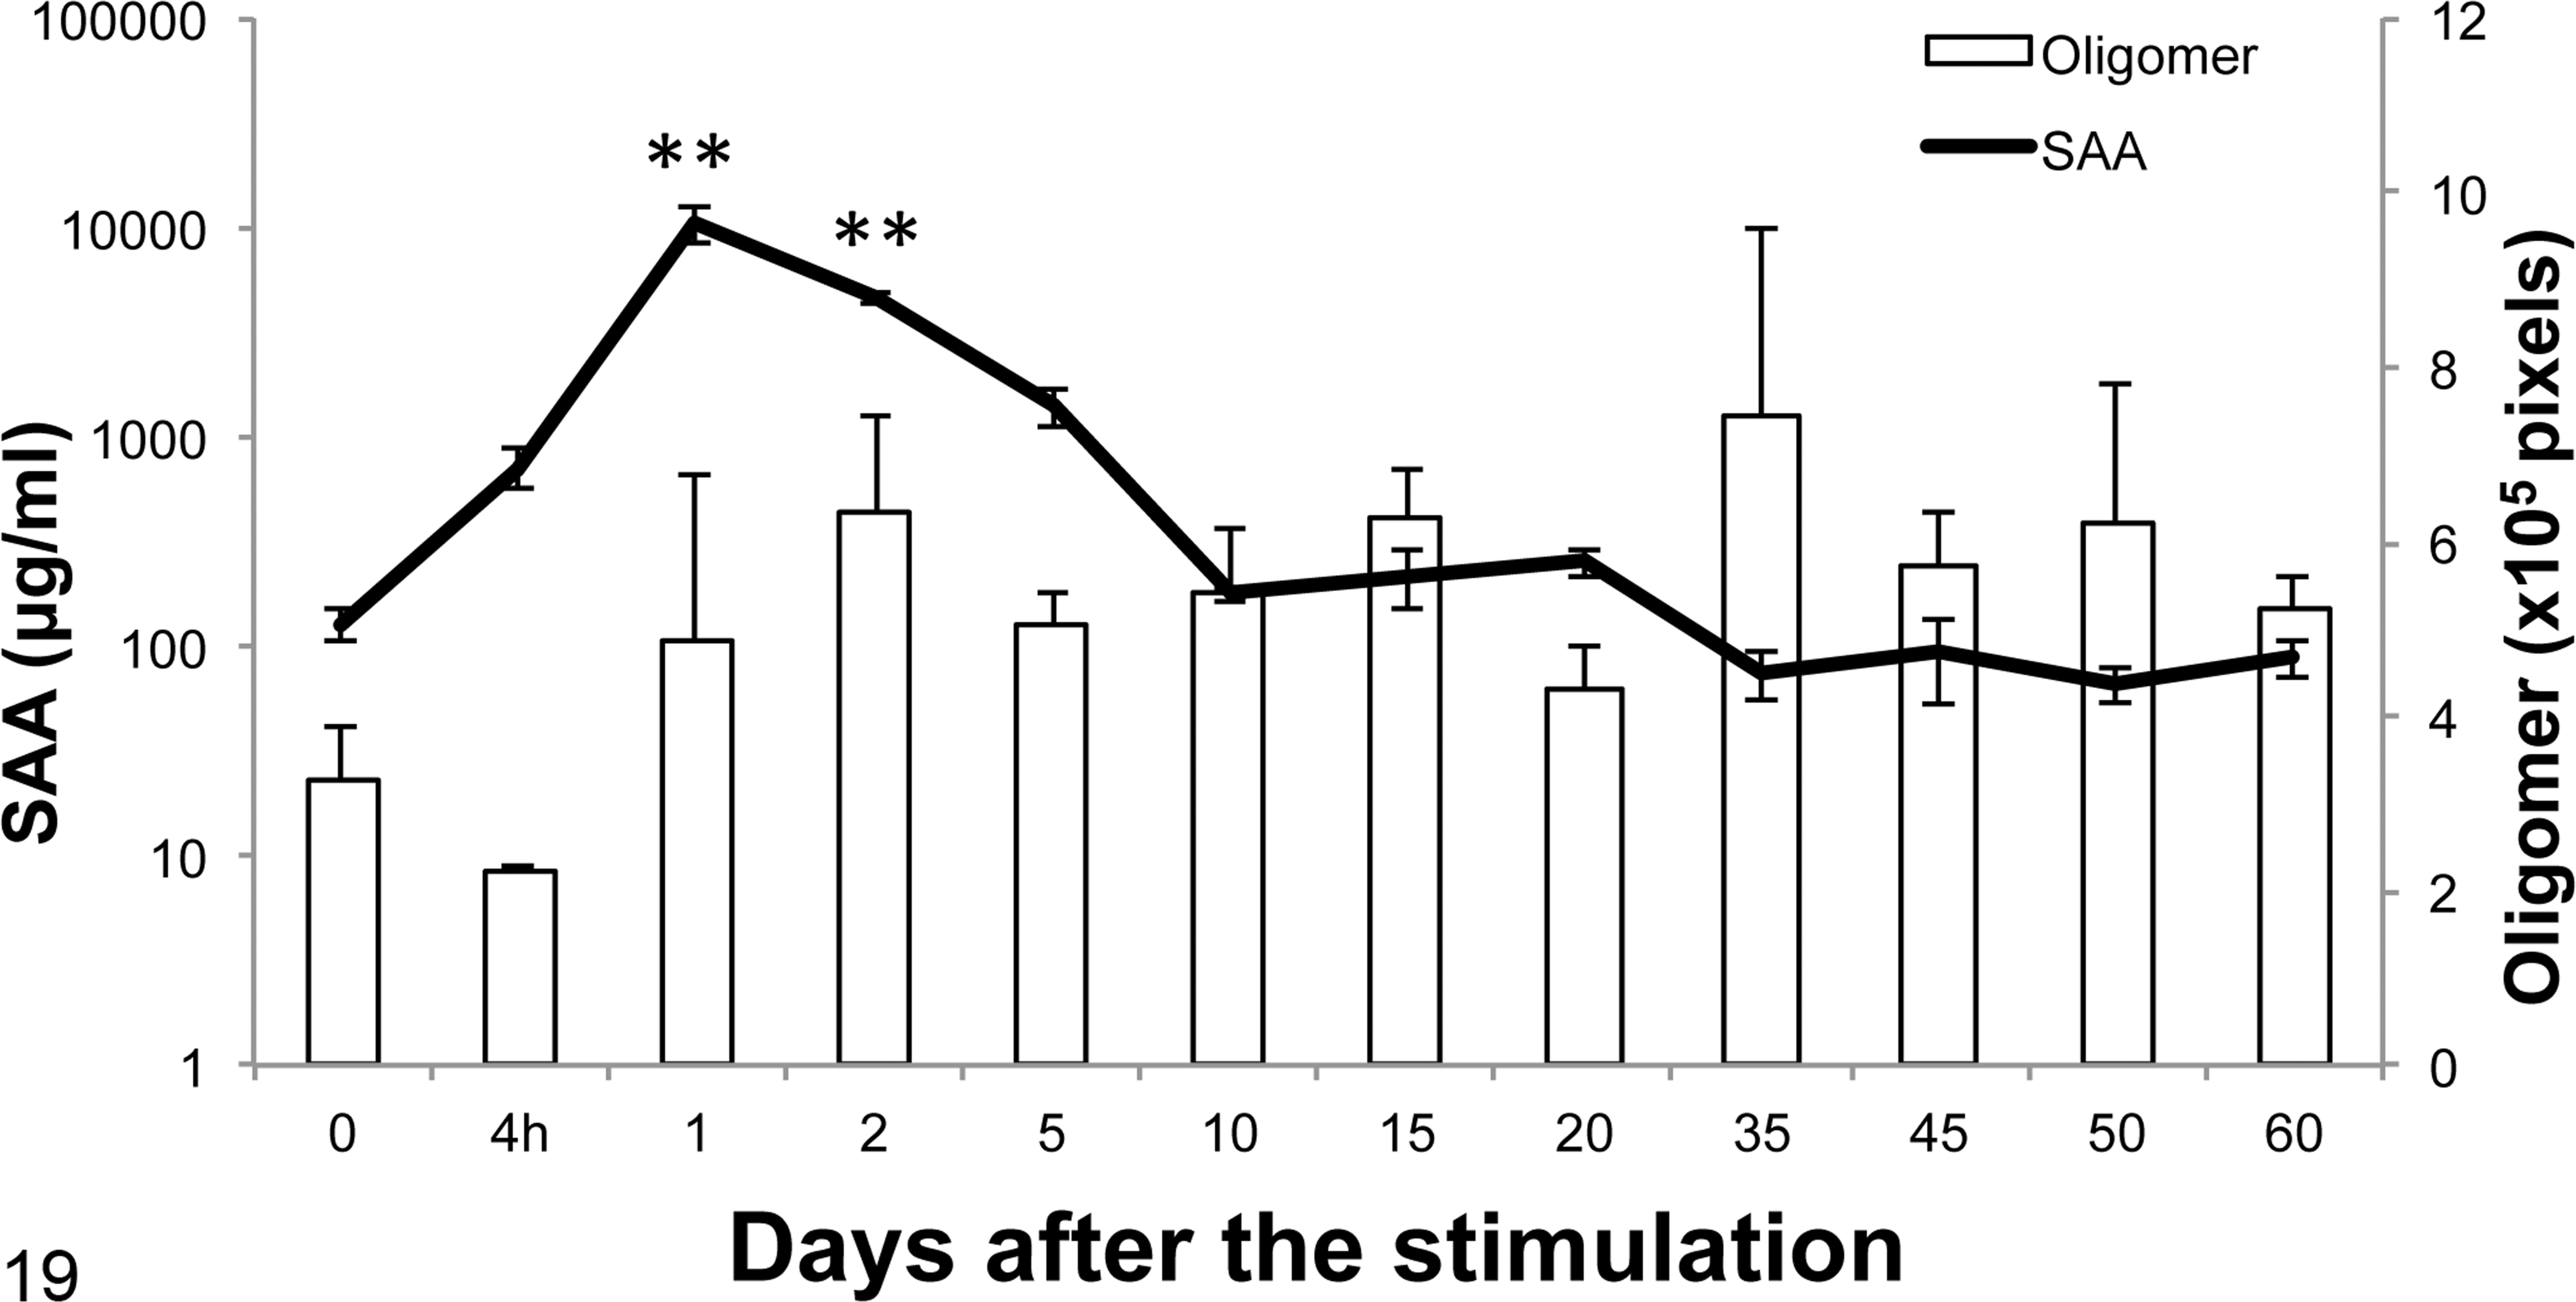
Serum amyloid A (SAA) and amyloid oligomer levels in interleukin 1 receptor antagonist knockout (IL-1raKO) mice following intraperitoneal injection of amyloid-enhancing factor and subcutaneous injection of silver nitrate (AgNO3) (experiment 1). SAA levels were elevated 4 hours after the injections, peaked on day 1, and decreased to normal levels by day 10. **P < .01, 1-way analysis of variance with Dunnett’s multiple-comparison post hoc tests.
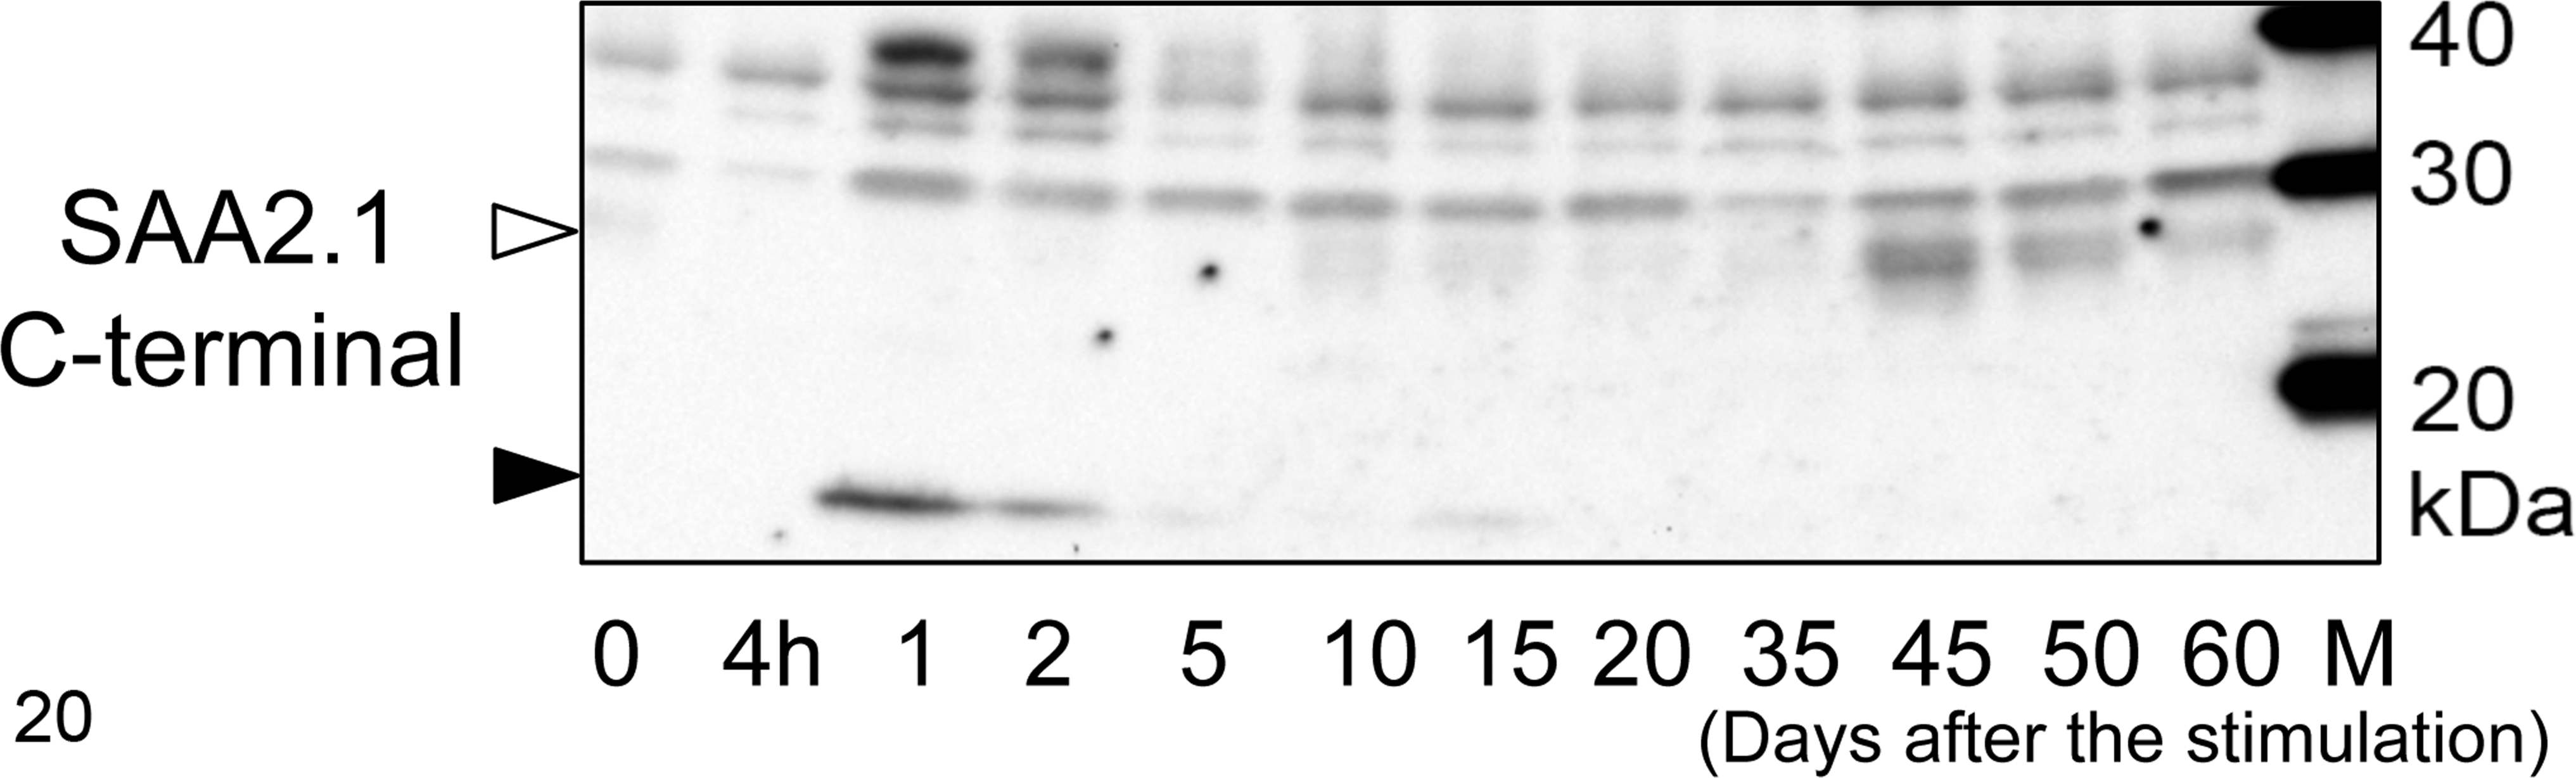
Western blot analysis of serum amyloid A (SAA) in mouse sera. The sera obtained in experiment 1 were examined using antiserum against the SAA2.1 C-terminal peptide. Major immunopositive bands were detected at 12.6 kDa on days 1 to 15 (black arrow), and weak or distinct bands at 28 kDa to 30 kDa were also detected after day 10 (white arrow). Distinct bands at 40 kDa were detected on days 1 to 2. Three nonspecific bands were commonly detected at 30 kDa, 35 kDa, and 38 kDa in all sera.
Experiment 2: Reinduction of AA Amyloidosis by Additional AgNO3 Injection
Severe systemic amyloid deposition occurred the day after additional AgNO3 injection in all groups (Fig. 21). Ten days after additional AgNO3 injection, all reinduced mice developed severe AA amyloidosis, compared with day 10 in mice given a single AgNO3 stimulus in experiment 1 (Table 2). On the other hand, AA amyloidosis did not develop in any of the mice following additional AgNO3 injection that had not received AEF injection as an initial treatment. Significant differences were observed in amyloid index between mice with additional AgNO3 injection (groups 3–4) and day-matched mice with a single stimulus (experiment 1) (Fig. 22). Specifically, groups 3 and 4 with additional AgNO3 injection had a significantly higher amyloid index than the highest score in experiment 1 (mice euthanized on day 20). The results of the image analysis revealed that the areas of AA amyloid deposition increased in post-reinduction samples (after additional AgNO3 injection) compared with pre-reinduction samples (before additional AgNO3 injection) in groups 2 to 4, respectively (Fig. 23). Moreover, multiple comparisons revealed that post-reinduction samples in group 3 showed significantly higher scores than other groups (P = .013).
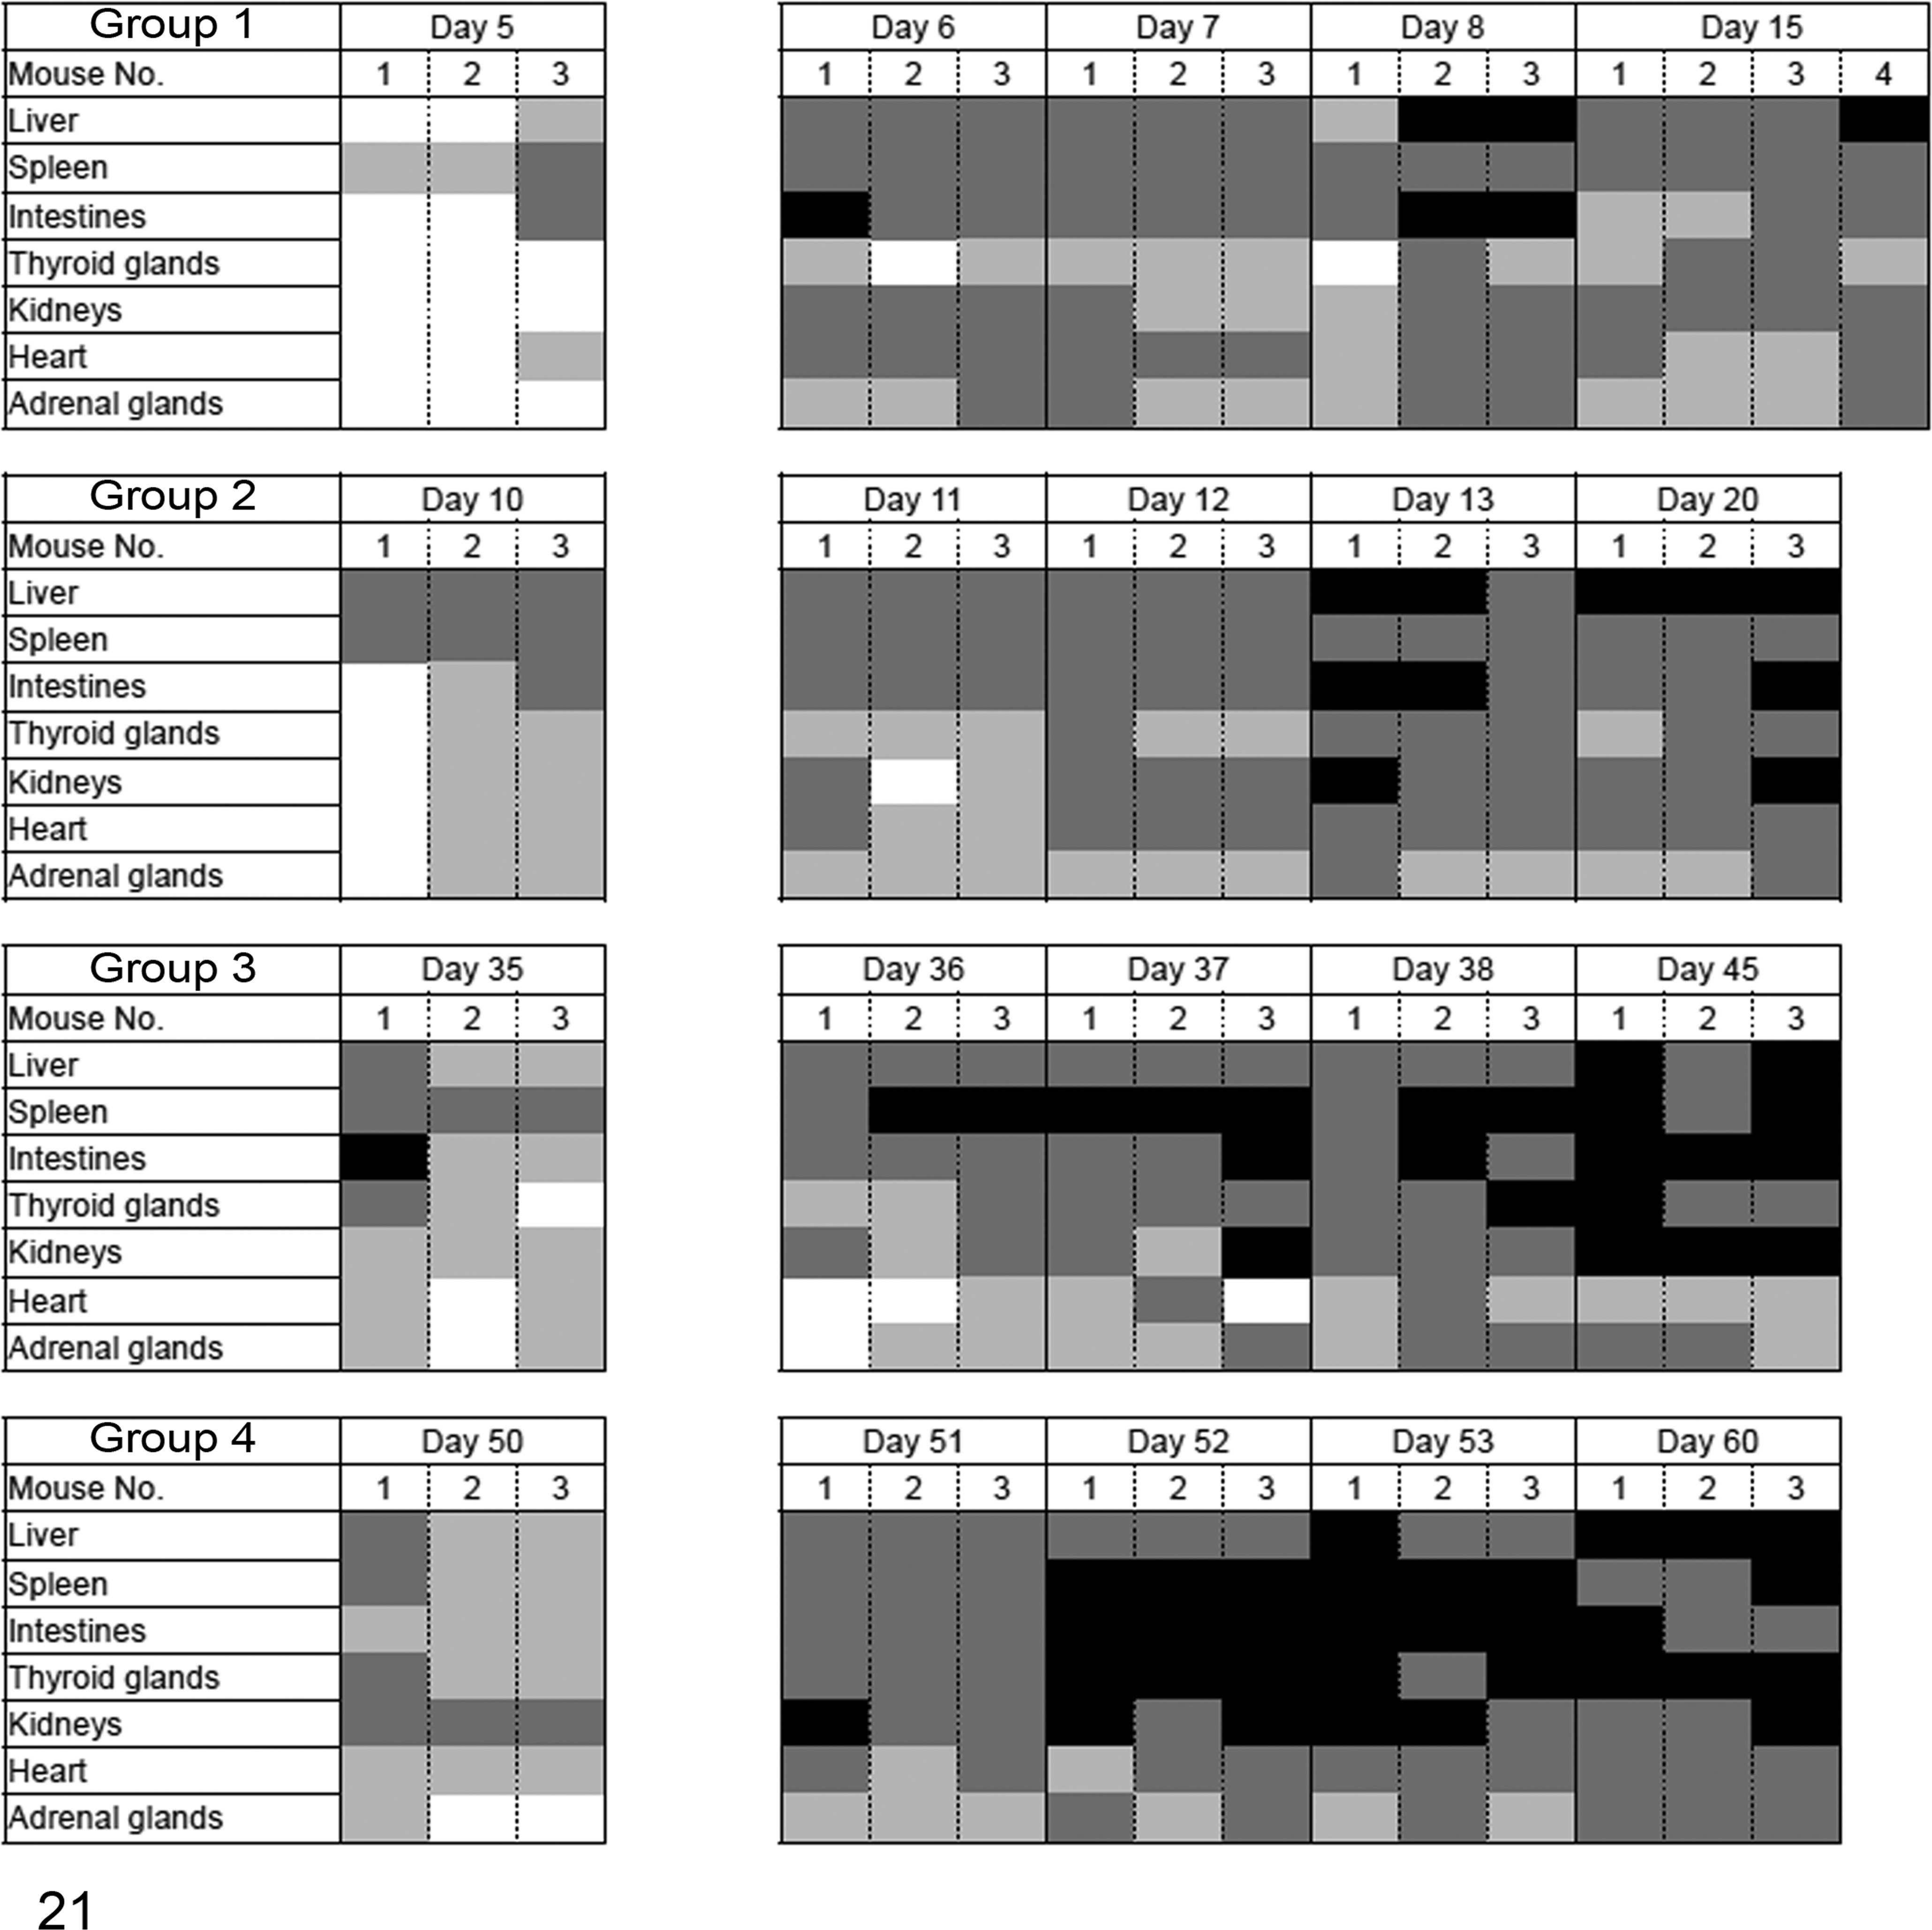
Distribution of amyloid deposition after reinduction (experiment 2). After the initial induction of amyloid A amyloidosis, mice received an additional injection of silver nitrate (AgNO3) on day 5, 10, 35, or 50 (for groups 1–4, respectively). Amyloid deposition began the day after reinduction. Deposition was severe regardless of the time points after reinduction. The severity of amyloid deposition was represented by the amyloid index as follows: 3+, black; 2+, dark gray; 1+, gray; and 0, white.
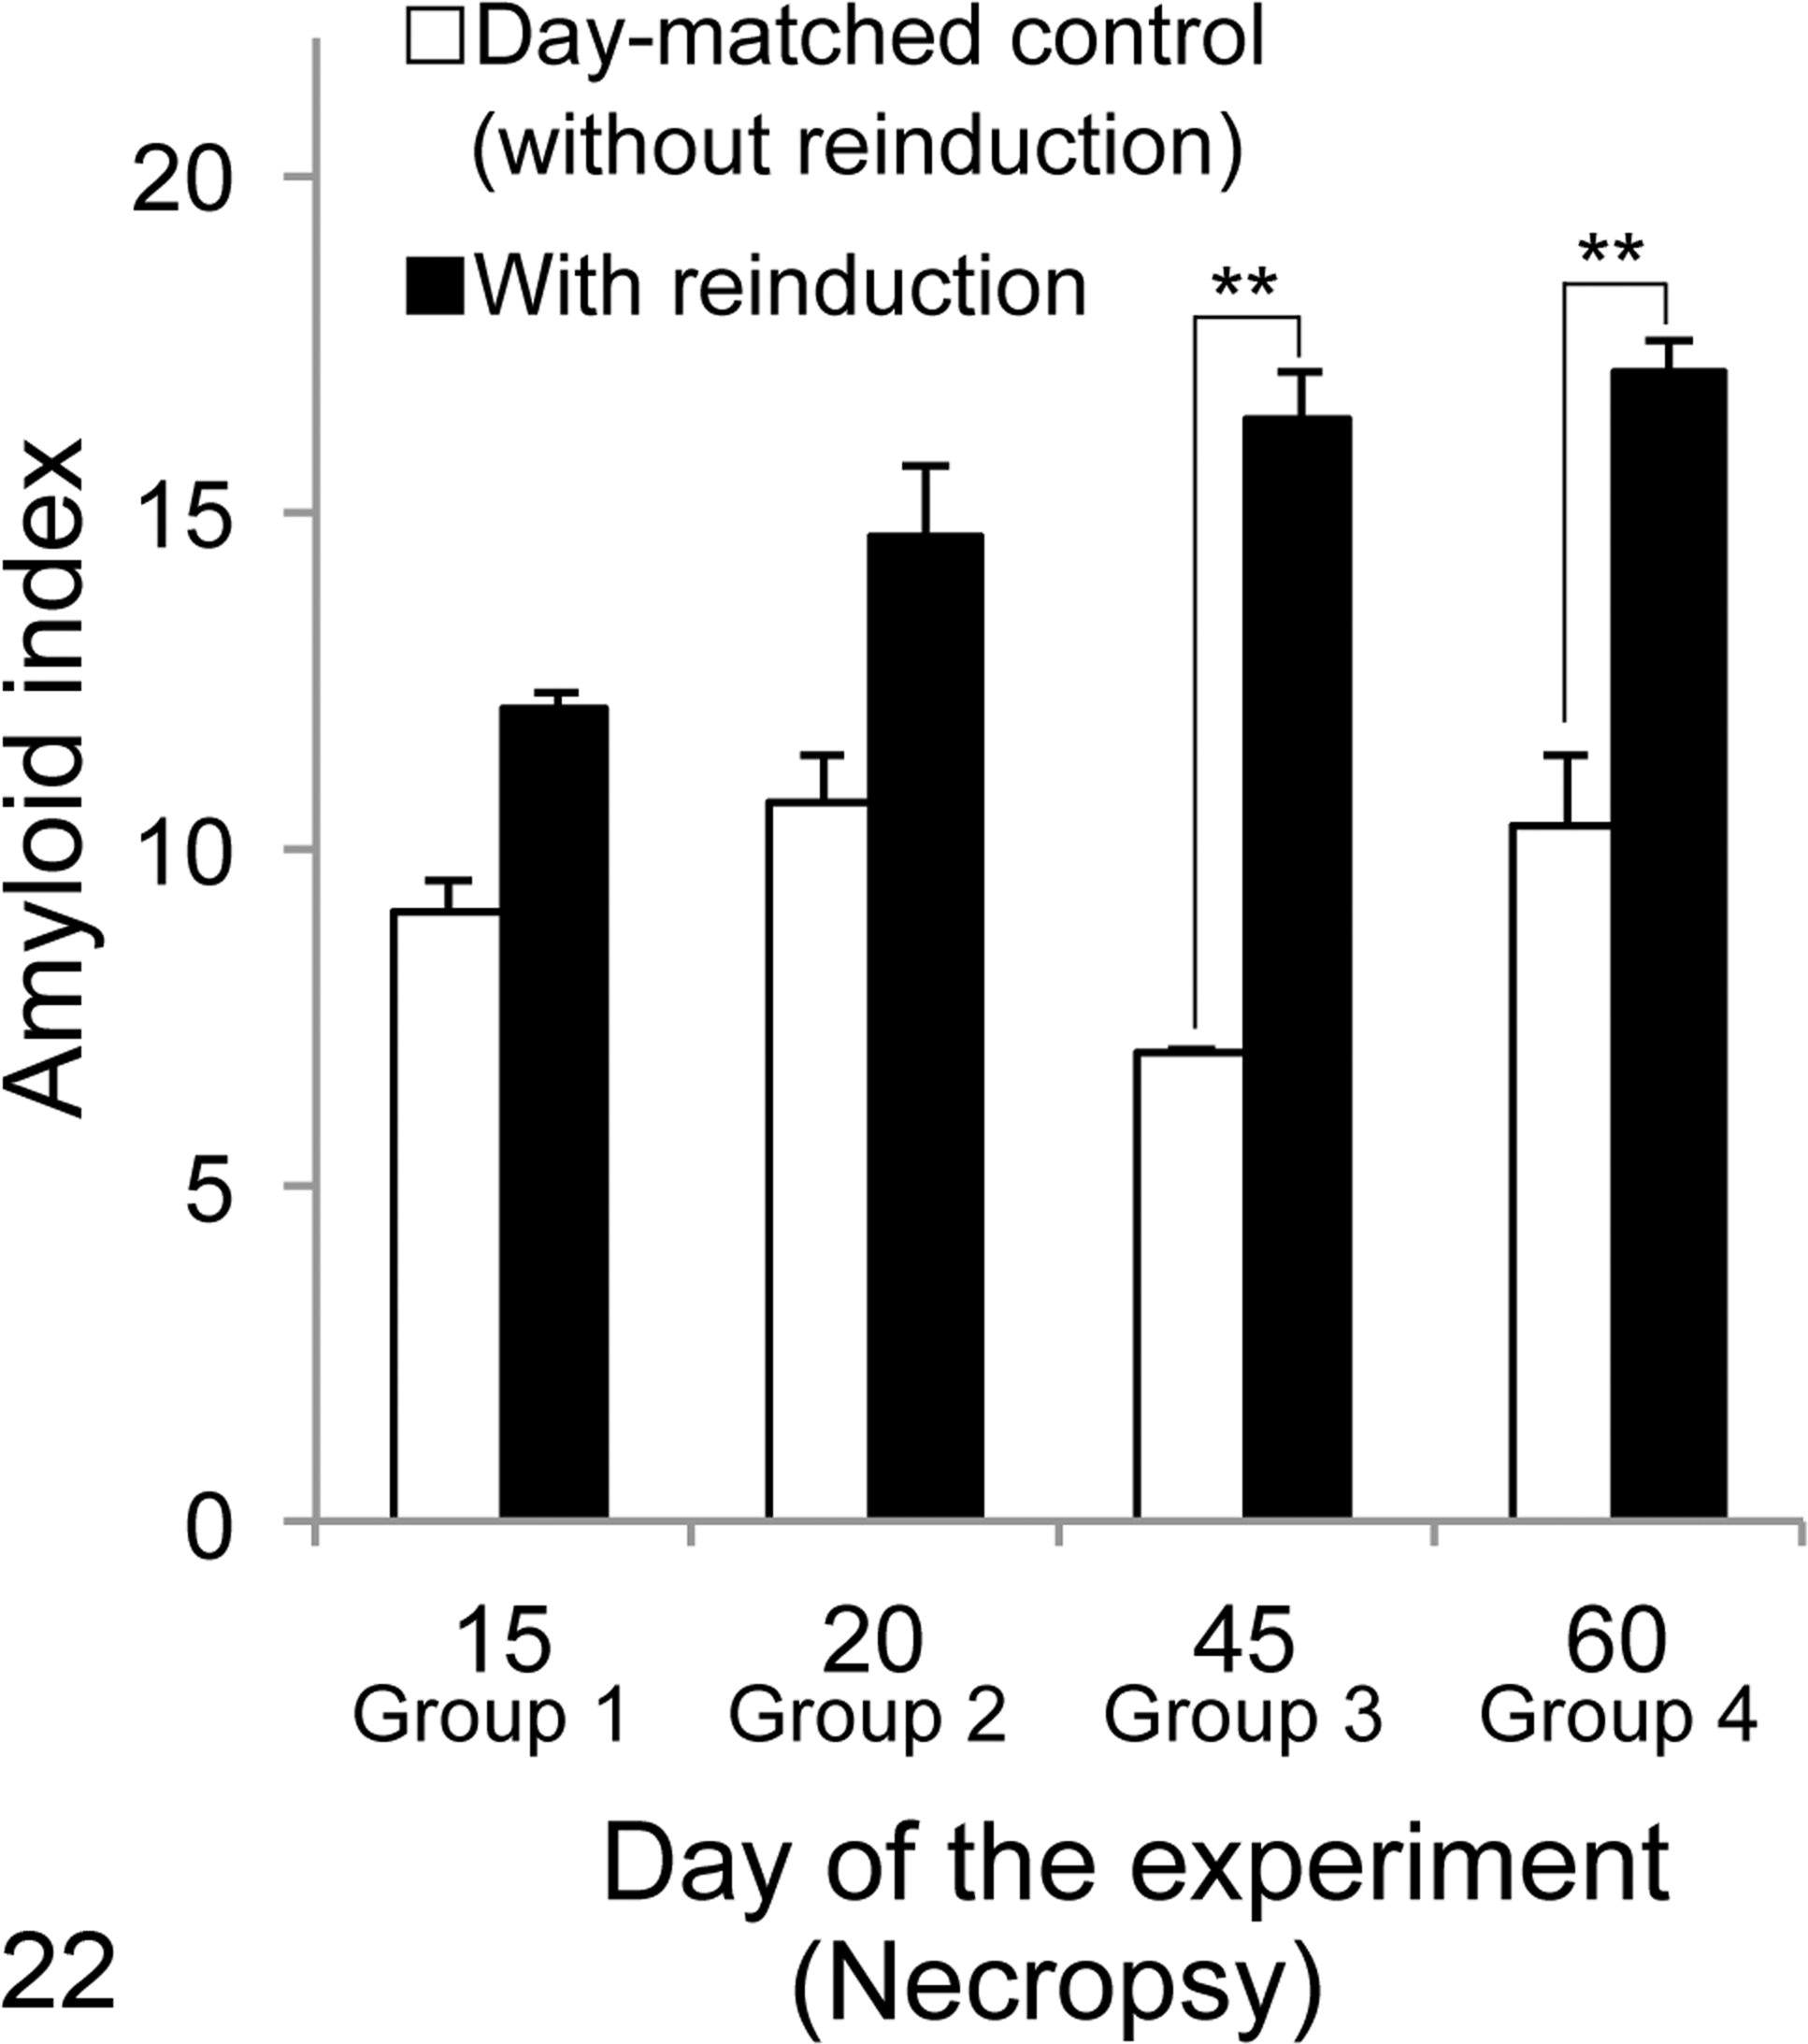
Changes in the amyloid index after reinduction (experiment 2). After reinduction, amyloid A amyloidosis increased in all mice, compared with mice in experiment 1. Significant differences were observed between groups 3 and 4. **P < .01, 2-way analysis of variance with post hoc Tukey-Kramer multiple-comparison tests.
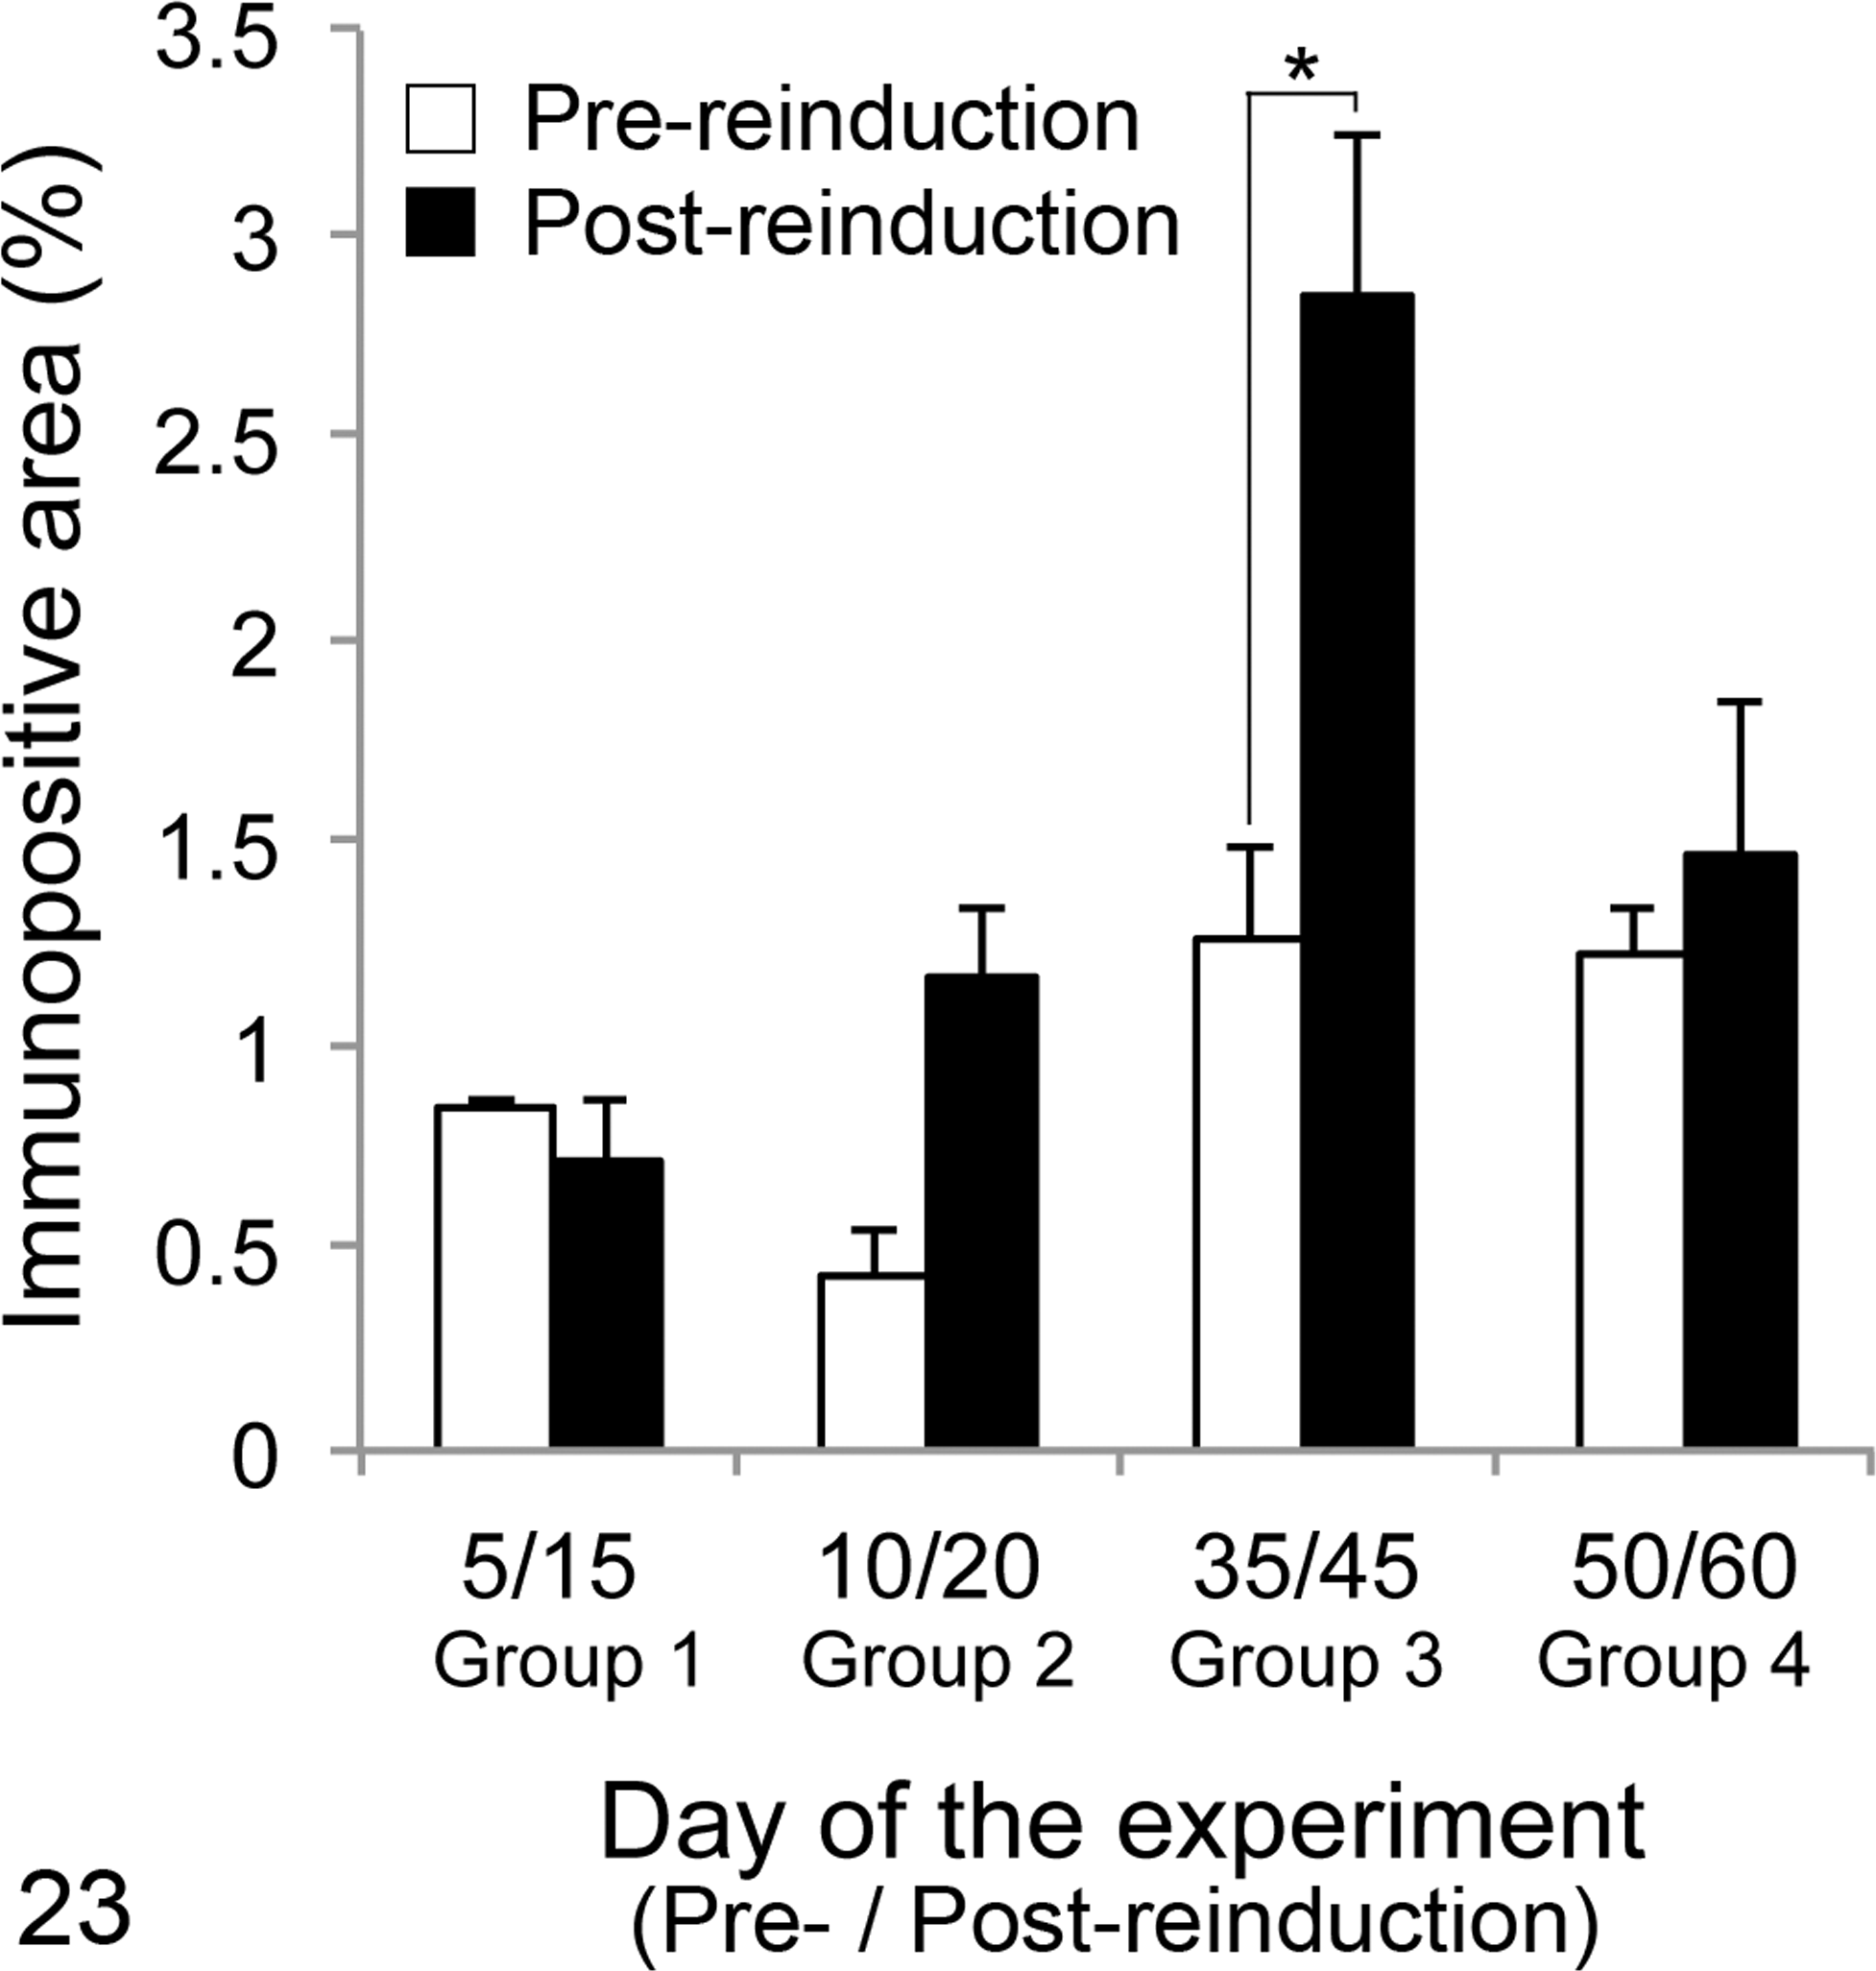
Splenic amyloid deposition after additional silver nitrate (AgNO3) injection (experiment 2). After the initial induction of amyloid A (AA) amyloidosis, splenic biopsies were obtained before administering an additional injection of AgNO3 on day 5, 10, 35, or 50 (for groups 1–4, respectively). Splenic tissue was obtained at necropsy (day 15, 20, 45, or 60, respectively). The extent (area) of immunolabeling for mouse serum AA was quantified using image analysis and compared in pre-reinduction biopsies and post-reinduction necropsy samples. There were significant differences between pre- and post-reinduction in group 3. *P < .05.
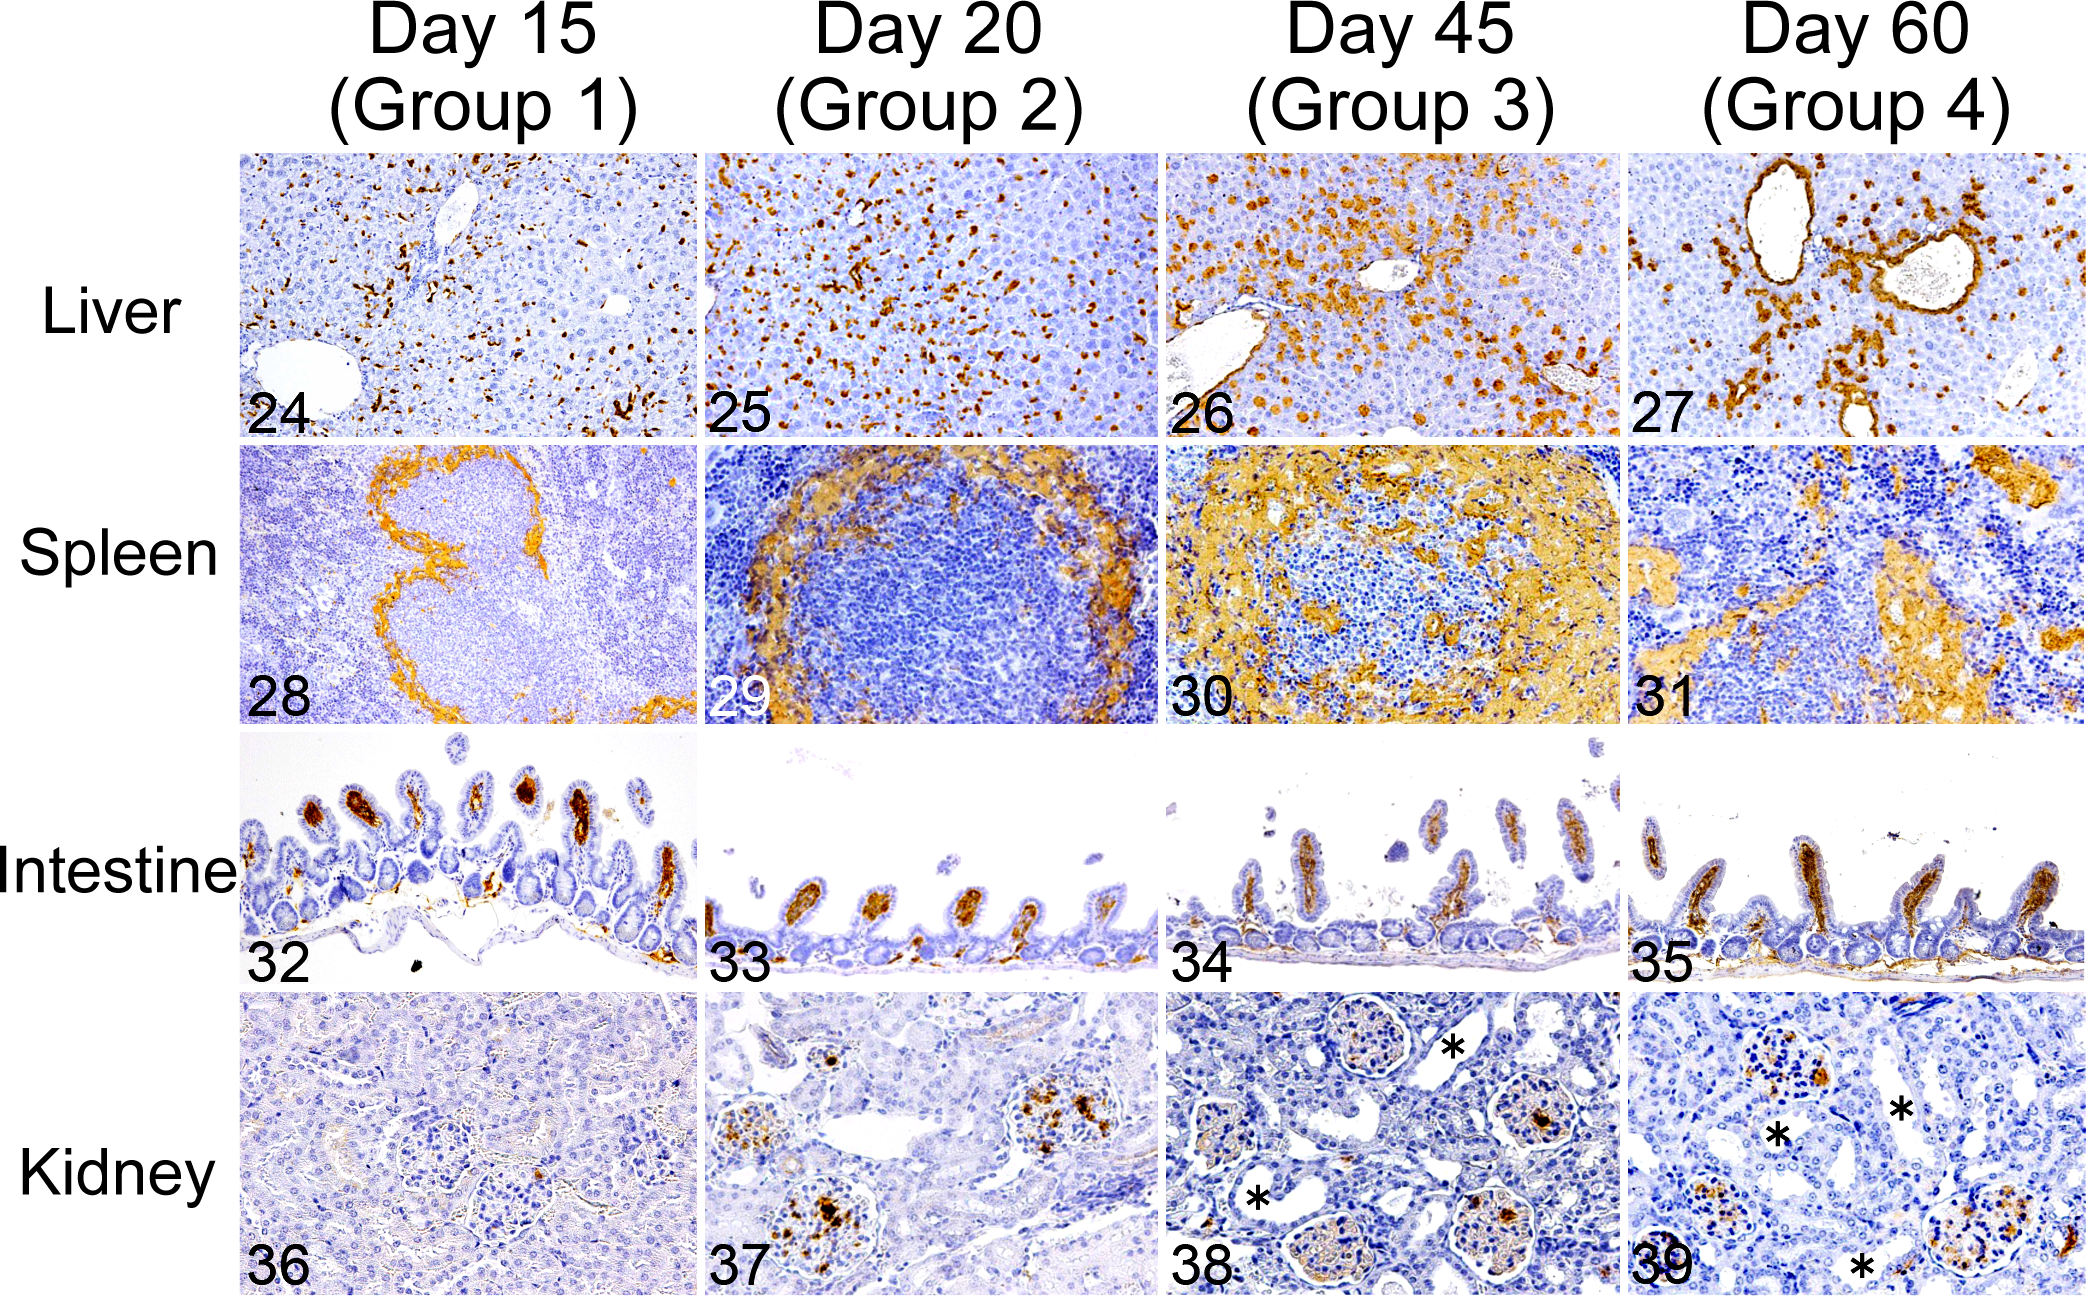
The amyloid index of all mice was elevated by additional AgNO3 injection, whereas the distribution patterns of amyloid deposition differed between groups (Figs. 24–39). In the liver, mice in groups 1 and 2 developed diffuse amyloid deposition, whereas most mice in group 4 developed perivascular amyloid deposits (Figs. 24–27). In the spleen, splenic follicles were surrounded by large amyloid deposits in groups 1 to 3, particularly in group 3 (Figs. 28–30). In group 4, a large amount of nodular amyloid deposition was observed in the red pulp (Fig. 31). In the intestines, all mice that underwent additional AgNO3 injection developed severe amyloid deposition in the villi of the small intestines (Figs. 32–35). In the kidney, glomerular amyloid deposition was common in mice with additional AgNO3 injection and distinct in groups 2 to 4 (Figs. 36–39). Severe amyloid deposition in the renal papilla and glomeruli was observed with dilation of renal tubules in groups 3 and 4 (Figs. 38, 39). A comparison of the histological patterns of AA amyloid deposition in the same individual, between pre- and post-reinduction (10 days after additional AgNO3 injection) samples from the spleen, revealed that the amount of amyloid deposits increased after additional AgNO3 injection (Suppl. Figs. S22–S25).
Circulating SAA concentrations after additional AgNO3 injection were mildly increased but were still significantly lower than the highest concentration on the initial induction (day 1), except for day 52 (P < .01) (Suppl. Fig. S26: 6236 ± 2867 μg/ml on day 52).
Experiment 3: AEF Activity in Sera of Mice With AA Amyloidosis
As a result of the inoculation with sera from mice with AA amyloidosis, combined with SC injection of AgNO3, 33% to 83% of mice (groups B–F) developed AA amyloidosis (Table 3).
Discussion
The present study characterized the deposition, clearance, and reinduction of AA amyloid in IL-1raKO mice. Based on these data, the serological properties and molecular mechanisms of amyloid deposition in vivo are extrapolated.
In experiment 1, the morphology of amyloid deposits in the liver changed from granules to nodules, and deposits finally localized in the perivascular area. In the spleen, amyloid deposition was initially observed in the marginal zone and then extended to the red pulp. Sponarova et al 25 examined the natural clearance of amyloid deposits in murine AA amyloidosis for 20 weeks; they indicated that hepatic and splenic amyloid deposits are engulfed and degraded by macrophages. In the present study, phagocytosis of amyloid by macrophages was not evident, and there were no histological features indicating biological or inflammatory reactions against amyloid deposits. Amyloid distribution in each organ was related to regional circulation and moved from an area upstream to downstream of the blood flow (suggestive of intraorgan transmission); however, the detail of this process was not clarified.
Analysis of circulating SAA concentrations and amyloid index revealed that AA amyloid deposition began on day 2 and markedly progressed until approximately day 20, after the normalization of circulating SAA concentrations. SAA is not stable by itself; hence, 95% of it naturally binds with high density lipoprotein (HDL) and forms HDL-SAA complexes in circulation. 28,30 SAA dissociates from HDL in the presence of antagonists (apolipoprotein A-I, A-II, heparan sulfate), and several studies have suggested that dissociation of HDL-SAA plays an important role in SAA aggregation. 1,9,15 Lu et al 12 described that human SAA1.1 makes trimer, hexamer, and dodecamer aggregates in HDL-free conditions, the proportion of which are altered by the SAA concentration. We hypothesized that after the normalization of circulating SAA concentration, major apolipoproteins gradually displace SAA, allowing dissociated SAA to form amyloid fibrils. Kinetic analyses are necessary to clarify this hypothesis.
Here, we investigated the circulating SAA aggregation using amyloid oligomer-specific dot blot, but no significant differences were revealed. On the other hand, the findings of immunoblot analysis suggested that murine SAA creates different-sized oligomers during amyloid deposition and clearance. The lowest molecular weight bands at 12.6 kDa may be SAA monomers, the next larger bands at 28 kDa to 30 kDa may be SAA dimers, and the 40-kDa band may indicate SAA trimers. Little is known about the behavior of serum SAA oligomers in AA amyloidosis, 27 and thus it was interesting that the increase in SAA dimers was temporally associated with the clearance of hepatic and splenic amyloid deposits. Nyström et al 16 suggested that the cleaved product of AA amyloid (eg, phagocytized AA amyloid fibrils in macrophages) transferred from the initial region to other organs, and caused progression of AA amyloidosis. 20 Our findings indirectly suggest that the SAA dimer was one of the cleaved products of AA amyloid.
Amyloid deposition was faster and more severe after additional AgNO3 injection in experiment 2. Comparison of the pre- and post-reinduction samples within the same individual revealed that newly formed amyloid deposits after additional AgNO3 injection surrounded the initial amyloid deposits in the spleen. Cohen et al 3 studied amyloid-β42 (Aβ42) aggregation using a kinetic technique and revealed that amyloid fibrils themselves show catalytic activity for amyloid aggregation. In this study, aggregated amyloid fibrils strongly catalyze and decrease the reaction energy required for conformational change from Aβ42 to amyloid fibril. The reaction is known as “secondary nucleation.” Further production of SAA by additional AgNO3 injection may promote secondary nucleation, and new amyloid fibrils then form around the initial deposits. Experiment 2 also revealed that elevations in circulating SAA concentration after additional AgNO3 injection were lower than those after the initial induction. Simons et al 21 reported that circulating SAA concentration was reduced by 90% during AEF-induced amyloid deposition, whereas the expression of SAA messenger RNA (mRNA) did not change. They attributed the decrease in circulating SAA concentration to the consumption of SAA needed for the formation of amyloid aggregates. In the present study, newly produced SAA induced by additional AgNO3 injection may have immediately been used for AA amyloid aggregation.
The findings of experiment 2 indicate that additional inflammatory stimuli on day 35 were more effective in inducing amyloid deposition than at the other time points in IL-1raKO mice. Amyloid deposition was also observed in the adrenal glands, kidneys, and thyroid glands after additional AgNO3 injection, whereas amyloid deposits were scarce in these organs following the initial induction. At this time, an increase in cleaved products, possibly SAA dimers, may be present in the microenvironment. The cleaved products, which may have already spread and transmitted through the blood, might act as a foothold for amyloid deposition. Tasaki et al 27 detected SAA oligomers from plasma exosomes of mice with AA amyloidosis, and the inoculation of these oligomers to another mouse, combined with SC injections of AgNO3, induced AA amyloidosis. The findings of experiment 3 suggested that serum samples from mice on day 35 or 50, which were rich in SAA dimers, induced AA amyloidosis in a high proportion of mice. The findings indirectly suggest that the cleavage products of AA amyloid deposits, such as SAA dimers or other oligomers, may be amyloidogenic. Previous studies in vitro also indicated that SAA oligomers have pathogenicity for AA amyloidosis. 18,26,27,31 Specific SAA oligomers, such as the SAA dimer, may be involved in organ-to-organ transmission of AA amyloidosis, and additional inflammatory stimuli may accelerate the mechanisms responsible for this process (Fig. 40).
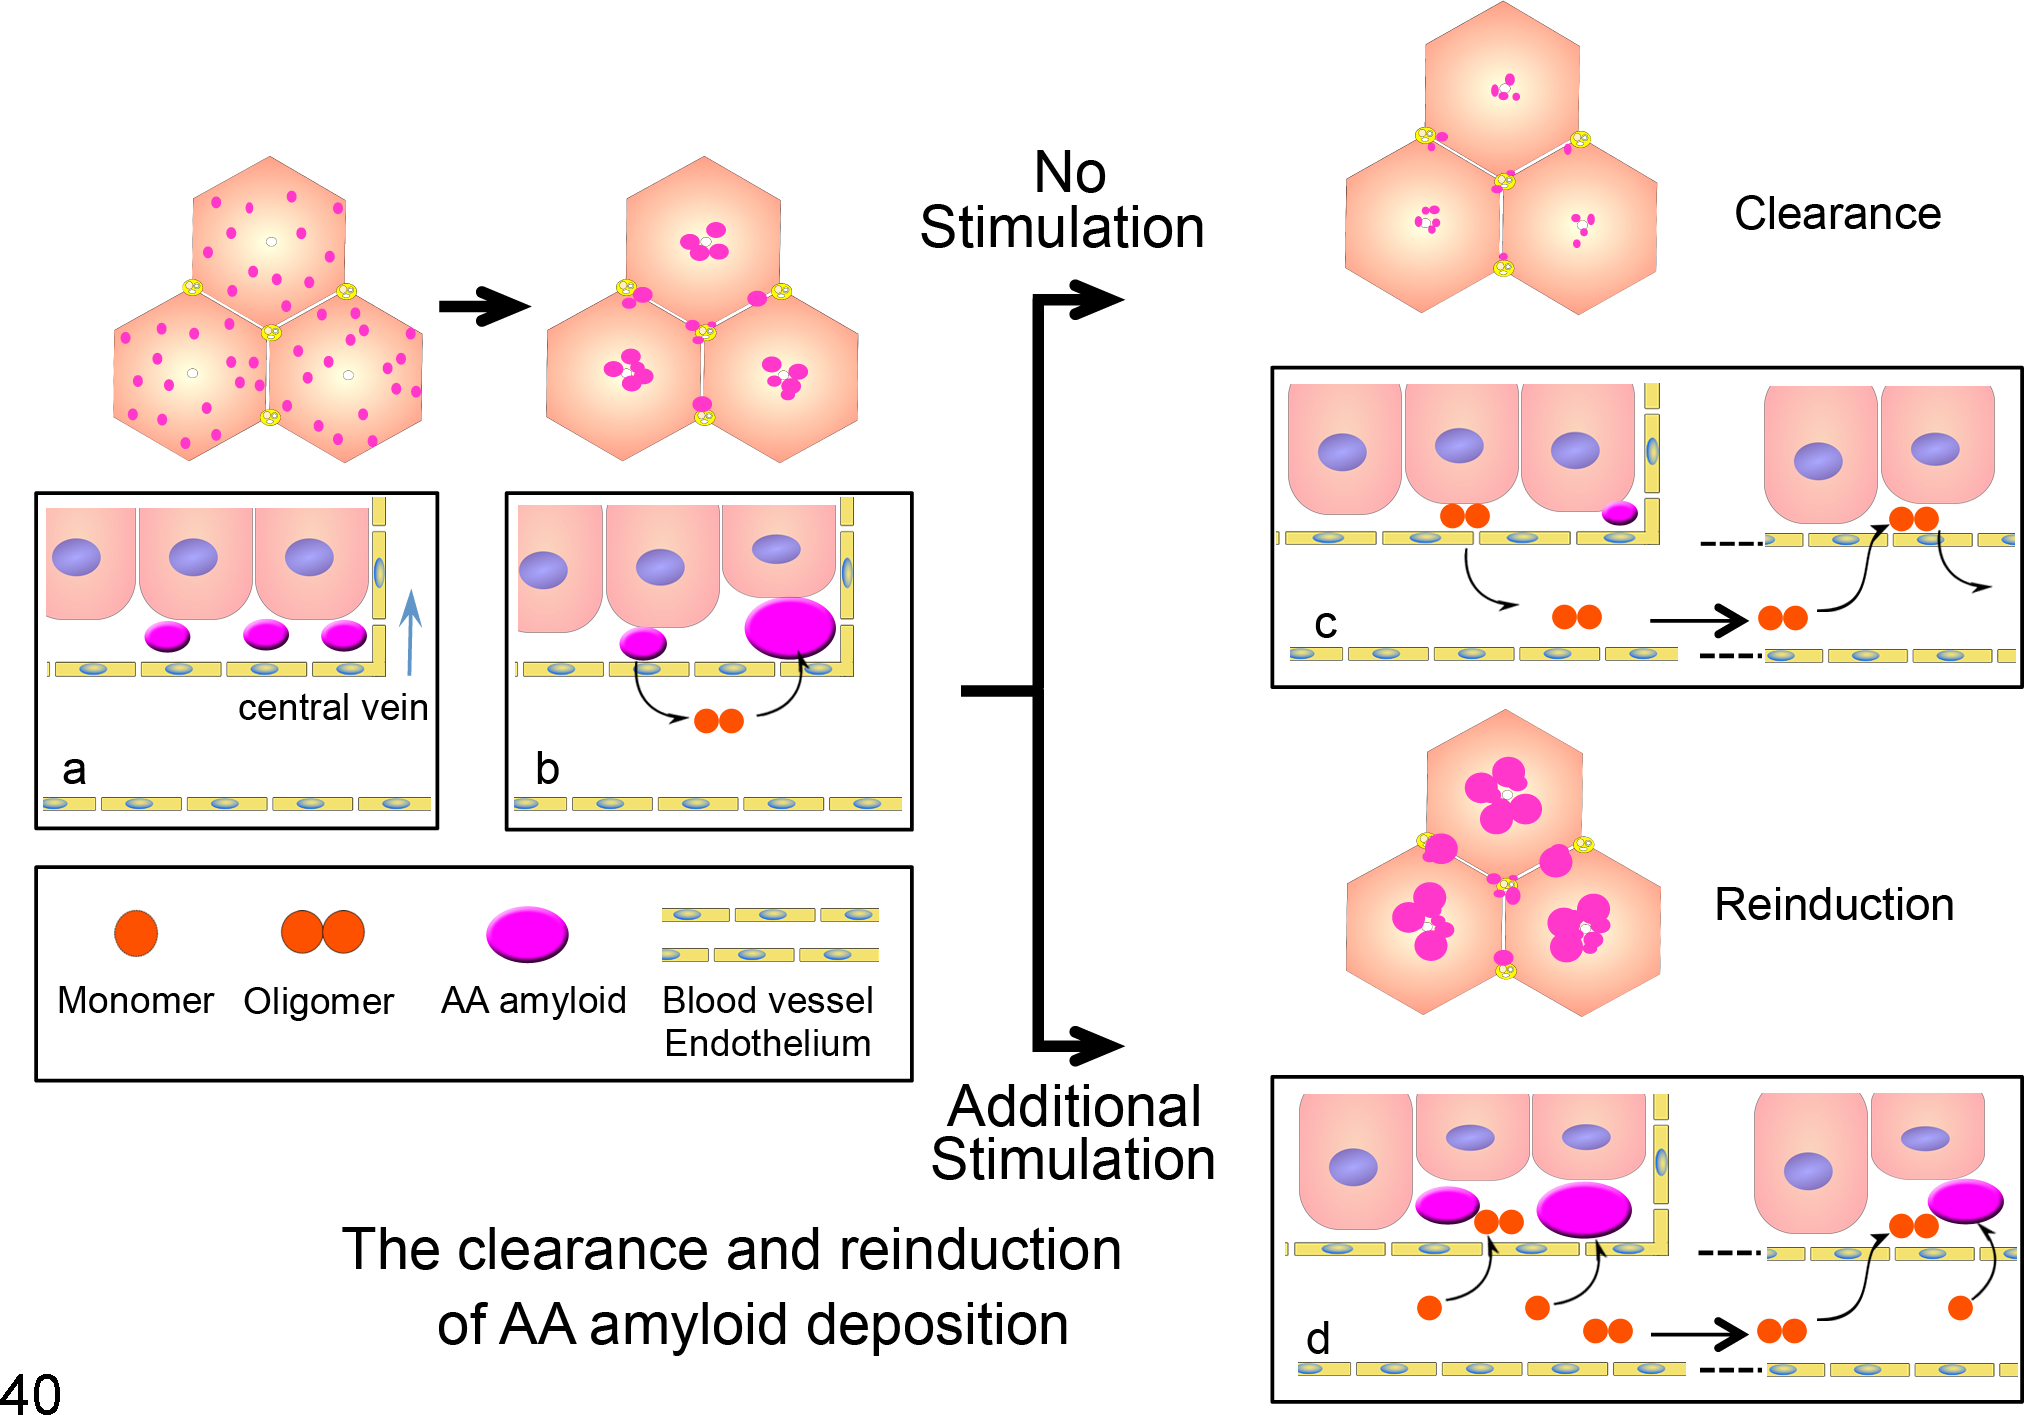
Proposed model for the clearance and reinduction of amyloid A (AA) amyloidosis. Changes in the distribution pattern of hepatic amyloid deposition (upper). The pink dots indicate amyloid deposits. The pattern changes over time from diffuse to perivascular. Dynamic changes of serum AA (SAA) monomer, oligomer, and AA amyloid (lower). (a, b) Amyloid deposits decay to SAA dimers and then form amyloid deposits downstream of the blood flow. (c) After the cessation of inflammatory stimulation, amyloid deposits are gradually cleared and almost completely eliminated. (d) An additional AgNO3 stimulation induces further elevations in SAA and amyloid deposition, and it accelerates the organ-to-organ transmission of AA amyloidosis. SAA oligomers act as nuclei for amyloid aggregation.
In conclusion, our study suggests amyloidogenicity of SAA oligomers. To clarify the molecular mechanisms of AA amyloid deposition, further detailed examination is needed, although our findings will be helpful to understand the pathogenesis of AA amyloidosis, especially the progression of the disease.
Footnotes
Declaration of Conflicting Interests
The author(s) declared no potential conflicts of interest with respect to the research, authorship, and/or publication of this article.
Funding
The author(s) received no financial support for the research, authorship, and/or publication of this article.
References
Supplementary Material
Please find the following supplemental material available below.
For Open Access articles published under a Creative Commons License, all supplemental material carries the same license as the article it is associated with.
For non-Open Access articles published, all supplemental material carries a non-exclusive license, and permission requests for re-use of supplemental material or any part of supplemental material shall be sent directly to the copyright owner as specified in the copyright notice associated with the article.