
Abstract
MicroRNAs are short noncoding RNAs involved in regulation of gene expression. Certain microRNAs, including miR-122, seem to have ideal properties as biomarkers due to good stability, high tissue specificity, and ease of detection across multiple species. Recent reports have indicated that miR-122 is a highly liver-specific marker detectable in serum after liver injury. The purpose of the current study was to assess the performance of miR-122 as a serum biomarker for hepatotoxicity in short-term (5–28 days) repeat-dose rat toxicology studies when benchmarked against routine clinical chemistry and histopathology. A total of 23 studies with multiple dose levels of experimental compounds were examined, and they included animals with or without liver injury and with various hepatic histopathologic changes. Serum miR-122 levels were quantified by reverse transcription quantitative polymerase chain reaction. Increases in circulating miR-122 levels highly correlated with serum elevations of liver enzymes, such as alanine aminotransferase (ALT), aspartate aminotransferase (AST) and glutamate dehydrogenase (GLDH). Statistical analysis showed that miR-122 outperformed ALT as a biomarker for histopathologically confirmed liver toxicity and was equivalent in performance to AST and GLDH. Additionally, an increase of 4% in predictive accuracy was obtained using a multiparameter approach incorporating miR-122 with ALT, AST, and GLDH. In conclusion, serum miR-122 levels can be utilized as a biomarker of hepatotoxicity in acute and subacute rat toxicology studies, and its performance can rival or exceed those of standard enzyme biomarkers such as the liver transaminases.
Keywords
MicroRNAs (miRNAs) are a family of short (17–23 nucleotides) noncoding single-stranded RNAs that are primarily involved in posttranscriptional negative regulation of mRNA function through translational repression or cleavage. 14 miRNAs also play an important role in a variety of cellular processes, such as proliferation, metabolism, and differentiation, 16 and provide the cell with an additional layer of posttranscriptional control over key cellular functions. Recently, a variety of potential applications of miRNAs as biomarkers has been evaluated, including early detection of tumors, tissue-specific toxicity, and pathogen detection. 24,33,41
The utilization of miRNAs as circulating biomarkers has gained great interest due to their inherent physicochemical properties. One major attribute includes the ideal stability of miRNAs in blood, which likely comes from several aspects that aid in preventing degradation: small size, association with protein complexes, and containment within exosomes and microvesicles. 1 Another attractive attribute includes their tissue specificity, with some miRNAs having almost exclusive expression in a single tissue. Furthermore, the sensitivity of detection in blood in a disease state or upon chemical-induced tissue injury is high for a variety of miRNAs. Thus, the presence of specific miRNAs in body fluids gives them potential to become non- or minimally invasive biomarkers for evaluating tissue injury. Recent applications of circulating miRNAs as diagnostic biomarkers of tissue injury in natural or experimental diseases include (1) muscle injury in Duchenne muscular dystrophy, 3 (2) plasma miR-216a in rat models of acute pancreatitis, 20 or (3) detection and prognosis of various types of metastatic cancers derived from specific tissues. 21 Finally, the nucleic acid sequences of miRNAs are typically well conserved across species. This finding—coupled with the ability to rapidly measure their levels in blood by polymerase chain reaction (PCR)–based methods—suggests that miRNA-based assays for tissue injury are both translatable and practical. Additionally, the high levels of tissue specificity of miRNAs offer the possibility of measuring them simultaneously, thus offering the potential for the development of a panel of miRNAs that can be quantified as biomarkers for various tissue injuries.
Recent proof-of-concept studies have demonstrated that miR-122 is reliably increased following liver injury induced by known hepatotoxicants or in disease states. 5,24,39 The primary physiologic role for miR-122 is regulation of cholesterol and fatty acid biosynthesis and β-oxidation, 10 and antisense targeting of miR-122 reduces serum cholesterol levels by 20% to 30%. 22 This includes regulatory inhibition of key enzymes in these metabolic pathways, such as CYP7A1 (cholesterol 7-alpha-hydroxylase). 36 Intriguingly, miR-122 facilitates the replication of hepatitis C virus, and therapeutic anti-miR-122 strategies have been proposed for its treatment. 18 As a liver biomarker, the selectivity of miR-122 likely is aided by the fact that approximately 72% of all detectable liver miRNA transcripts are miR-122. 23 The sensitivity for detecting liver damage is high, with a 6000-fold increase in serum miR-122 levels following treatment of rats with the reference hepatotoxicant chlorobromomethane. 24 miR-122 is a clinically relevant biomarker, and its sequence is conserved across many species. Taken together, the key attributes of good sensitivity and selectivity, practicality, and translatability make miR-122 an attractive biomarker for the assessment of liver injury in toxicology studies.
The purpose of the current study was to evaluate the utility of miR-122 as a serum biomarker for liver injury in rats by comparing its performance to that of the traditional clinical chemistry liver enzymes utilized in short-term toxicology studies (5–28 days of dosing). More than 20 unique proprietary and reference compounds of diverse chemical nature and representative of druglike small molecules were utilized. In addition to assessing the role of miR-122 in isolation, a secondary goal was to determine if miR-122 improves the diagnostic accuracy of hepatotoxicity when combined with alanine aminotransferase (ALT), aspartate aminotransferase (AST), and glutamate dehydrogenase (GLDH). Finally, a recommendation on best practices for RNA extraction, sample preparation, and data normalization is discussed to provide context for utilization of miR-122 as a diagnostic biomarker in rat toxicology studies.
Materials and Methods
Reagents
Twenty unique proprietary experimental compounds representative of a typical discovery pharmaceutical pipeline were utilized in the current study and were classified by the histopathologic findings observed in the liver. In addition, 4 commercially available liver and biliary toxicants (Sigma-Aldrich, St Louis, MO, USA) were used to generate specific hepatic lesions: methylenedianiline, carbon tetrachloride, alpha-naphthylisothiocyanate, and diclofenac. In all cases, the purity of the chemicals was of the highest grade available for in vivo testing. Total RNA from 25 rat tissues (listed in Table 1) was purchased from Zyagen (San Diego, CA, USA) for assessing the tissue distribution of miR-122.
Distribution of miR-122 in 25 Rat Tissues.
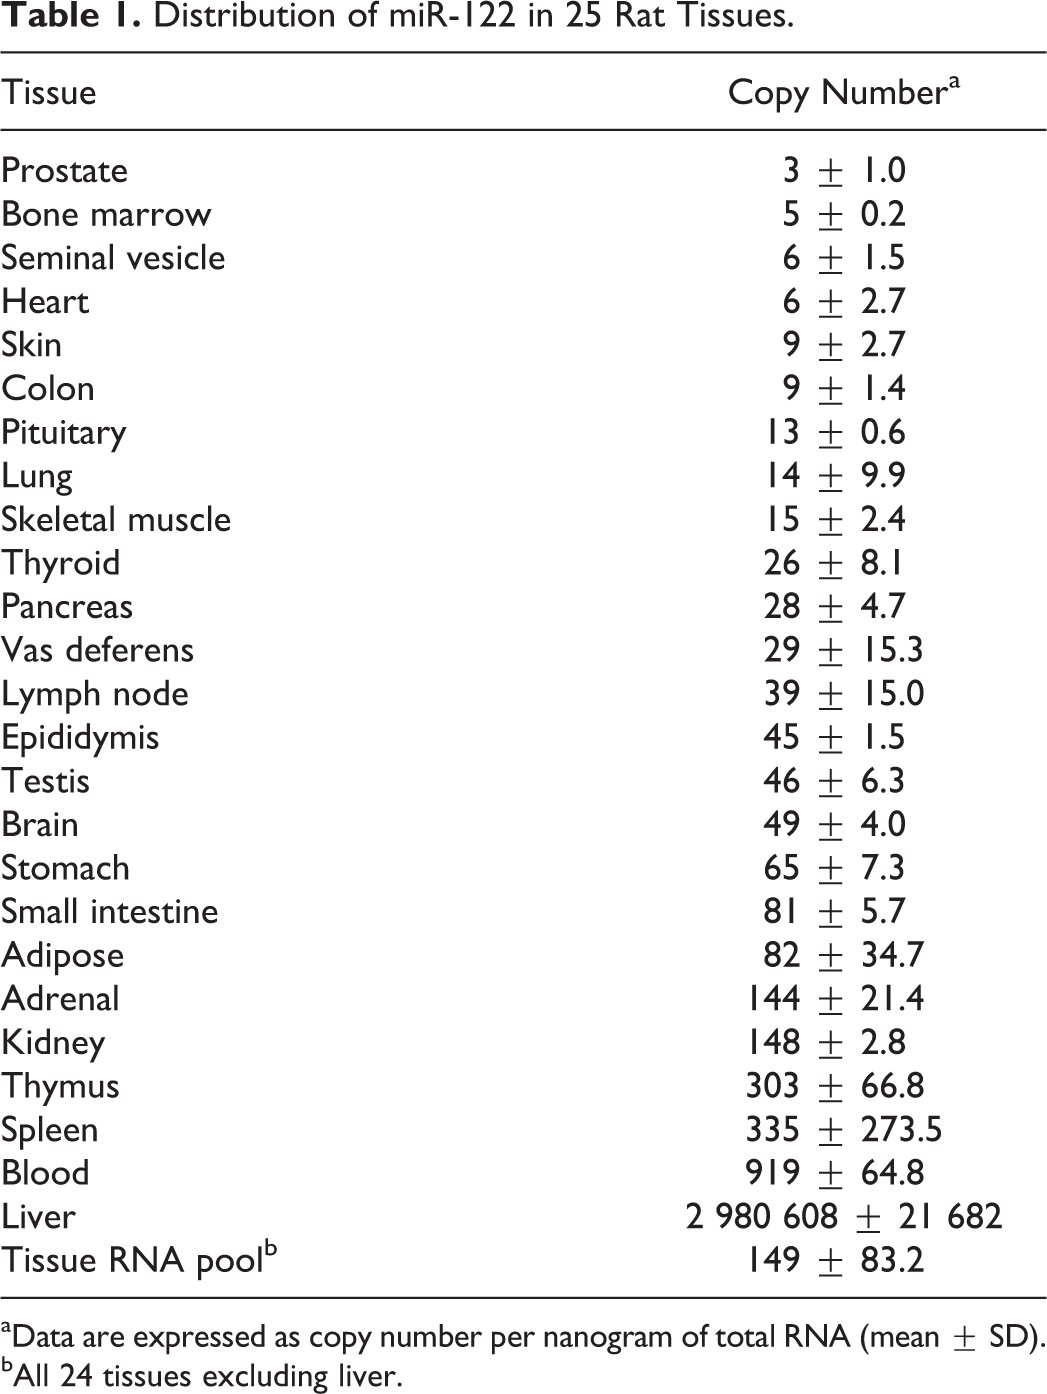
aData are expressed as copy number per nanogram of total RNA (mean ± SD).
bAll 24 tissues excluding liver.
Animals
All animal experiments for this study were conducted in accordance with the Guide for the Care and Use of Laboratory Animals. All studies were conducted within a program accredited by the Association for Assessment and Accreditation of Laboratory Animal Care and approved by Abbvie’s Institutional Animal Care and Use Committee. Briefly, male Sprague-Dawley rats were purchased from Charles River Laboratories, Inc (Portage, MI, USA). The rats were typically 7 to 8 weeks of age and weighed 250 to 350 g at the start of the study. The animals were acclimated for a minimum of 2 days after receipt and randomized into treatment and control groups. Rats were permitted certified rodent chow and water ad libitum and were fasted overnight prior to necropsy.
Serum Collection
Terminal serum samples (n = 263) were collected from 5- to 28-day repeat-dose toxicology studies in male Sprague-Dawley rats (Charles River Laboratories, Inc) conducted between 2008 and 2011. The majority of these studies included 4 groups (vehicle control and low, middle, and high doses of the test article) with 3 male animals per group. Whole blood was collected from isoflurane-anesthetized rats in all studies by puncture of the abdominal aorta and subsequently placed into serum separator tubes (BD, Franklin Lakes, NJ, USA), allowed to coagulate at room temperature for 15 to 30 minutes; it was then centrifuged for 15 minutes at 2000 × g, and the serum was removed from the clot. Serum samples were analyzed on an Abbott Architect clinical chemistry analyzer (North Chicago, IL, USA) for quantification of ALT, AST, and GLDH activity. Serum for miRNA analysis was transferred into 2 mL RNase free tubes and frozen at –80°C immediately after collection for subsequent RNA extraction, isolation, and analysis.
Histopathology
A portion of the liver from each animal was fixed in 10% neutral buffered formalin and subsequently embedded in paraffin blocks for sectioning. Slides for hematoxylin and eosin staining were prepared according to well-established methods. Each liver sample was evaluated for 5 subtypes of histopathologic changes and graded using a semiquantitative grading system by board-certified diplomates of the American College of Veterinary Pathologists. The histopathologic lesions were interpreted as treatment related and described as follows: hepatocellular hypertrophy, vacuolization, coagulative necrosis/single-cell necrosis, biliary injury, and inflammation. Lesions were graded as 0 (within normal limits), 1 (minimal), 2 (mild), 3 (moderate), or 4 (marked) based on the severity of the findings.
Criteria for Positive and Negative Histopathologic Liver Response
To assess the diagnostic performance of miR-122 and the 3 selected serum enzymes when benchmarked against histopathology, the criteria for a negative or positive histopathologic liver response to treatment were established. The cumulative histopathology grade was calculated as determined as the sum of grades related to all 5 subtypes of liver injury in each animal, with 20 being the highest possible grade for each rat. The liver response was categorized as positive if the cumulative grade for all 5 subtypes of histopathologic changes was ≥3 and negative if the cumulative grade was 0 to 2. The positive cutoff value of 3 was chosen after empirical determination that it yielded the optimal balance of sensitivity and specificity. Nontreatment-related low-grade liver lesions observed in some of the control animals, which are consistent with general variability in animal health, could similarly lead to changes in miR-122 levels. Reducing the cutoff value from ≥3 to either ≥2 or 1 led to similar overall conclusions about the performance of miR-122 as a biomarker.
Total RNA Extraction
Total RNA, including small RNAs, was isolated from 200 μl of serum using the Qiazol extraction method, followed by purification with a miRNeasy Mini kit (Qiagen, Valencia, CA, USA) in accordance with the manufacturer’s protocol. Briefly, total RNA was extracted by mixing 200 μl of serum with 4 volumes (800 μl) of Qiazol reagent and 160 μl of chloroform, followed by centrifugation for 15 min at 12 000 × g at 4°C. The aqueous phase (600 μl) was transferred into a new tube, and RNA was subsequently precipitated with 1.5 volumes (900 μl) of 100% ethanol and loaded onto miRNeasy columns (Qiagen) for purification. Purified RNA was eluted with 40 μl of RNase-free water. Nucleic acid concentrations were determined by optical density 260-nm quantification using a Nano-Drop spectrophotometer (Thermo-Scientific, Wilmington, DE, USA). To control for extraction efficiency and variability, samples were spiked with 2 synthetic Caenorhabditis elegans miRNAs: syn-miR-Cel-39 and syn-miR-Cel-54 (Qiagen). Each synthetic C. elegans miRNA was added during the Qiazol step of miRNA extraction at 6 × 10⁸ copies (0.5 μl of 2nM solution). To aid in improving RNA yield, 800 ng of E. coli total RNA (Life Technologies, Carlsbad, CA, USA) was added to each sample as a carrier.
Reverse Transcription Quantitative PCR
SYBR Green–based miRNA specific quantitative PCR (qPCR) assays from SABiosciences (Valencia, CA, USA) were used to quantify the levels of miR-122 and miR-16 as well as spiked synthetic cel-miR-39 and cel-miR-54 in rat serum. In brief, cDNA was synthesized using 5 μl of each total RNA sample (˜100 ng of nucleic acid) by reverse transcription using miRNA First Strand Kit from Qiagen (SABiosciences) according to the manufacturer’s instructions. Upon completion, cDNA was diluted 10 times by adding 90 μl of RNase-free water to 10 μl of reverse transcription reaction mix. Diluted cDNA samples (3 μl) were utilized in a subsequent SYBR Green qPCR in a total reaction volume of 10 μl. The real-time qPCR was performed using the 7900HT PCR system from Applied Biosystems (Foster City, CA, USA) and SDS 2.2.2 software. Standardized qPCR conditions recommended by the supplier included an initial denaturation step at 95°C for 10 minutes, followed by 40 cycles consisting of the following steps: denaturation at 95°C for 15 seconds, annealing at 60°C for 40 seconds, and extension at 72°C for 30 seconds. Dissociation curve analysis was performed at the end of each cycling program to control PCR specificity. The melting curve parameters were as follows: 1 minute at 95°C, 2 minutes at 65°C (optics off), and ramp 65°C to 95°C at 2°C/min (optics on).
Reverse Transcription qPCR Data Analysis
The qPCR results were analyzed using either absolute quantification or the ΔΔCt method. 26 For generation of miR-122 tissue distribution data, absolute quantification was utilized. This method incorporated a 9-point standard curve from serial dilutions of synthetic miR-122 (IDT, Coralville, IA, USA), which spanned a range of 10 to 1 billion copies of synthetic miR-122. The ΔΔCt method was used to assess miR-122 fold change in the serum of treated animals over the mean of the corresponding vehicle controls. The ΔΔCt method normally includes normalization to a reference gene to correct for any difference in sample loading. The housekeeping miR-16 is one of the most commonly used reference controls used for quantification of miRNAs in tissue samples 6,17,35 In the current analysis, due to the lack of the housekeeping gene in serum, Ct values for each sample were normalized to the mean Ct value of the spiked syn-miR-Cel-39 and syn-miR-Cel-54. Normalization to miR-16 was also assessed in this study and was compared to that of spiked C. elegans controls.
Statistical Analysis
The cumulative performance of each marker (miR-122, ALT, AST, and GLDH) for differentiating the positive and negative toxicity responses was summarized using receiver operating characteristic (ROC) curves, and the corresponding area under the curve (AUC) was reported. The AUCs of these markers were statistically compared using a bootstrap resampling procedure. 32
The optimal threshold for each marker that differentiates the positive and negative toxicity responses was estimated using the BATTing algorithm (ie, bootstrapping and aggregating thresholds using trees). BATTing is an ensemble tree-based approach for estimating thresholds on biomarkers. A large number of trees—each built on several (n = 500) resampled variations (bootstrap sampling with replacement) of the same data set—are used in this estimation process. 2 Thresholds (split points) from multiple (500) trees corresponding to the 500 bootstrap data sets are aggregated to yield a relatively more robust estimate of the optimal threshold for each biomarker (Fig. 1). The corresponding 95% confidence intervals were estimated via the bootstrap procedure.
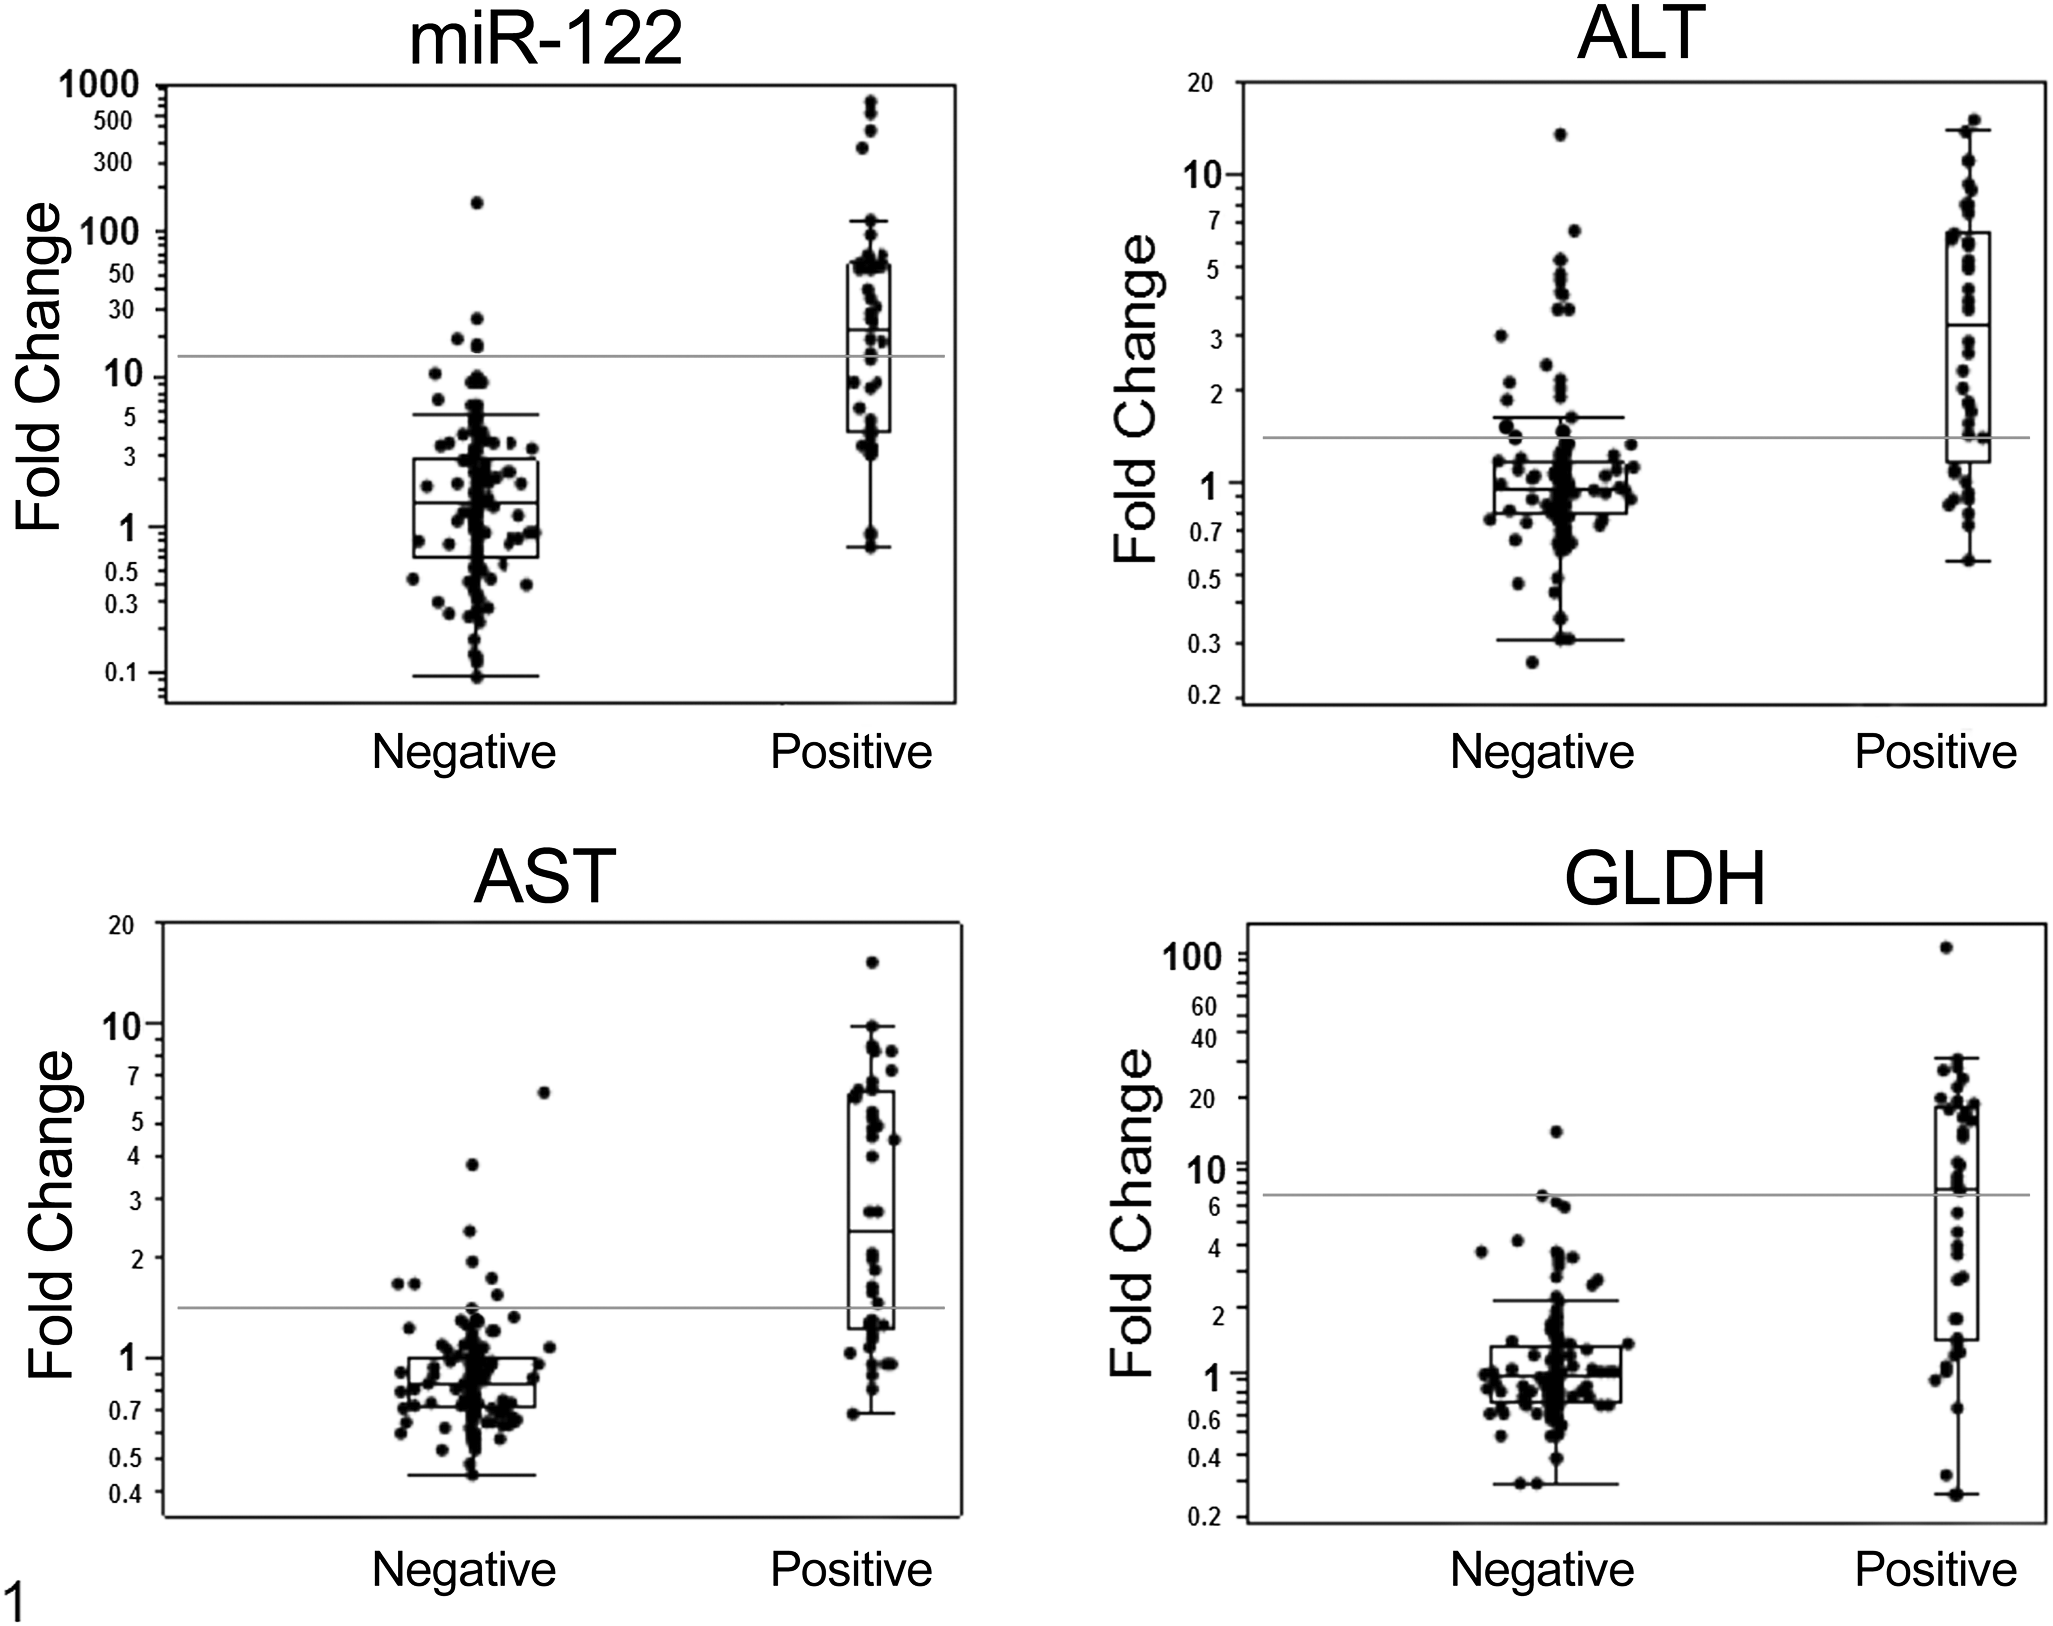
The distribution of serum levels of miR-122, alanine aminotransferase (ALT), aspartate aminotransferase (AST), and glutamate dehydrogenase (GLDH) in rats (n = 190) with positive (+) and negative (–) histopathologic responses. The data are shown as fold change over the mean of the corresponding vehicle-treated controls. Negative response was defined by a cumulative histopathologic grade of 0–2; positive response was defined by a cumulative histopathologic grade ≥3. The horizontal line inside the box represents the median; the top and bottom of the box represent the first and third quartiles, respectively; and the whiskers represent mean ± 2.7× standard deviation. Values outside these limits represent statistical extremes. The optimal threshold values that significantly differentiate negative and positive responses for liver histopathology are represented by the horizontal gray line.
The performance of this optimal threshold was estimated via 20 iterations of 5-fold cross-validation. In this procedure, the data were divided into 5 random subsets; each subset was left out 1 at a time; and the BATTing threshold estimate for the concerned marker was established using the data from the other 4 subsets of data. This threshold was then used to predict the positive and negative toxicity responses of each sample in the left-out subset. The predictions from all the 5 left-out subsets were then aggregated, and the performance was evaluated. This entire procedure was then repeated 20 times. The mean and standard deviation of the performance metrics were reported, such as sensitivity, specificity, positive predictive value, and negative predictive value.
The multivariate combination of ALT, AST and GLDH, with and without miR-122, was analyzed using linear discriminant analysis for differentiating the positive and negative toxicity responses. The classification performance of these combinations was evaluated using 20 iterations of the 5-fold cross-validation procedure described above, and the resulting performance metrics were reported.
All analyses were carried out using the R programming language (R Core Team, 2012, http://www.R-project.org/).
Results
Tissue Distribution of miR-122
miR-122 has been reported to be liver specific in humans and rodents. 19 To confirm that miR-122 was abundantly and specifically expressed in the liver and that miR-122 changes in serum could indeed be attributed to liver injury, we measured miR-122 copy number in 25 rat tissues. Copy number per nanogram of total RNA was estimated using a standard curve of synthetic miR-122, and results for all tissues are presented in Table 1. The concentration of miR-122 in the liver was approximately 3 000 000 copies per nanogram of total RNA, which was 20 000–fold higher than the copy number in a 24-tissue RNA pool (excluding liver). Some levels of miR-122 were detected in blood, spleen, and thymus (919, 335, and 303 copies per nanogram of total RNA, respectively). The estimated concentration of miR-122 in heart and skeletal muscle (2 other tissues besides liver that express ALT and AST) was extremely low (6 and 15 copies per nanogram total RNA, respectively).
Distribution of Histopathologic Liver Findings
In total, liver sections from 263 animals, including 190 compound-treated and 73 control rats, were examined microscopically for the presence of 5 subtypes of hepatic injury. The distribution of the 5 subtypes of liver injury and severity grades are outlined in the Supplemental Table 1. Only 32 findings in 23 animals had a histopathologic severity grade ≥3 (moderate to marked). Among the 73 vehicle-treated controls, 58 did not have histopathologic abnormalities and therefore had an overall severity grade of 0; 14 animals had 1 subtype of liver findings with a severity grade of 1 (10 animals) or 2 (4 animals); and 1 animal had 2 findings, each graded 1.
According to the criteria for the positive and negative histopathologic liver response established for the current study, only 40 of 190 treated rats were positive (cumulative histopathology grades of 3–11), while the remaining 150 treated rats were negative (severity grades of 0–2) by histopathologic evaluation, with 96 of 150 having a cumulative grade of 0. All animals in the control group were negative by histopathologic evaluation (Supplemental Table 2).
Threshold Values, Sensitivity, and Specificity for miR-122, ALT, AST, and GLDH
Optimal threshold values for miR-122, ALT, AST, and GLDH were estimated as the mean fold change over vehicle control that significantly differentiates a positive response from a negative with a 95% confidence interval (Fig. 1). For miR-122, ALT, AST, and GLDH, the optimal thresholds were 12.43, 1.55, 1.25, and 6.87, respectively (Table 2). The threshold values selected for each enzyme were the values that gave the lowest number of false positives (high specificity and negative predictive value), a condition that sacrifices sensitivity for specificity. In the current model, the sensitivity of miR-122 was in line with that of the liver enzymes, with slightly lower values than AST (miR-122 = 56.1%, AST = 61.6%), while miR-122 was second in performance to GLDH in terms of specificity (miR-122 = 95.2%, GLDH = 97.0%), as shown in Table 2. In general, the positive and negative predictive values of miR-122 were not different from those of the liver enzymes, with ALT and AST tending to have lower positive predictive values than miR-122.
Test Performance for miR-122, ALT, AST, and GLDH in Detecting General Liver Toxicity in Rats.
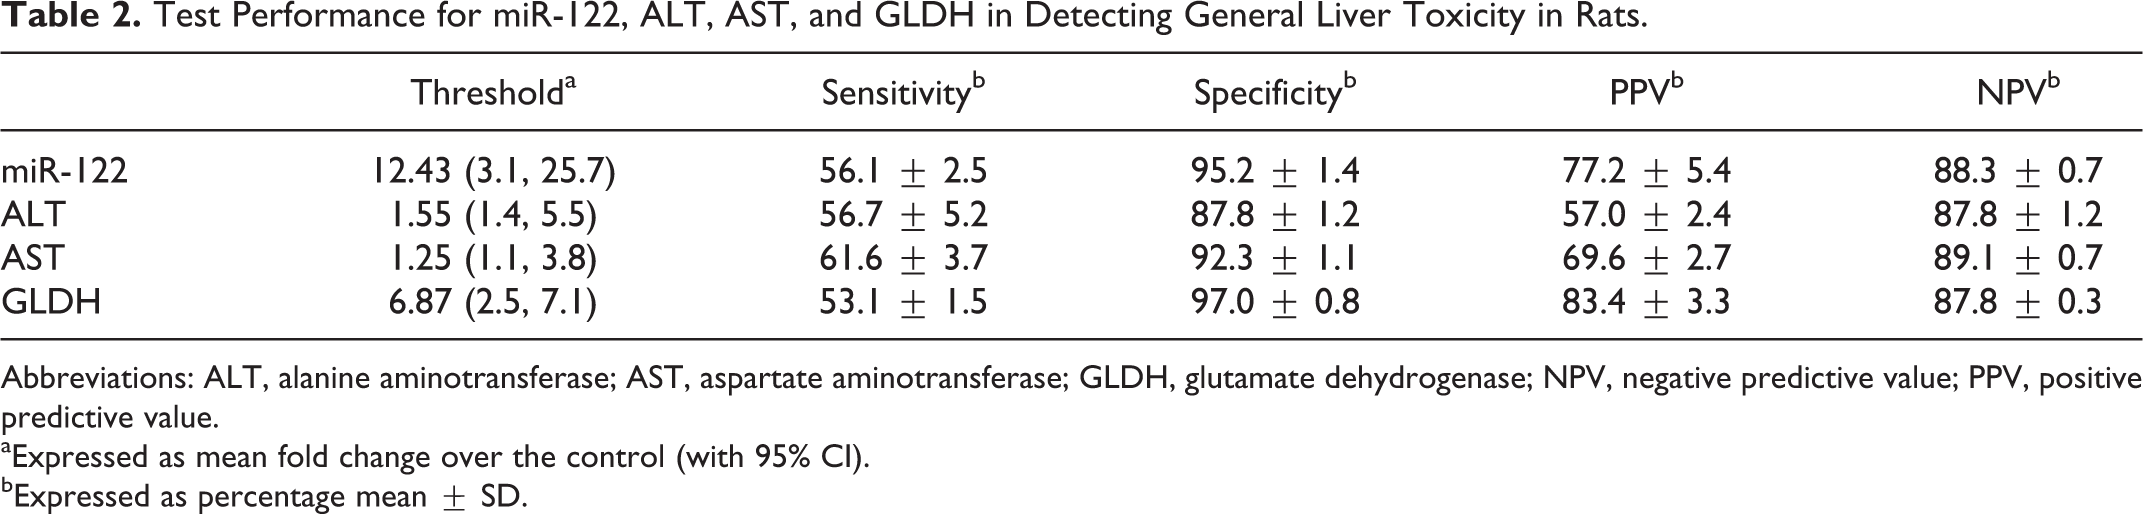
Abbreviations: ALT, alanine aminotransferase; AST, aspartate aminotransferase; GLDH, glutamate dehydrogenase; NPV, negative predictive value; PPV, positive predictive value.
aExpressed as mean fold change over the control (with 95% CI).
bExpressed as percentage mean ± SD.
Performance of miR-122, ALT, AST, and GLDH in the Assessment of General Liver Toxicity
The ROC curve analyses using the established histopathologic criteria for positive and negative responses (ie, cut-off value for a positive response ≥3) showed that in the current data set (n = 263 rats), miR-122 significantly outperformed ALT as a liver biomarker (AUC = 90.85 vs 82.29, P = .032). However, miR-122 performance was not significantly different from that of AST and GLDH (AUC = 90.85 vs 91.98 and 88.5, respectively, P > .05; Fig. 2).
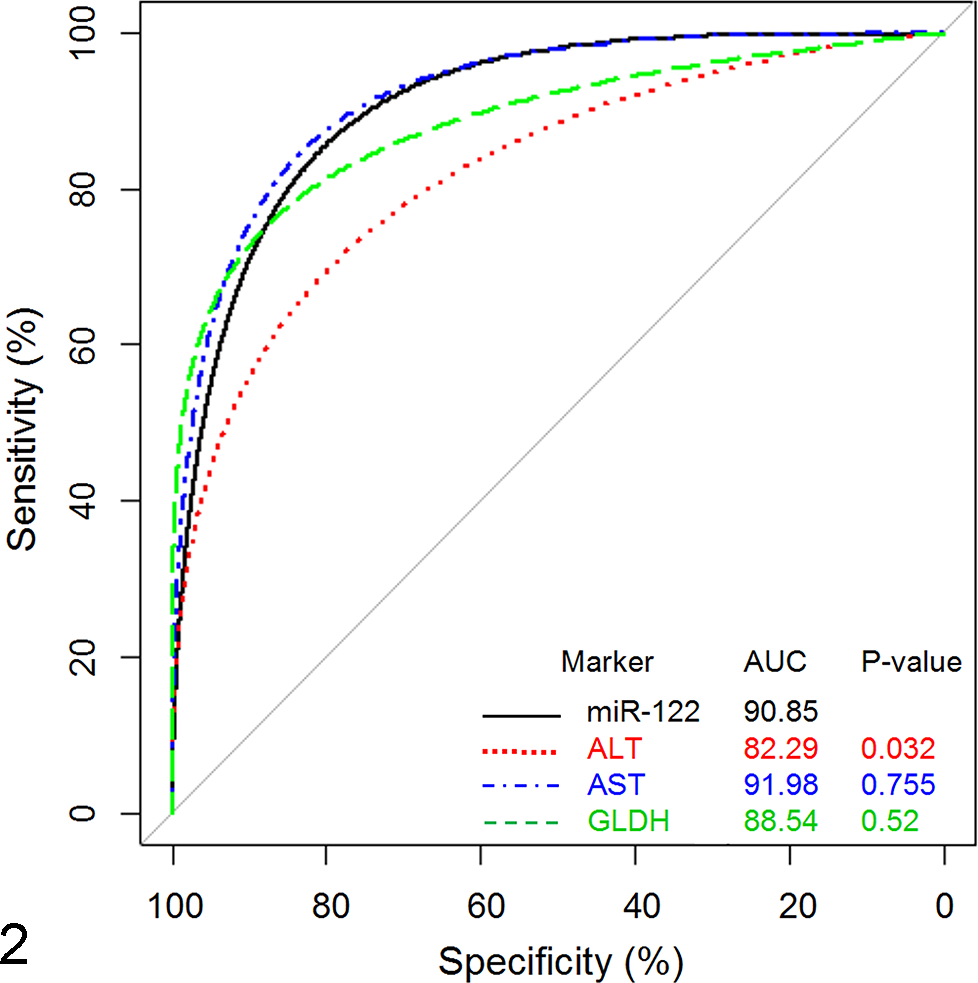
Performance of miR-122 as a biomarker of liver injury in comparison to alanine aminotransferase (ALT), aspartate aminotransferase (AST), and glutamate dehydrogenase (GLDH). Data are expressed as area under the curve (AUC), with P ≤ .05 being statistically significant. A response is defined by the cumulative histopathology grade, with grades 0–2 considered negative and grades ≥3 considered positive.
Assessment of the Additive Benefit of miR-122 to a Clinical Chemistry Panel of ALT, AST, and GLDH
The statistical assessment of whether miR-122 adds diagnostic value when evaluated with ALT, AST, and GLDH was performed using linear discriminant analysis and logistic regression. Figure 3 illustrates the separation of positive and negative responses for ALT, AST, and GLDH (left image) in comparison to ALT, AST, and GLDH with the addition of miR-122 (right image). The addition of miR-122 to the panel via linear discriminant analysis resulted in a modest gain in predictive value based on internal cross-validation, with diagnostic accuracy improving from 82% to 86%, which was statistically significant (P < .001).
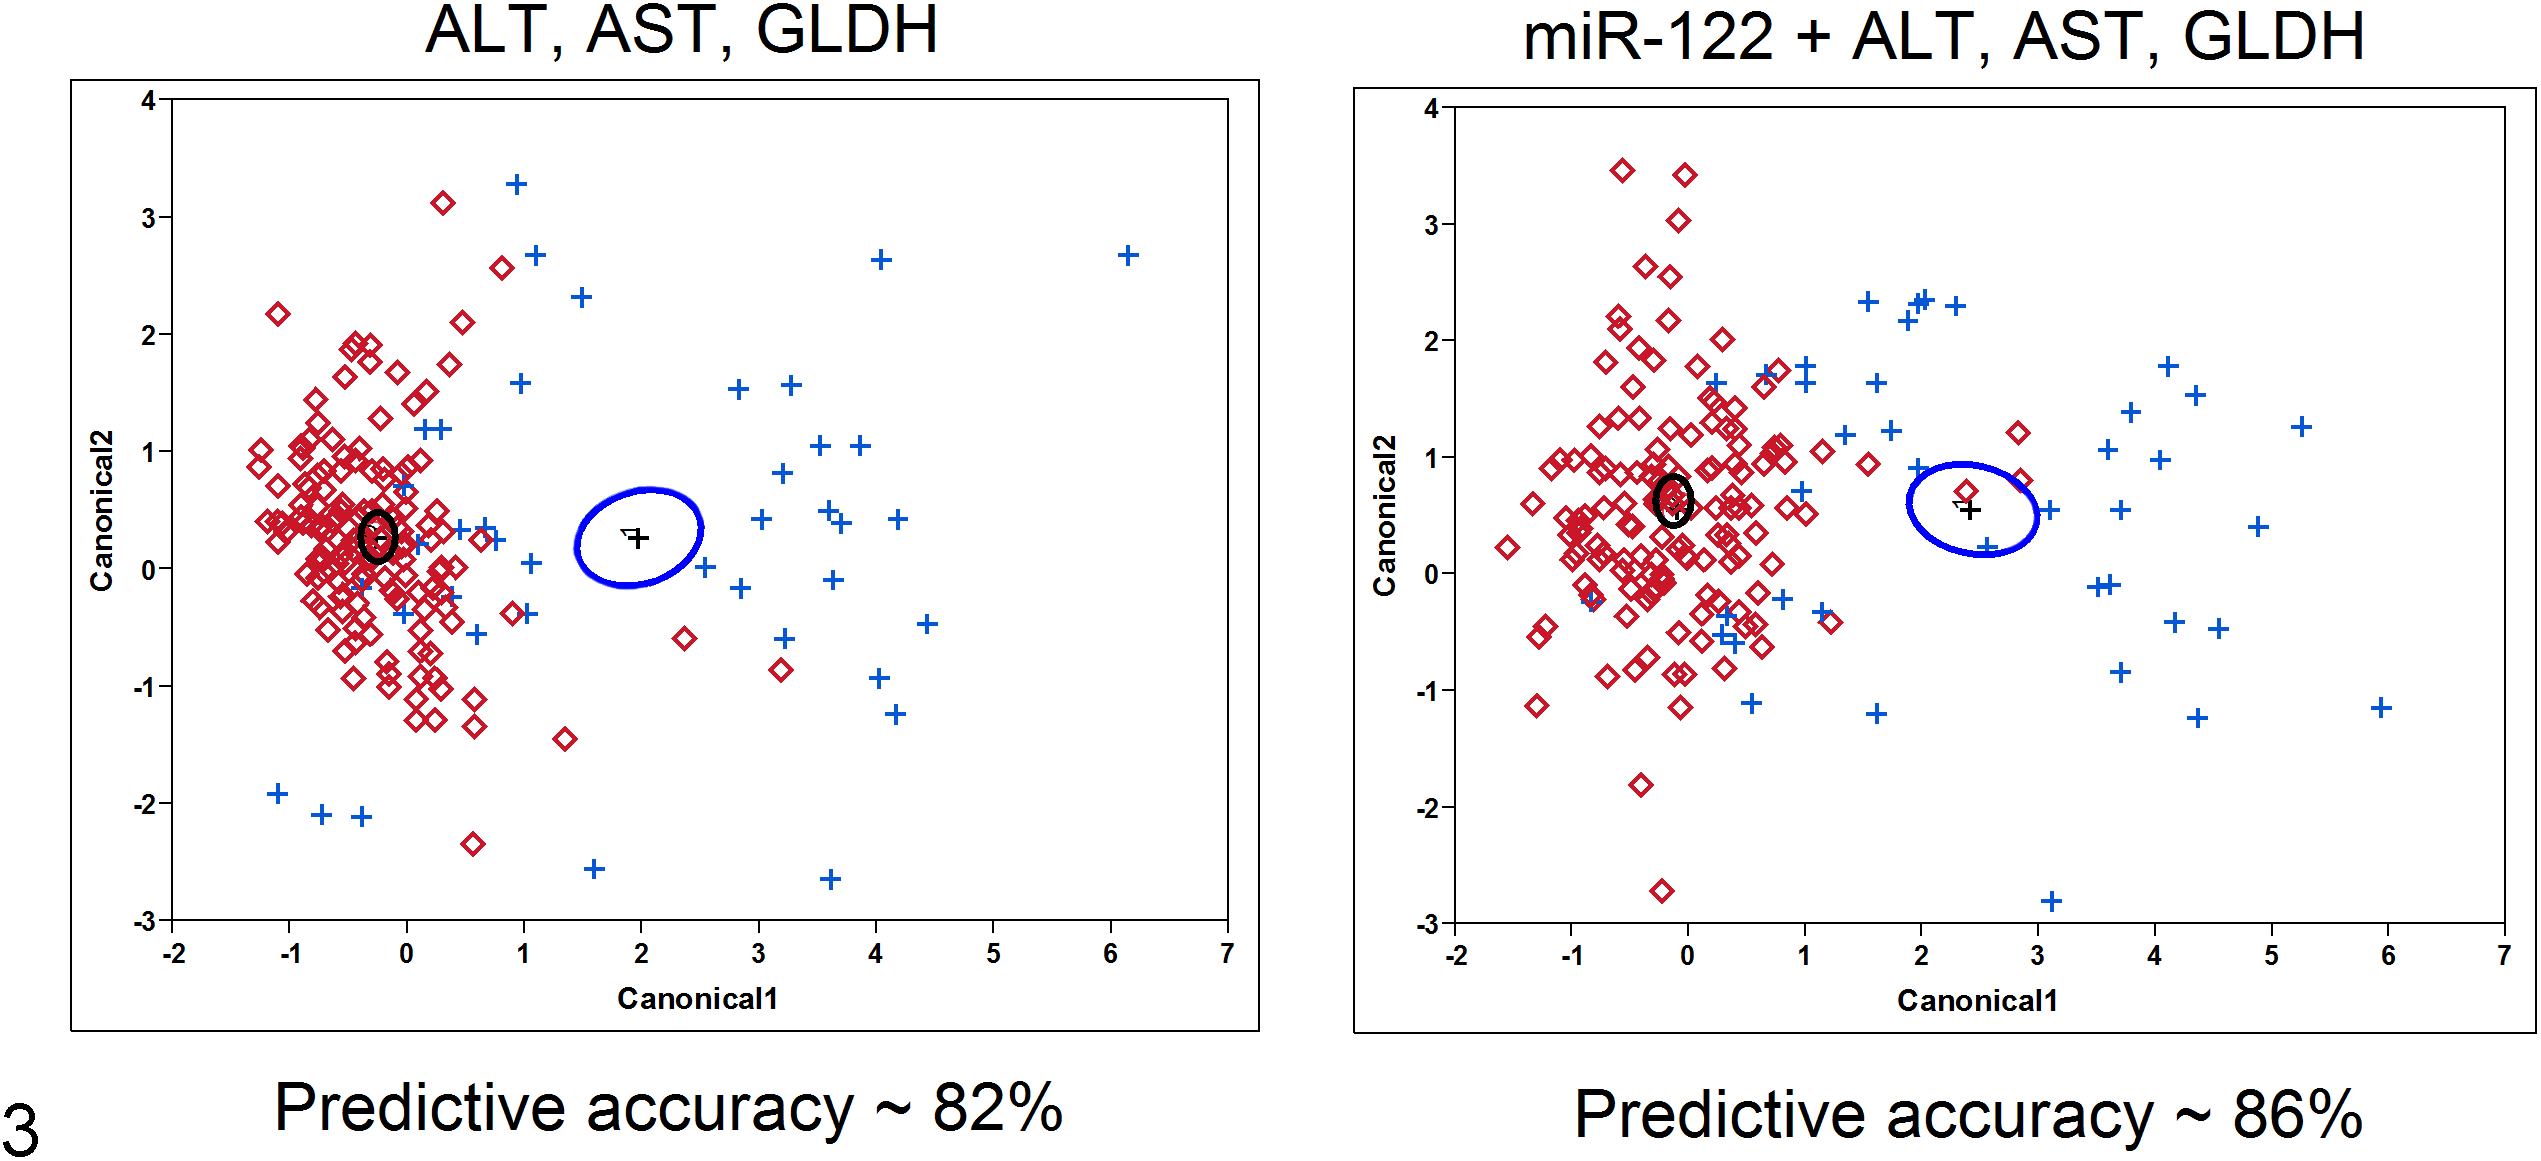
Two-dimensional representations of principal component analyses that visualize the maximal distance in statistical discrimination between positive (+) and negative (⋄) responses. The vertical and horizontal axes represent the first 2 principal components that are orthogonal linear combinations of the markers considered. The left panel is for alanine aminotransferase (ALT), aspartate aminotransferase (AST), and glutamate dehydrogenase (GLDH), and the right panel includes miR-122. The black and blue circles on each graph represent the 95% confidence limits around the mean centroids of the data for the negative and positive groups, respectively. The negative samples (red ⋄) that are closer to the centroid of the positive group (blue circle) are misclassified as positive; similarly, positive samples (blue +) that are closer to the centroid of the negative group (black circle) are misclassified as negative. The graph in the right panel shows relatively fewer misclassified samples as a result of including miR-122 in the biomarker combination.
Performance of miR-122 With or Without Normalization to miR-16
The serum levels of the housekeeping miR-16 were analyzed in parallel with miR-122 in the current sample set. Up to 10-fold increases in the serum levels of miR-16 were observed in several studies when compared to corresponding vehicle controls (data not shown). The ROC curve was generated against the histopathologic criteria previously described for Figure 1. Normalization of the qPCR data to miR-16 produced lower AUC than normalization to volume and spiked synthetic C. elegans controls (AUC = 86.00 vs 90.85), which was statistically significant (P = .007; Fig. 4).
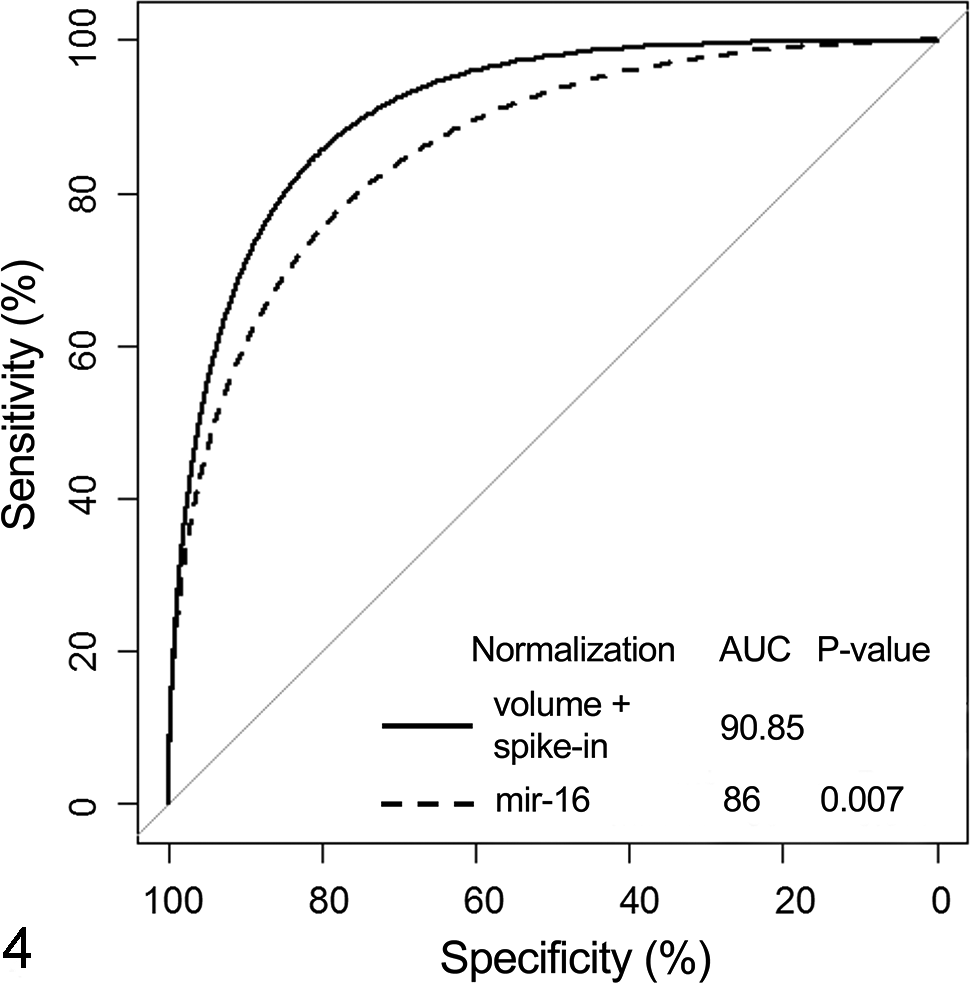
Performance of miR-122 with or without normalization to miR-16. Statistical assessment was performed using receiver operating characteristic curve analysis. Data are expressed as area under the curve (AUC), with P ≤ .05 being statistically significant.
Performance of miR-122 in Assessing Subtypes of Hepatic Injury
In the current study, the performance of miR-122 was also evaluated for each subtype of histopathologic change. In this analysis, the response was categorized as negative if the histopathologic grade was 0 or 1 and was regarded as positive if the grade was ≥2. It is important to note that in all cases classified as positive based on this criterion, other histopathologic changes were observed (data not shown). miR-122 produced the highest AUC for necrosis and/or single-cell necrosis and hepatocellular hypertrophy when compared to ALT, AST, and GLDH (Fig. 5). In contrast and as expected, miR-122 was poor in diagnosing biliary injury and inflammation. The performance of miR-122 in detection of vacuolization was similar to that of ALT and AST and slightly inferior to that of GLDH (Fig. 5).
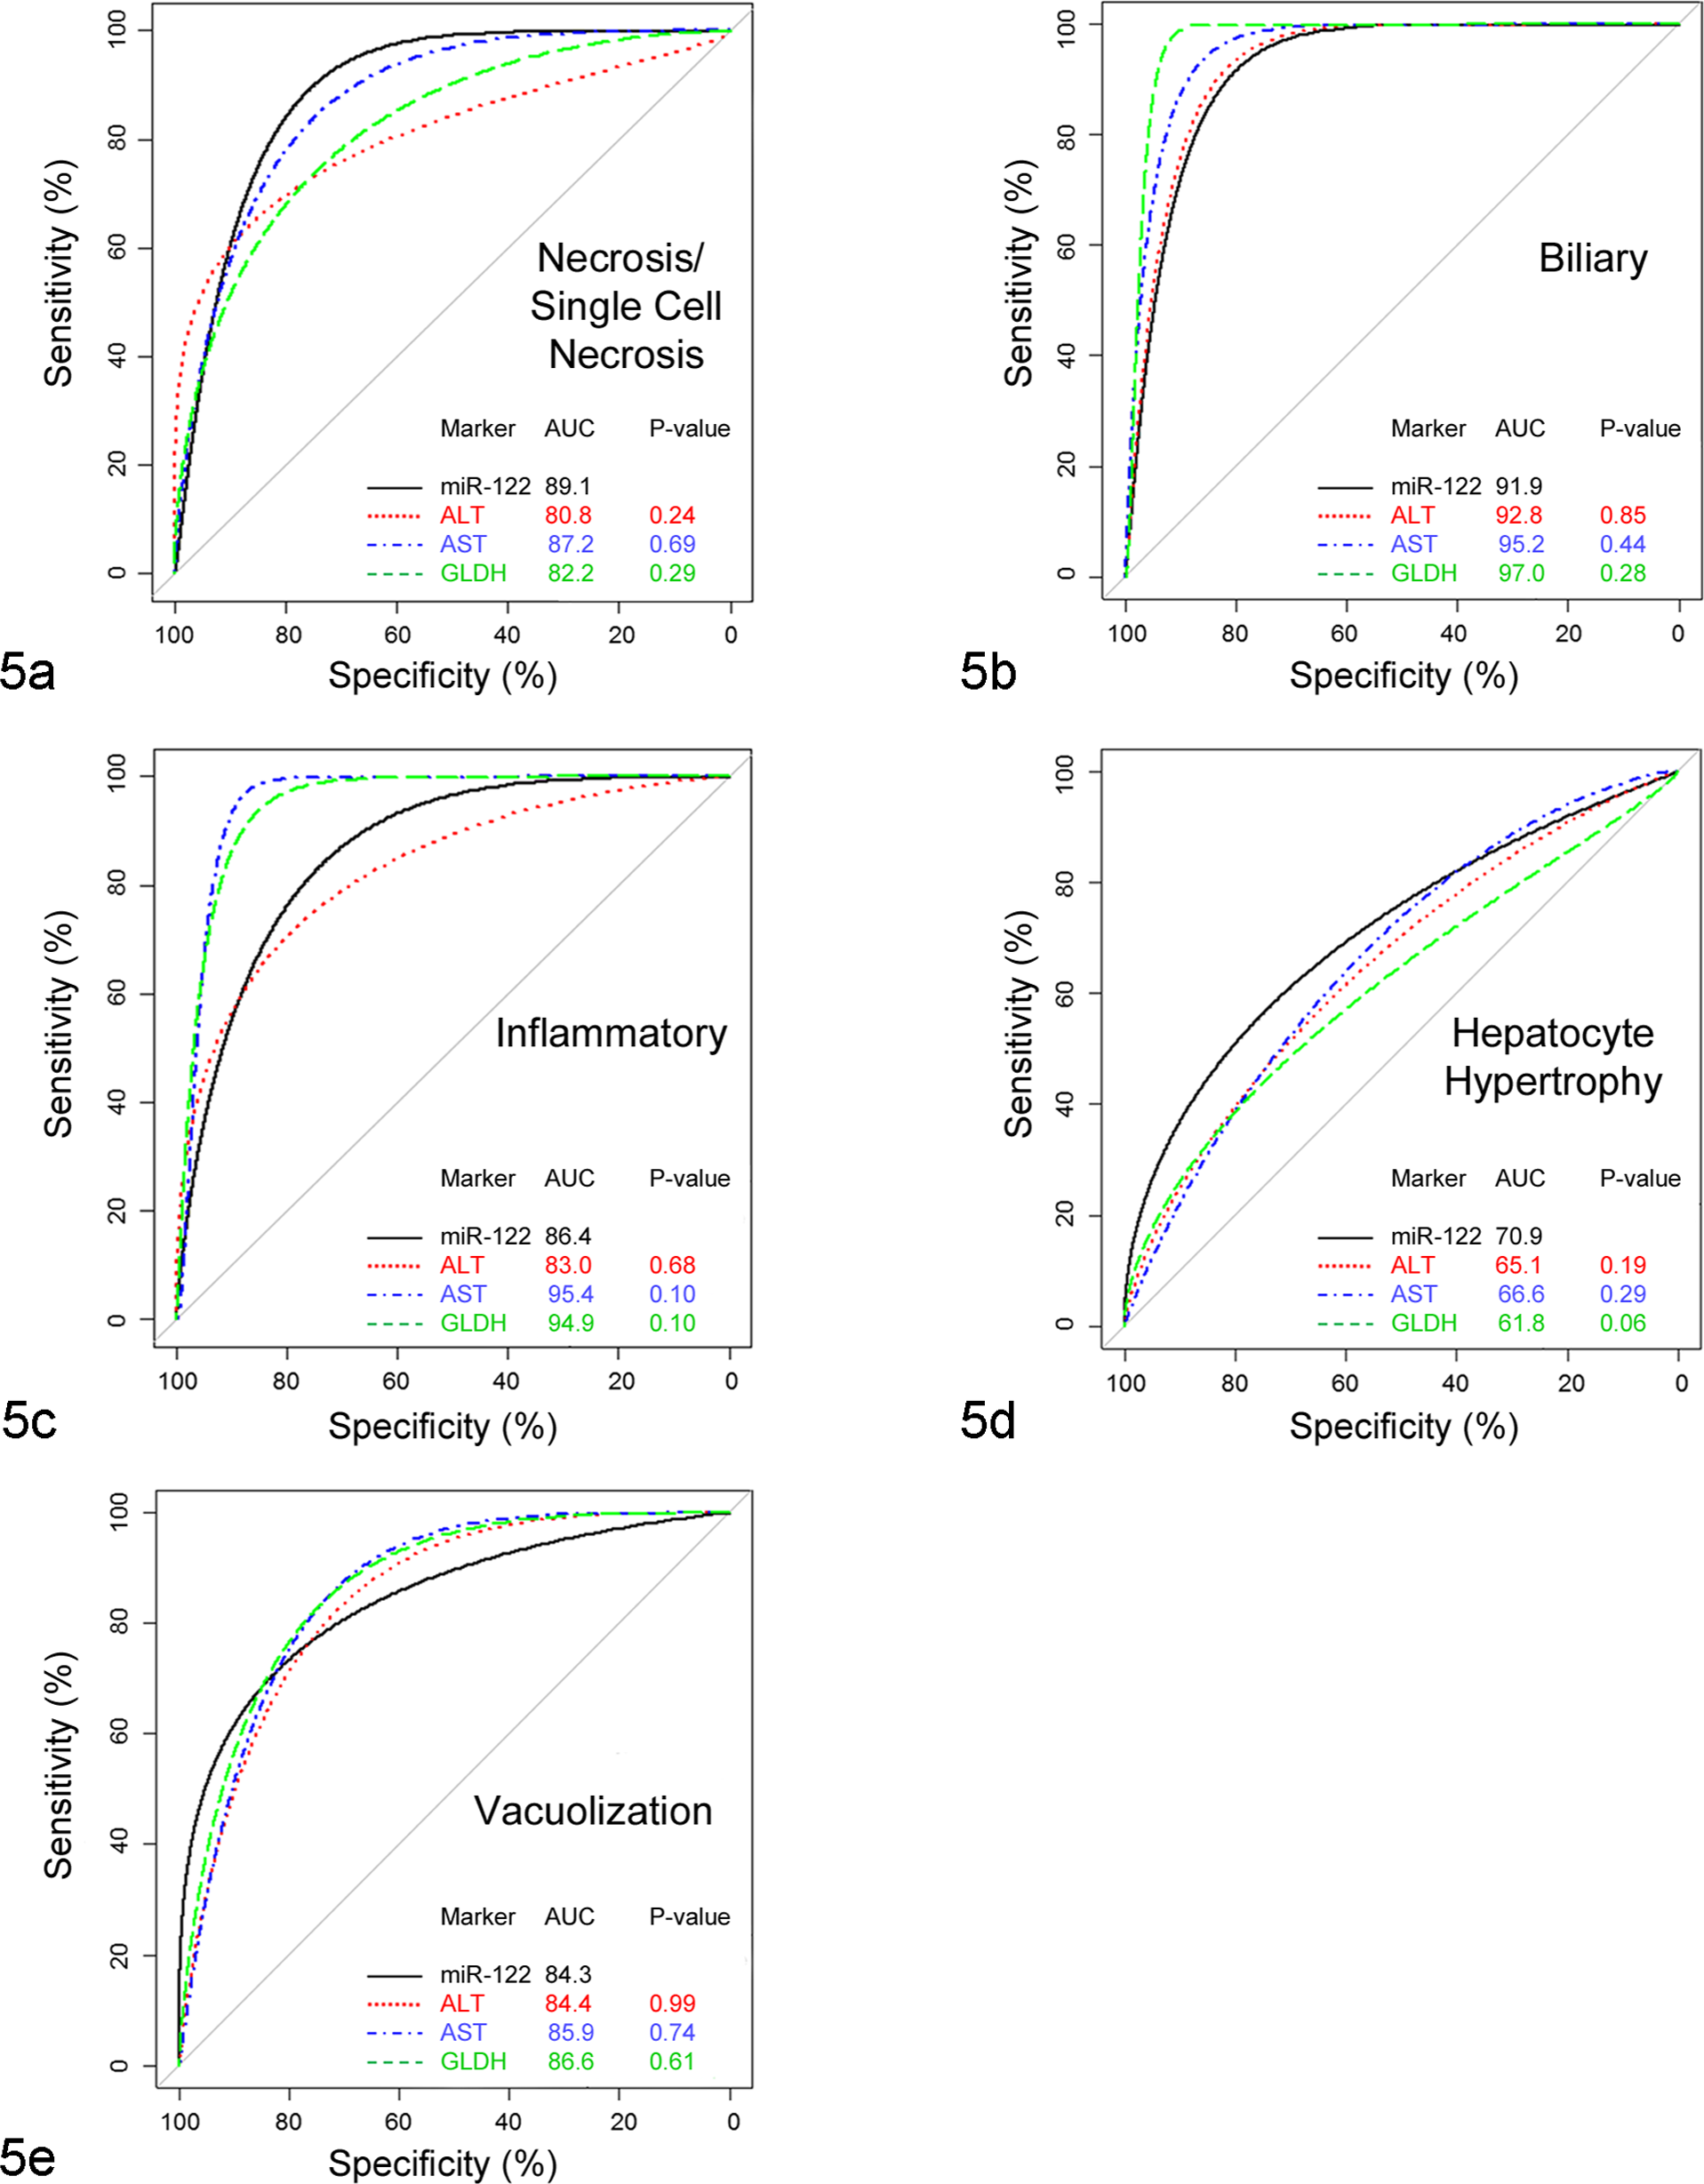
Performance of miR-122 in comparison to alanine aminotransferase (ALT), aspartate aminotransferase (AST), and glutamate dehydrogenase (GLDH) in different subtypes of liver histopathology. Data are expressed as area under the curve (AUC), with P ≤ .05 being statistically significant. In this assessment, histopathologic grade of 0–1 defined a negative liver response, while the grade of ≥2 was considered a positive response.
Discussion
The use of serum transaminases (ALT and AST) for the assessment of liver injury has been a routine practice for many years, and their enzymatic activities have served as reliable, well-characterized nonclinical and clinical biomarkers to date. Despite their general robustness, these biomarkers can still lead to mis- or underdiagnosis of liver injury. Notably, ALT and AST suffer in specificity, mostly because both enzymes are significantly expressed in other tissues, including: skeletal muscle (ALT/AST), adipose tissue (ALT), gastrointestinal tract (ALT and AST), heart (AST), and blood cells (AST). 7,42 Similar to previous reports, 24 the current study demonstrated that miR-122 has almost exclusive expression in liver. In the current data set, miR-122 level in whole blood (the second-most abundant miR-122 source) was 3000-fold lower than that in the liver. As previous work has not identified miR-122 expression in red or white blood cells or platelets, 4,8,29 and based on the low expression of miR-122 in bone marrow, it is likely that the miR-122 in whole blood originates from the liver.
Overall, miR-122 performed significantly better than ALT as a diagnostic biomarker of histopathologically defined liver injury using the current compound set and study conditions, which utilized the optimal threshold values empirically determined for each of the enzymes (Table 2). As would be predicted on the basis of tissue distribution, miR-122 had better specificity than ALT (95.2% vs 87.8%). This advantage is further supported by the finding that serum miR-122 was not changed following skeletal injury induced in rats by TMPD (2,3,5,6-tetramethyl-p-phenylenediamine) or HMGCoA (hydroxymethylglutaryl-CoA) reductase inhibitors. 24 Due to the lack of specificity to liver, elevation of serum transaminase levels can be caused by injury to other nonhepatic tissues, leading to false-positive signals for hepatotoxicity.
Drug-induced liver injury is the most common cause of drug withdrawals or black box warnings in the last 50 years. 11 Thus, the determination of whether increased liver transaminase levels are indicative of progressive liver failure or an adaptive response is critical but challenging. In general, the best evidence for cases of drug-induced hepatotoxicity leading to liver failure follows Hy’s law. This clinical guideline states that patients with an increase in transaminases (>3× upper limit of normal [ULN]) in combination with an increase in serum total bilirubin (>2× ULN) are especially at risk of developing drug-induced hepatotoxicity if no underlying causes are present. 25,31,34,37 In this regard, having additional mechanistically distinct biomarkers could help increase confidence in assessing risk. In the preclinical setting with laboratory animals that are inbred or purebred, it can be extremely difficult to clearly identify an early signal for hepatotoxicity that might translate clinically. An example in rodents is nicely illustrated with troglitazone, where hepatotoxicity was observed in genetically compromised Sod2+/− heterozygote mice but not in wild-type mice. 28 Despite adverse findings of coagulative necrosis in the Sod2+/− mice, ALT values were only 2-fold those of vehicle-treated paired controls at the highest dose of 30 mg/kg/d for 4 weeks. Furthermore, in clinical trials with troglitazone, only 2% of the patients had ALT elevations above 3× ULN, and <0.1% of patients had concomitant jaundice that would invoke Hy’s law. 40 Despite the absence of consistent ALT increase, there were 89 cases of liver failure and 65 deaths reported for troglitazone, highlighting the difficulty of assessing risk both preclinically and clinically. 13 Thus, additional biomarkers such as miR-122 could add confidence in assessing hepatotoxicity and are inherently valuable in potentially protecting the patient population.
One important aspect of assessing miR-122 for diagnostic purposes is to understand the response across a range of histopathologic liver injury subtypes, as well as to ensure sensitivity to detect subtle hepatic lesions. To date, the majority of studies focusing on miR-122 as a biomarker have utilized hepatotoxicants that cause severe lesions. 24,39,43 In contrast, one important aspect of the current study was to assess performance over a range of histopathologic changes and with histopathologic grades that were more subtle in nature. This approach aids in removing inherent biases in the data set and helps to ensure that the biomarker has adequate performance at lower ranges of injury that would be more typical of diagnostic use. Similarly, it was important to evaluate miR-122 with several diverse types of chemicals to ensure that performance is not limited to certain chemotypes.
Another way to evaluate the utility of a new biomarker is to determine if it brings additional value when quantified concomitantly with existing methods. The current study demonstrated modest but significant benefit of utilizing miR-122 in addition to the diagnostic panel of ALT, AST, and GLDH. Despite the additive value of miR-122, numerous aspects may limit the routine use of this biomarker. The time, cost, and effort to gain a ˜4% increase in predictive value are likely too steep for routine implementation beyond a specialized need.
Another potential useful feature of a biomarker for liver injury is the ability to asymmetrically identify types of hepatobiliary injury that are poorly identified by routine clinical pathology parameters. Notably, the current clinical chemistry panel of enzymes such as ALT/AST is not reliably sensitive for prediction of some hepatic subtypes of inflammatory and biliary injury. 19 Other enzymes—such as alkaline phosphatase, gamma glutamyl transferase, and total bilirubin—are used for specific injuries (eg, biliary toxicity), although they still suffer from obvious deficits, including a substantial lack of sensitivity. 9 For example, according to data from the DrugMatrix database, 12 none of the 50 rats with histopathologic evidence of compound-induced bile duct injury in short-term toxicity studies showed elevations of serum alkaline phosphatase above 2× ULN, while only 46% had evidence of increased total bilirubin above 2× ULN (unpublished internal analysis). Therefore, no attempts were made to compare the diagnostic performance of miR-122 against that of alkaline phosphatase, gamma glutamyl transferase, or bilirubin given the mild histopathologic changes observed in our sample population.
Based on the current results, miR-122 does not help in identification of such types of drug-induced liver injury as biliary injury or inflammation when compared to the current biomarkers. It is important to note that the current study was not statistically powered to derive a clear conclusion about absolute relevance to each subtype of liver injury, but the results are consistent with the known miR-122 hepatic distribution and biology. Hypertrophy, vacuolization, and necrosis/single cell necrosis affect hepatocytes and thus are end points typically associated with hepatocyte insult and leakage. Given that the liver expression of miR-122 is primarily limited to hepatocytes, along with published data indicating that the majority of miR-122 is present in the serum due to hepatocellular leakage, 15 it is mechanistically consistent that miR-122 is efficient in predicting hypertrophy, vacuolization, and necrosis/single-cell necrosis but may not be appropriate for adequately assessing biliary or inflammatory lesions. The latter 2 types of injury are mostly associated with nonparenchymal cell types, including cholangiocytes, resident macrophages (Kupffer cells and other inflammatory cells), or stellate cells, although they can lead to indirect damage to hepatocytes or other hepatic cell types.
As other miRNA biomarkers for different tissue injuries are developed, the potential to multiplex miR-122 as part of a miRNA toxicity panel could become attractive. Thus, the current experiments suggest that miR-122 is best utilized as a second-tier biomarker that can differentiate liver injury when the routine clinical chemistry panel is affected by conditions such as drug-induced changes in transaminase levels or nonspecific toxicity (ie, skeletal muscle) or when routine clinical chemistry data give equivocal results and improved sensitivity is needed.
Diagnostic miRNA biomarker profiling remains a relatively new technique, and many uncertainties remain regarding stability, isolation, and quantification. In the current study, we utilized various PCR-based approaches to aid in routine diagnostic evaluation of miR-122 and provide recommendations for technical reproducibility. First, regarding preanalytic variability, 1 key unknown was related to sample integrity during collection. The stability of miRNAs in serum meant that no significant protocol changes had to be implemented, and effects of exposure to RNases or loss of stability during necropsy were not apparent in the data set. The current serum samples included in the analysis spanned more than 4 years. Although the signal intensity of the miR-122 PCR slightly diminished with aged serum samples stored at –80°C (data not shown), the relative values of treated versus control remained consistent. Second, 200 μl of serum was sufficient for extraction and for multiple PCR reactions, but that amount could easily be reduced to 100 μl. Third, carrier RNA is often recommended for miRNA analysis to avoid loss of sample throughout the extraction process. In our experience, carrier RNA had a minimal effect but did increase the recovery of miR-122 (≤0.5–0.7 cycle threshold value improvement). Fourth, spike-in exogenous controls (ie, synthetic C elegans miRNAs) were used in the current study for data normalization. Cel-miR-39 and Cel-miR-54 performed adequately in this regard, and the mean cycle threshold value of both was used for normalization of the qPCR data. However, these proposed technical recommendations are not comprehensive, and as the diagnostic use of miRNA biomarkers becomes routine, it is likely that the precision and accuracy of the assays will continue to improve.
Normalization to a reference gene is a routine practice to control for sample variation when qPCR is used. The key requirement for an appropriate reference control is a consistent expression across all samples. 38 A commonly used housekeeping miRNA, miR-16, was analyzed in parallel with miR-122 in the current sample set. Modest elevations in miR-16 serum levels in treated animals were observed when compared to corresponding vehicle controls. This is consistent with literature reports demonstrating miR-16 increases in serum upon various tissue injuries. 27,30 It is plausible that nonspecific tissue injury leads to a reduced fold change of miR-122 when the data are normalized to an endogenous reference gene. Indeed, the ROC curve analysis revealed lower sensitivity and specificity of miR-122 when data were normalized to miR-16 vs absolute volume (adjusted for isolation variability using spiked C. elegans miRNAs; Fig. 4). Another question is whether data for miR-122 levels should be expressed either as absolute values (ie, copy number) or as relative fold change over vehicle controls. Although absolute quantification is attractive, several issues complicate the use at this time, including lack of appropriate standards, unknowns regarding sample stability, and technical reproducibility from run to run. As demonstrated in the current analysis, relative quantification yielded excellent performance but may make the establishment of normal reference ranges for miR-122 challenging.
In summary, miR-122 performed equivalently or better than the traditional hepatotoxicity biomarkers in acute and subacute rat toxicity studies for the sample set evaluated. Statistically, miR-122 slightly outperformed ALT but was not different in performance than AST and GLDH in detecting hepatotoxicity as determined by histopathology. A modest increase in predictive accuracy was demonstrated when miR-122 was added to a clinical chemistry panel of ALT, AST, and GLDH, mainly due to higher liver specificity and the increased sensitivity of the miR-122 assay over existing enzymatic assays. Taken together, the use of miR-122 as a biomarker of hepatocellular injury adds benefit in detecting hepatotoxicity in rats, and a miRNA PCR-based diagnostic assay could provide results similar to, or better than, the current standard clinical pathology enzymatic assays.
Footnotes
Acknowledgements
We thank Philippe Lesuisse and LeAnn Mitchell for conducting the in-life portion of the study, David Cugier for sample preparation, and Yi Yang for help with clinical chemistry data analysis. Portions of these data were presented at the annual meeting of the Society of Toxicology, March 2012.
Declaration of Conflicting Interests
The study was sponsored by AbbVie. AbbVie contributed to the design, analysis and interpretation of data, writing, reviewing, and approving the publication. T. Sharapova, V. Devanarayan, B. LeRoy, M. J. Liguori, E. Blomme, and W. Buck are employees of AbbVie. J. Maher is a former employee of AbbVie. J. Maher was involved in writing, data analysis and interpretation, reviewing, and approving of the publication. He is currently affiliated with Genentech Inc.
Funding
The author(s) received no financial support for the research, authorship, and/or publication of this article.