
Abstract
Immunohistochemistry-based biomarkers are commonly used to understand target inhibition in key cancer pathways in preclinical models and clinical studies. Automated slide-scanning and advanced high-throughput image analysis software technologies have evolved into a routine methodology for quantitative analysis of immunohistochemistry-based biomarkers. Alongside the traditional pathology H-score based on physical slides, the pathology world is welcoming digital pathology and advanced quantitative image analysis, which have enabled tissue- and cellular-level analysis. An automated workflow was implemented that includes automated staining, slide-scanning, and image analysis methodologies to explore biomarkers involved in 2 cancer targets: Aurora A and NEDD8-activating enzyme (NAE). The 2 workflows highlight the evolution of our immunohistochemistry laboratory and the different needs and requirements of each biological assay. Skin biopsies obtained from MLN8237 (Aurora A inhibitor) phase 1 clinical trials were evaluated for mitotic and apoptotic index, while mitotic index and defects in chromosome alignment and spindles were assessed in tumor biopsies to demonstrate Aurora A inhibition. Additionally, in both preclinical xenograft models and an acute myeloid leukemia phase 1 trial of the NAE inhibitor MLN4924, development of a novel image algorithm enabled measurement of downstream pathway modulation upon NAE inhibition. In the highlighted studies, developing a biomarker strategy based on automated image analysis solutions enabled project teams to confirm target and pathway inhibition and understand downstream outcomes of target inhibition with increased throughput and quantitative accuracy. These case studies demonstrate a strategy that combines a pathologist’s expertise with automated image analysis to support oncology drug discovery and development programs.
A fundamental challenge in drug discovery is finding the right drug for the right patient and understanding if it has affected the intended biological target. Biomarkers play a major role from early stages of drug discovery (eg, understanding mechanism of action, target inhibition, and terminal outcomes in preclinical models) to later stages of drug development (eg, understanding target inhibition in humans) in clinical studies. Biomarkers can be classified into different categories based on their functional use: pharmacodynamic (PD) biomarkers, predictive biomarkers, and prognostic biomarkers. Successful drug development requires a thorough understanding of the extent and consequences of drug-induced pathway inhibition through the use of multiple biomarker assays. These are typically developed in nonclinical models and extended to a clinical setting.
Immunohistochemistry (IHC) is a commonly used platform for biomarker detection. IHC provides the ability to assess biomarkers for abundance and localization; it also provides an ability to assess overall tissue morphology as well as cellular morphology. Operationally, IHC has the advantage of being a well-established methodology requiring a small quantity of patient tissue. IHC technologies, as well as automated slide-scanning and advanced high-throughput image analysis software technologies, have evolved into a routine process for morphometric analysis of IHC-based biomarkers.
The automation of IHC procedures and the development of image analysis algorithms have enabled quantitative analysis of biomarkers of interest. With continued advances in imaging technologies, including slide staining, slide scanning, and image analysis, IHC-based biomarker assays will transition from the traditional microscope-based H-score to more quantitative scoring based on the digital version of the slide versus the glass slide. The use of digital pathology by hospitals, research facilities, and industry is becoming more commonplace. There are many studies that examine the utility and barriers that may arise with digital pathology compared to traditional pathology reviews. A recent review by Ghaznavi et al discusses components of digital pathology and the use of whole-slide imaging (WSI) in various applications. 6 For example, WSI has been shown to be potentially well suited for use in routine prostate pathology scoring. 2 In breast cancer research, computerized image analyses and WSI are being used as tools for accurate and reproducible data scoring, and quantitative analysis has been compared to traditional manual scoring for well-established diagnostic IHC assays, such as hormone receptor expression (ER and PR) and HER2 detection in breast cancer. 9 Beck et al have described a new imaging analysis protocol termed “C-Path,” which extracts a set of morphologic features from images of breast carcinomas and identifies morphometric descriptors that associate with clinical outcome. 1
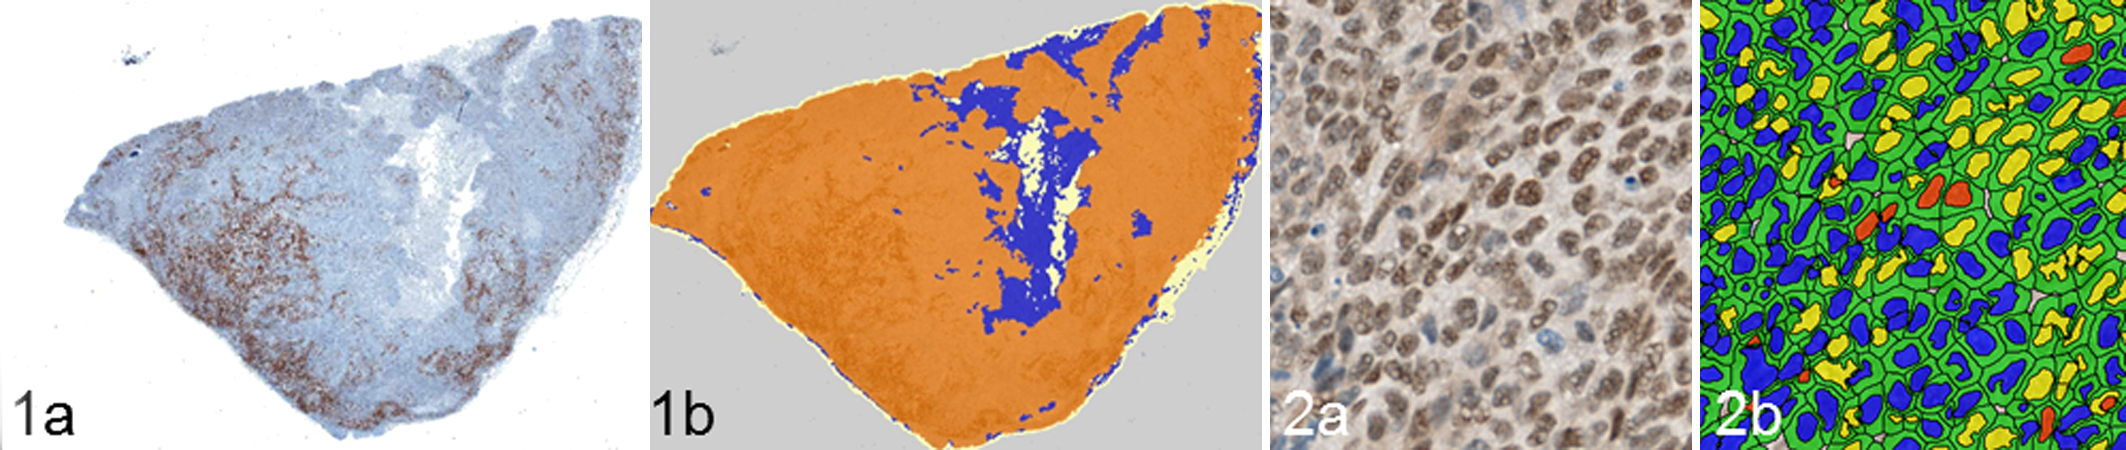
The pathologist plays a critical role in the development, validation, and execution of the “digital” biomarker assay and will often work side-by-side with an image analysis expert throughout the process. The image analysis method involves a number of steps, including identification of a sample, identification of the region of interest (ROI), and identification of cellular structures (Figs. 1, 2). The pathologist trains the software to recognize morphologic features of interest and performs the necessary quality control (QC) steps to verify proper tissue and cellular segmentation by the analysis algorithm.
In this article, different image analysis workflows are highlighted that require a combined contribution of the pathologist and automated image analysis routines to support oncology drug discovery and development programs. These examples involve a variety of digital pathology technologies and varying levels of support from the pathologist.
Highlighting Imaging Workflows With 2 Case Studies
Biomarker assay development in support of 2 programs at Takeda Pharmaceuticals International Co. are discussed in this article: MLN8237 (alisertib), an investigational Aurora A kinase inhibitor, and MLN4924, an investigational NEDD8-activating enzyme (NAE) inhibitor.
The first case study describes the combined use of semiautomated methodologies and manual scoring for PD evaluation of an Aurora A kinase inhibitor. Aurora A kinase is a mitotic serine / threonine kinase that plays a key role in normal progression of the cell cycle through mitosis. Inhibition of Aurora A leads to multiple outcomes, such as micronucleation, multinucleation, mitotic arrest, and defects in mitotic spindle assembly and chromosome alignment. 7 Terminal outcomes that have been prominently seen include apoptosis and senescence. 8,10 Alisertib (MLN8237) is an Aurora A kinase inhibitor being evaluated as an anticancer agent in multiple clinical trials (all solid tumors). In phase 1 testing, alisertib was given orally once daily for 7 days, followed by 14 days of rest in 21-day cycles. 3,4 To access mitotic arrest and spindle/chromosome defects, a pathologist-assisted semiautomated method for PD biomarker evaluation was used in skin and tumor biopsies from patients treated with MLN8237. The semiautomated methodology involved a pathologist training scientists and software to identify certain morphologic cell types.
The second case study describes how a quantitative IHC-based assay was developed for measuring NAE pathway inhibition in clinical bone marrow aspirate (BMA) samples from acute myeloid leukemia (AML) patients. The ubiquitin-proteasome system regulates turnover of short-lived intracellular proteins and plays an essential role in protein homeostasis. Proteins that are destined for degradation can become dysregulated in some cancer cells. Protein turnover is mediated by the ubiquitin-proteasome system signaling pathway and homologous pathways through a 3-step enzymatic process commonly referred to as E1 (ubiquitin-activation), E2 (ubiquitin-conjugation), and E3 (ubiquitin-ligation). Besides ubiquitin, other ubiquitin-like proteins, such as NEDD8, modify various substrates through the E1-E2-E3 enzyme cascade. 15 The NEDD8 conjugation pathway is initiated by NAE and is required for activity of cullin-RING ubiquitin ligases (CRLs). MLN4924, an NAE inhibitor currently in clinical development, regulates the NEDD8 conjugation pathway. When NAE is inhibited, levels of CRL substrates increase due to impaired ubiquitination and the subsequent block of proteasomal degradation. 16 CRL substrates can therefore serve as PD biomarkers of NAE pathway inhibition. Antitumor activity has been seen with MLN4924 in preclinical models, including AML, and MLN4924 is currently in phase 1 clinical development in hematologic malignancies.
Material and Methods
IHC Assays and Image Acquisition
Apoptotic Index (Hematoxylin and Eosin): Skin
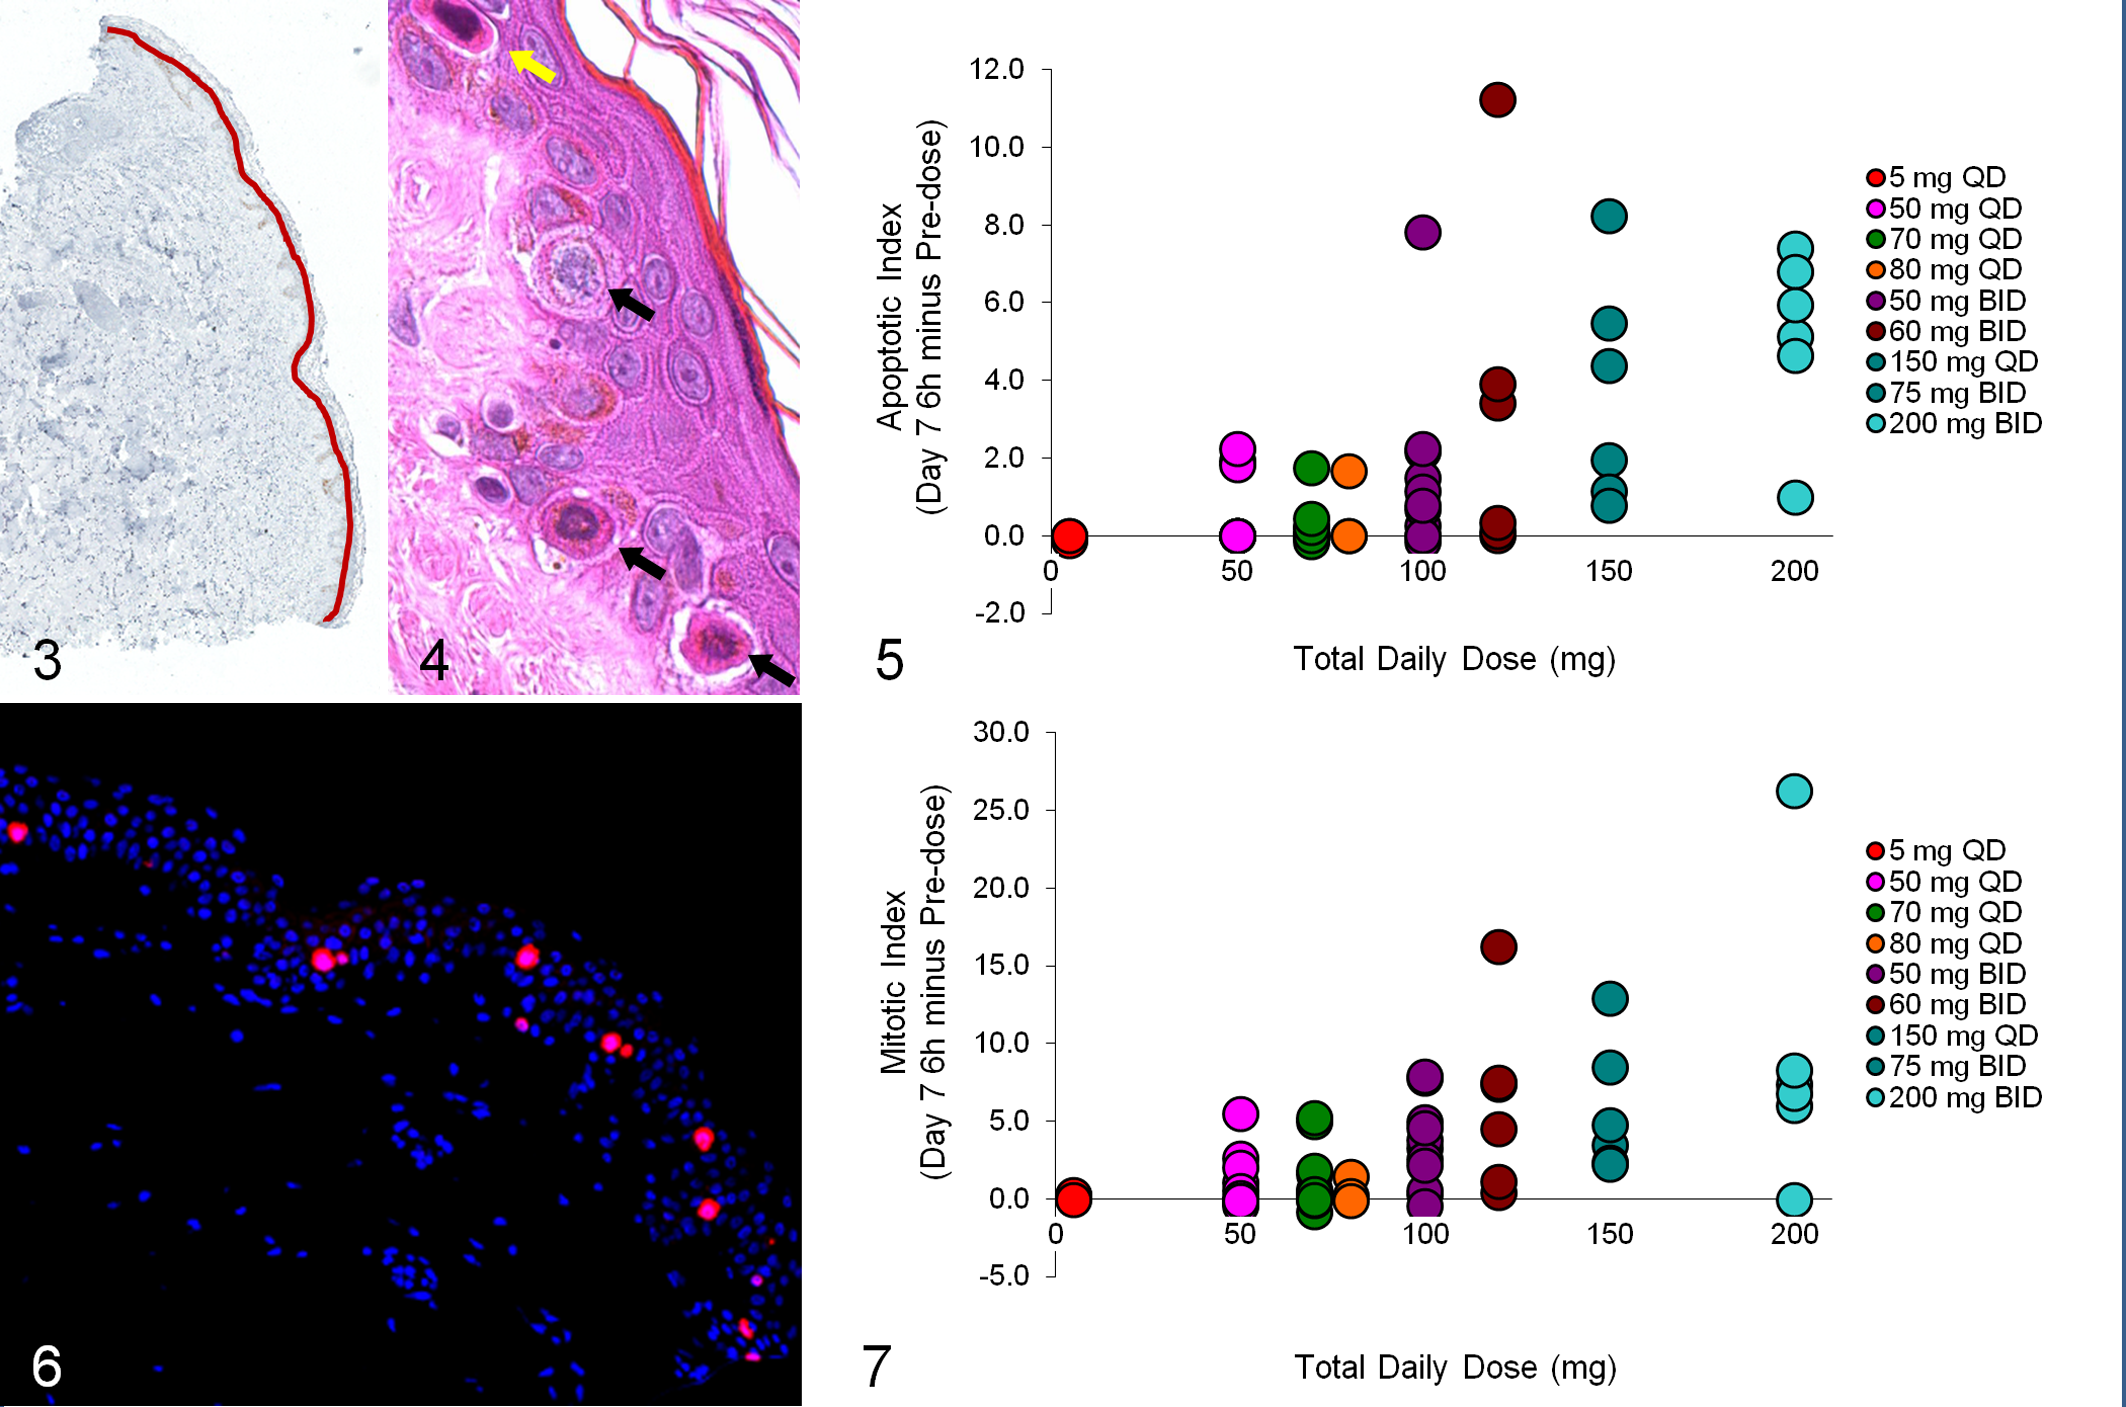
Skin biopsies (4 mm) were obtained from the upper back of the patients to assess inhibition of Aurora A kinase in basal epithelial cells (Figs. 3–7). Informed consent was obtained from each patient, and clinical site internal review boards approved all tests performed with these samples. All samples were fixed in 10% neutral buffered formalin before being dehydrated and paraffin embedded. For histopathologic evaluation, 5-μm sections of formalin-fixed, paraffin-embedded (FFPE) skin biopsies were stained by a standard method with hematoxylin and eosin (HE) with a Leica Autostainer XL (Leica Biosystems, GmbH, Wetzlar, Germany). HE-stained slides were histopathologically assessed for tissue quality and morphology by a board-certified pathologist. The HE-stained slides were used for counting the total number of preapoptotic and apoptotic cells in the epidermal skin layer. Preapoptotic cells had condensed chromatin and cytoplasmic eosinophilia, while apoptotic cells had condensed or fragmented nuclei also with cytoplasmic eosinophilia (Fig. 4). A 2× magnification image was captured with an automated Nikon E800 microscope (Nikon Instruments, Melville, NY) equipped with a filter wheel (Sutter Instruments, Novato, CA), XYZ stage (Prior Scientific, Rockland, MA), Orca ER CCD camera (Hamamatsu, Bridgewater, NJ), and an automated slide loader (Prior Scientific, Rockland, MA) controlled by MetaMorph software (Molecular Devices, Sunnyvale, CA). With MetaMorph software, the length of the skin epidermal layer (EL) was estimated by manually drawing the region throughout EL with a touch pen (Fig. 3). The apoptotic index was calculated by normalizing the total number of apoptotic cells to the millimeter length of the EL.
Mitotic Index (pH3/MPM2): Skin
Mitotic arrest was captured by measuring the accumulation of phospho-Histone H3 (pH3)– and MPM2 (mitotic protein 2)–positive cells in the EL of the skin (Fig. 6). Skin biopsies were immunolabeled with a dual immunofluorescent methodology with the Ventana Discovery XT autostainer (Ventana Medical Systems, Tucson, AZ). After sections were deparaffinized with EZ PrepTM solution (Ventana Medical Systems), antigen retrieval was completed with Cell Conditioning 1 solution (Ventana Medical Systems). Sections were immunolabeled with mouse anti-phospho-Ser/Thr-Pro MPM-2 antibody (Millipore, Billerica, MA) and rabbit anti-pH3 polyclonal antibody (Millipore, Billerica, MA). The ARK Peroxidase method (Animal Research Kit; Dako North America, Inc, Carpinteria, CA) was used to prepare a working dilution of the MPM-2 antibody. MPM2 was detected with Alexa Fluor 488-conjugated Streptavidin (Molecular Probes, Grand Island, NY), and Rhodamine-Red-X-AffiniPure goat anti-rabbit IgG (Jackson Immunoresearch, West Grove, PA) was used as the secondary antibody to detect pH3. Slides were stained with 0.5% Sudan Black B (Sigma Aldrich, St Louis, MO) to reduce tissue autofluorescence and were mounted with DAPI Vectashield Hard Set Mounting Medium (Vector Laboratories, Burlingame, CA). The number of mitotic cells within the EL was counted manually in a blinded fashion. The length of the EL was determined as described in the above apoptotic index (skin) section. The skin mitotic index was calculated by determining the number of mitotic cells (positive for both pH3 and MPM2) per millimeter length of the EL.
Mitotic Index (pH3/Ki67): Tumor
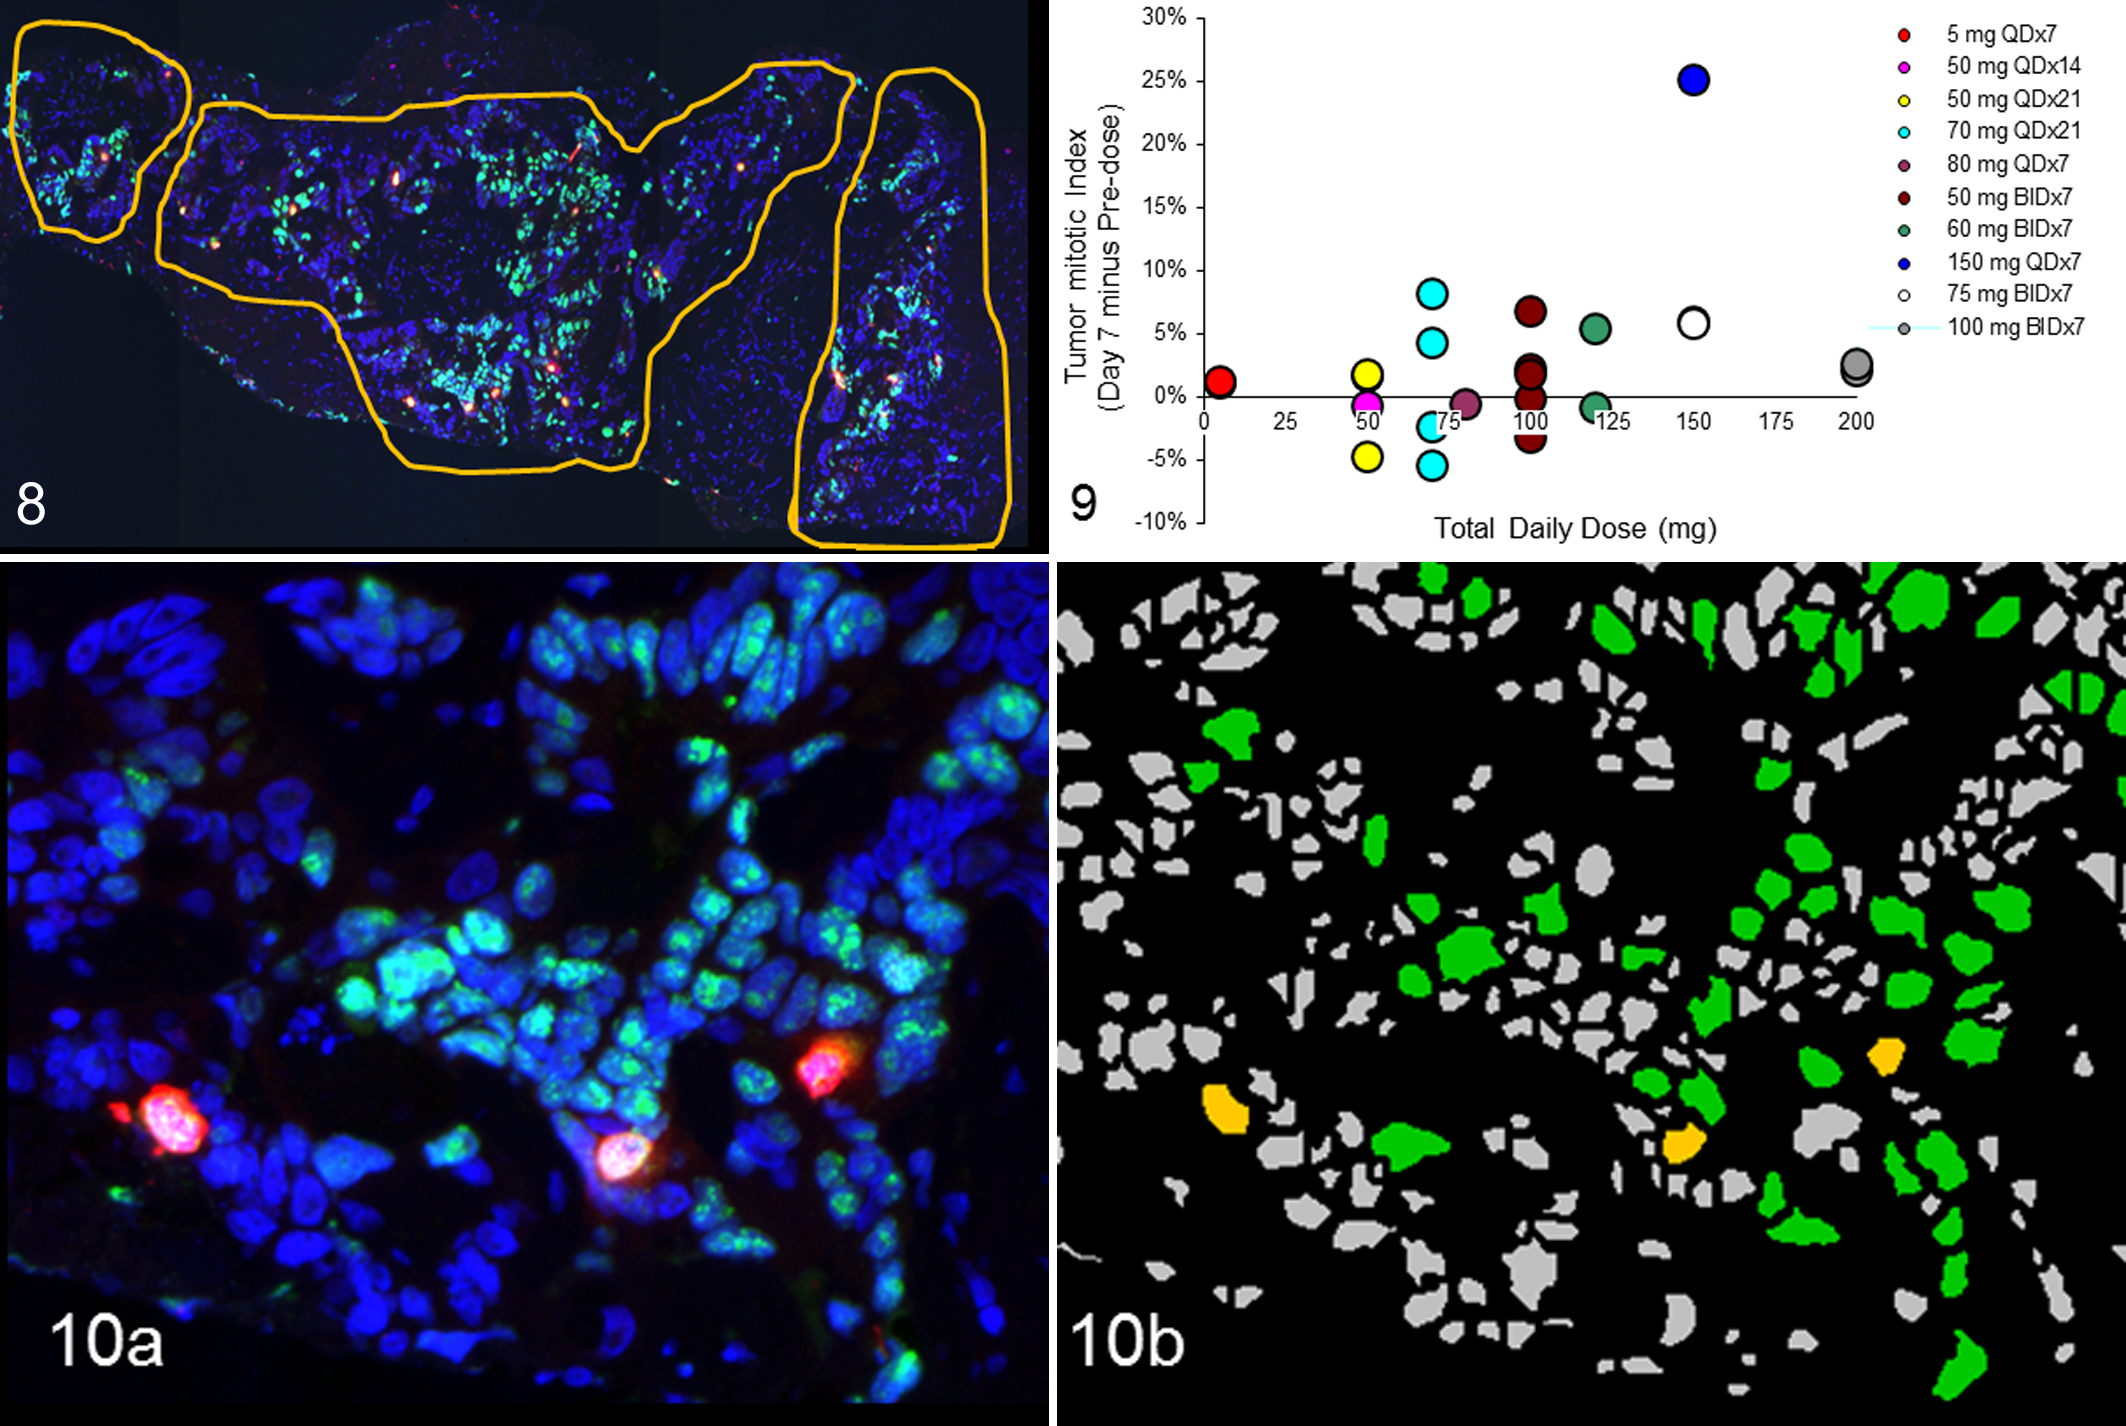
From each FFPE sample, 20 sections of 5-μm thickness were obtained and assessed by a pathologist for percentage of tumor based on HE (1st and 20th slides) (Figs. 8–10). If tumor tissue was not present in first 20 sections, the FFPE block was subjected to further sectioning (21–40). Subsequent slides were chosen for Ki67 IHC to confirm the presence of tumor and immunoreactivity of the tissue. For example, if adequate amount of tumor was observed in the 1st and 20th HE slide, the most proximal serial section (ie, the 2nd and 19th) was selected for Ki67 IHC. In-between slides (ie, 3rd–18th slides) were selected for mitotic index evaluation. Slides were deparaffinized and hydrated; antigen retrieval was performed with 0.01M citrate buffer solution (pH 6.0) with a pressure cooker as a heating source. Slides were immunolabeled with dual immunofluorescent methodology with mouse anti-Ki67, K-2 mouse monoclonal antibody (Ventana Medical Systems), and rabbit anti-phospho-histone H3 polyclonal antibody (Millipore). Secondary antibodies included Alexa-488 goat anti-mouse (Molecular Probes) for Ki67 detection and Rhodamine-Red-X-AffiniPure goat anti-rabbit IgG (Jackson Immunoresearch) for pH3 detection. Slides were mounted with DAPI Vectashield Hard Set Mounting Medium (Vector Laboratories). Whole-slide scans were acquired with a 10× objective using an automated Nikon microscope, as described in apoptotic index (skin) section. With MetaMorph software, the ROI was manually drawn based on the Ki67-positive cells as well as on the cell morphology determined from the DAPI staining (Fig. 8). Ki67 was used to define proliferative region of the tumor for assessment of pH3 expression. Mitotic index was determined as the percentage of pH3-immunopositive cells per Ki67-positive area according to MetaMorph software (Fig. 10a, b).
Spindle Bipolarity / Chromosome Alignment (Alpha Tubulin / DAPI)
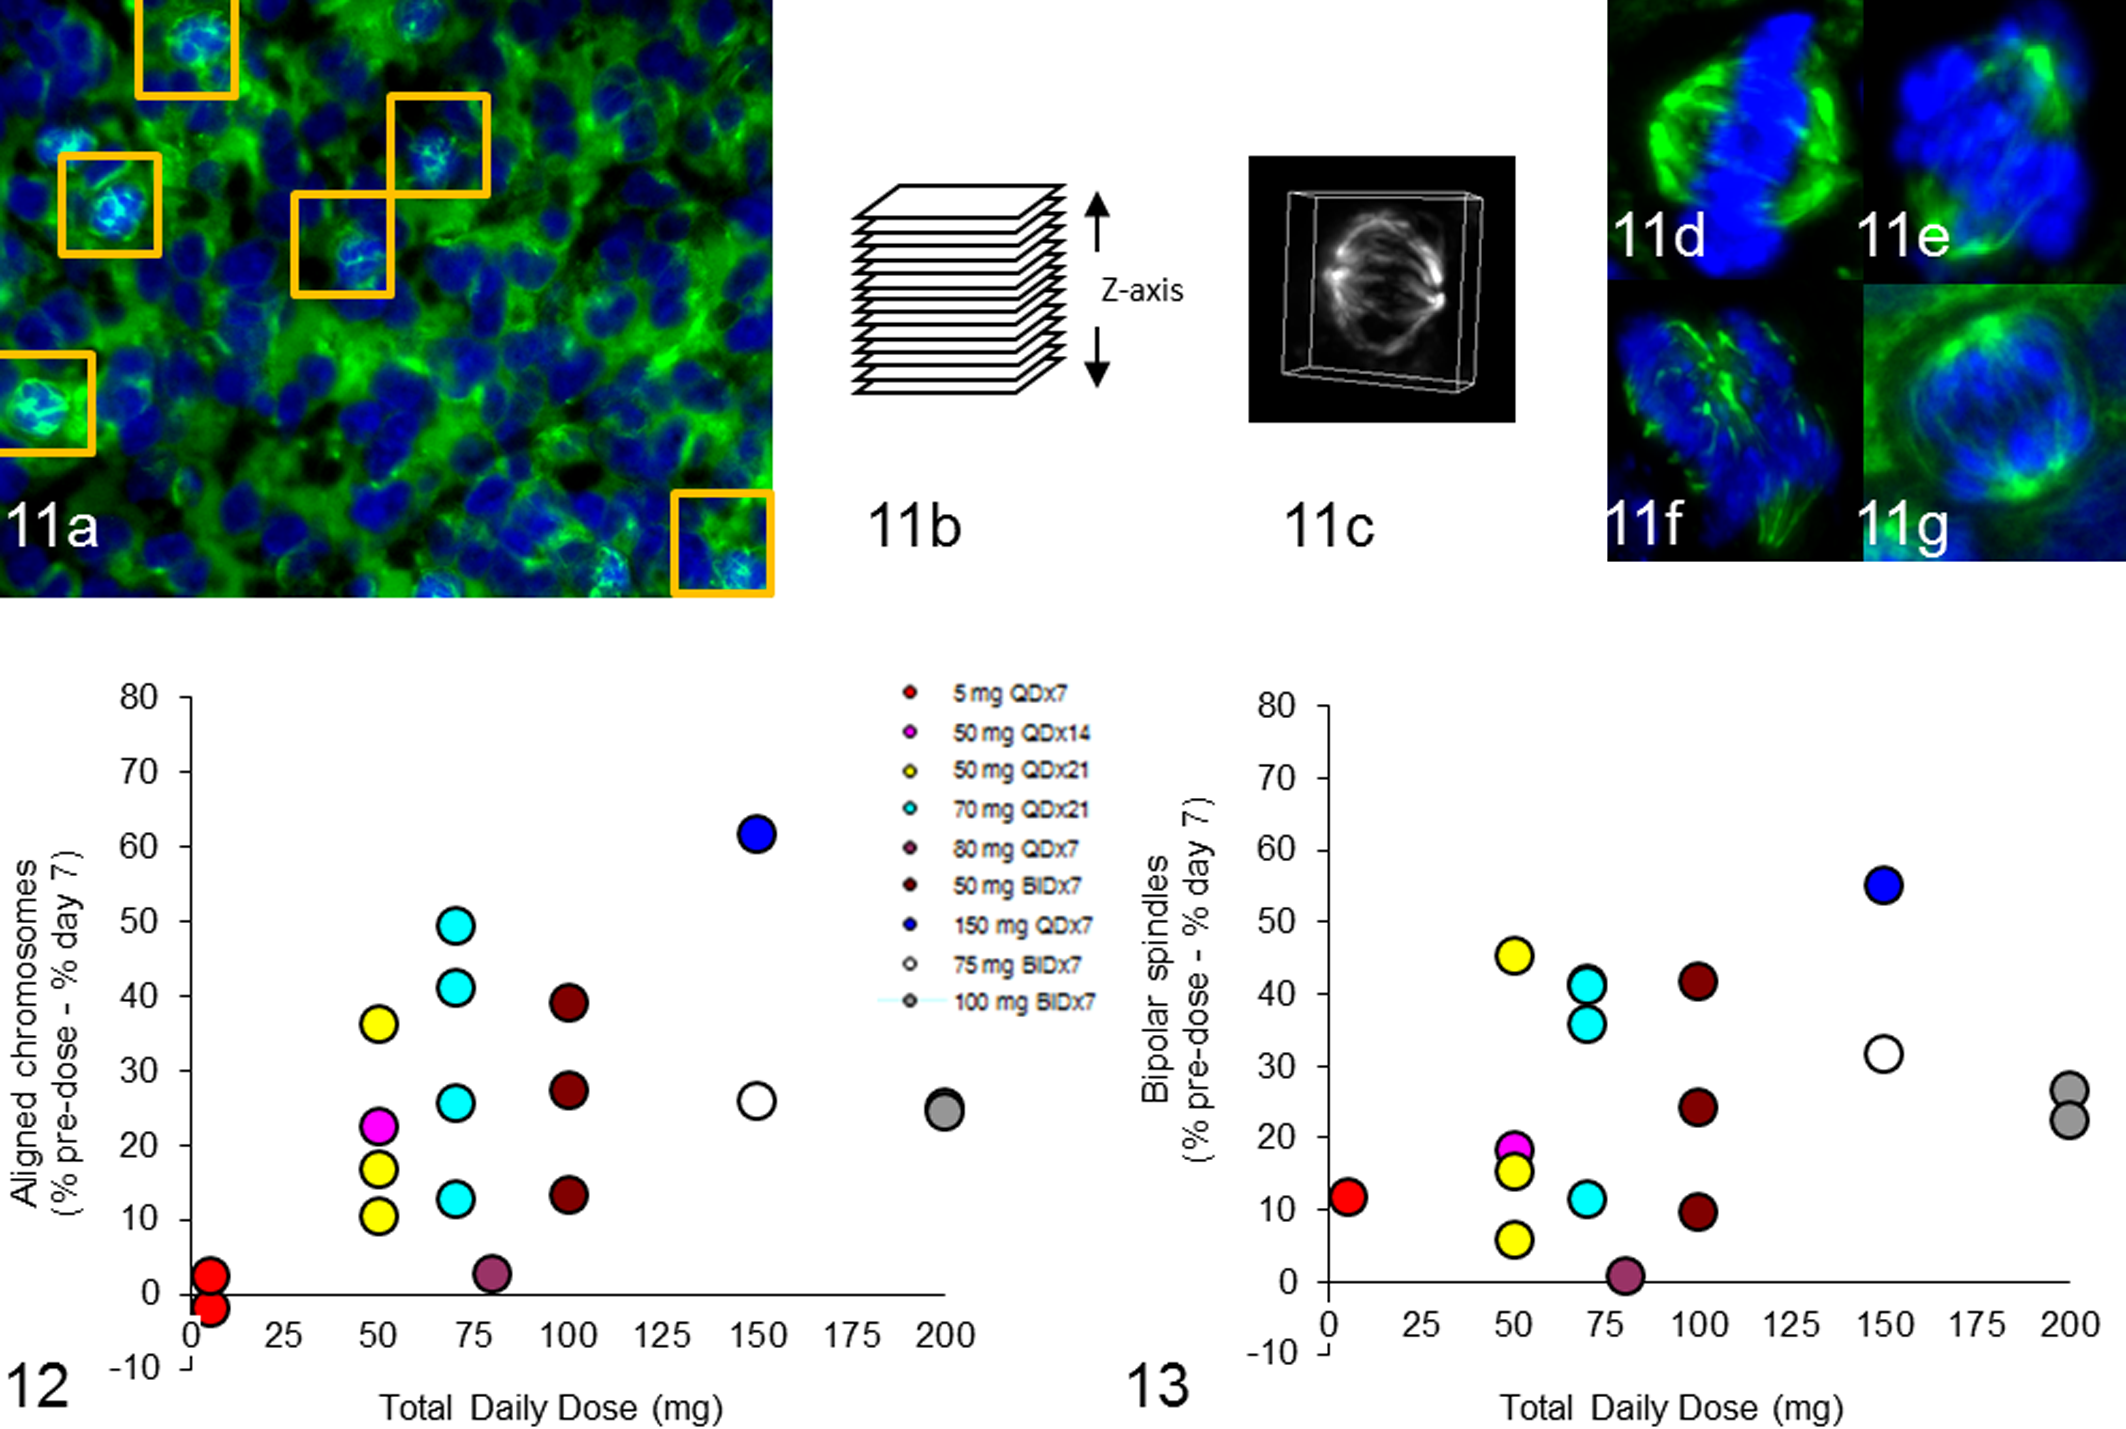
FFPE tumor biopsies were sectioned at 5 μm, and antigen retrieval was performed as described above (Figs. 11–13). Sections with tumor were selected for immunofluorescent labeling according to mouse anti-human alpha tubulin clone DM1A antibody conjugated to FITC (Sigma) to detect mitotic spindles. DNA was counterstained with DAPI mount (Vector Labs). MetaMorph software was used to identify mitotic cells based on the condensed DNA morphology with alpha tubulin immunolabeling, and a ROI was drawn to separate individual mitotic cells. Multiple slides were stained with alpha tubulin until 30 to 40 mitotic cells were identified for each tumor biopsy (Fig. 11a). Multiple–focal plane images (26 focal planes spaced at 0.2 μm) of mitotic cells were acquired with an automated Nikon E800 microscope with a 40× PlanApo objective (Fig. 11b). Image stacks were processed with AutoQuant deblurring software (Media Cybernetics, Rockville, MD) to remove out-of-focus light, and 3-dimensional reconstructions of the cells were generated with MetaMorph software (Fig. 11c). Criteria for identifying spindle defects and misaligned chromosomes were established based on a subset of images. 14 Mitotic cells were presented in 3-dimensional format in a randomized, blinded manner to 5 scorers to characterize chromosome alignment (aligned vs not aligned) and spindle bipolarity (bipolar vs not bipolar) according to preestablished criteria (Fig. 11d–g). Majority calls from different scorers were included, while no majority calls were excluded from the analysis.
CDT1 Assay on Cell Line Cultures and Xenografts
For the PD xenograft study, CB.17 SCID mice bearing THP-1 xenografts were administered a single 90-mg/kg dose of MLN4924, and tumors were excised and collected at 0.5, 1, 2, 4, 8, and 24 hours postdose and measured for chromatin licensing and DNA replication factor 1 (CDT1) antigen levels by IHC. For cell line controls and xenograft samples, CDT1 IHC was performed on 5-μm FFPE tumor sections with the Ventana Discovery XT autostainer. CDT1 antibody (Takeda Pharmaceuticals International Co.) was detected with the UltraMap anti-mouse horseradish peroxidase multimer secondary antibody (Ventana Medical Systems) and detected with the ChromoMap DAB Kit (Ventana Medical Systems), followed by hematoxylin and bluing reagent (Ventana Medical Systems) counterstain. Images were captured at 20× magnification with the ScanScope XT (Aperio Technologies, Vista, CA) WSI system.
QC samples were generated from HCT-116 cell line cultures that had been treated with DMSO or 4 concentrations of MLN4924, ranging from 30nM to 1000nM. CDT1 IHC assay was performed on QC samples and evaluated with each IHC run to measure technical variability and to establish acceptance criteria for each experimental IHC run. The QC controls were assayed multiple times to generate an expected range as a percentage-positive area above a threshold of DAB intensity for each concentration of MLN4924. The MLN4924-treated control samples were included in every IHC experiment for both xenograft and clinical samples to establish an assay pass/fail metric. For xenograft samples, the controls were immunolabeled with the single CDT1 IHC assay, while for clinical samples the CDT1/CD34/CD117 dual IHC assay was performed on controls. In cases of assay failure, IHC was repeated.
CDT1/CD34/CD117 Dual IHC BMAs
BMA clots were obtained from a phase 1 clinical trial. The patient population consisted of adults aged ≥ 18 years diagnosed with AML or high-grade myelodysplastic syndrome who were not eligible for potentially curative therapy. Patients were treated with MLN4924 on days 1, 3, and 5 of the 21-day cycles. Pre- and postdose BMAs were required for study enrollment. Individual BMAs were collected at screening and 3-6 hours after the third dose of MLN4924, placed into 10% NBF, and processed to FFPE blocks before IHC analysis. For each BMA clot, 20 serial sections of 5-μm thickness were initially sectioned, and an HE stain was performed on sections 1 and 20. All HE slides were assessed by a pathologist for tumor burden and tissue biopsy quality. If tumor burden was deemed low by the pathologist, another 10 sections were sectioned from the block, and an additional HE evaluation was completed. The process was repeated until the tumor burden was adequate or the pathologist felt that the tumor burden would not increase further into the block. Six serial sections were stained with a cocktail of rabbit monoclonal antibodies to CD34 and CD117 and detected with an horseradish peroxidase polymer secondary (Ventana Medical Systems). Studies have shown that AML cases express different levels of CD34 and CD117; therefore, a cocktail of both antibodies was used to detect AML cells. 13 Mouse monoclonal antibody to CDT1 (Takeda Pharmaceuticals International Co.) was detected with alkaline phosphatase polymer secondary (Ventana Medical Systems). CDT1 was detected with ChromoMap Blue, and CD34/CD117 cocktail was detected with ChromoMap DAB Kit (Ventana Medical Systems), followed by hematoxylin and bluing reagent (Ventana Medical Systems) counterstain.
Image Analysis
Pathologist-Assisted Scoring Based on MetaMorph
A combination of automated and manual methods were developed with MetaMorph software (Molecular Devices) for assisted histopathology review of human skin and tumor tissue biopsies. These methods were developed to provide images from HE and immunofluorescent sections to facilitate visual analysis and scoring of pharmacologically induced tissue defects in mitosis. Scripts were written to automatically scan through a series of images and present images to a pathologist for a number of analyses described in assay methods above. For EL length calculation, the pathologist was presented with each image and a region tool to manually draw a line across the EL using a touch pen screen. Results were automatically exported to an Excel worksheet. For tumor mitotic index, the region tool was used to draw the tumor ROI for subsequent image analysis. For selection of mitotic cells and scoring for spindle and chromosomal defects, the scientist marked each alpha tubulin–positive / mitotic cell, and the script generated a 3-dimensional rotating image for manual scoring based on specific criteria.
Aperio Image Analysis
The Positive Pixel Count algorithm (Aperio, Leica Microsystems, Vista, CA) was used to analyze the CDT1 IHC assay in PD xenograft studies. Images of CDT1-stained slides were acquired with a Scanscope XT (Aperio) whole-slide scanner. For each xenograft image, 5 field-of-view (FOV) areas of 2150 μm in length were manually chosen to represent viable tumor. The 5 FOV areas were then analyzed with Aperio’s positive pixel count algorithm. CDT1-positive nuclei with a DAB intensity above threshold was scored positive. Final readout was percentage-positive CDT1 area over total pixel area.
Definiens Image Analysis
Images were quantified with Definiens image analysis software to identify the CDT1-positive cells within the CD34/CD117-positive cell population. First, the user manually drew ROIs to exclude areas of bad quality or fixation artifacts. Next, images were analyzed with Tissue Studio (Definiens, Carlsbad, CA) software, which identifies appropriate ROIs and then performs the cellular analysis. The Composer module, a machine-learning approach to identify tumor versus nontumor regions, was applied. Subsequent tumor regions were then selected for cellular analysis. The Tissue Studio Nuclear algorithm identified CDT1-positive nuclei, and the membrane algorithm was used to segment the CD34/CD117-positive tumor cells. The images were then batch processed with a novel rule set developed in Developer (Definiens) software. The rule set was needed to further refine membrane and nuclei segmentation, eliminate false positives, and improve classification of positive CDT1 cells.
Results
Pathologist-Assisted Semiautomated Methodology for Measuring Apoptotic and Mitotic Index in Skin Samples
Based on the mechanism of action of Aurora A kinase inhibition, immunofluorescent PD assays were developed for evaluating Aurora A kinase inhibition in skin and tumor biopsies obtained from phase 1 clinical trial patients at baseline and after treatment with MLN8237.
In the MLN8237-treated clinical patient samples, initial histopathologic evaluation for the quality and immunoreactivity of the skin biopsy was done with HE-stained and Ki67-immunolabeled slides, respectively. Ki67-positive labeling within an intact EL provided evidence that the biopsies retained immunoreactivity during processing and shipping. After sample quality was confirmed with these assessments, sections were evaluated for treatment-induced mitotic arrest, apoptosis, or structural defects in mitotic cells based on HE and immunofluorescent assays. Dual immunofluorescent staining technique was used to evaluate skin mitotic index based on detection of mitotic cells positive for both pH3 and MPM2 and to avoid the need to differentiate DAB from endogenous melanin in the EL.
Aurora A inhibition in skin biopsies was assessed on the basis of HE-stained slides for accumulation of apoptotic cells and pH3/MPM2 immunofluorescent slides for accumulation of mitotic cells within the EL of human skin biopsies. Based on morphologic features, a board-certified pathologist characterized cells in the EL of HE-stained skin biopsies as either preapoptotic or apoptotic (Fig. 4). Apoptotic index was estimated with HE-stained slides by manually counting the number of preapoptotic and apoptotic cells within an EL normalized to the length of the EL. Length of the EL was measured by acquiring 2× images from an E800 microscope (Nikon Instruments) and manually drawing a line across the EL on the image using MetaMorph software (Fig. 3). The numbers of cells positive for both pH3 and MPM2 were counted as mitotic cells and then normalized to length of the EL in millimeters. MPM2 was used as an additional mitotic marker for cross-checking Aurora B activity (Aurora B inhibition results in decreased pH3-positive cells). 11 Since Aurora A inhibition should result in mitotic arrest and increased apoptosis, the change in mitosis and apoptosis was calculated and reported by subtracting predose biopsy scores from the 7-day postdose scores (Figs. 5, 7). Both the immunofluorescence-based mitotic index and HE-based apoptotic index evaluations showed a drug-induced increase in mitotic and apoptotic cells in the EL of the skin biopsies upon treatment, 3,4 consistent with Aurora A inhibition. Although much of the quantification in this study was performed manually, the use of an automated Nikon microscope with fluorescent image acquisition capabilities and MetaMorph software for image analysis enabled quantification of the EL, allowing for normalization of the mitotic and apoptotic cell quantification, and facilitated counting of individual cells within the ROIs. Normalization based on the length of the EL is critical for accurate comparisons between treatment groups.
An Automated Method to Measure Pathway Inhibition in Clinical Tumor Biopsies
Inhibition of the Aurora A pathway upon treatment with MLN8237 was subsequently evaluated in the tumor biopsies by estimating mitotic cell accumulation within the proliferative tumor samples. Tumor mitotic index was evaluated for all patients that had evaluable pre- and postdose biopsies. After the initial histopathologic evaluation for the quality of the tumor biopsy (based on the HE-stained slides), immunoreactivity evaluation was done by assessing Ki67 IHC. With a multiplexed immunofluorescent method, proliferative regions of the tumor (Ki67 positive) were identified within the biopsy. These proliferative regions were drawn manually based on Ki67 and DAPI staining according to touch pen and MetaMorph software (Fig. 8). MetaMorph was used to develop automated algorithms to detect and quantify total Ki67-positive cells and pH3-positive cells. Mitotic index was calculated by normalizing the percentage of pH3-positive cells to the total number of Ki67-positive cells (Fig. 10a, b). Since the hypothesis was that Aurora A inhibition would result in increased mitotic arrest, the percentage of pH3-positive cells in the predose biopsy was subtracted from the day 7 biopsy, and the final results were presented as the change in percentage of pH3-positive cells per total Ki67-positive cells (Fig. 9). Upon ML8237 treatment, a dose-dependent increase in the tumor mitotic index in the day 7 postdose biopsies was indicative of Aurora A inhibition. 3,4
Pathologist-Assisted Method to Evaluate Pathway Inhibition in Clinical Tumor Biopsies
In addition to assaying for MLN8237-induced apoptotic and mitotic arrest in skin and the dose-dependent increase in mitotic index in tumors, pharmacologically induced defects in spindle assembly and chromosome alignment were also assayed. 3 Labeling spindles fluorescently tagged alpha tubulin and chromatin material with DAPI enabled us to assess structural changes in spindles and chromosomes upon Aurora A inhibition.
As part of the validation process, a subset of images was evaluated with different image processing methods (2-dimensional, 3-dimensional, with/without deblurring, low signal/noise) by multiple scorers to identify the best means to assess spindle assembly and chromosome alignment defects (data not shown). 14 A blinded and randomized scoring method was developed with a custom MetaMorph journal to automatically present 100 manually selected 2- and 3-dimensional cell images based on alpha tubulin labeling and DAPI staining to individual scorers for assessment of spindle bipolarity and chromosome alignment based on predetermined criteria: bipolar spindle (2 distinct spindle poles), aligned chromosomes (broadly linear DNA between and distinctly separated from spindle poles), and no calls (scorer cannot judge phenotype, image quality is poor, or cell is not mitotic).
To evaluate clinical tumor biopsies for spindle/chromosomal defects, 40× 3-dimensional deblurred multiple–focal plane images along with a randomized blinded manual scoring method were selected. 14 Data from multiple scorers were analyzed for a majority call, and concordance among scorers was measured. High concordance (85%) among all scorers was observed for chromosome alignment and spindle bipolarity. An exposure-related decrease in chromosome alignment and spindle bipolarity was observed in mitotic tumor cells from the MLN8237 clinical trial patient samples. 3
For MLN8237 clinical tumor biopsies, the change in percentage of chromosome alignment and spindle bipolarity was calculated by subtracting percentage mitotic cells with chromosome alignment and spindle bipolarity from predose minus day 7 postdose (Figs. 12, 13). Many tumor biopsies showed positive values representing a decrease in the percentage of mitotic cells with chromosome alignment or spindle bipolarity in day 7 postdose biopsy compared to predose. 3 Alpha tubulin and DNA markers worked well in clinical biopsy samples to identify mitotic spindles and chromosomes.
Customized MetaMorph tools developed for this study enabled automated image acquisition, processing, and scoring of a large number of mitotic cells in a blinded randomized manner. The automation tools and scoring method resulted in an efficient workflow and reduced user-induced bias. This method can be used as an indirect mechanistic biomarker for the assessment of Aurora A inhibition in patient tumor biopsies and demonstrates the increased efficiency gained by incorporating automated image analysis tools, even when assays largely require manual scoring.
A Pathologist-Assisted Method to Understand Pathway Inhibition in Bone Marrow Samples (CDT1/CD117/CD34)
During the preclinical phase of the MLN4924 program, the goal was to develop an IHC assay in xenograft samples that could later be translated to solid and hematologic malignancies from patients in phase 1 trials of MLN4924 (Figs. 14–18). Adoption of the CDT1 IHC assay for AML BMAs revealed some inherent challenges for assay development, sample preparation, and image analysis.
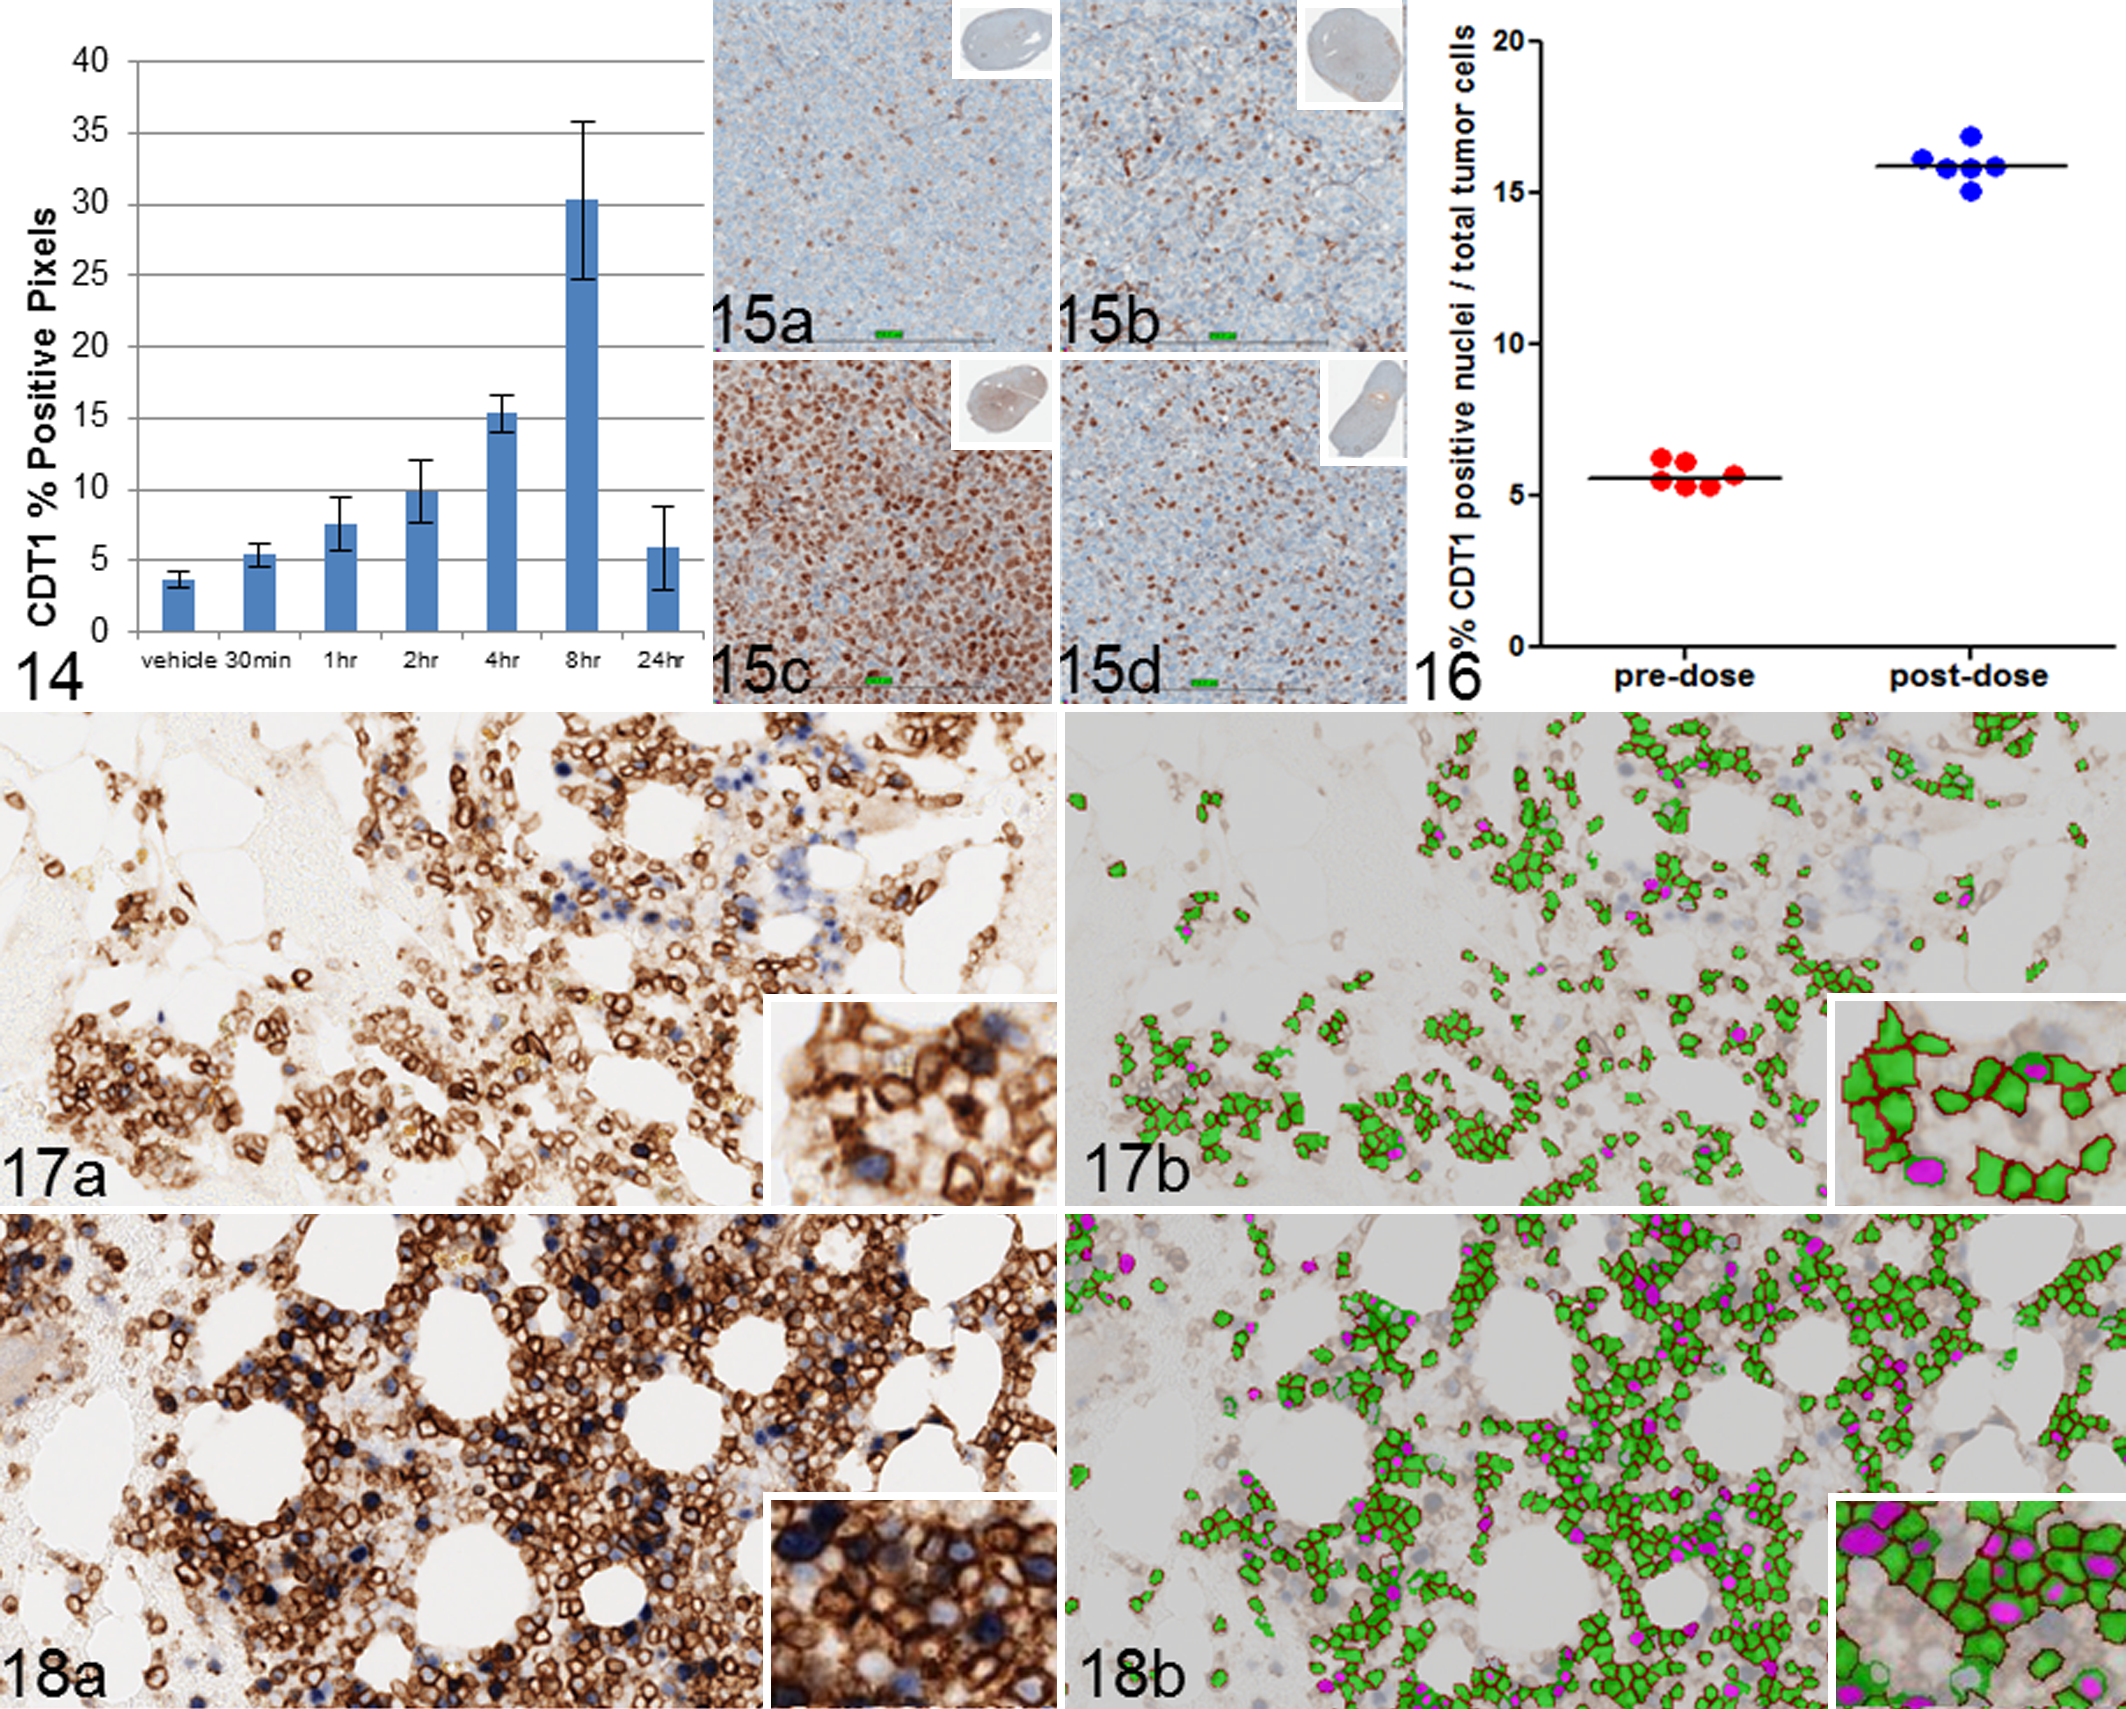
Preclinical studies with MLN4924 in AML cell lines and tumor xenograft models have shown increased CDT1 levels and accumulation of other CRL substrates following treatment. 17 Tumors from THP-1 AML xenografts were collected at multiple time points postadministration of MLN4924 to measure CDT1. Accumulation of CDT1 in the xenograft tumors was observed 4 to 8 hours posttreatment, demonstrating successful inhibition of NAE (Fig. 15a–d). Initial analysis of PD xenograft studies included a FOV positive pixel analysis (Fig. 14). At the start of the MLN4924 biomarker program, our laboratory had only recently acquired a whole-slide scanner. During the course of clinical development, technological improvements led to the conversion of most PD assay analysis formats from a FOV analysis approach to a whole-slide image analysis approach to reduce the time required to perform the assay. The new whole-slide image analysis approach utilized Aperio’s GENIE software, which is machine-learning-based histology pattern recognition software that can be used to automate tumor tissue identification within histologic tissue sections. The idea with any machine-learning software is that a pathologist or expert identifies ROIs characteristic for specific tissue features to train the software to accurately and automatically identify ROIs. The software then analyzes these pathologist-reviewed training sets and creates metrics based on variations in structure, color, and morphology to create an algorithm to maximize identification and segmentation of tissue classes within histologic sections. Our laboratory did extensive comparison studies to compare FOV versus whole-slide image analysis and pathologist/expert-drawn ROI versus machine-learning ROIs. The results showed high correlation for both comparisons (data not shown).
To detect CDT1-positive cells in tumor cells only, a dual IHC assay was developed that included CDT1 and an AML tumor marker cocktail consisting of anti-CD34 and anti-CD117. It has been reported in the literature that AML cells express both CD34 and CD117; therefore, both markers were used in the tumor cocktail. 13 AML cell lines do not express CD34/CD117, so assay development was completed on breast and tonsil samples, which are known positive controls for CD34 and CD117, respectively. Additionally, untreated AML patient samples were used for optimizing IHC conditions. However, once the dual IHC assay was optimized, there were additional inherent challenges discovered in working with the BMA samples. The first challenge was dealing with large cracks and folds in the sections, which were due to the high volume of peripheral blood collected with some of the large aspirate samples. Therefore, for large samples, sections were cut in half in the water bath before the tissue was placed on the slide. Reducing the surface volume of the tissue appeared to reduce the folds and cracks in the tissue section.
To detect CDT1-positive cells in tumor cells of patient samples, Definiens software was chosen. Reliable segmentation of cells within dense cellular clusters in the BMA samples was difficult with Aperio’s Image Analysis Toolbox; therefore, Definiens image analysis software was utilized for further analyses. Definiens Tissue Studio—which includes the pattern recognition software Composer, somewhat analogous to Aperio’s Genie—was utilized for the initial clinical CDT1 analysis, and additional rule sets for increasing the accuracy and stringency of the analysis were developed in Definiens Developer, which is a more supervised software package. The next step was to determine how many sections and/or tumor cells would provide enough power to evaluate a significant fold change between pre- and postdosing. Six patients of varying levels of tumor burden were selected from the trial for the initial statistical analysis. Six serial sections per pre- and postdosing biopsy, for a total of 12 sections per patient, were sectioned and immunolabeled. The intrasubject variation of the change in percentage CDT1-positive cells among serial sections was used to establish the degree of percentage CDT1 change between pre- and postdosing biopsies that could be statistically meaningful. The within-subject coefficient of variance for percentage CDT1 positive was estimated to be 19% for the 6 patients. Statistical analysis showed that within-subject variation is less heterogeneous for log-transformed data. This within-subject coefficient of variance allowed for the assessment of the relationship between the number of slides per sample and the fold change that can be detected when a 2-sample t test is used on log-transformed (percentage CDT1-positive) data. The absolute number of CDT1-positive tumor cells for a given sample was found to be proportional to number of total tumor cells per slide; therefore, the variation of percentage CDT1-positive cells across slides for a given sample did not appear to depend on number of total tumor cells per slide per sample. Power analysis was used to determine the trade-off among number of slides assayed, and statistical power was used to determine a given fold change in percentage CDT1-positive cells between pre- and postdose samples. Six slides from pre- and postdose samples were chosen for the final configuration of the clinical assay, as this enabled detection of a 1.5–fold change in percentage CDT1-positive cells with 80% power (P < .05). Figure 16 shows an example of percentage CDT1 change between pre- and postdosing in a single representative patient. There is a tight concordance among slide replicates. Figure 17a and 18a are representative images of BMA samples from a pre- and postdose patient, while Figures 17b and 18b highlight the image analysis segmentation of tumor cells in green and positive nuclei in pink. Samples with fewer than 50 tumor cells were excluded from analysis. A phase 1 clinical trial of MLN4924 in AML is underway, and CDT1 analysis of 21 AML patient biopsies has shown a statistically significant increase in CDT1 levels in CD34/CD117-positive cells detected in 16 of 20 patients 3 to 6 hours after MLN4924 treatment on C1D5 (t test; P < .05). 12
Discussion
Developing an IHC-based biomarker strategy enables scientists to understand target inhibition, pathway inhibition, and terminal outcomes in nonclinical and clinical studies. The IHC imaging laboratory involves a number of different technologies, including automated slide scanning and advanced image analysis systems, which have facilitated the transition from traditional manual scoring methods to a high-throughput quantitative methods. This laboratory includes an assay development team consisting of members with different expertise—scientific (biologist, pathologist) and technical (histotechnologist, image analyst)—working together to optimize all steps of the assay.
The ideal IHC imaging laboratory may include an IHC autostainer, slide scanner, image analysis software, and data management system—each integrated through the use of barcodes. Increased automation decreases preanalytic variability, and barcodes allow a sample to be tracked through the process and all associated sample information to be accessible at each stage of the process. In reality, there is some mix of automation and software, and the laboratory’s platform technologies evolve over time. For these reasons, there is a need for different workflows from IHC techniques (chromogenic, immunofluorescence), image acquisition (3-dimensional, brightfield, immunofluorescence), and image analysis.
WSI and image analysis technologies were utilized as part of a PD strategy to measure target inhibition for 2 oncology development programs, MLN8237 and MLN4924, in preclinical and clinical studies. These different workflows highlight the evolution of our laboratory as well as the different needs and requirements of each biological assay. For example, some assays may be utilized to measure low levels of protein expression. In this instance, configuring an immunofluorescent assay may offer higher-resolution images with greater dynamic range of signal intensity. The workflow may result in lower throughput (ie, slower image acquisition times) but better-quality images. Alternatively, developing a clinical biomarker may be better suited as an IHC assay, which combined with WSI can work efficiently in screening large samples sets.
MetaMorph software with a basic Nikon microscope was appropriate for analysis of skin and tumor biopsies for evaluating mitotic arrest in skin and tumor and chromosome/spindle defects in tumors. A pathologist-assisted semiautomated image analysis methodology allowed us to develop unique ways to assess skin and tumor biopsies using a broad panel of mechanistic biomarkers to demonstrate ML8237-induced Aurora A inhibition. Having the pathologist and scientists counting apoptotic and mitotic cells, respectively, ruled out any “missed” calls. Use of MetaMorph software to normalize the data with millimeter length of the EL was unique and allowed us to obtain semiquantitative data. This normalization is critical to allow comparisons among treatment groups, and standardized and accurate methods of normalization (eg, EL length, total cell counts, tumor areas) are as important for measuring quantitative end points as the measurements of the features of interest themselves. The use of MetaMorph software to present 3-dimensional rotating mitotic cells for manual scoring opened up a new venue for assessing chromosome alignment and spindle biopolarity defects. As a unique methodology was developed to evaluate PD biomarkers in tumor biopsies treated with antimitotic drugs, chromosome alignment and spindle bipolarity assay are good examples of a semiautomated assay in which MetaMorph software was used to process individual cells and present to the scientist for scoring.
By combining the pathologists’ expertise and the results of the image analysis software, different types of tumors were successfully analyzed. Various methods can be used to draw regions on different tissue types. With the stand-alone Nikon microscope, high-resolution single images were acquired and merged with MetaMorph software to create a montage so that regions could be drawn manually along the EL, with tumor regions circled in tumor biopsies based on Ki67/DAPI staining and with mitotic cell selection based on alpha tubulin/DAPI staining. With recent advancements in image acquisition and analysis, skin and tumor are fairly easy types of tissues to evaluate biomarkers. More complicated tissue types (eg, bone marrow) require more advanced, supervised types of software.
The decision of which image analysis platform to use for the BMA samples was based on several factors: how images were acquired, the completeness of an image analysis workflow, and the accuracy and sensitivity of quantification. For the MLN4924 study, the BMA samples could be as large as 15 mm or greater, and tumor cells were either very diffuse or clustered; therefore, the decision was made to acquire images with a whole-slide scanner system, allowing for the option of analyzing the entire sample to capture as many positive tumor cells as possible. Initially, 3 image analysis software packages were evaluated—MetaMorph, Aperio, and Definiens. Analysis software was assessed for the ease of the workflow and for the accuracy and reliability of the quantification method.
MetaMorph image analysis software was originally evaluated because, historically, a majority of existing IHC assays were analyzed with a color thresholding algorithm with MetaMorph software. MetaMorph software was eventually ruled out because, at the time, the software was not capable of importing large whole-slide images and because most of the advanced scripting modules are designed for fluorescent, not brightfield, images.
Next, the Aperio membrane algorithm was assessed. The membrane algorithm detects an individual cell’s membrane, and each cell is classified with a 0, 1+, 2+, or 3+ score based on the completeness and intensity of the membrane. Membranes can be detected in cells with or without nuclei. The BMA samples were all scanned into the Aperio database, so analyzing images with an Aperio algorithm was an easy image analysis workflow. The images and analysis were contained within Aperio’s Spectrum image database, allowing for seamless workflow and data storage. The membrane algorithm worked well on regions of diffuse single tumor cells but was less reliable for segmenting membranes in regions of dense tumor packets, based on visual inspection. Also, there were a limited number of parameters that a user can adjust for the membrane and nuclear detection. Overall, the membrane algorithm was found to be inaccurate for some BMA samples and could not accurately segment all membranes, thus resulting in miscalls for many of the CDT1-positive tumor cells.
Definiens software was ultimately chosen because of the broad spectrum of image analysis algorithms available and the use of context-based segmentation. The final algorithm developed was a combination of a “canned” Tissue Studio algorithm plus a custom rule set developed with Definiens Developer software. The reason for developing a combination algorithm was twofold. First, Tissue Studio contains a library of analysis solutions for nuclear and membrane detection that worked well for the initial segmentation, and Tissue Studio provided the framework for automating the processing of large images. However, the Developer software allowed us to create and merge a custom rule set with an existing “canned” solution. It was necessary to customize a postprocessing rule set in Developer due to the variability in the BMA IHC. The custom rule set was written to reduce the high false-positive rate of CDT1 calls, improve nuclear and membrane segmentation, and export custom parameters. One key feature of the software that was vital to identifying positive CDT1 nuclei was the concept of a classification value. 5 The user can create a set of features that, when combined, can be used to create a membership value of a class of objects. In the case of CDT1, for nuclei to be classified as positive CDT1 nuclei, the nuclei were evaluated for 4 features (ellipicity, length/width, intensity, and number of pixels). The nuclei were assigned a “membership value” based on the combined values for all 4 features. A membership value reclassifies nuclei as either positive or nonpositive CDT1 nuclei. Definiens software also provides the ability to export object statistics. For each object (eg, nuclei, cell), numerous features pertaining to morphology can be exported. This can provide the user with more information to examine subtle changes in a given data set. This information can be important in certain scenarios—for example, if the number of CDT1-positive cells did not significantly change with dose but the overall intensity or size was significantly different following treatment. In summary, to have a successful image analysis rule set, it is import to work with a pathologist to identify the tumor morphology and IHC labeling. The image analyst can then develop a robust image analysis algorithm based on the pathologist’s feedback.
Automated quantitative analysis of biomarkers along with flexible IHC staining and image acquisition platforms provides a robust workflow for any IHC lab and perhaps may lead to better insight into the biological relevance of a specific protein target. The success of the biomarker program relies on combining new digital pathology technologies with the pathologist’s skill set and knowledge. Also developing a robust assay validation plan to understand tissue sampling and antibody characterization is imperative to a successful biomarker plan. Careful assessment of sample size and variability will help calculate how many slides to assay and power the study appropriately to determine a significant fold change. The 2 case studies described above show the additive contributions of image analysis workflow to a complex biomarker program.
Footnotes
Acknowledgements
We would like to acknowledge members of the project teams. MLN8237: Katherine Galvin, Bradley Stringer, Chris Simpson, Evan Luongo, and Ray Liu. MLN4924: George Mulligan, Tary Traore, Michael Thomas, Jie Yu, and Feng Gao.
Declaration of Conflicting Interests
The author(s) declared no potential conflicts of interest with respect to the research, authorship, and/or publication of this article.
Funding
The author(s) received no financial support for the research, authorship, and/or publication of this article.