
Abstract
The objective of histologic techniques is to stain the subject with high specificity and high visibility. Visibility depends on the microscope’s resolution and contrast and on the microscopist’s skill at optimizing the microscope’s image. It also depends on histotechnological factors, which include specificity and differentiation of the stain, density of background staining (particularly in silver stains), innate color, and grayscale contrasts of the dyes in the stains and color and density of the counterstain. If contrast is not optimal, the image should be evaluated on the basis of 2 types of contrast-color and grayscale. Complementary colors have maximum color contrast, and the color triangle is useful in the selection of a suitable counterstain. Grayscale contrast is a function of the density of a stain. If dyes capable of staining the target and backgrounds tissue do not have optimal color contrast, the only method of increasing contrast is to change the grayscale value of one of the stains, usually the counterstain. Colors can have a subconscious effect on a viewer. Depending on whether they are aesthetically pleasing, they may influence the rigor of and time spent on the histopathologic examination. Maximizing the specificity of stains such as hematoxylin, eosin, trichrome, and Luxol fast blue (LFB) depends on optimal differentiation. In differentiation of counterstains such as methylene blue in the Ziehl-Neelsen stain, its recommended density is conveniently expressed as a grayscale value. Independent evaluation of color and grayscale contrasts is very helpful in determining the cause of low contrast in an image. This review discusses aspects of the histotechnique affecting the visibility of tissue components.
Keywords
It is now more than 150 years since hematoxylin was introduced as a stain for tissue and 136 years since tissues were embedded in paraffin wax prior to sectioning. 25 The late 19th century was a time of remarkable development of empirical stains, initially “oversight” stains such as HE and later “special” stains for the demonstration of specific components such as collagen, reticulum, and types of neuroglia. This led to an understanding of the tissue response to injury in pathologic processes. Some stains from the late 19th and early 20th centuries, such as the HE, trichrome stain for collagen and the silver impregnation methods for reticulum and bacteria, have shown their usefulness and still form part of the pathologist’s armamentarium. However, capricious stains—for example, some of the silver and gold impregnation methods for glial cells—have been superseded by immunohistochemical methods, which are easier to perform and more reliable. A significant effort was made in the past century to determine the chemical bases for many of these empirical stains, 5,13,22,28 but for many, the exact mechanism is still unclear, and consequently the success of many empirical stains still depends on the expertise of the histotechnician in monitoring critical steps. These steps include differentiation (differential decolorization) of stains such as HE, LFB, toluidine blue, Gram’s stain, and Ziehl-Neelsen acid-fast stain and incubation and impregnation in silver stains. In a histochemical reaction (often incorrectly called a “stain”), the chemical reaction itself is responsible for the end product. In Perls’s Prussian blue reaction for hemosiderin, sections are treated with a solution of potassium ferrocyanide, which combines with the ferric ion in the tissues to form ferric ferrocyanide, which is Prussian blue. 22(p683) Some stains, such as Grocott’s methenamine silver and Gordon and Sweets’s reticulum stains, have a histochemical basis, but unlike a chemical reaction such as the Prussian blue that can run until completion, these require human judgment at critical steps in the procedure to maximize the visibility of a target tissue. The emphasis over the past century has been on developing methods to increase the specificity of staining of a “target tissue” (defined as those unique features of tissues or cells [macroscopic, microscopic, or molecular] that can be identified and visualized using histotechniques to facilitate histopathological evaluation) and, as a result, the visibility of that target. Initially, these were histochemical methods, but many of these have given way to modern immunohistochemical methods that have high specificity.
Francis-Vincent Raspail (1794–1878) is regarded as the founder of microchemistry, which preceded the development of histologic techniques. 22(p1-9) Most of his techniques were destructive. He discovered micro-incineration and applied the iodine reaction for starch. Because of the remarkable development of aniline dyes by the German chemical industry in the latter half of the 19th century and with their promise of better histological staining, evaluation of new dyes received priority with the result that progress in histochemistry was slowed. However, histochemical methods developed in the 19th century include the Prussian blue reaction for iron, introduced by Perls in 1860, and the demonstration of peroxidases (1868), cytochrome oxidase (1885), the chromaffin reaction (1870), metachromatic staining of amyloid by methyl violet (1875), myelin staining by the Weigert and Marchi methods (1884, 1892), and Gram’s stain (1884). 22(pp1-9) The von Kossa method for calcium was described in 1901. Pearse 22(p683) considers that 1930 was the year of the rebirth of histochemistry and its establishment as an independent branch of histology.
Immunohistochemistry began in 1942, when Coons et al 8 demonstrated pneumococcal antigen in tissues by the use of fluorescent antibody, and since then, progressively more antibodies specific to cellular antigens and other structures have been developed. These methods are more specific than empirical and histochemical stains and have displaced some of them in routine histopathologic examination. For example, the Holzer method for astrocytes and their processes was replaced by the immunohistochemical staining for glial fibrillary acid protein (GFAP).
Apart from his or her knowledge of the subject and the response of tissue to injury, the pathologist’s ability to interpret the microscope’s image depends on his or her proficiency in adjusting the microscope for optimal resolution and contrast (usually Koehler illumination in bright-field microscopy) and the effect of the staining techniques on the visibility and contrast of histologic sections.
Contrast
Contrast of an image is best considered in terms of 2 categories: grayscale (black and white) contrast and color contrast.
Grayscale Contrast
A grayscale value (GSV) is the relative optical density of a subject and depends on its luminance. This is illustrated in Fig. 1, which is a 10-step grayscale with maximum black at one end and maximum white at the other, with the remainder divided into 8 steps with equal increments of density, with step 6 being approximately mid-gray. Different models of grayscales vary in the number of steps from 6 to 256 (for 8-bit images) and higher in computer image programs such as Adobe Photoshop. For naked eye estimation of densities, the 10-step grayscale is adequate to allow estimation of grayscale values of the differently stained components in an image of a histologic slide (Fig. 1). A 10- or 11-step grayscale has been used to evaluate the grayscale values of paintings and photographic prints, both color and black and white. The best known of these is the 11-step scale of Ansel Adams. 1,2 He called each step a “zone” and numbered these from 0 to 10, with 0 = black. Because the 10-step grayscale in this article is intended to be used for the estimation of grayscale values in histological sections, it seems more intuitive to have the numbering system to be compatible with ascending density. Thus, in Fig. 1, step 1 = white and step 10 = black.
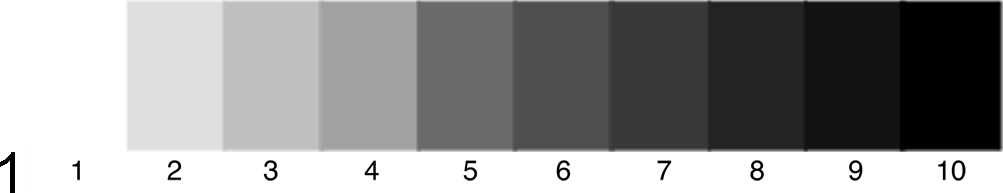
Ten-step grayscale. Maximum white is step 1 and maximum black is step 10. Step 6 is approximately mid-gray. Because of the limitations of the printing process, the grayscale values (densities) of each step may not be accurate in this figure.
For photomicrography, the maximum black obtainable is grayscale value (GSV) = 9, and the microscope’s clear background ranges from GSVs of 2 to 3, depending on the objective and the illumination. Mid-gray is GSV = 6, and therefore other grayscale values fit into the remaining 6 GSVs. With limited choices such as these, estimation of grayscale values and grayscale contrasts in a stained section is not difficult.
Color Contrast
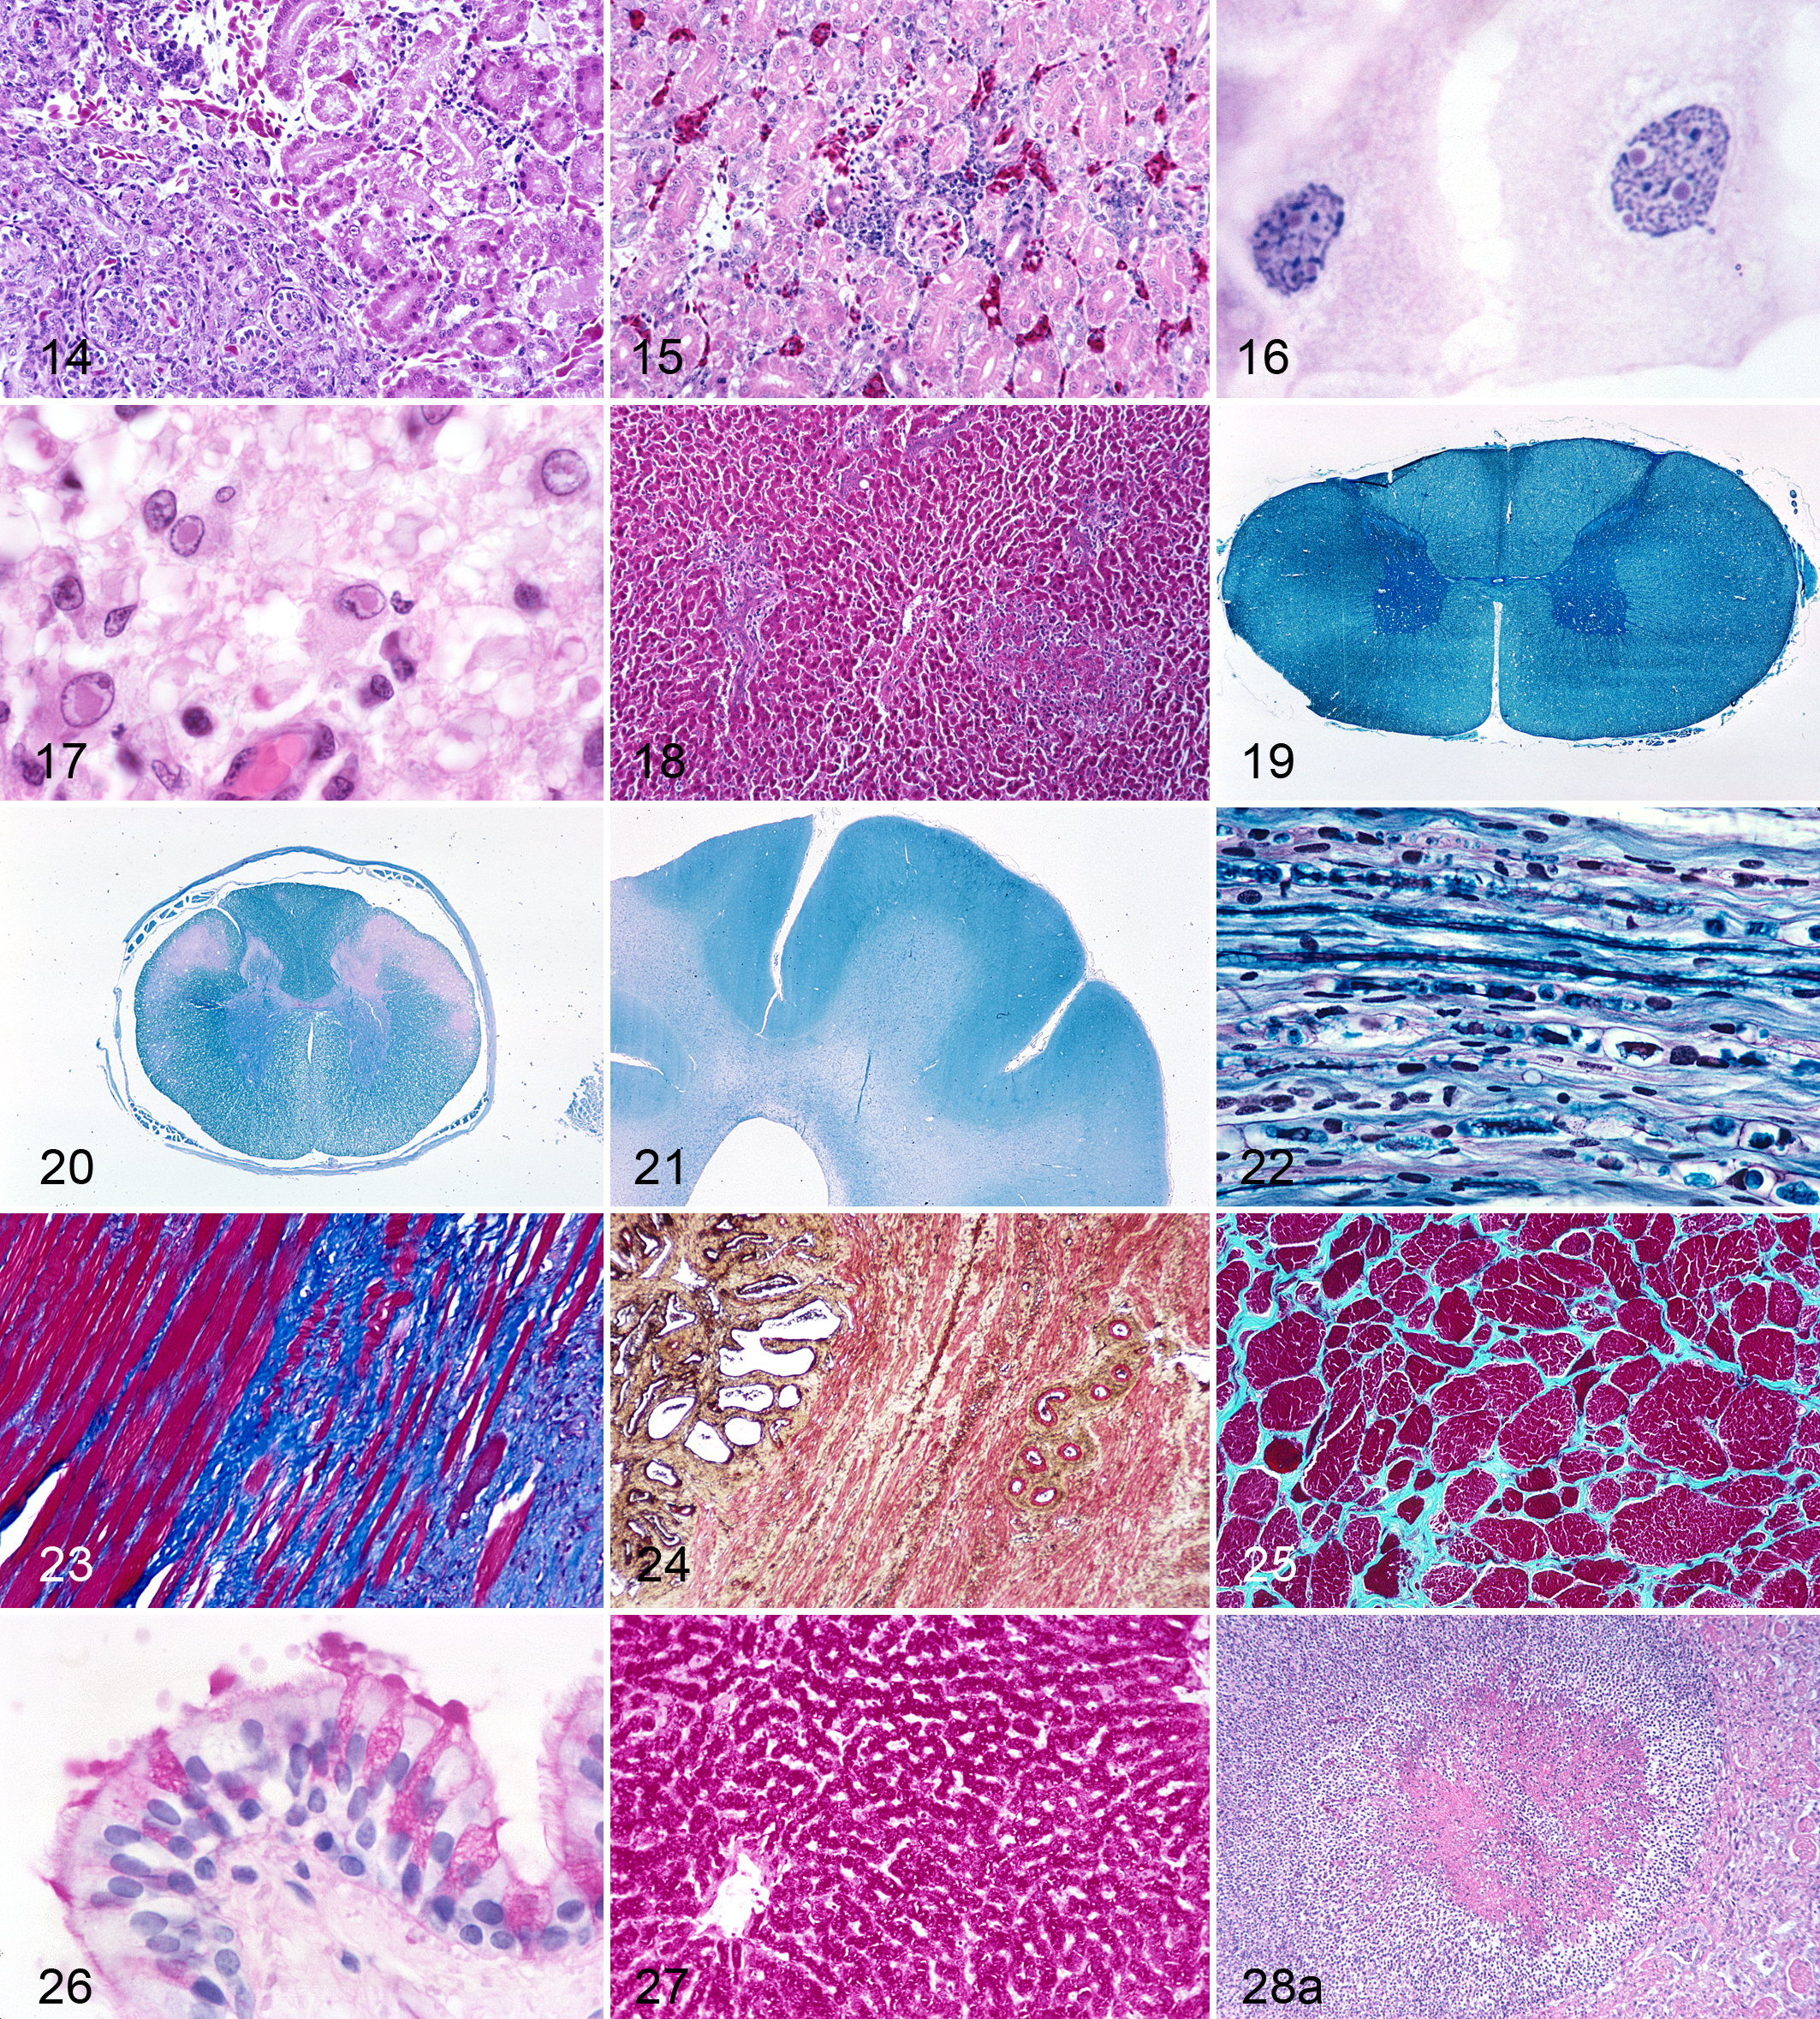
Describing the effects of color is made more difficult by the multiplicity of terms commonly used for the different variations in colors (dark, light, shade, tint), but the basic terms used here are color (hue), saturation, and grayscale value. This is similar to the HSV (hue, saturation, value) color model, but only the grayscale value will be used. Color (hue) means one of the spectral colors (red, orange, yellow, green, cyan, blue, and blue-violet) and the adjacent colors and also the nonspectral color magenta between blue-violet and red on the color triangle. Saturation indicates the purity of the color and whether it has been diluted with white or a light color, such as yellow, or darkened by black or a dark color, such as blue. A GSV is the monochromatic equivalent of a color, expressed on a grayscale with graded densities from white to black (Figs. 1, 3b). Using the grayscale avoids the use of terms such as tints, which usually means a color made lighter and less saturated, and shade, which means a color to which gray has been added.
Primary colors are sets of colors that, when combined, make a wide range of colors. Since human color vision is trichromatic, 3 primary colors are typically used. Two types of color combinations exist: (1) additive, also called the RGB color model (eg, those generated by a projector): red, green, and blue and (2) substractive, also called the CMYK color model (eg, mixing of dyes as in printing): cyan, magenta, yellow, and black. In this article, we will use the RGB model. The colors at the corners of the color triangle (Fig. 3a) are the primary colors (red, green, and blue-violet), and the colors directly opposite them on the triangle—cyan (blue-green), magenta, and yellow—are their respective complementary colors that have maximum color contrast. When light of the primary colors is mixed together in appropriate intensities, they form white light. Confusion has been caused because the artist’s primary colors (also called “print primaries”) are usually called red, green, and yellow, but they are closer to magenta, cyan, and yellow, respectively. When pigments of the artist’s primary colors are added together, they make black or dark gray, a consequence of the opacities of the pigments in the dyes.
Fig. 2a,b depicts a US flag in both color and grayscale and illustrates the grayscale values of, and the contrast between, the blue, red, and white components. The saturated blue and the not fully saturated red have different grayscale values, and thus good grayscale contrast, and are similar to the relationship of the colors of blue and red in an optimal HE-stained section. In the microscope’s image, the white is supplied by the microscope’s clear background. The combined effect of good color and good grayscale contrast between the red and blue results in excellent and pleasant visual contrast. The effect of different degrees of saturation of red and blue and their different grayscale values and contrast is evident in many national flags that incorporate red, white, and blue. Some have both a deeply saturated blue and red with little grayscale contrast between them. Others use a light blue, whose grayscale value is less than that of the red, which increases the grayscale contrast between them but has a subconscious psychological effect. The lighter blue is often perceived as indicating less “strength” and a deep blue is perceived as “stronger” and has been preferred in national flags using red, white, and blue. This is also true of histologic stains. However, perception of the importance of colors is modified by cultural factors such as patriotism and allegiance of the observer to an organization such as a sports team.
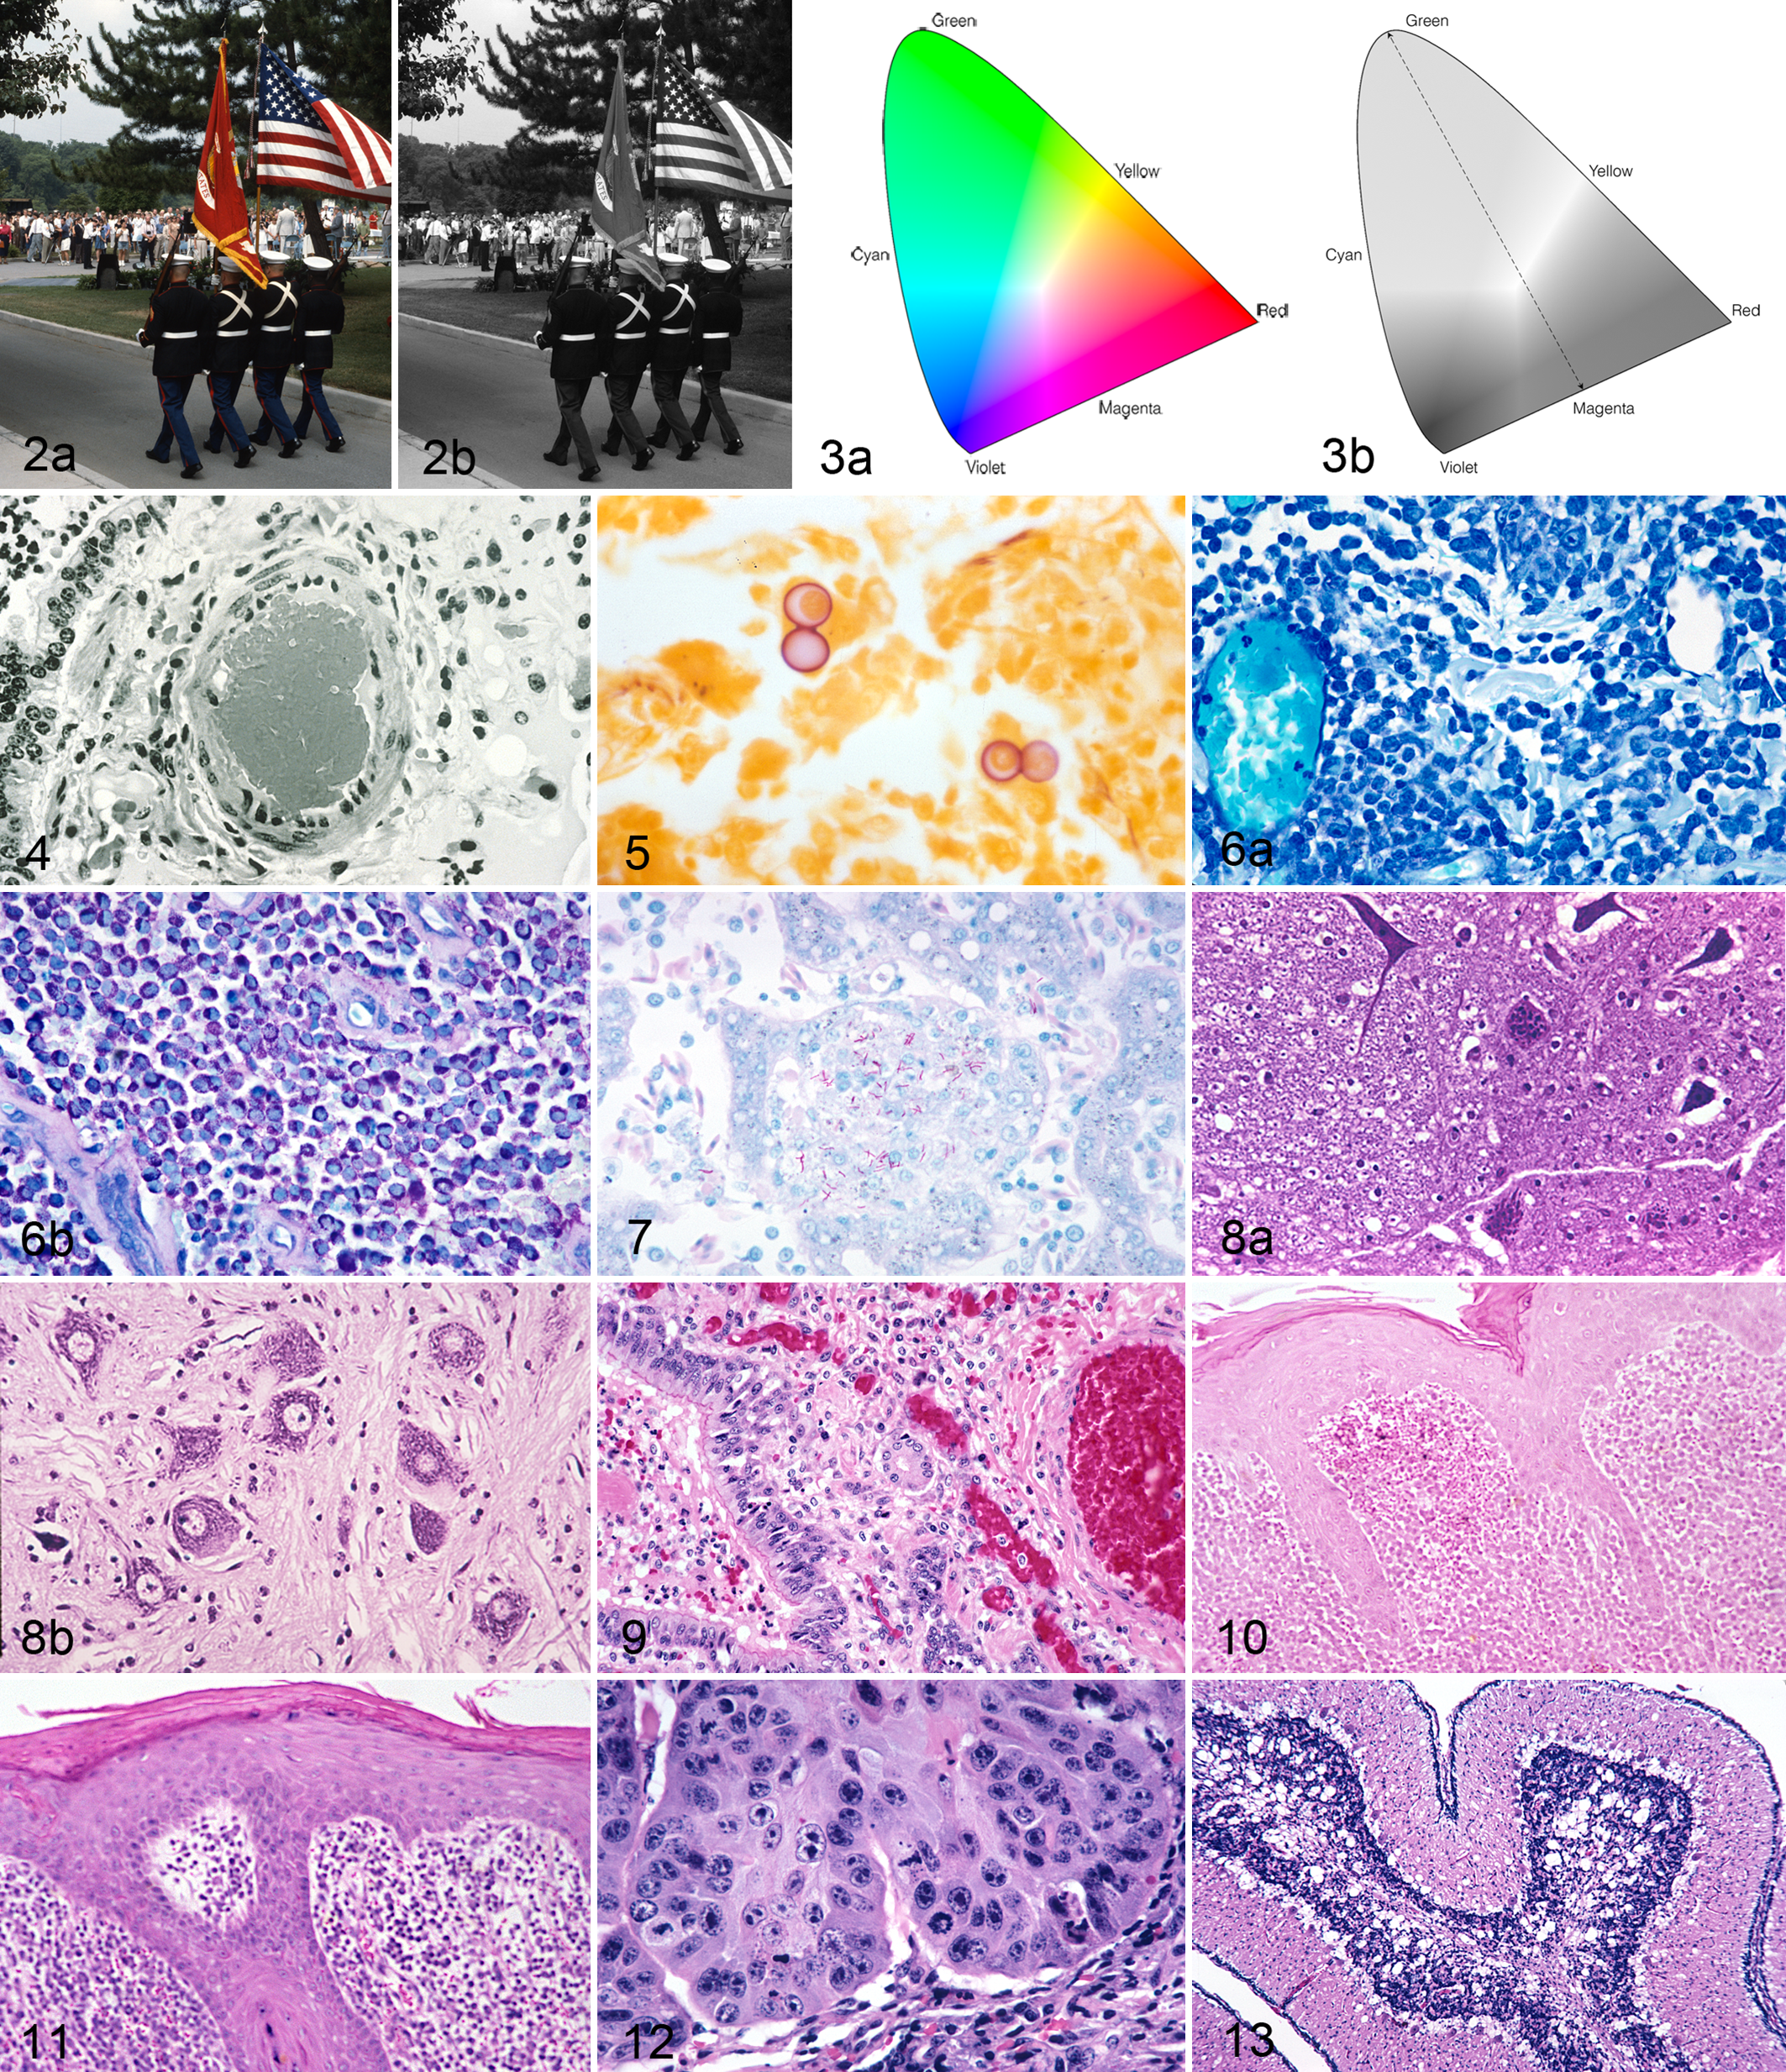
Relationship between colors and grayscale. (a) The flag has both good color (blue and red are complementary) and good grayscale contrasts. (b) The Marines’ uniforms have a grayscale value (GSV) of 9, and in the flag, the GSVs are blue = 8, red = 7, and white = 2.
Because colors are such an integral part of our lives, there is an enormous literature on the physics, physiology, and psychology of color and the roles they play in perception and interpretation of a colored image. 6,21 The relationships between color contrast and grayscale contrast for the pure colors of the spectrum are illustrated in Figs. 2a,b and 3a,b. Yellow is the brightest color to the human eye and consequently has the lowest grayscale value. Blue-violet has the highest grayscale value. Visual perception of contrast in the microscope’s image is a mixture of color and grayscale contrasts. Colors are recorded by the retinal cones and black, grays, and white by the retinal rods, and their images are fused in the brain. Thus, maximal contrast is achieved when the colors are complementary and the relationship between a hue and its grayscale value is similar to that of the spectral colors in Figs. 2a to 3b. This is what the brain has been programmed to consider a “natural” relationship, and changes in this relationship—for example, by reversing a grayscale contrast by using a light blue instead of a blue-violet next to a saturated red, as in the Ziehl Neelsen acid-fast stain—may subconsciously make the image seem strange. Fortunately, HE is a stain that, with optimal staining, maintains the “natural order.” Nuclei are blue-violet to purple with a high grayscale value, and eosin-stained structures, which are red to pink, have lower grayscale values (Fig. 4).
Psychological Effects of Colors
Colors do have a psychological effect and direct or divert the attention of the viewer. This is well recognized in fields such as art, photography, interior design, advertising, and in everyday life, and it also could be reasonably expected to apply to the examination of stained histologic slides. In Western culture, red is associated with aggression, passion, rage, and strength; blue with reason and detachment (coldness) and sometimes sadness and depression; and yellow with “free spirit” and sometimes weakness or distaste (bile, diarrhea). Some psychological effects may be cultural. In Chinese culture, red (usually a red-magenta) symbolizes good fortune and happiness. Some colors appear to “recede” into the background and others to “advance” and become more prominent. Blue “recedes” and red “advances,” and “advancing” colors seem more important. Although this psychological effect is probably not overtly significant in histopathologic examinations, it may have a subconscious effect and influence the rigor of the evaluation. A less than aesthetically pleasing stain may not be examined for as long a period as others. The biggest problem is when the colors of the stained section do not have the same importance and significance in the hierarchy of colors as has been programmed into our memories by everyday life and culture. Bright, strong colors such as red command attention, while blue attracts less attention. As red is used to indicate danger, red-stained pathogenic acid-fast bacteria in the Ziehl-Neelsen stain seem appropriate. In contrast to this, in the Masson’s trichrome stain, where the center of attention should be the blue-stained collagen, other tissues that are stained nonspecifically bright red by the counterstain, Biebrich scarlet, immediately attract visual attention. This is the opposite of what is desired of a counterstain, which should appear subservient to the target tissue. The red-stained component is not only inappropriately prominent; it appears to be of more significance than the blue-stained collagen. Once it is realized that the latter is the target tissue, there is a feeling that the appearance is not appropriate. Sections with yellow-counterstained background tissues in such stains as van Gieson, Gridley fungus (Fig. 5), and the Brown and Brenn variant of Gram stain do not project a feeling of strength and seem “weak.” A Grocott’s methenamine silver (GMS) stain with a nuclear fast red counterstain, despite its excellent color and grayscale contrast, is also seen as “weak.” Because it has excellent color contrast, the trichrome stain, despite the reversal of the expected importance of the red- and blue-stained structures, is still preferred over the van Gieson stain, which has both weak color (pink and yellow) and weak grayscale contrasts. In life, colors can be selected to attract or divert the viewer’s attention, but in a histologic stain, a dye has to be chosen based on its staining ability, and it may not have optimal color and grayscale contrasts or be visually appealing. As a result, it may be necessary during histologic examination to consciously ignore the psychological influence of a color. In the toluidine blue stain for metachromasia, the background blue has to be decolorized to a low grayscale value to reveal the metachromatic mast cell granules (Fig. 6a,b). Similarly in the Ziehl-Neelsen acid-fast stain, for optimum visibility of the deep red bacilli, the methylene blue–counterstained background has to be decolorized until it is light blue (GSV = 3–4); otherwise, it masks the red bacilli (Fig. 7). For this reason, although a deep blue background is less distracting (“recedes”) and is desirable visually, it cannot be used here.
Factors That Affect Contrast
These will be discussed in the following sequence: microscopy, differentiation (hematoxylin, eosin, phloxine, LFB, trichrome), background staining in silver stains (oxidative-methenamine silver, impregnation, silver reticulum stain such as Gordon and Sweets, and the Jones basement membrane stains), counterstains, and photomicrographic prints.
Microsopy
In the microscopic examination of a section, quality of the optics, particularly of the objectives, and the precision of setting up of the microscope for optimum resolution and contrast are major factors. Optimal performance in bright-field microscopy requires the use of Koehler illumination and positioning of the aperture diaphragm to obtain the appropriate balance between contrast and resolution. Maximum resolution occurs when the aperture diaphragm (on the condenser) is opened just sufficiently to fill the rear focal plane (RFP) of the objective with light, but usually the aperture diaphragm is closed so the diameter of its cone of light is 90% to 70% of the diameter of the RFP. This can be observed only when the ocular is removed. Closing the aperture diaphragm increases contrast and depth of field but reduces resolution. Because the optical performance of the microscope determines the final quality of the microscope’s image, it is essential that when comparing the effects of different counterstains, particularly their contrast, the same settings of the microscope should be used for the different specimens.
The most highly corrected objectives are apochromats, nowadays usually planapochromats, because they also have a flat field. They have the highest color saturation and contrast, and the difference between them and achromatic lenses is most evident in images from low-power objectives (4× and lower) and very high-power objectives (40×–100×). Antireflective coatings on the surfaces of the lens significantly reduce flare and thus increase contrast of the image. Lenses with these coatings were introduced in the 1950s. Initially, coatings were applied only to the exterior surfaces of objectives and oculars. Nowadays, they are applied to most lens surfaces. Unfortunately 40×, 60×, and 100× apochromatic objectives are very sensitive to departures from optimal microscopy (eg, from failure to set up Koehler illumination) and by some defects in histopathologic preparations, particularly incorrect cover glass thickness. The ability of an objective to resolve details in a section depends on its numerical aperture (NA) and not on its magnification. NA of a lens is expressed as a number, which is engraved on the barrel of the objective. This value can be calculated using the following formula: NA = n × sin (μ), where n is the refractive index of the medium between the cover glass and the objective (eg, air, water, immersion oil), and μ is the angle included between the optical axis of the lens and the outermost ray of light that can enter the front lens. 4 The maximum NA for a dry objective is theoretically 1.0, but in practice it is 0.95, and for water and oil immersion objectives, it is 1.30 and 1.50, respectively. 4 The image of a 40×, NA = 0.95 planapochromatic objective is superior to that of a 40×, NA = 0.65 planachromatic objective, but not if the thickness of the cover glass plus mountant departs from the prescribed 0.17 mm, which will make the image “fuzzy.” Despite being designated “cover glass thickness,” the 0.17 mm engraved on the barrel of the objective does not mean the thickness of the cover glass alone but the thickness of the cover glass plus the mountant between the top surface of the specimen and the undersurface of the cover glass. 24 Many histology laboratories mistakenly chose #11/2 cover glasses because their thickness (0.17 mm) matched the “cover glass thickness” engraved on the barrel of the objective. A #1 cover glass is nominally 0.13 mm thick, thus allowing for 0.04 mm of mountant. It is extremely difficult to ensure that the thickness of the mountant plus the cover glass will be 0.17 mm. If a #11/2 cover glass (0.17 mm thick) is used, then with the addition of mountant, the total thickness will be at least 0.2 mm thick. Even using #1 cover glasses with older, more viscous synthetic mountants, the cover glass plus mountant thickness is 0.2 to 0.22 mm, as determined by examining slides using the correction glass collar on a 40× apochromatic objective. For this reason in routine histologic staining, #1 cover glasses should be used, and even then, the thickness of many of these, when mounted, will exceed the 0.17 mm engraved on the objective’s barrel. Also, it is a reason when selecting high NA objectives to consider whether fluorite or achromatic objectives which have more tolerance to incorrect cover glass thickness would be a better choice. If dry apochromatic objectives with an NA greater than 0.7 are selected, then only those with a cover glass correction collar should be chosen. The cover glass correction collar can be adjusted for cover glass plus mountant thicknesses from approximately 0.10 to 0.25 mm. Tolerance to incorrect cover glass thickness diminishes as the NA of the objective increases. Consequently, a 40× plan achromatic objective with an NA = 0.65 is not as sensitive to small departures from the prescribed “cover glass thickness” of 0.17 mm as a planachromatic objective of the same magnification. Therefore, for routine histologic examinations, planachromatic and planfluorite objectives, particularly the high-magnification ones (40×, 60×, and 100×), are simpler to use.
Resolution (the smallest distance that can be seen between 2 dots or lines) is a factor of not only its NA but also the wavelength of light used. As the NA of an objective increases, resolving power increases, but depth of field and working distance (the distance between the front of the lens and the surface of the cover glass) decrease. 4 The shallow depth of field and short working distance, particularly of a 100× planapochromatic objective, can be very inconvenient in routine histopathologic examination. The resolving power of a lens is its ability to resolve detail (ie, to separate 2 closely adjacent points), and this is usually expressed in lines/mm.
Often overlooked is the role of the condenser. The function of the condenser is to concentrate or focus the light from the lamp house onto the plane of the specimen. Within physiologic limits, the more light illuminating the specimen, the better the resolution of the image by the eye. 4 To obtain optimal performance from apochromatic and fluorite objectives, the condenser should also be highly corrected, usually an achromatic-aplanatic with an NA that matches or exceeds those of the objective used. This means an NA = 0.95 for dry objectives and an NA = 1.2 to 1.4 for oil immersion objectives. However, in the case of oil immersion objectives, if the condenser is not immersed, the term used to indicate that oil has been placed between the top surface of the condenser lens and the bottom surface of the slide (effectively transmitting light rays in the optical equivalent of glass), because of the air gap, the effective NA of the condenser and objective cannot exceed 0.95, even if the condenser or objective is engraved with a higher NA. Failure to immerse a condenser prevents objectives with NAs exceeding 0.95 from realizing their maximum resolution and, as a result, their maximum permissible magnification (MPM). Many of the highly corrected condensers can be inconvenient to use for routine histopathologic examination. They can be sensitive to less than optimal adjustment of the microscope and may not have a “flip-out” top lens and be capable of illuminating the whole field of view of low-power objectives. Less well-corrected condensers such as achromatic ones, besides being low in contrast, may not produce an evenly illuminated field of view. Some digital photomicrographic cameras have software to eliminate this defect from the final image, a particularly useful feature.
Adequate contrast has been a significant problem with low-power objectives, because until relatively recently, these were available only as achromats, which are not fully corrected for chromatic aberration and have poor contrast. Adding to the low-contrast problem, many of these objectives did not have antireflective coating. At low magnifications, the nuclei of cells in stained sections occupy only a small percentage of the image, reducing the contrast between the nuclei and cytoplasm. If apochromatic objectives are not available and achromatic lenses must be used, there are computer programs that are remarkably effective at “enhancing” contrast of the captured image, but the effect of this should be evaluated carefully to ensure that the grayscale contrast between the stained tissue components of the section is not changed inappropriately (eg, the GSVs of a chromogen and hematoxylin counterstain in an immunohistochemical stain). The choice of apochromatic or at least fluorite objectives in conjunction with an appropriately well-corrected condenser for low-power photomicrography is frequently overlooked at the time of purchase of a microscope.
Adequate illumination of a specimen, particularly with 40× and 100× objectives, has been a problem since the inception of bright-field microscopy. Koehler illumination focuses a small light source such as the flame of a candle onto the plane of the specimen. Later, this was followed by incandescent bulbs, which did not deliver adequate light at high magnifications unless they were used at a higher voltage than that for which they were designed (overrun) (eg, operating a 6-volt bulb at 7 volts), shortening its life. These were followed by halogen bulbs, which were a marked improvement in light output and also generated less heat. Recently, light-emitting diodes (LEDs) have been introduced as a light source. They have the advantages of high light output, constant color temperature even when the light is dimmed, and long life.
Differentiation
A critical step in many of the empirical stains that still form the backbone of routine stains used in histopathology is differentiation. Correct differentiation affects the specificity, visibility, and contrast of a target tissue by obtaining optimal color and grayscale contrast. These factors facilitate histopathological examination and are essential for good photomicrography. There are 3 different types of differentiation (Figs. 4, 6–24). First, the differentiating agent removes a dye completely from a tissue component (eg, in hematoxylin, LFB, and trichrome stains). Hematoxylin is removed from cell cytoplasm, LFB is removed from all nonmyelin neural tissues, and in the trichrome stain, the “plasma stain” is removed from all noncollagenous structures. In the second type, differentiation removes some of the dye at different rates from a tissue, producing tinctorial differences and different gray scale values. The classic example is eosin staining, where differentiation of the eosin in 95% alcohol results in different densities (GSVs) of pinks and reds in collagen, muscle, keratin, plasma, thyroid colloid, erythrocytes, and cell cytoplasm (Figs. 4, 9). The third category is really decolorization, where a dye, usually a counterstain, is removed uniformly from the section to reveal the target tissue. Examples are toluidine blue for metachromasia (Fig. 6a,b), methylene blue counterstain in the Ziehl-Neelsen technique for acid-fast bacilli (Fig. 7), and cresyl fast violet for Nissl substance in neurons (Fig. 8a,b). Differentiation depends on the skill of a histotechnician or the standardization of the technique. Understanding the sequential changes in the stained section during differentiation and the criteria for the end point are essential if either underdifferentiation or overdifferentiation is to be recognized. The end point of differentiation can be accurately and easily described by stating the desired density grayscale value.
Used precisely, differentiation and decolorization are not synonyms. Decolorization means that a dye is removed uniformly and progressively from all tissues of a stained section. Differentiation also means removal of a dye from a section but with the difference that removal is at different rates from different tissues or cells, with the result that there are observable tinctorial differences between tissue components. In practice, differentiation and decolorization are often used interchangeably, and sometimes it is difficult to know exactly which term is correct. For convenience, in this article, the term differentiation will be applied to both processes. In the toluidine blue method for metachromasia, mast cell granules stain deep purple and the background tissues blue (orthochromatically). Toluidine blue is progressively removed from the densely blue stained background tissue until it is light blue and the purple metachromatic mast cell granules are clearly visible (Fig. 6a,b). Although there is a color difference between the mast cell granules and the background tissue, this is a result of the metachromatic reaction and not differential removal of the dye from different tissues. It is understandable that this process has been regarded as a true differentiation as the purple metachromatic granules become visible with the gradual removal of the toluidine blue from the tissue. In the Ziehl-Neelsen acid-fast technique, removal of a dense methylene blue counterstain to expose red acid-fast bacilli is often called differentiation, but it is really decolorization.
Because differentiation involves removal of a dye from a section, it controls the final grayscale contrast of the colors and, as in the case of the acid-fast technique, this contrast may not appear natural as the grayscale values of the 2 colors are different from those of pure spectral colors (Fig. 3a,b), where the blue has a higher grayscale value than the red. In the Ziehl-Neelsen stain, this is reversed, and the blue has a lower GSV to reveal the saturated red bacilli. Common stains that require differentiation (including decolorization) are HE, LFB, acid fast, cresyl fast violet (CFV), trichrome, and toluidine blue.
Hematoxylin and Eosin
The interrelationship of the colors and GSVs of HE is illustrated in Figs. 4 and 9 to 17. Figure 3b illustrates that the grayscale value of spectral blue is higher than that of the spectral red, and this is what is perceived intuitively as being the natural relationship. In a well-differentiated HE-stained section (Figs. 9, 15–17) hematoxylin and eosin have this relationship. Hematoxylin-stained nuclei have grayscale values of 7 to 9 depending on the type of hematoxylin, and those of the eosinophilic structures range from 5 to 6. This makes for a very pleasing image with excellent color and grayscale contrast. If the initial hematoxylin staining is weak or overdifferentiated, the grayscale contrast between it and the eosin-stained structures will be reduced or lost (Figs. 10, 11).
Hematoxylin
Despite its being almost 150 years since hematoxylin was introduced for the staining of tissue, failure to obtain optimal results is still a problem. In 1992, Luna 16(p71) stated, “I estimate that 80% of the H&E slides worldwide are not stained to optimum.” This percentage has probably fallen since the introduction of automatic slide stainers, but suboptimally stained HE images are not uncommon at conferences, in published photomicrographs, and in histological slides exchanged for consultation. Part of this is the result of a failure to recognize the criteria for optimal HE staining and because of the belief that personal preference is a big factor. While the latter is true to some extent, it is possible to clearly state criteria in harmony with the basic principles of physiology, physics, and psychology that apply to the visibility of tissues and lesions. These should form the basis for criteria used to evaluate the visibility and contrast of cells and tissues in HE-stained sections.
The name used for the staining technique, hematoxylin and eosin, is actually a misnomer. Hematoxylin is a natural product derived from the logwood tree (Haematoxylum campechianum), a Central American tree. That dye does not stain until it has gone through a 2-step procedure, an initial oxidation followed by attachment to a mordant. Oxidation can be either natural, by exposure to air and sunlight, or by the addition of an oxidizer (mercuric chloride, potassium permanganate, and sodium iodide have been used) to form hematein. Hematein does not stain until it has been attached to a metal mordant, a component that links the hematein to the tissue. The 2 common mordants for use with hematoxylin are iron and alum. Alum hematoxylin is used routinely in the HE stain, which would more appropriately be termed aluminum-hematein-eosin. European publications routinely refer to HE as “hematein and eosin.”
The type of mordant is important because it determines the final color and maximum density of the stained nuclei and thus the contrast between the hematoxylin and the eosin in HE-stained slides. Iron hematoxylin stains nuclei black and alum hematoxylins stain them blue, but the final blue color of alum hematoxylin-stained nuclei varies with the formulation of the mordant, from blue-black to purple with Harris’s hematoxylin, deep blue with Gill’s #2, to mid to light blue with Mayer’s hematoxylin. In a section with properly differentiated nuclei, Harris’s hematoxylin produces the highest grayscale value of the alum hematoxylins. However because it contains mercury and there have been concerns about its toxicity, its use has been generally discontinued, and it has been replaced by an alum hematoxylin such as Gill’s #2, which stains nuclei deep blue but can only produce a grayscale value of approximately 7. Iron hematoxylin, which stains nuclei black, produces the densest grayscale value (GSV= 9), but it is an inconvenient procedure and its use is confined to those special stains where hematoxylin would be removed in later steps of the procedure (eg, in the trichrome stain, differentiation with phosphotungstic acid removes alum hematoxylin from nuclei). Thus, in terms of grayscale values, Weigert’s iron hematoxylin, Harris’s hematoxylin, Gill’s #2, and Mayer’s hematoxylin in optimally stained sections produce grayscale values in nuclei of 9, 8, 7, and 5 to 6, respectively, in a 10-step grayscale (Fig. 1).
Hematoxylins can also be classified by whether staining is progressive or regressive. With progressive hematoxylin staining (such as Mayer’s, which is frequently used as a counterstain in immunohistochemical techniques), the density of the hematoxylin staining increases with time, and the process is stopped at the desired point, an important factor that allows fine control of the grayscale values of nuclei.
With regressive staining, the procedure used in routine HE staining, all the tissues are overstained so that both nuclei and cytoplasm are blue (Figs. 12, 13). The section is then differentiated in acid alcohol and hematoxylin is removed differentially, initially from the cytoplasm and then later from the nuclei. The usual criterion for the end point of differentiation is that the cytoplasm is colorless. This is not entirely accurate. Cytoplasm of cells undergoing protein synthesis has active rough endoplasmic reticulum (RER), which stains with hematoxylin. RER is prominent in pancreatic acinar cells, porcine hepatocytes, plasma cells, and regenerating and actively proliferating cells such as malignant cells. In a correctly differentiated nucleus, excess hematoxylin has been removed to reveal detail in the chromatin and the nucleolus (Fig. 16). In an HE section, tissue stained by both hematoxylin and eosin is frequently described as being “amphophilic,” but the question is whether this is legitimate or due to failure to differentiate the hematoxylin adequately (Figs. 12, 13). Therefore, before describing a tissue as amphophilic, the cytoplasmic staining of other cells and tissues should be checked. A blue tinge in the cytoplasm of different cells and tissues not actively involved in protein synthesis clearly indicates inadequate differentiation of hematoxylin. An easy method for evaluating hematoxylin differentiation is to examine a slide run through the staining process without being counterstained with eosin. Correct differentiation is essential to allow interior nuclear morphology to be evaluated and for the maximum contrast between nuclei and cytoplasm (Fig. 16).
Eosin
Personal preferences regarding what constitutes optimal eosin staining and the procedure to obtain correct differentiation of eosin vary with different authors. Standardized criteria for correct differentiation can be specified.
Luna 16(pp73,87) is precise and specifies that differentiation takes place in 95% alcohol and that 3 baths should be used, that immersion in each bath should be for the same length of time the slides were in the eosin solution, and that this “assures good and proper differentiation.” It is the staining time in eosin, not the differentiation time, that determines the density of the eosin staining. Examples he gives are 30 seconds for light eosin staining, 1 minute for medium and 2 minutes for deeper eosin staining, and then the same times in each of the 3 baths of 95% alcohol for full differentiation. The procedure works extremely well in our laboratory, over a wide range of tissues from a wide range of domestic and exotic animals. Slides should go directly from the eosin solution into the 95% alcohol. A water wash or immersion in 70% alcohol after staining in the eosin solution does remove eosin but not at different rates from different tissues, and thus there is little or no differential staining—just a general reduction in the density of the eosin. The more dilute the alcohol, the more eosin removed. 7(pp95,96) Differentiation in 95% alcohol results in tinctorial differences in different tissues—different pinks and reds in muscle, collagen, cytoplasm of epithelial cells and bronchial epithelium, epidermal keratin, and erythrocytes (Fig. 9), which facilitate recognition of these tissues and cells on microscopic examination. The criterion that Luna 16(p87) proposed to define correct differentiation was the staining of the nucleolus (Fig. 16). In mast cells, this should be red or reddish-purple. However, the most obvious evidence of correct eosin differentiation is the tinctorial differences between muscle and collagen. 16(p87) These also have different grayscale values, and the combination of color differences and their associated grayscale values increases visual contrast. This is helpful in microscopic examination but essential in photomicrography, particularly black and white photomicrography, which depends on tissues having different grayscale values for their recognition in a black and white print (Fig. 4). If differentially eosin-stained structures with their different pinks and reds and their corresponding grayscale values are not visible in the stained section, there is no way that their loss can be remedied in a photomicrograph by using a program such as Adobe Photoshop (Figs. 10, 14, 15, 18).
HE; kidney, avian. Inadequately differentiated eosin stain: the eosin-stained cytoplasm is too dense, and different cells and tissues lack tinctorial differences.
Phloxine
It was not uncommon decades ago, for histotechnicians who found that the eosin staining was light or dingy on microscopic examination of freshly stained HE-stained sections, to dip them into a dilute phloxine solution to “brighten up the eosin.” This type of enhancement is misleading to the pathologist who expects a standardized eosin staining. However, phloxine is used in an eosin-phloxine mixture as a counterstain for hematoxylin. Phloxine staining increases the density of red-stained structures but has 2 severe penalties. It deposits a magenta cast over the whole section, reducing or obscuring the different pinks and reds, which are the result of differentiation of the eosin (Figs. 9, 18). This is particularly deleterious if the eosin-phloxine is not differentiated sufficiently 16(p90) and overstaining can cause staining of the nuclei. 7(pp95,96) Phloxine also markedly increases the grayscale values of all eosinophilic tissues, thus reducing the grayscale contrasts between them and the hematoxylin-stained nuclei. If different phloxine-stained structures have similar grayscale values, it will also be impossible to make good-quality black and white photomicrographs, and the color photomicrographs will also have reduced contrast, both color and grayscale.
There are occasions when eosin-phloxine staining has advantages. Luna 16(p87) reports that some eosinophilic inclusion bodies stain more visibly than with eosin alone. Occasionally, formalin-fixed skeletal muscle will not stain well with eosin, thus making it difficult to see the shape and the dimensions of the muscle fibers in cross section. Phloxine staining will add to the density of the staining of the myofiber. This problem is also solved by using a trichrome stain, where in Masson’s technique, the muscle fibers are stained deep red with Biebrich scarlet. A similar failure to stain adequately can be seen in cross sections of fibrous tissue such as tendons and old scars. Just because certain tissues do not stain well with eosin is no justification for using an eosin-phloxine staining mixture as the routine “HE” stain. Necrotic tissues and tissues that have undergone prolonged fixation in acid formalin or acid decalcification and as a result have lost much of their differential staining with eosin are still more visible in HE stains without phloxine. Also in these cases, the density of eosin staining can be increased and the differential staining retained by choosing a longer staining time, followed by a similar increase in the time of differentiation.
It is not unusual to see at conferences projected images of “HE” sections with uniformly deeply magenta eosinophilic tissues (GSV = 6–7), the result of an eosin-phloxine counterstain. Their lack of color and grayscale contrast is most evident at low magnifications, particularly in sections of the central nervous system (CNS), where nuclei of cells are normally sparse. In these sections, there is little color difference between white and gray matter, resulting in large areas of magenta-stained neuropil, justifying the use of the appellation “vast pink wasteland.” A well-differentiated HE stain of the CNS results in clear differences both tinctorially and in grayscale between the white and gray matter. In addition, because the neuropil in an eosin-stained section has a lower grayscale value than in an eosin-phloxine–stained one, nuclei are visible at low magnifications.
Luxol Fast Blue
LFB was introduced by Klüver and Barrera 14 in 1953 for the staining of myelin and, because of its specificity and convenience, has replaced iron hematoxylin myelin methods such as Weigert, Weil-Weigert, and Weigert-Pal. LFB is a regressive method. Initially, both the white and gray matter of the CNS are overstained with LFB, and both white and gray matter are stained blue (Fig. 19) and then differentiated in 0.05% lithium carbonate for 10 to 30 seconds followed by 70% ethanol. This sequence removes the LFB from the gray matter, leaving only the myelin stained (Fig. 20). As a guide to the location of white matter to be checked during differentiation, histotechnicians use the fact that gray matter is on the outside of the cerebral hemispheres and cerebellum and inside the spinal cord. Consequently, during differentiation, LFB is normally removed first from the outside of the cerebral hemispheres and the center of the spinal cord. This is a useful rule of thumb except when the myelin in the CNS is defective or has been lost. In globoid cell leukodystrophy, LFB is removed from the defective white matter before the gray matter, causing confusion in selecting the end point of differentiation (Fig. 21). Microscopic examination during differentiation is essential to check that gray matter has been adequately differentiated, whatever the LFB staining of the white matter is. Differentiation can be so inadequate that white and gray are stained the same dense blue (Fig. 19). If the section is not differentiated after the first bath in 0.05% lithium carbonate, a frequent mistake is to try to remove LFB from the gray matter by a prolonged immersion in 0.05% lithium carbonate or by using a higher concentration of lithium carbonate, but even these do not differentially remove the stain. Differentiation of LFB is a 2-step procedure that requires an initial bath in 0.05% lithium carbonate followed by 70% alcohol. In other words, if the LFB is not differentiated in the initial pass through the 0.05% lithium carbonate/70% alcohol sequence, then this same sequence should be repeated until there is good differentiation between the gray and white matter and LFB staining is confined to the myelin.
LFB-stained sections do not have as much grayscale contrast as the old iron hematoxylin stains such as Weil-Weigert and Weigert-Pal. With the latter stains, myelin is stained black and the gray matter is pale tan, explaining why in many atlases of the CNS, the white matter is rendered as black and the gray matter as a light gray, which seems counterintuitive. The gray scale value of LFB is a little denser than mid-gray (GSV = 6–7) and varies with the thickness of the section. This is one reason why CNS sections should be cut routinely at 6 to 7 μm and no less than 6 μm. Counterstains used include periodic acid–Schiff (PAS) plus hematoxylin, hematoxylin alone, nuclear fast red (NFR), and CFV. LFB is also used in combination with silver stains to demonstrate axons and their myelin sheaths. The “best” counterstain depends on the intended purpose. For diagnostic histopathology, LFB counterstained with PAS + hematoxylin and eosin is very effective in examining fungal infection as it reveals cellular and fungal details in one section. However, it is less suitable for photomicrography to illustrate changes in myelination because the multiple colors and gray scale values of the different tissues reduce grayscale contrasts. Hematoxylin-stained nuclei (GSV = 7) compete with the blue-stained myelin (GSV = 6). A CFV counterstain stains Nissl substance a dark blue (GSV = 8) (Fig. 8b), which competes with the blue of the LFB (GSV = 6). However, the combination of LFB and CFV with an NFR counterstain is excellent for low-power photomicrographs showing the myelinated tracts and the different foci of neuronal nuclei such as those of the vagal nuclei and olive in a cross section of medulla. For routine histopathology, LFB + NFR (Fig. 20) is a good combination with excellent contrast between the myelinated fibers and the background tissue.
However, there is a problem with the interpretation of the reduction or loss of myelin staining demonstrated by the LFB stain. Without being able to see both the axon and myelin sheath simultaneously, it is not possible to know whether the loss of myelin is a primary or a secondary demyelination (Wallerian degeneration). LFB with a silver axon stain such as the Sevier Munger, with or without an NFR counterstain, is an excellent combination, allowing evaluation of both myelin and axon (Fig. 22). The Sevier Munger stain is a variant of the Bielschowsky technique. Carson 7(p183) comments on how reliable and reproducible this stain is. In our laboratory, the Sevier Munger stain has routinely stained axons of both central and peripheral nervous systems a dense black, whether they were from large or small domestic animals. Some of the more classic silver axon methods stain large animal axons a mid or dark gray and thus with lower contrast. In veterinary medicine, primary demyelination (usually an immune-mediated destruction of the myelin followed later by axonal degeneration and loss) is relatively infrequent, but secondary demyelination (Wallerian degeneration), where the axon is damaged or transected first and is followed by axonal degeneration and loss of myelin in the distal segment, is common. However, without a combination stain such as LFB–Sevier Munger, it is not possible to determine accurately whether loss of myelin is accompanied by axonal changes. For a detailed examination of a nerve or spinal cord, a section should include nerve fibers cut in longitudinal section over a distance of a few millimeters (Fig. 22). Unfortunately, even in an LFB–Sevier Munger–stained section, fine changes in the myelin such as early intramyelinic edema and axonal changes from axonopathies cannot be reliably evaluated, and electron microscopy is essential. 23
Trichrome
The prototype trichrome stain is the 1900 Mallory’s aniline blue stain. 17 In the 1905 version, collagen was stained blue with aniline blue, erythrocytes orange by orange G, and the cytoplasm of other tissues red by acid fuchsin. 18 There was no nuclear stain. Although trichrome means 3 colors, the term is now applied to histologic staining methods that stain collagen a different color from other tissues, and 1 color may be a nuclear stain. They generally use a sequence of a cytoplasmic stain, often called a “plasma” stain, followed by an acid differentiator, usually phosphotungstic or phosphomolybdic or a mixture to remove the “plasma stain” from the collagen, then followed by a collagen fiber stain. 26(p189) The most commonly used variant is Masson’s trichrome, originally described in 1929 (Fig. 23). 19 Orange G was omitted and an iron hematoxylin was added as a nuclear stain. In 1936, Lillie 15(p230) replaced the Ponceau 2R in Masson’s stain with Biebrich scarlet, which became a favorite with its saturated vibrant red. Most modern laboratory manuals use this variant under the name of Masson’s trichrome (Fig. 23). A critical step in most trichrome stains is differentiation. All of the “plasma stain” must be removed from the collagen (Fig. 24), or its final color will be a mixture of blue and red and thus nondiscriminatory between collagen and muscle.
Despite its beauty, Biebrich scarlet has some serious drawbacks. In a stain designed to reveal blue-stained collagen, the red areas attract attention and the aniline-stained collagen is easily overlooked, a reversal of the role of a counterstain. There is excellent color contrast but little grayscale contrast. Aniline blue–stained collagen has a GSV of 8 to 9, and Biebrich scarlet–stained tissues have a GSV of 7 to 8. Mallory 17 recognized this problem in his trichrome method, which used acid fuchsin alone. He stated “if it is decided to bring out the connective tissue as sharply as possible, omit the staining with acid fuchsin. Then the nuclei and the protoplasm are stained yellow and the blue fibrillae and ‘reticulum’ [sic] stand out more prominently.”
There are now more than 100 variants of the trichrome stain, most of them with a different dye as the “plasma” stain for the noncollagenous tissue. This points out the difficulty in choosing a suitable “plasma” stain but which, because it is applied first, is rarely called a counterstain. The major problem of Lillie’s modification is the dominance of the Biebrich scarlet. The trichrome stain is often performed to differentiate between muscle and collagen, but while collagen is stained specifically with aniline blue, the red dye has no specificity for muscle and merely stains all noncollagenous tissues red and yet attracts the most attention.
Light green instead of aniline blue has been recommended as a collagen stain since the 1929 Masson technique (Fig. 25). Carson 7(pp95,96) states that light green is recommended as a counterstain when collagen is predominant, but when only small amounts are present, then aniline blue is better. This is compatible with the grayscale values of these dyes—aniline blue (GSV = 8) and light green (GSV = 6). Thus, light green has the problem of lower contrast, apart from the problem of small numbers of collagen fibers being masked by the Biebrich scarlet. Although Biebrich scarlet is aesthetically pleasing, a counterstain with lower grayscale contrast and less saturation to avoid masking blue- or green-stained collagen fibrils would be more appropriate. The optimal color for the cytoplasmic staining is probably orange. Yellow is the color fully complementary to blue but is not appealing because subconsciously it is associated with weakness and thus inappropriate to depict collagen, which implies strength. Orange, which is adjacent to red in the color triangle (Fig. 3a), has good color contrast, and a light orange would have good grayscale contrast. In summary, a trichrome stain with an orange or light red “plasma” stain and aniline blue–stained collagen would have the most color and grayscale contrast and be the most sensitive in demonstrating collagen.
Background Staining in Silver Stains
Although the expression “silver stains” is used, there are actually 5 different mechanisms by which silver is deposited in different structures. In each case, the objective is to stain the target tissues strongly with silver and the other tissues lightly or not at all. Background tissues are better revealed by a contrasting counterstain not by light silver deposits. Silver stains are notoriously fickle, and a desirable degree of contrast between the target tissue and background tissue is not always obtained. For some silver staining techniques, there is little advice on how to prevent background tissue staining.
Briefly, the 5 types of silver “staining” recognized are as follows. 12
Argentaffin. This depends on the presence in the tissues of certain chemical groups in the tissue able to reduce ionic silver in ammoniacal silver solutions. Argentaffin structures include argentaffin cells, melanin, and some carcinoids. Fontana-Masson is an example of a stain of this type.
Argyrophilic. Structures such as neuroendocrine secretory granules, spirochetes, and bacteria absorb silver ions from a silver solution, and then, by the addition of a reducing agent, these are converted to elemental silver. The modified Steiner stain for bacteria is an argyrophilic stain.
Impregnation. These stains include the classical 19th-century methods used to demonstrate neurites, astrocytes, and microglia and depend on the formation of silver “seeds” by an argentaffin reaction and then amplification of these sites by the absorption of silver, which then become visible microscopically. Bodian’s stain and variants such as Sevier Munger and Bielschowsky are examples.
Oxidative-methenamine silver methods. The 1,2-glycol linkages in carbohydrates are oxidized to form aldehydes, which are then labeled with methenamine silver. The oxidative-Schiff technique uses the same basic mechanism (discussed below).
Immuno gold method. This is in immunohistochemical method in which gold is the label attached to the primary antibody, which is attached to a specific cellular component. The gold particles act as “nuclei” for the deposition of silver, which renders the sites visible microscopically.
Oxidative-methenamine silver methods and silver reticulum stains will be discussed here as examples of the problem of silver staining of background tissues and the resultant reduction in visibility of the target tissue.
Oxidative-Methenamine Silver and Oxidative-Schiff Methods
Although the oxidative-Schiff reactions are not silver “stains,” because their mechanism is similar to that of the oxidative-methenamine silver technique, they will be included in this discussion. From their names—PAS, Gomoi’s methenamine silver, Grocott’s application of Gomori’s methenamine silver (GMS), Bauer’s chromic acid–Schiff, Jones’s periodic acid–methenamine silver (PAMS), Castella’s potassium permanganate-Schiff reaction, and Gordon and Sweets’s reticulum stain—the reader would not automatically recognize that they share a common basic mechanism. This involves oxidation to expose the sites of 1,2-glycol linkages, present in carbohydrates in many tissues and in fungi. The highest concentrations are in fungi, glycogen, and some types of mucus, and lower concentrations are present in reticulin and basement membranes (Figs. 26–33). First, 1,2-glycol linkages are oxidized by periodic acid, chromic acid, or permanganate. Periodic acid is a milder oxidizer than chromic acid and does not destroy aldehydes once they are formed. 22,26(p164) In contrast, chromic acid is a powerful oxidizer and not only releases aldehyde groups but then breaks them down so they are not available to react with the Schiff’s reagent or methenamine silver. For this reason, background tissues such as reticulum and basement membranes and those carbohydrates that have low concentrations of 1,2-glycol linkages often do not stain. Fungal walls, which have higher concentrations than the background tissue, still have aldehyde groups after oxidation, and these stain with Schiff’s reagent and methenamine silver. Thus, by the selection of a mild or vigorous oxidizer (periodic acid or chromic acid) and the duration of oxidation, stains have been devised to preferentially display reticulin and basement membranes, on one hand, and glycogen, mucus, and fungi, on the other.
Pearse 22(p832) states that in the PAS reaction, a 5-minute oxidation time in periodic acid has been found to produce the maximum concentration of aldehyde groups and consequently the highest concentration of Schiff-positive material (variously described as red, reddish purple, reddish violet, and magenta) in tissues (Fig. 28a,b). The relationship between the actual concentration of glycogen in the tissue and the concentration of Schiff-positive material is linear only at low concentrations of glycogen. This is possibly because the molecules of Schiff’s reagent, which have already reacted with aldehyde groupings, are large enough to block the access of further Schiff’s reagent to other aldehyde groupings. Because the PAS reaction demonstrates more Schiff-positive glycogen than the Bauer and Castella techniques, which use chromic acid and potassium permanganate, respectively, as an oxidizer, the latter have fallen into disuse.
Grocott’s Modification of Gomori’s Methenamine Silver Stain
The Gomori’s silver methenamine reaction was introduced in 1946 at approximately the same time as the PAS reaction by Hotchkiss and McManus as a “stain” for glycogen. 15(p700) Oxidation of the 1,2-glycol linkages, mainly in carbohydrates, is carried out by chromic acid. Chromic acid is the same oxidizer used in the 1932 method of Bauer for glycogen (chromic acid–Schiff), but Gomori’s technique uses methenamine silver instead of the Schiff’s reagent as the indicator for aldehydes. 9 This stain has not been popular for demonstrating glycogen. It is more complicated than the PAS, and the black silver deposits are often sufficiently concentrated to obscure any detail in the cell. Also, the PAS, with its purplish Schiff reagent, is visually more appealing. Grocott applied Gomori’s methenamine silver to demonstrate fungi, thus leading to confusion as to whether the “G” in “GMS” indicates “Gomori” or “Grocott.” In the literature, the abbreviation is used for both names. Grocott’s method should probably be designated “Grocott’s application of the Gomori methenamine silver method” or “Grocott’s modification of Gomori’s methenamine silver method.” 27
The fact that in Grocott’s method, oxidation by chromic acid destroys some of the aldehyde groups is an advantage. Fungal walls contain large amounts of 1,2-glycol groups, and because most of the aldehyde groups in the nonfungal tissues are destroyed and not available to stain with methenamine silver, background tissue staining is reduced and makes the brown-black fungi more prominent and easier to detect. Another advantage of the destruction of aldehydes in the fungal walls is that they do not stain as intensely black, and consequently, it is possible to see some detail such as septa in the hyphae of the fungus. Thus, the GMS reaction is superior to the PAS for the detection and identification of fungi. It also reveals dead fungi presumably because some of their originally high concentration of carbohydrate remains and the black silver-stained fungi are highly visible.
The visibility of a fungus is maximized if the incubation time in the silver solution is monitored microscopically to prevent silver being deposited in the background tissues. Sections are removed periodically from the silver methenamine bath, examined microscopically, and finally removed after the fungus has been stained but before there are significant deposits of silver in the background tissues. Many of the methods for the GMS stain describe removing the slides when the section has been stained “light tan.” However this gross appearance of a section is not always reliable, and sections may be “overincubated” in the silver solution, with the result that nuclei and cytoplasm stain. While a little background staining is probably not a disadvantage for diagnostic examination, since it is an indicator that there has been adequate incubation time for the fungus to stain, it is a disadvantage in photomicrography. When absolutely optimal staining is required, as for example in photomicrography for publication, serial sections should be incubated and then removed sequentially so that sections range from barely adequate to overstained. Some species of fungi require extended incubation times in silver, and the penalty is black silver staining of the background tissue. Background staining can be a problem with other silver stains.
Reticulum and Basement Membranes
Reticulum stains facilitate the evaluation of reticulum, which is useful in the diagnosis of certain tumors, differentiation of hepatic lobules from regeneration nodules, and changes in basement membranes of renal glomeruli and tubular epithelium in renal diseases. Reticular fibers are found chiefly in highly cellular organs such as liver, spleen, and lymph node, where they are supportive of the parenchyma. They are usually not visible in HE-stained sections. Reticular fibers are composed of a 3-dimensional network of type III collagen fibers and abundant interfibrillar carbohydrate. Basement membranes consist of 2 fused layers—the basal lamina and the reticular lamina. The basal lamina also has 2 layers: the lamina lucida and the lamina densa. The lamina densa contains abundant carbohydrate and type IV collagen, which does not form fibrils.
Both reticulum and basement membranes are stained by oxidative-Schiff and oxidative-methenamine silver techniques, such as the PAS reaction and silver reticulum stains, respectively. The basic mechanism is similar: oxidation of hydroxyl groups and cleavage of 1,2-glycol linkages in the carbohydrate molecule with the formation of free aldehydes, which are labeled by the Schiff’s reagent in the PAS stain and by silver in the silver reticulum stains. In the latter, it is thought that silver uptake may also be caused by a nonspecific binding of silver cations to still resident aldehydes in the tissue.
Deposition of silver in background tissue is a serious problem and is not easy to control consistently (Figs. 31, 33). Recommendations include using the Gordon and Sweets’s technique, not allowing the silver impregnation solution to drop below a pH of 11, 7(p147) and replacing the 10% silver nitrate used in the preparation of the ammoniacal silver solution with 1% silver nitrate. 27 Also, although reduction in 10% neutral formalin is very quick (30–60 seconds are recommended), serial sections can be removed sequentially from 20 to 60 seconds and after mounting, the best one selected by microscopic examination.
Counterstains
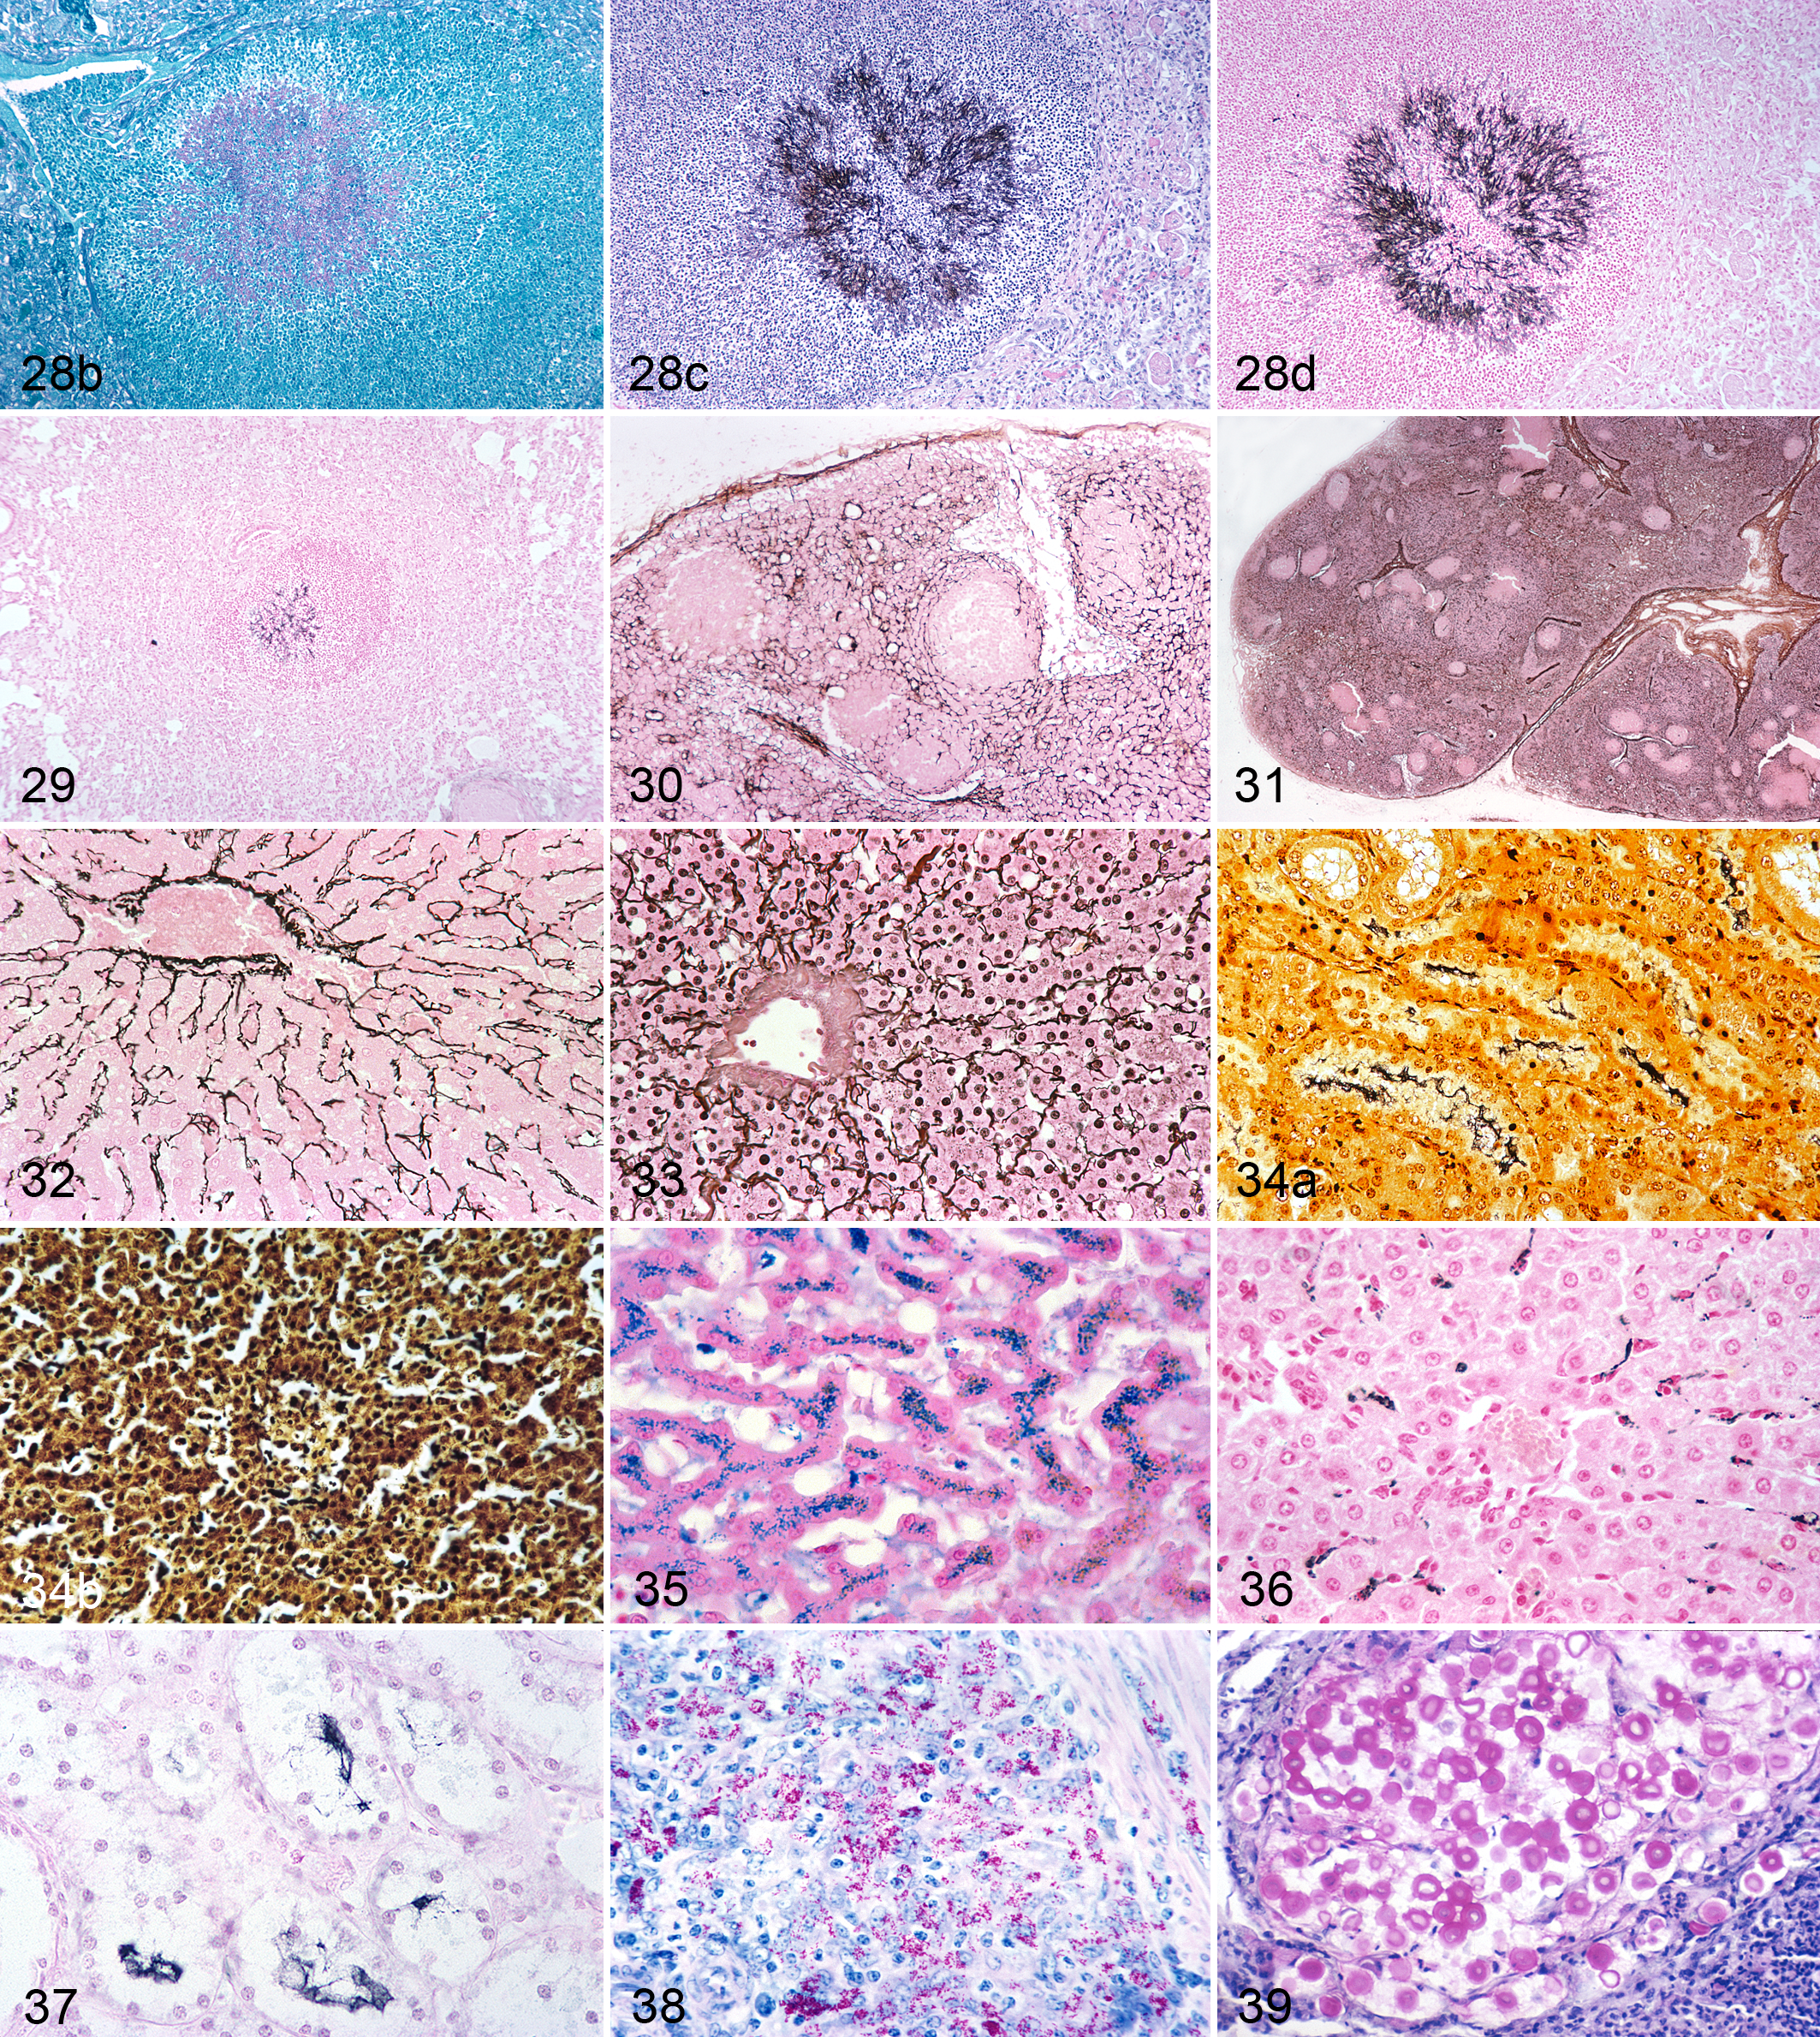
While it is often stated that the major purpose of a counterstain is to enhance the visibility of the target tissue, there are actually 2 different scenarios. These were alluded to by Grocott 11 when he recommended counterstains for the GMS technique. He stated, “Aqueous safranin [nuclear fast red would be today’s equivalent] may be used if a red nuclear stain is desired or a light hematoxylin and eosin combination may be used if tissue detail is important.” For routine histopathological examination, it is desirable to have as much detail as possible in one section to facilitate examination of the relationship between the “target” tissue, in this case the fungus, and the background tissue. Both the PAS and GMS stain for fungi have been combined with an HE counterstain to allow the pathologist to evaluate the tissue response. In the GMS + HE combination (Fig. 28c), different tissue components stain different colors (brown to black fungi, blue nuclei, and pink background tissue) and have different grayscale values, but the contrast between the target tissue, in this case the fungus, and the different background tissues is less than with a counterstain of a single dye such as NFR (Figs. 28d, 29). For example, there is little difference in grayscale value between silver-stained fungal hyphae and hematoxylin-stained nuclei (Fig. 28c). In the PAS stain, there is considerable pink background staining, and with an HE counterstain, the eosin is deposited over the pink-stained tissue, increasing its grayscale value and thus decreasing the grayscale contrast between it and the fungus (Fig. 28a). Thus, the counterstain suitable for microscopic diagnosis may not be the most suitable for photomicrography.
A counterstain for scanning for fungi in a GMS-stained section requires maximum contrast and visibility to aid in detection. In a GMS-NFR–counterstained section, the gray scale values for the fungi and the background are approximately 8 to 9 and 4, respectively, and because of this excellent grayscale contrast and color contrast (black vs pink), small number of fungi such as Mucor (Fig. 29) and even small fungi such as Histoplasma and Blastomyces are detectable during scanning with a 4× objective (Fig. 29). Counterstains used for GMS include light green, HE, and NFR (Fig. 28c,d). Visibility of microorganisms is reduced particularly if the section has been overstained with silver and nuclei have visible silver deposits (Fig. 34a,b). NFR is not a popular counterstain for routine GMS stains, perhaps for the psychological reason that it appears “weak.” Light green is often preferred even though it has low color contrast (blue-black vs green), and grayscale contrast between the fungus and the background tissue is barely adequate unless the light green counterstaining is minimal—just enough to give detail in the background tissue. Light green also has the disadvantage that nuclei are not as well rendered as with NFR.
It is usual for an author describing a new staining technique to nominate a counterstain, often selected intuitively. Frequently, a complementary or almost complementary color is chosen. The result is that most counterstains are either red or blue. In the first half of the 20th century, similar colored dyes or the same dye (eg, neutral red at different dilutions and for different staining times) were used as counterstains in different techniques. The end results were similar histologically, but multiple dilutions of the different dyes were kept in the laboratory—a real inconvenience. Rationalization of counterstains was one of the major contributions of the early editions of the Armed Forces Institute of Pathology (AFIP) manuals, 3 and NFR at 1 concentration and for 1 staining time replaced a variety of red dyes of different concentrations with different staining times. However, because the original article is often regarded as almost sacrosanct, acceptance of a more appropriate counterstain is usually slow.
Selection of a Counterstain
Some techniques recommend a single or a variety of counterstains, but sometimes there is the statement “counterstain as desired.” Precise instructions on the final grayscale value and thus the end point of differentiation are rare. Sequential steps in choosing a counterstain are as follows:
Determine whether the objective is to facilitate histopathologic interpretation (eg, HE as a counterstain for PAS and GMS) (Fig. 28a,c) or whether maximum contrast is required to facilitate scanning or photomicrography of a target tissue (eg, NFR with GMS for fungi) (Fig. 29).
Determine the color (hue) of the primary stain.
Select from the color triangle, a counterstain that is a complementary or almost a complementary color (Fig. 3a).
Select staining and differentiation times so that the background tissue is less dense (lower grayscale value) than that of the primary stain to ensure good grayscale contrast and that there is no masking of the target.
Secondary considerations include whether the counterstain will change the color of the primary stain and whether it is durable.
Unfortunately, there may not be a dye available that has both optimal color and grayscale contrast, as for example, in the trichrome and many immunopathology stains.
Nuclear Fast Red
NFR is the optimal counterstain for many blue or black primary stains (Figs. 35–37). It is commonly used in the Perls’s Prussian blue (Fig. 35), silver reticulin (Fig. 30, 32), von Kossa, and Alcian blue stains and is excellent for GMS (Fig. 28d) and LFB (Figs. 20, 22). Thompson and Hunt 28 list it as a counterstain in 24 different techniques. It reveals the morphology of the background tissue well: cytoplasm is a faint pink and nuclei a slightly more saturated reddish-pink. This color is almost complementary to the brown-black or blue-black of silver stains, and because of NFR’s low grayscale value (GSV = 4), there is excellent grayscale contrast. NFR has replaced the originally recommended neutral red and eosin. It does have a disadvantage: it is not a bold color and is perceived subconsciously by many as being psychologically “weak.” Frequently, light green is preferred as a counterstain for the GMS, even though it has less color contrast (green vs the brown-black of the silver) and also has the disadvantage that it does reveal detail in the background tissue as well as NFR, which, even with extended staining times, produces a relatively low grayscale value. In contrast, overstaining with light green causes a dense green background, which can raise its grayscale value (Fig. 28b).
Methylene Blue Counterstain for Acid-Fast Stain (Ziehl-Neelsen)
This is a classic example of the importance of the density (grayscale value) of the counterstain and how it affects the contrast between background tissues and the target. Inadequate differentiation of the methylene blue counterstain results in an overly dense background, which reduces the grayscale contrast between it and the acid-fast bacteria. Carson 7(p183) indicates that the density of the background staining by methylene blue is critical and that overstaining with it can “mask any organisms present” 7(p183) and that the background should be decolorized until it is “very light” or “sky blue” (equivalent to GSV = 3–4). The red acid-fast organisms are then readily visible (Fig. 6).
Hematoxylin
Hematoxylin is used as a counterstain, particularly in immunohistochemistry, but also in the PAS reaction (Fig. 26), Congo red staining for amyloid, acid-fast bacteria (Fig. 38), and Mayer’s mucicarmine stain for Cryptococcus (Fig. 39). To achieve a good contrast with the target tissue, the density of the hematoxylin must be reduced from that used in routine HE staining, to less than a mid-gray value (GSV = 5). The easiest way to do this is by using a progressive hematoxylin stain such as Mayer’s. The slide is removed from the staining bath when the desired density is reached. For maximum visibility of nuclei in HE-stained sections at very low magnifications, specifically for photomicrography, it may be necessary to use iron hematoxylin or Harris’s hematoxylin, which are able to produce dense grayscale values (9 and 8, respectively). Merely increasing the density of the hematoxylin staining of nuclei by reducing differentiation time is not an option. In underdifferentiation, nuclear staining density may be high, but internal nuclear detail will be obscured by hematoxylin deposits, and the cytoplasm will be stained blue (Fig. 12), thus reducing the grayscale and color contrast between the nuclei and cytoplasm.
Immunohistochemical stain for CD3. DAB chromogen and hematoxylin counterstain. (a) Lymph node. (b) Lymphoma. Both color and grayscale contrasts are low. To preserve grayscale contrast, the density of the hematoxylin counterstain must be less than that of the chromogen and the microscope’s clear background rendered as a GSV of 2, just discernible as a faint gray from the white paper.
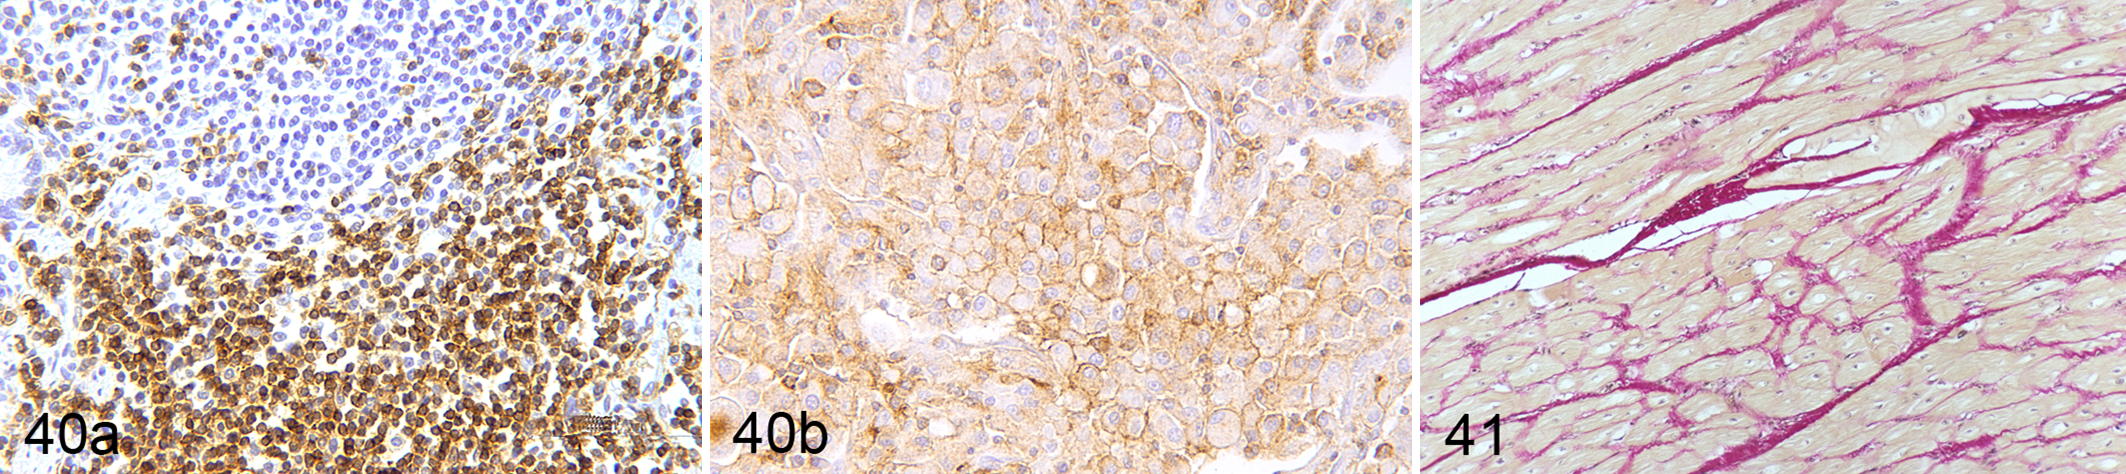
Mayer’s hematoxylin, which produces light blue–stained nuclei and a faint light blue cytoplasm, is a progressive stain whose depth of staining is easy to control. It is frequently used as a counterstain in immunohistochemistry (Fig. 40a,b). Immunohistochemistry is designed to demonstrate sites of specific antigens on cells or tissues by antibodies tagged to a label (horseradish peroxidase, alkaline phosphatase) or a fluorescent dye. Red, brown, green, and black chromogens have been used, but the chromogens commonly used in bright-field immunohistochemistry are DAB (3,3′-diaminobenzidine) and AEC (3-amino-9-ethylcarbazole), which are brown and red, respectively. As they do not have dense gray scale values (just above a mid-gray [GSV = 6–7]) and labeled cells often occupy only a small percentage of the microscope’s field, image contrast is low. Because of the relatively low grayscale value of the chromogen, it is essential that the counterstaining of the background tissue be light. Its gray scale value (GSV = 3–4) must be less than that of the chromogen (GSV = 6–7) to have the maximum grayscale contrast possible between it and the chromogen. However, the counterstain must be sufficiently dense to reveal morphologic details in the background tissue. Mayer’s hematoxylin is a suitable counterstain for DAB and AEC. Its staining time is adjusted so the nuclei have a grayscale value of approximately 6 and the cytoplasm is lightly stained (GSV = 3). The result is adequate contrast, but in photomicrographs, it essential that the microscope’s clear background be the faintest gray (GSV = 2–3) to keep the full range of grayscale values at approximately 6–7, 3–4, and 2–3 for the immunolabeled material, counterstained tissue background, and the microscope’s clear background, respectively.
Gill’s or another regressive type of hematoxylin is occasionally recommended because it is quick. Gill’s hematoxylin stains so densely that the staining time is less than a second (one quick dip), but nuclei of some cells may still stain too densely and divert attention away from the immunolabeled cells. The density of nuclear staining is more easily controlled with Mayer’s hematoxylin.
Metanil Yellow and Picric Acid
Yellow counterstains are relatively unpopular but are used in the Brown and Hopp’s variant of the Gram stain, the Gridley fungus stain (Fig. 5), and van Gieson’s method for collagen (Fig. 41). As they do not stain nuclei and have low-density grayscale values, they do not reveal morphologic details well. An iron hematoxylin is routinely used in the van Gieson technique but not in the Gridley fungus stain.
Photomicrographic Prints
Grayscale contrast in a printed photomicrograph is limited by the grayscale values of the white paper (whiteness) and the maximum black of the printer’s ink. Instead of a contrast range of steps 1 to 10 in the visual image, the grayscale on the printed page may range from 2 to 9 or even less. Therefore, to maximize contrast in a printed photomicrograph (black and white or color), the microscope’s clear background must be printed a very faint gray (GSV = 2), which is just discernible from the white of the page (Fig. 4). This is not a matter of personal choice but a necessity so that the rest of the gray scale (steps 3–9) is available for the microscope’s image. HE-stained sections whose grayscale values usually range from 7 to 8 for hematoxylin and 4 to 5 for eosin have good contrast, but for subjects with lower contrast, such as immunohistochemical stains, rendering the microscope’s clear background as a very faint gray on the printed page is essential for preserving the contrast between the chromogen and the counterstain and between the counterstain and the microscope’s clear background.
Conclusions
Visual contrast between the different stained components of the specimen facilitates microscopic examination. Recognizing that there are 2 components to contrast—namely, color and grayscale—and that they should be evaluated separately simplifies determining the source of a problem with contrast. If color contrast of a staining technique is not adequate, another color combination can be selected using the color triangle. Problems with grayscale contrast include inadequate differentiation of the stain, either from failure to remove it completely from one component of the tissue or from inadequate reduction in the density of a counterstain. When the problem involves both grayscale and color contrast, there may be little that can be done. The only alternative may be to choose another staining method.
Understanding the relationship of colors and their grayscale values (Figs. 2, 3) helps one understand some of the subconscious reticence about removing too much color during differentiation. This can be a significant problem in the differentiation of a counterstain whose spectral color naturally has a high grayscale value (eg, blue-violet) when a specific staining technique requires it to be differentiated to a lower density. This may seem counterintuitive. Also, the hierarchy of the importance of colors is ingrained into our unconscious mind, but that hierarchy does not necessarily apply to the importance of a color of a stained component of a histologic section.
Footnotes
Acknowledgements
I am indebted to Robert S. Geske, HTL, for technical advice; Dee Stevenson, HT (ASCP), for the preparation of most of the histological slides used for photomicrography, Sharon Schlosshan for laboratory assistance, and Mary Jane Burnette and Tressie Brown for secretarial assistance.
Declaration of Conflicting Interests
The author(s) declared no potential conflicts of interest with respect to the research, authorship, and/or publication of this article.
Funding
The author(s) received no financial support for the research, authorship, and/or publication of this article.