
Abstract
Histopathologic scoring is a tool by which semiquantitative data can be obtained from tissues. Initially, a thorough understanding of the experimental design, study objectives, and methods is required for the pathologist to appropriately examine tissues and develop lesion scoring approaches. Many principles go into the development of a scoring system such as tissue examination, lesion identification, scoring definitions, and consistency in interpretation. Masking (aka “blinding”) of the pathologist to experimental groups is often necessary to constrain bias, and multiple mechanisms are available. Development of a tissue scoring system requires appreciation of the attributes and limitations of the data (eg, nominal, ordinal, interval, and ratio data) to be evaluated. Incidence, ordinal, and rank methods of tissue scoring are demonstrated along with key principles for statistical analyses and reporting. Validation of a scoring system occurs through 2 principal measures: (1) validation of repeatability and (2) validation of tissue pathobiology. Understanding key principles of tissue scoring can help in the development and/or optimization of scoring systems so as to consistently yield meaningful and valid scoring data.
Through the course of investigation, research laboratories often submit tissues to histopathology cores for tissue processing and examination by a pathologist. 11,27,48 Pathologists provide morphologic assessment of these tissues, including examination for group-specific differences. Many times, there is a need for more rigorous evaluation of the tissue either to prove a group difference or to substantiate the observations of the initial examination.
Scoring (aka “grading”) is a tool that can be used to derive data from biologic systems (eg, tissues) for analysis and group comparisons. Scoring can be applied at different levels of tissue examination, including antemortem imaging techniques, 6,35,55 postmortem macroscopic examination, 18,36,69 and histopathologic examination. 17,39,46,70 Crissman and colleagues 12 suggested that a scoring system should exhibit 3 fundamental characteristics: (1) it should be definable, (2) it should be reproducible, and (3) it should produce meaningful results. This article reviews key principles for the development of scoring systems so that the pathologist has the best opportunity to meet these key principles. Importantly, these fundamental principles of scoring tissues are applicable to most organs, tissues, and models systems.
Methods
This article describes key principles for the development of semiquantitative scoring systems via histologic examination. Even so, these same concepts can be useful for the development of semiquantitative scoring systems in other research contexts such as commercial immunohistochemistry kits, serologic assays, or applications of specialized software packages. Notably, it is beyond the scope of this article to address principles for quantitative techniques and applications.
All experimental data in the figures and tables of this article were created to demonstrate important principles associated with scoring. Experimental data were constructed to replicate situations that are commonly encountered by comparative pathologists in academia, and emphasis was selectively placed on histopathology-based examples. Importantly, these examples of scoring methods were simplified in scope and complexity for ease of understanding the basic concepts. Representative analyses were made for each example scoring method, but these should not be taken as exclusive statistical options. All statistical analyses and graphs were made using Prism software (GraphPad Software, La Jolla, CA).
Perspective
Sound methodology in histopathologic scoring is important to detect biologic differences in treatment groups. Importantly, it does not compensate for poor experimental design or improperly sampled tissues that occur “upstream.” Many papers have been submitted to journals (but not necessarily published) in which the sampling and histopathologic scoring approaches were robust in nature, but the experimental designs were markedly flawed. In these cases, even when statistically significant data could be generated by the authors, they were without context and lacked validity for proper interpretation. A simple proverb states “junk in, junk out.” Experimental background should be sought out for projects where tissues are submitted for pathologist examination. Proper perspective begins early, and many objectives need to be considered. As described below, developing a sound experimental design, understanding the purpose of the study, and considering how best to sample the appropriate tissues are all important features of perspective.
Experimental Design
Experimental planning and design are necessary for the development of a sound scientific study, and understanding these methods is essential for context of proper data interpretation. 3,4,12,58,76 Species, strain, sex, age, appropriate controls, method/type of genetic manipulation, microbial status of colony, tissue handling, and treatments (type dose, route, duration, etc) all play a role in the evaluation and eventual interpretation of the data. Ancillary data such as clinical chemistries, imaging, and/or clinical behavior can further give relevant insights for effective tissue evaluation. For example, if hepatocellular-specific enzymes were elevated in a treatment group, then targeted sampling and examination of the liver would be valuable.
Study Objectives
Understanding the study objectives is useful in effective tissue examination and development of a meaningful scoring system. For example, a murine study of Pseudomonas aeruginosa infection may demonstrate antemortem group differences in the extent of neutrophilic lung inflammation based on routine examination. 40 A scoring system may be readily applied to corroborate this observation, which would be sufficient for many studies. However, if the study’s objective was to determine if neutrophil transmigration into the lungs was defective, then a scoring system that focuses on neutrophil transmigration might be developed, if possible, to more meaningfully demonstrate this mechanistic change.
Tissue Sampling
Sampling of tissues can greatly influence the diagnostic or treatment-related results of a study. 5,7,37 For example, in some strains of mice, islet numbers can vary widely between pancreatic lobes, 32 and therefore consistent tissue collection should be performed for optimal islet assessment. In academia, tissues are sometimes collected by the collaborator lab and stained slides submitted to the pathologist for examination. Awareness of the collection method as well as the level of consistency in sampling and sectioning helps to ensure that unintentional bias is prevented. 8
Principles for Scoring
To determine an appropriate histologic scoring system for any tissue, key principles should be considered. Although this list is not exhaustive, these considerations will help to develop a useful scoring method.
Masking
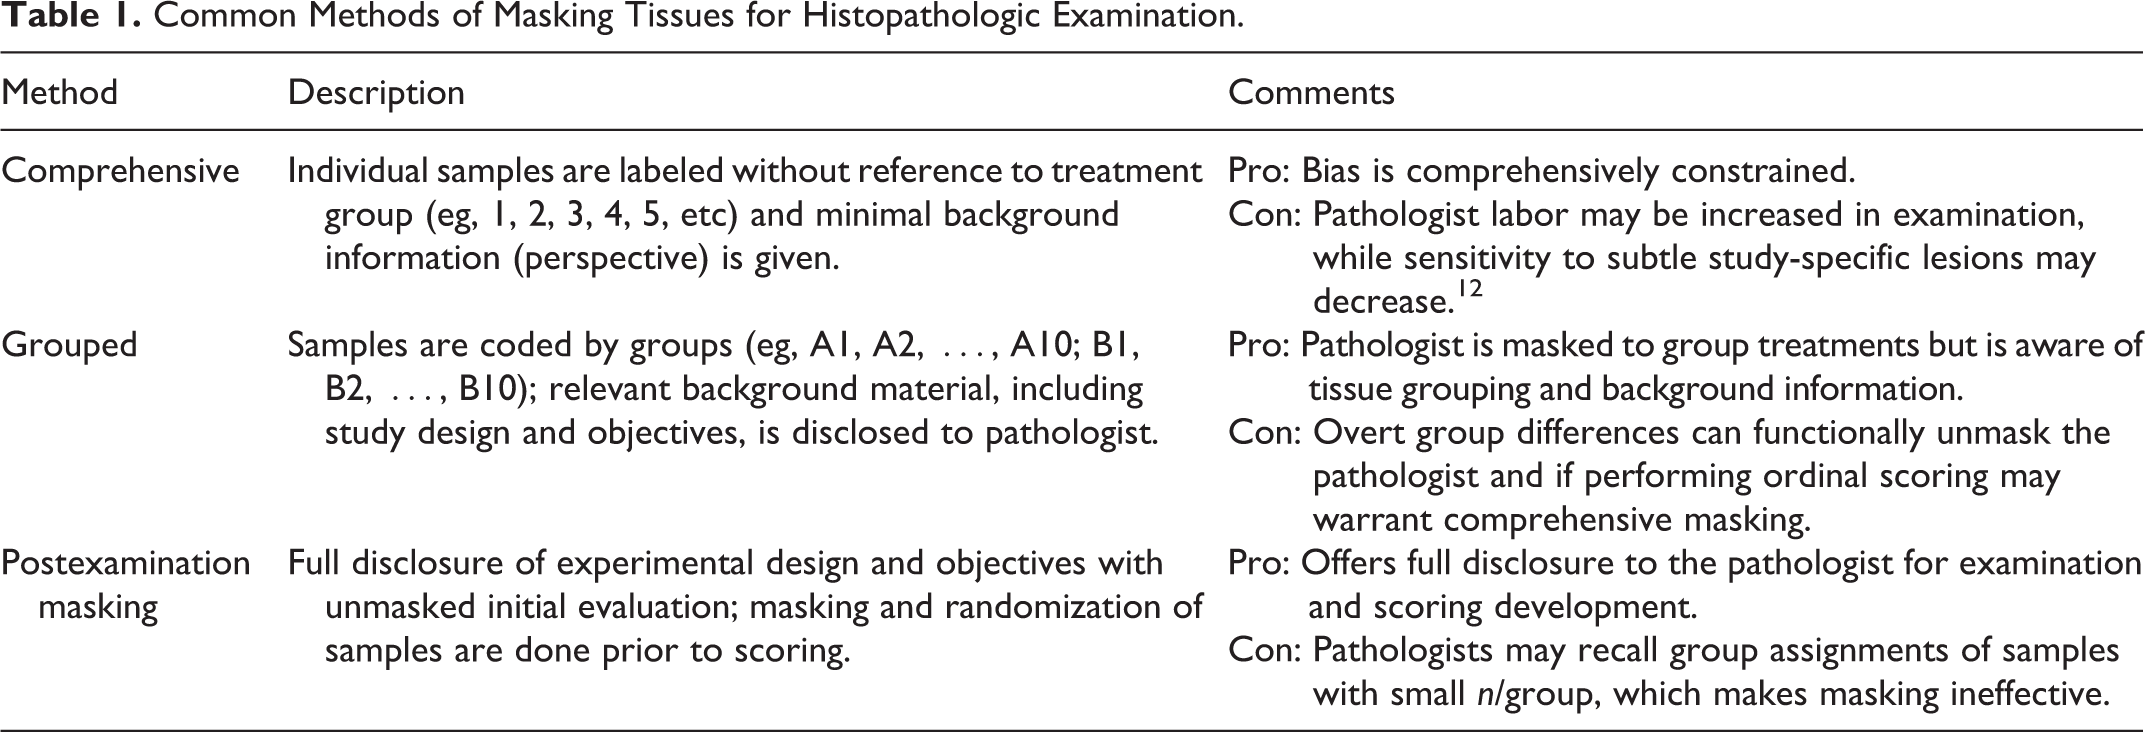
An important goal for any experimental study is to constrain biases that can skew the final data and conclusions. 60 Bias can be introduced into any stage of the experimental project. 49,63 “Masking” (aka blinding) of the pathologist to experimental groups/treatments is a means of preventing bias from entering into the examination and scoring of tissues. Lack of masking can lead to unintentional observational bias that can often exaggerate treatment effects. 15,57 Different levels of masking for the pathologist can be implemented (Table 1), but consideration of the study goals as well as the limitations of the masking method need to be discussed before examination.
Common Methods of Masking Tissues for Histopathologic Examination.
Examination
A thorough examination of all tissues/slides provides a context for scoring tissue lesions. For example, a lesion common to all groups could be indicative of a “background” lesion, and scoring of this lesion parameter could be of little meaning to the study. But sometimes in the context of a research study, subtle differences in the frequency or severity of the “background” lesion may be indicative of a mechanistic change related to treatment and can be further assessed. 59 A review of the study objectives and the relevant literature may predict differences in a specific lesion parameter, which could then be examined and scored to provide context for the current model.
Lesion Parameters
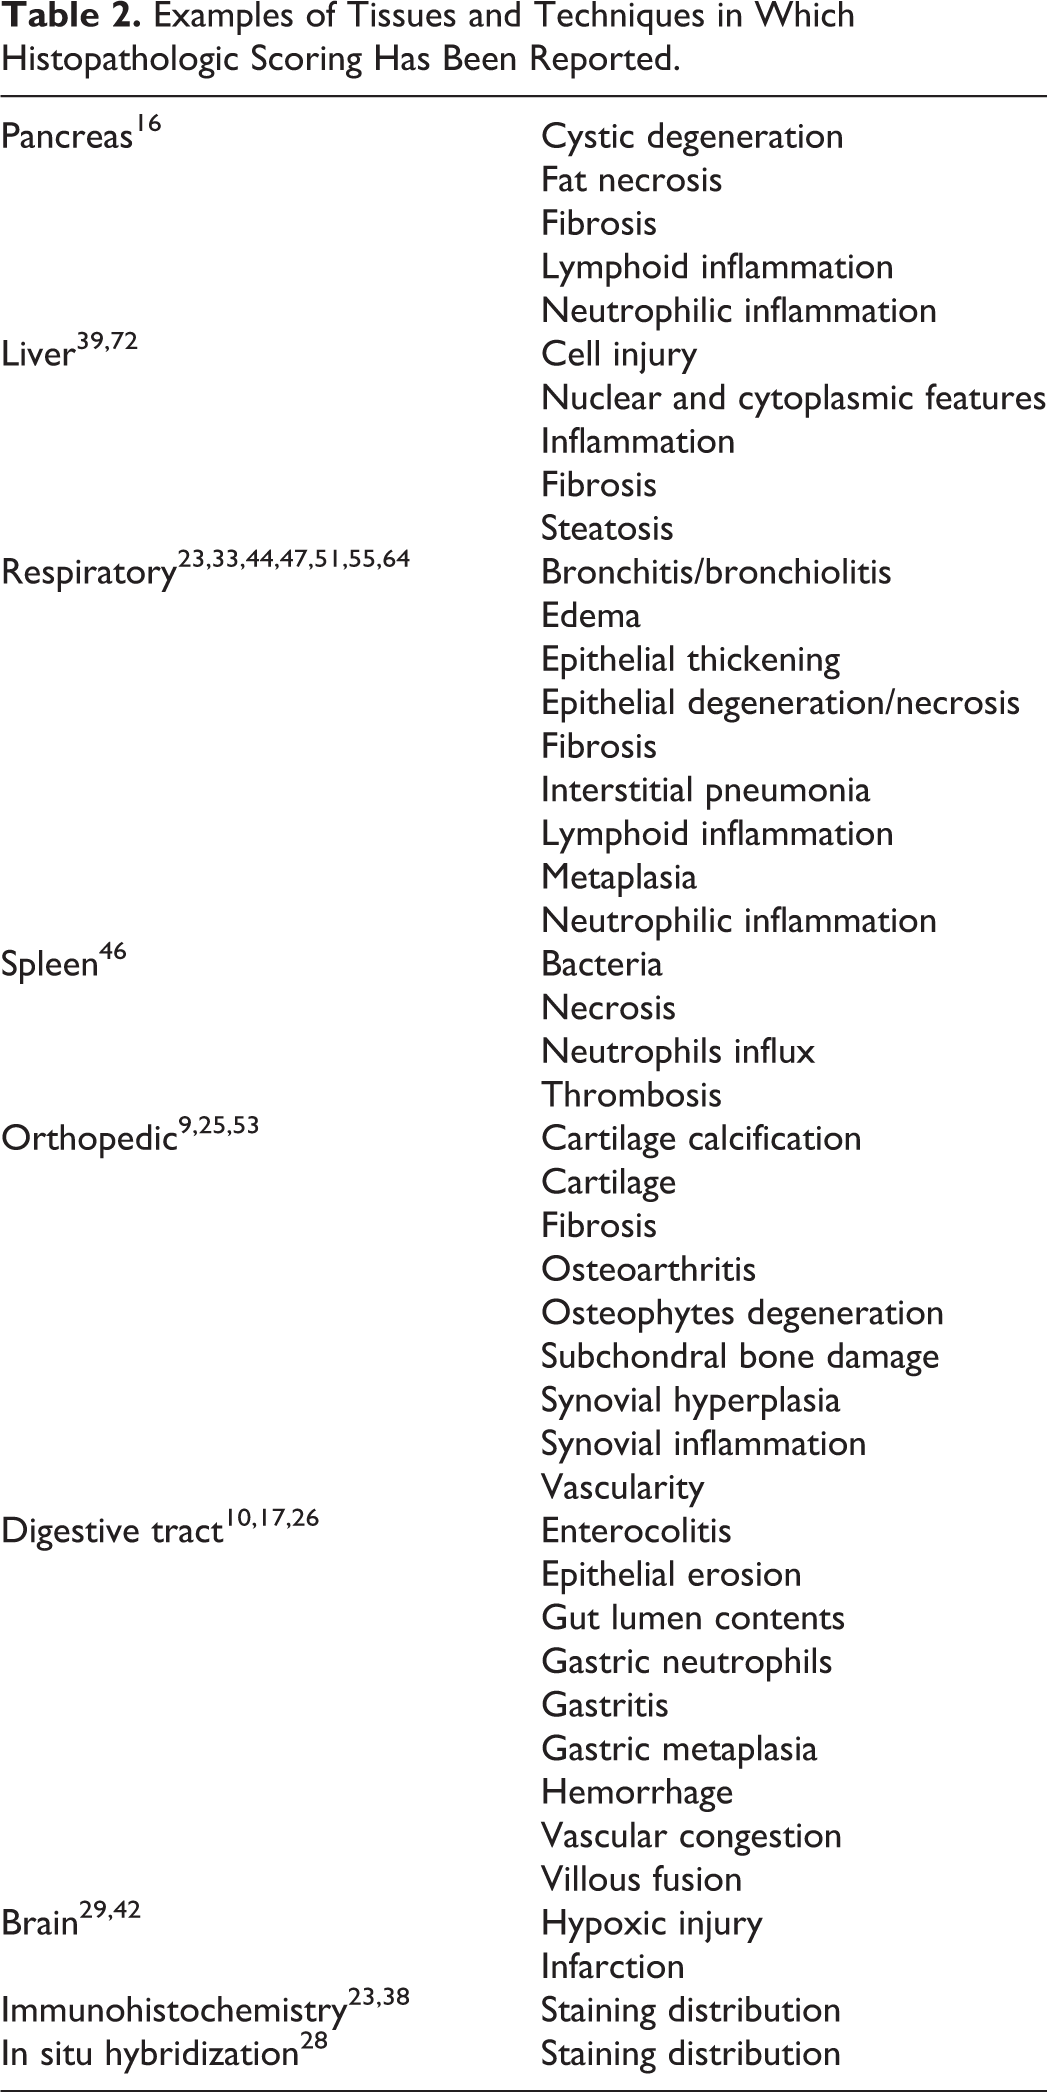
What types of lesions can be studied by a scoring system? If lesions are identifiable in tissues, then these can often be applied into a scoring system (Table 2). Some lesions may be detectable in any tissue (eg, cellular inflammation), whereas other lesion parameters may be specific for the organ/tissue (eg, cholestasis in liver) being scored. Although it is not feasible to concisely review all lesion parameters for all tissues, numerous approaches to scoring for specific organs or models can often be found in a targeted literature search.
Examples of Tissues and Techniques in Which Histopathologic Scoring Has Been Reported.
Scoring Definitions
Scoring systems often segregate samples into defined categories. It is useful to have clear language both characterizing and setting boundaries for each category. 59,68 Exclusive use of vague terms, such as mild, moderate, or severe, in ordinal scoring can reduce interobserver repeatability and may even compromise intraobserver repeatability over time. Whenever possible, specific terminology including the use of the percent of tissue affected can enhance the repeatability as well as sensitivity of the system.
Interpretation Consistency
“Diagnostic drift” is a situation in which the assignment of scores may vary slightly in consistency through the scoring process. This can happen in situations where there are a large number of samples, multiple pathologists examine subsets of tissues, slides are examined over a long period, or category characteristics/boundaries are poorly defined. 13 In research settings, it is most useful to have one pathologist score the slides in a reasonable period of time, if applicable, to provide for additional consistency. 12,13 Of course, this approach is not always possible, and review (by the same or a secondary pathologist) at the conclusion of the study may be warranted especially for more arduous studies.
Examples of Scoring Approaches
Types of Data Measures
Many years ago, Stevens 66 wrote an article describing 4 key types of measurement scales used in research: nominal, ordinal, interval, and ratio (Table 3). Generally speaking, nominal and ordinal scales produce qualitative data, whereas interval and ratio scales produce quantitative data. Qualitative data are that which approximate or characterize something as opposed to quantitative data, which measure something. For instance, biologic data that are acquired from morphometry have a ratio scale with a true zero point and produce quantitative data; relevant examples include length (eg, acinus diameter) or area (eg, acinus area). In contrast, nominal and ordinal scales, which are commonly used in scoring systems, produce qualitative data, and thus any scoring is considered “semiquantitative” in nature. Understanding the types of data as well as their constraints helps in their analysis.
Types and Examples of Data Measurements in Research.
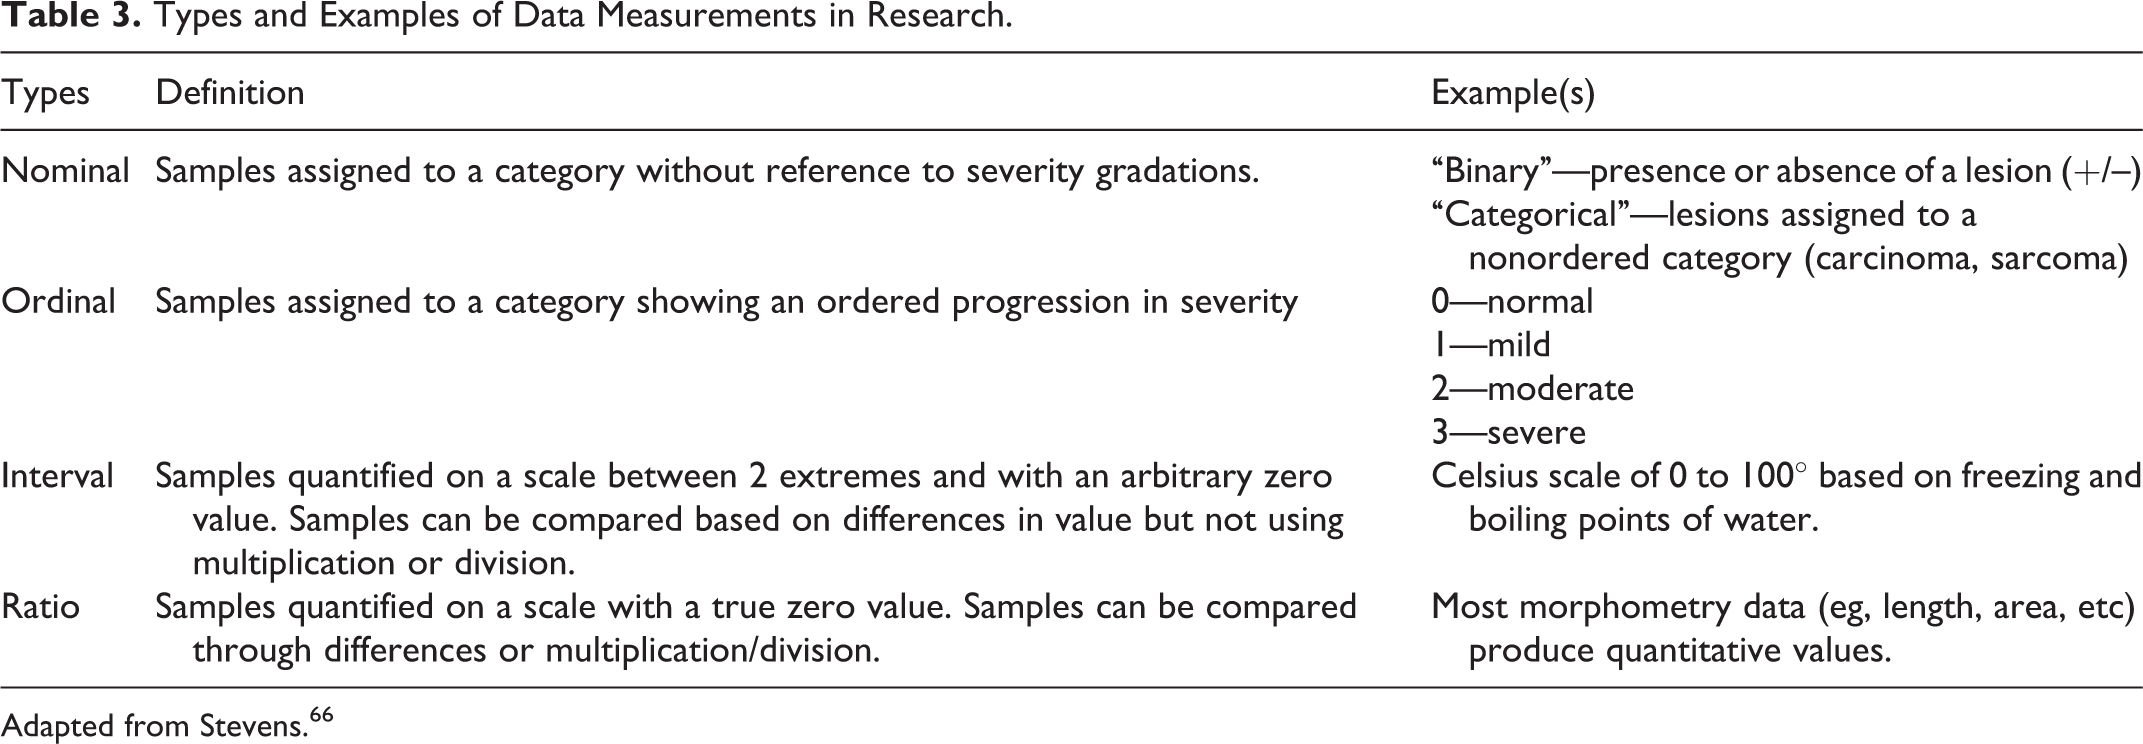
Adapted from Stevens. 66
There are multiple approaches to score tissues, and common scoring methods for pathologists are highlighted below. For simplicity, these methods have been generally assigned into 3 groups for enhanced understanding and application. The reader would be advised that for additional information, other resources may be useful. 13,31,59,75
Incidence Method
This approach records the case incidence of a lesion (ie, those affected) in an experimental cohort. 31,65 Similar types of scoring methods include binomial scoring (presence or absence of lesion) and percent affected. Lesions are defined by categories (ie, nominal data) and recorded in a contingency table. For example, the trachea can be examined for the presence or absence of inflammation in submucosal glands (Table 4). These nominal data can be reported as a contingency table (Table 4) or shown as a graph for publication (Fig. 1).
Scoring of Trachea Submucosal Glands for the Presence of Cellular Inflammation.a
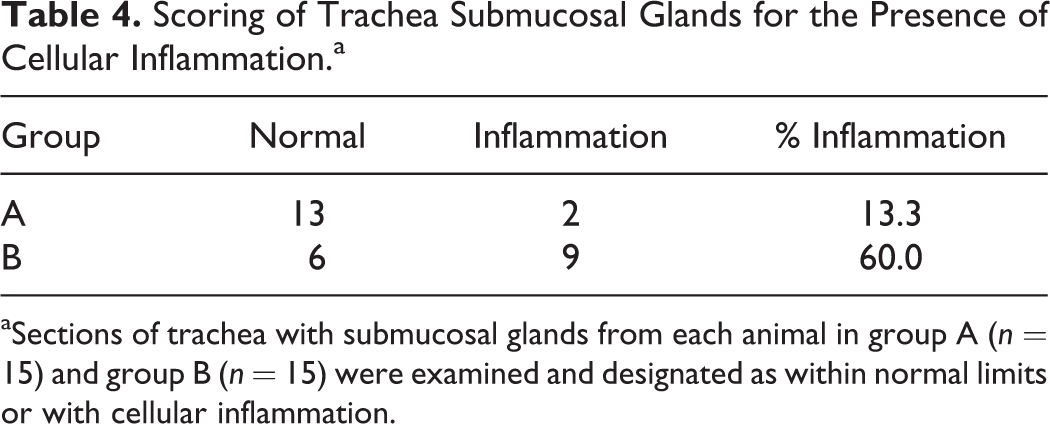
aSections of trachea with submucosal glands from each animal in group A (n = 15) and group B (n = 15) were examined and designated as within normal limits or with cellular inflammation.
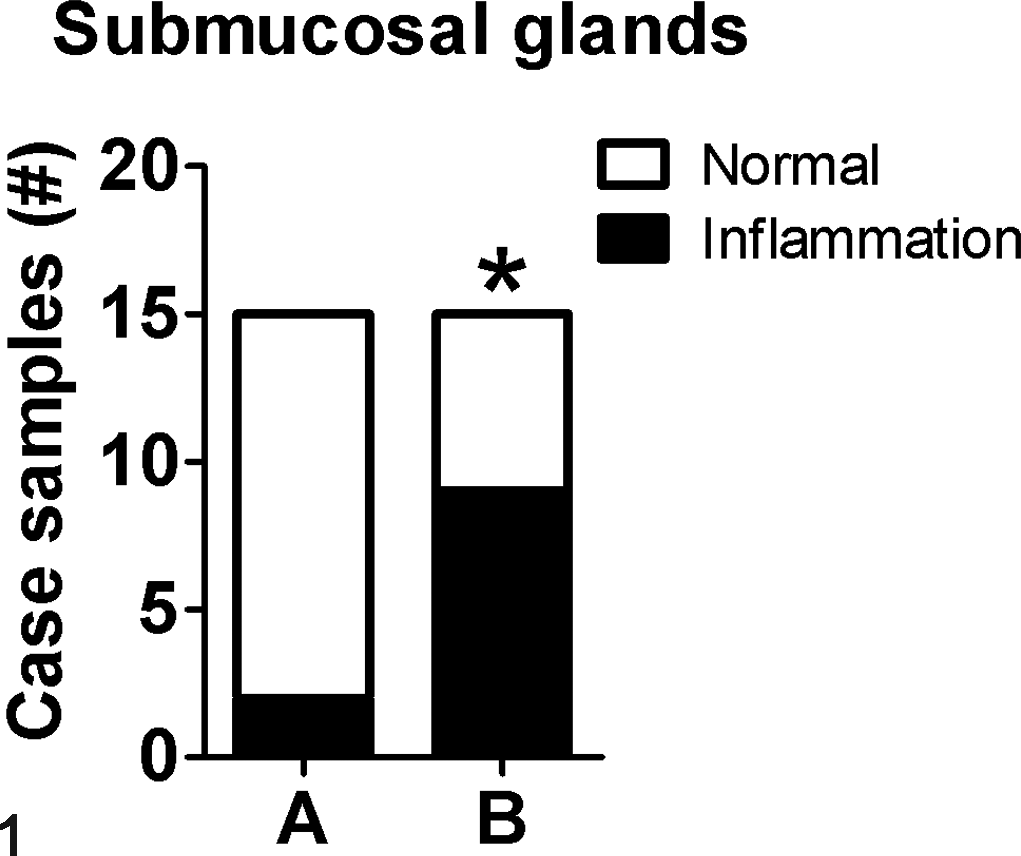
Example of the incidence method. Example graph for reporting incidence data from Table 4. *P = .02, Fisher exact test.
Ordinal Method
The ordinal method is commonly used by many pathologists for lesion scoring, and important principles for the method are discussed below.
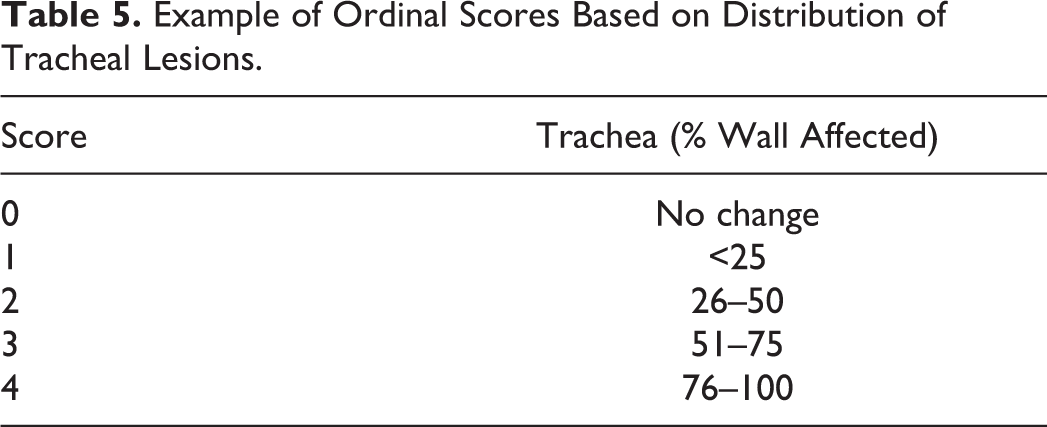
This method assigns data into defined categorical groups that are arranged in an “ordered” progression in lesion severity. 66 For example, a scoring system can be based on the estimated percentage of the tracheal wall that is affected by a lesion; in this case, a score (0–4) may be assigned (Table 5). The most common approach to ordinal scoring is to assign a summary score for each animal based on the tissue examination. An example of this can be seen in Table 6, where tracheal inflammation and hyperplasia are scored.
Example of Ordinal Scores Based on Distribution of Tracheal Lesions.
Trachea Inflammation and Hyperplasia Scores From Treatment Groups A and B.a
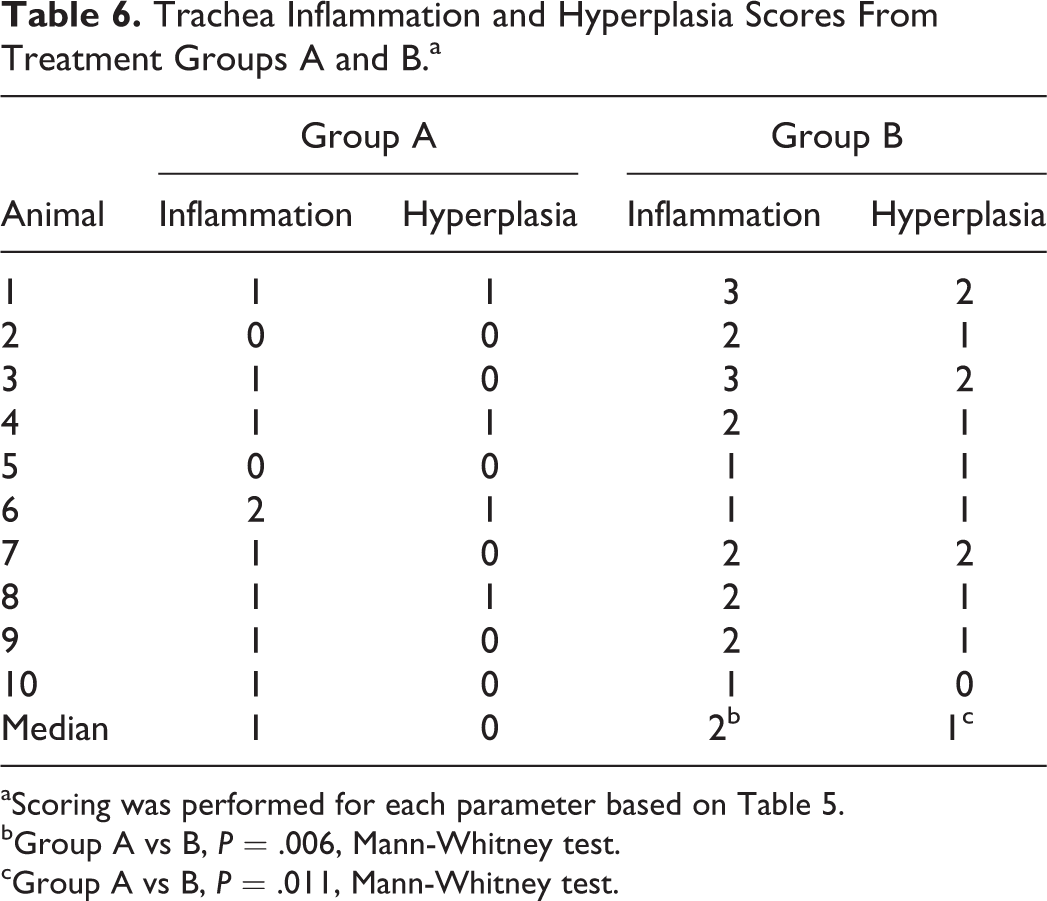
aScoring was performed for each parameter based on Table 5.
bGroup A vs B, P = .006, Mann-Whitney test.
cGroup A vs B, P = .011, Mann-Whitney test.
Another method found in the literature is to count several fields of tissue (eg, 10 random 400× fields) for each animal, each field scored, and a mean (ie, average) score assigned for the whole tissue of that animal. The problem with this approach is that the mean represents a measure of central tendency that is only appropriate for interval and ratio data. For ordinal data, the median is the most appropriate measure for central tendency. This statistical axiom is not without some controversy, and it is not within the scope of this article to resolve it.
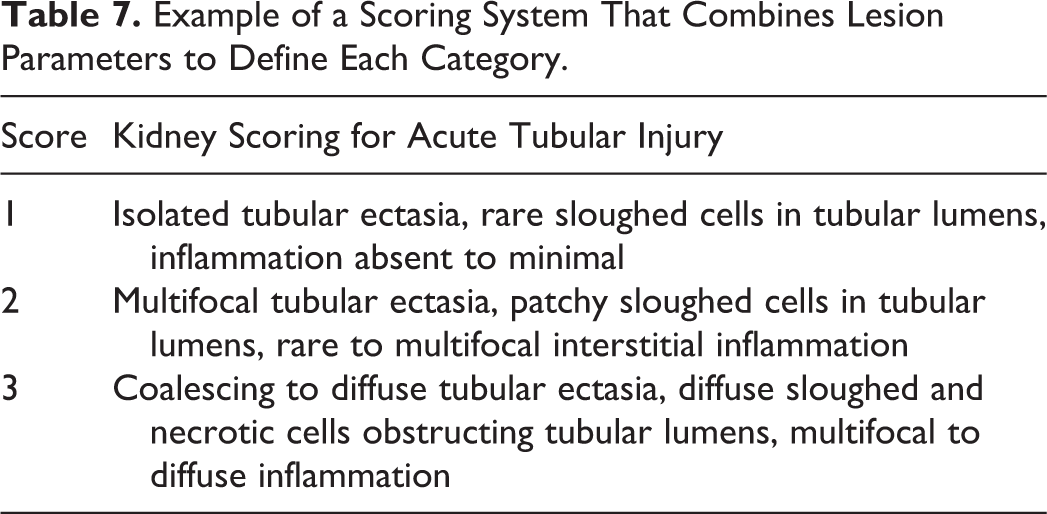
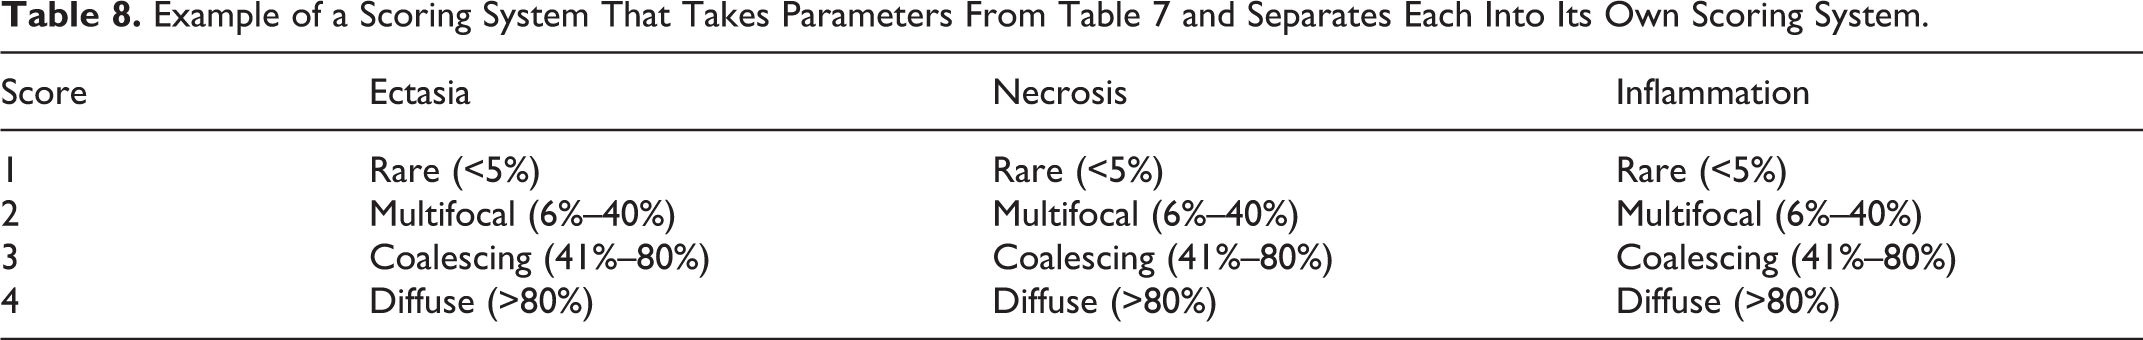
Scoring approaches vary among pathologists. Many times, a tissue will have multiple lesions that can be assigned scored. Dependent on their approach to these situations, pathologists have been described as either “lumpers” or “splitters.” 75 Lumpers use multiple parameters or anatomic sites to define each ordinal level. For example, multiple separate renal lesions associated with acute tubular injury are grouped together to give a single scoring system (Table 7). On the other hand, splitters separate each parameter or anatomic site for scoring purposes. As opposed to the lumpers, splitters assign each specific renal lesion its own appropriate scoring system (Table 8). Lumper methods can be more efficient for the pathologist, saving labor and time when groups have overt differences; however, splitter methods are more sensitive to parameter-specific or sequential changes that may occur in a model and also have more repeatability. 13
Example of a Scoring System That Combines Lesion Parameters to Define Each Category.
Example of a Scoring System That Takes Parameters From Table 7 and Separates Each Into Its Own Scoring System.
When modifying or developing a new ordinal scoring system, it is useful to evaluate the variance of lesion severity in all samples so as to “fit” the scoring system into the range of lesions. For example, if an infection model is studied at day 2 postinoculation, the range of lesions may be entirely different from those previously studied at day 6 postinoculation. If this adjustment is not done, then the scoring system may be so skewed as to be ineffective for assessment of group differences at the different time point.
The number of score categories within the ordinal method has potential implications for the study, and this ranges from as few as 3 to as many as 10 or more per system. 29,33,42,59 A small number of score categories (eg, 3) can reduce the sensitivity of the scoring system so that more animal numbers (or more severe group differences) are required to detect a real biologic difference between groups. Alternatively, a large number of ordinal scores may cause difficulty in score assignment as there is often less obvious distinction between categories. This means that a scoring system with a large number of categories is prone to have reduced repeatability. It has been suggested that ∼4 to 5 score levels may be an optimal range to maximize detection and repeatability. 59,68
Ordinal scores are most commonly derived from direct evaluation of tissues with assignment of scores by the observer; however, transformation of quantitative data to ordinal scores has been described and is another source of ordinal scores. 19,40 Transformation of data can be a useful tool to constrain sample variance that is often found in animal-based research.
Rank Method
The rank (“ordering”) method is not commonly used by pathologists, but it is simplistic in application. 31,65 This method is remarkably similar to what pathologists do (subconsciously) in their routine tissue evaluations. Samples from the treatment groups are combined and then ranked from most severe to least severe (or vice versa), and the rank number for each sample is used for analysis (Fig. 2). Although the ranked method is conceptually straightforward in application, it may be more labor intensive with larger sample numbers. 75
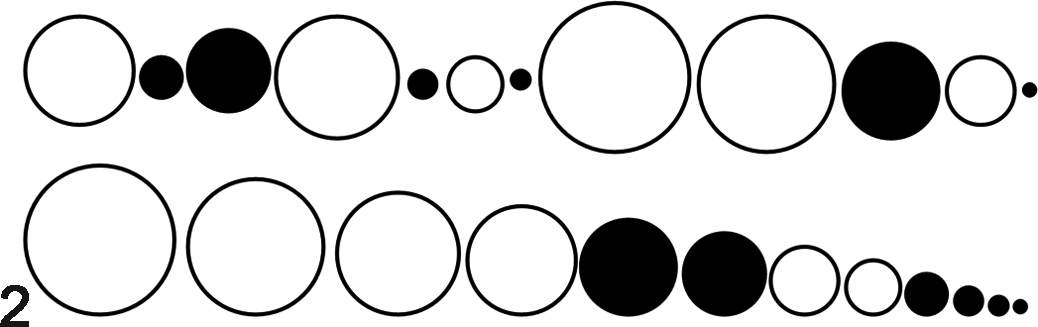
Example of the rank method. Samples (circles) from group A (white circles) and group B (black circles) are combined (top row) for examination. The samples are then ranked in order of lesion severity (represented by circle diameter, bottom row). The rank numbers for group A (1, 2, 3, 4, 7, 8) and group B (5, 6, 9, 10, 11, 12) are then analyzed. P = .03, Mann-Whitney test.
Statistics
Key components of statistical analysis are important in any research project. A biostatistician should collaborate with researchers for routine planning of experimental design through analyses of their data. 21 Access to a user-friendly statistical software package can also be useful for routine analyses and synthesis of graphs for publication. The use of scored data may be discipline dependent as scoring and its analyses are common for pathologists at academic and medical institutions, but recent International Harmonization of Nomenclature and Diagnostic criteria (INHAND) recommendations suggest that toxicologic pathologists should rely on their morphologic interpretation preferentially over statistical inference of scoring. 45
Choosing the appropriate statistical test is an important component for every experimental data set. Statistical tests have “assumptions” on which they function, and if an assumption is not applicable for the data being examined, then the validity (and interpretation) of the statistical approach may be in question. For example, ordinal data do not meet the assumption of a normal (Gaussian) distribution. Parametric analyses (eg, Student’s t-test) should not be used to analyze ordinal data, but rather nonparametric analyses (eg, Mann-Whitney test) should be considered. 60,62 Misuse of statistical analysis in research is recognized, 60,67 and accordingly, it is not uncommon for ordinal scoring data to be analyzed by inappropriate parametric tests (eg, Student’s t-tests). Increasingly, these types of inappropriate statistical analyses are being identified at submission of peer-reviewed papers, causing mandatory statistical revision or manuscript rejection. For a broader perspective on statistical analysis of data, the reader is encouraged to examine these resources. 20 –22,30,31,41,60 –62
Validation
Scoring methods should be designed to be a reproducible and meaningful analysis of data (ie, a valid scoring system). But how does one know that a scoring method is valid? Validation mechanisms have been used in many tissue-specific scoring systems. 36,50,71,74 Validation can be summarized as 2 basic approaches: that of validating observer repeatability and that of validating tissue pathobiology.
Validation in Repeatability
Recent reports have highlighted the importance of repeatability in research. 1,52 For instance, Begley and Ellis 1 attempted to repeat the work of 53 major “landmark” papers but were successful in only 11% (6 of 53) of the cases. Similarly, recognition of the need to accurately reproduce experimental methods has caused some journals to expand their word limits for Materials and Methods sections. 54 Repeatability in pathology methods (including scoring) is a relevant and important consideration in experimental design as well as reporting of data.
One approach to validate scoring systems has been to assess their repeatability through evaluation of intra- and interobserver correlation. 14,24,43,73 This evaluation is often reported by a κ value (value of 0–1) that is calculated from observer agreements (Table 9). Validation using this method only assesses the repeatability of the method but should not be confused with validation of tissue pathobiology as described below.
Interobserver Agreement (Observers A and B) for Classif-ication of Hepatocellular Carcinoma (HCC) and Hepatocellular Aden-oma (HCA) From Liver Tumor Samples (n = 100).a
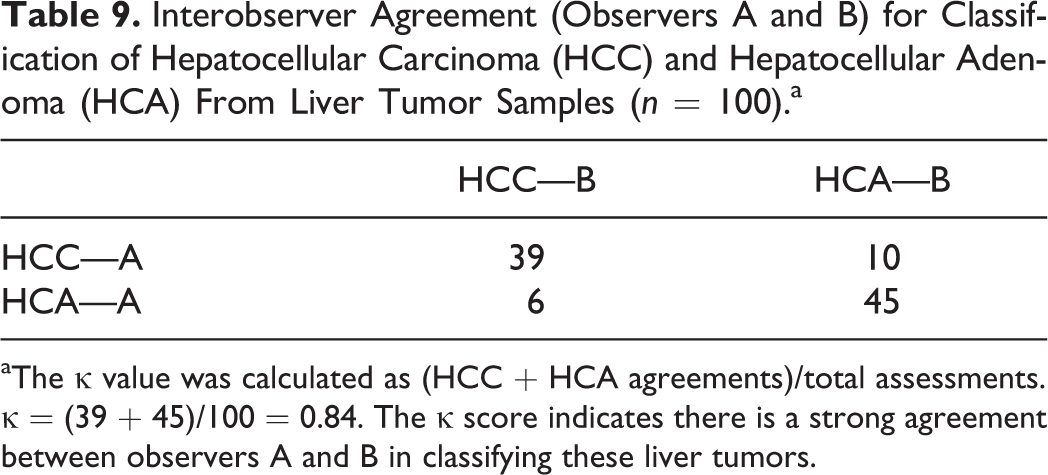
aThe κ value was calculated as (HCC + HCA agreements)/total assessments. κ = (39 + 45)/100 = 0.84. The κ score indicates there is a strong agreement between observers A and B in classifying these liver tumors.
Validation of Tissue Pathobiology
Another approach to validate a scoring system is to analyze the relationship between the scores and relevant parameters of disease severity (ie, pathobiology). 2,10,34,56 This relationship is defined through correlation (eg, Spearman correlation for nonparametric data), which produces a value from –1.0 to 1.0. For example, comparison of tissue scores to relevant pathobiology data (eg, clinical score, body weight, complete blood counts, etc) would ideally demonstrate a strong positive correlation (Fig. 3). Its interpretation is similar to that of the κ—the closer to zero, the lower the correlation. If it is a negative value, then the scoring system has a negative correlation to pathobiology, which would seem unsuitable (if not even “backwards”) for many situations. If the scoring system does not have a strong, positive relationship to disease pathobiology, there may be reason to question its value in the respective model.
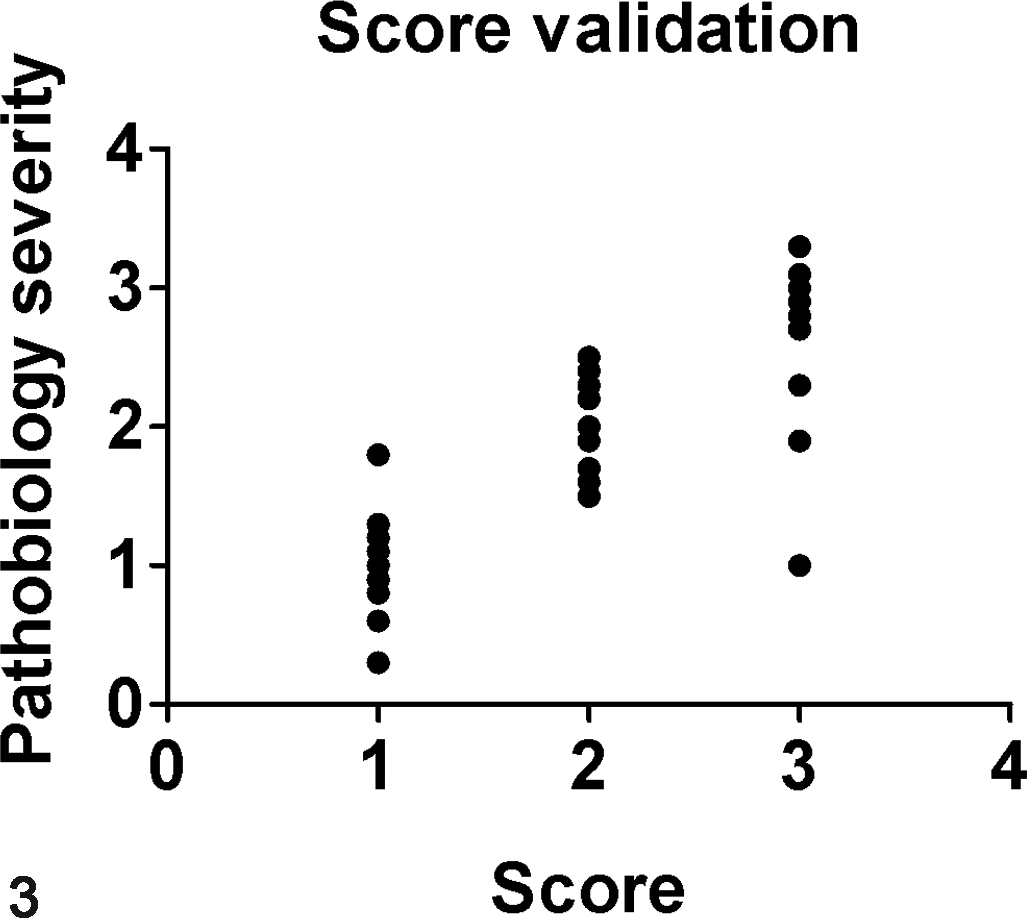
Validation of pathobiology. Tissue scores (x-axis) are graphed out in comparison to relevant pathobiology parameters (y-axis) to see if there is a relationship (ie, correlation) (r = 0.80, P = .001, Spearman correlation). Since the r value is positive and close to 1, this would indicate a strong correlation of the scoring method with tissue pathobiology.
Each validation method is mutually exclusive in its scope. For example, when evaluating interobserver correlation, a high κ value gives confidence in the scoring method’s repeatability. That said, it does not give any credibility to the scoring method’s representation of tissue pathobiology, and the contrary is true as well.
Conclusions
Scoring tissue lesions can be a useful tool for evaluating research tissues and corroborating morphologic findings. Following key principles can guide the pathologist to develop a useful and valid scoring system that is both repeatable and meaningful for the project.
Footnotes
Acknowledgements
We thank the Department of Pathology (University of Iowa) for generous support.
Declaration of Conflicting Interests
The author(s) declared no potential conflicts of interest with respect to the research, authorship, and/or publication of this article.
Funding
We acknowledge generous financial support from the NIH (HL091842, HL051670, DK054759, DK091211) and US Veteran's Administration (Center for the Prevention and Treatment of Visual Loss).