
Abstract
Glucocorticoids (GCs), despite having many undesirable side effects, remain effective for the treatment of many inflammatory diseases and are commonly used as benchmark drugs in animal models of disease. However, the molecular mechanisms underling systemic GC effects in these models are poorly characterized. In this study, prednisolone and dexamethasone were evaluated in the fully established Lewis rat adjuvant-induced arthritis (AIA) model. In AIA, adjuvant administration induced polyarticular and systemic inflammation, which included spleen and liver. In the liver, multifocal hepatic granulomas were observed. To characterize the systemic response and the pathways responsible for GC effects, histology, transcriptional profiling, and immunohistochemistry (IHC) were performed. There was a decrease in the incidence and histologic severity score for granulomas with GC treatment. There was no effect on cellular composition of granulomas as assessed by IHC for CD3+ lymphocytes, macrophages, and B cells, but there was a significant reduction in infiltrating lymphocytes in the hepatic parenchyma. By Affymetrix microarray analysis, 10% of hepatic transcripts were altered (P < .01) in livers from AIA rats, with ~31% of them partially reversed with treatment with dexamethasone and ~13% with prednisolone. Many of these altered hepatic transcripts correspond to human genes that are dysregulated in the synovium in human rheumatoid arthritis (RA), indicating that the rat AIA model shares features with human RA. These data establish molecular changes in the liver and the effect of GCs in rat AIA, which can be used to aid in understanding the mechanism of action of novel anti-inflammatory compounds in this animal model.
Glucocorticoids (GCs) have been among the most effective medications for the treatment of many autoimmune, allergic, and inflammatory diseases, such as rheumatoid arthritis (RA), and have been commonly used as benchmark drugs in efficacy models for more than 50 years. 20,37 The anti-inflammatory activity of GCs occurs via binding to the glucocorticoid receptor and subsequent inhibition of the transcription factors nuclear factor-κB and activating protein-1, which regulate proinflammatory cytokines, chemokines, and adhesion molecules. 50 Along with these anti-inflammatory effects, chronic GC therapy can result in deleterious and dose-limiting side effects, such as weight gain, diabetes, hypertension, and osteoporosis. 54 Thus, alternative therapeutic approaches for RA such as interleukin-1 receptor antagonists, soluble TNF antagonists, T-cell co-stimulator inhibitors, B-lymphocyte depletors, and improved GCs and new GC receptor (GCR) ligands that separate the anti-inflammatory effects from some of the side effects, are being investigated. 6,9,36,41 For many of these therapeutic approaches, animal models of RA, such as rat adjuvant-induced arthritis (AIA), have been predictive for efficacy in humans. 4 Although animal models differ from human RA, they share many microscopic features of human RA and have been particularly useful in the investigation of the pathogenesis of this disease. 5,19,25,43,47,60 In addition, at the molecular level, messenger RNA (mRNA) profiling suggests that animal RA models are also similar to human RA, particularly in tissue gene expression and regulatory pathways. 15,17,24 Many of the expressed genes and proteins have well-established pathophysiological roles. The rat AIA model not only is a model of polyarthritis but also induces pathologic changes in a variety of other tissues including the liver and spleen. 4 We and others have noted systemic effects of adjuvant administration including granulomas and granulomatous inflammation of the liver and spleen, respectively. 4 As the molecular mechanisms underling systemic GC effects are poorly characterized, in this study the rat AIA model was used to examine the systemic effects of adjuvant administration and to assess the effects of prednisolone and dexamethasone on this systemic inflammatory process. Lewis rats were administered adjuvant, and at the onset of joint swelling (~12 days post adjuvant) they were dosed with either vehicle, a dose of dexamethasone (0.5 mg/kg) that has been shown to inhibit paw swelling in rat AIA by 100%, 4 or prednisolone (therapeutic model) at 5, 10, or 20 mg/kg. At the end of dosing (21 days post adjuvant administration), livers were collected and characterized for the systemic response and the pathways responsible for GC effects. There was a significant decrease in the incidence and histologic severity score for hepatic granulomas and a reduction in infiltrating CD3+ lymphocytes in hepatic parenchyma with GC treatment. The transcriptional profiling analysis provided global mRNA changes of adjuvant-induced disease and the effects of GC treatment. We found that numerous hepatic transcripts were altered that were partially reversed by GC treatment. These data establish molecular changes in the liver and the effect of GCs in rat AIA, which can be used to aid in understanding the mechanism of action of novel anti-inflammatory compounds.
Materials and Methods
Lewis Rat AIA Model
Male, Harlan Lewis rats approximately 180 g and 5 weeks of age received a standard regimen of food and water ad libitum. To induce arthritis, complete Freund’s adjuvant (CFA) was made by the addition of 1 ml of incomplete Freund’s adjuvant (lot no. 112K8930; Sigma-Aldrich Corp, St. Louis, MO) with 10 mg of freshly ground Mycobacterium butyrium. Rats were injected intradermally with 0.1 ml of CFA at the base of the tail on day 0. Following priming injection, the rats were unmanipulated until baseline paw volumes were measured on day 7; all donor rats were measured daily beginning on day 10 to check for disease onset. In general, disease onset occured 11 to 14 days post immunization, and a combined paw volume increase of 0.5 ml was considered indicative of established disease. By day 12, enough animals had met the criteria for established disease, and they were randomized into treatment groups (n = 8 rats/group) and orally administered either vehicle, a benchmark GC (dexamethasone at 0.5 mg/kg), or prednisolone (at 5, 10, 20 mg/kg) once daily until day 20. Dexamethasone at 0.5 mg/kg, a dose that has been shown to inhibit paw swelling in rat AIA by 100%, 4 was used as a benchmark to compare the dose response of prednisolone. The paw volume measurements continued until the end of the study. A cohort of Lewis rats (n = 5 aged-matched males) not injected with CFA were used as naive controls. At necropsy on day 21, representative sections of the livers from the first 5 animals from each group were collected and bisected with one half fixed in 10% neutral buffered formalin and embedded in paraffin and the other half snap frozen in OCT (Sakura Finetek USA, Inc., Torrance, CA) for histopathologic evaluation or immunohistochemical analysis. The livers from the remaining 3 animals of each group were frozen in liquid nitrogen for RNA isolation. Liver was chosen for analysis of systemic effects of CFA and GC treatment, as we and others have shown that liver is affected in this model, and we have experience in analyzing transcriptional changes in rat liver. At the time of euthanasia, peripheral blood was collected from all animals for clinical pathologic analysis.
Rat Liver mRNA Expression Profiling
The Rat HT_FOCUS array (Affymetrix, Santa Clara, CA), which contains 24,250 probe sets (24,183 excluding the control probe sets representing ~16,000 annotated genes), was used for the microarray analysis according to standard procedures. Rat liver RNA was purified using QIAzol lysis reagent and RNeasy mini kit (Qiagen, Valencia, CA). Each RNA sample was prepared individually and hybridized to a different microarray chip. Sample labeling and processing were performed according to the manufacture’s protocol. Briefly, double-stranded complementary DNA was synthesized, and biotinylated complementary RNA was prepared and then hybridized to the arrays. The arrays were then stained with streptavidin R-phycoerythrin (Molecular Probes, Eugene, OR) using GeneChip Fluidics Station 400 and scanned with a GeneChip scanner 3000 (Affymetrix) following the manufacturer’s instructions. Data were collected using Rosetta Resolver software (Rosetta Biosoftware, Seattle, WA). Individual frequencies measured for each of the experimental groups were averaged and analyzed by pairwise comparison. As indicated in the text, treatment-related changes were identified fold change and Student’s t-test (P < .01) criteria).
Histology and Immunohistochemistry Analysis
Formalin-fixed, paraffin-embedded (FFPE) tissues were processed for routine staining with hematoxylin and eosin (HE) and examined by light microscopy. Immunohistochemistry (IHC) analysis was performed on FFPE tissues for antibodies directed against CD3, CD8, CD68, CD163, CD45RA, and major histocompatibility class II (MHC class II). For the anti-CD4 antibody, IHC was performed on frozen OCT sections that were fixed with Zamboni’s fixative (Newcomer Supply, Middletown, WI). All antibodies were mouse anti-rat and obtained from commercial sources (CD3, CD4, CD8, CD68, CD163, SeroTec, Raleigh, NC; CD45RA and MHC class II, Abcam, Cambridge, MA). The Ventana Discovery automatic system (Ventana Medical Inc., Tucson, AZ) was used as follows: FFPE sections were deparaffinized by EZ prep solution (Ventana Medical Inc.) followed by antigen retrieval for 30 minutes at 100°C using Tris/Borate/EDTA cell conditioning solution CC1 (Ventana Medical Inc.). For both frozen and FFPE sections, endogenous peroxidase was inactivated using an enhanced inhibitor provided in the DABMAP detection kit (Ventana Medical Inc.), and nonspecific antibody binding was blocked with a 3% blocking solution (Roche Diagnostic, Indianapolis, IN) for 30 minutes. Primary antibodies were diluted (CD163 at 1:10; CD3, CD4, CD8, CD45RA at 1:100; MHC class II at 1:400; and CD68 at 1:500) and manually applied separately and incubated for 60 minutes, followed by an endogenous biotin blocking kit (Ventana Medical Inc.). The slides were then incubated with biotinylated anti-mouse IgG (Vector, CA) for 30 minutes followed by streptavidin–horseradish–peroxidase (HRP) for 16 minutes. Visualization was facilitated by enhanced diaminobenzidine (DAB) chromagen. Slides were then counterstained with hematoxylin.
Image Analysis
To quantitatively assess total area of granulomas for each liver section, the entire HE section from each rat was scanned at 20× magnification and digitized using Aperio ScanScope & Image Analysis System (Aperio, Vista, CA). To calculate the ratio of granulomas per tissue section, each granuloma was individually delineated, and the sum of all granulomas was calculated and divided by the area of entire tissue (granuloma ratio). The group mean granuloma ratio was calculated and compared between each group. For IHC image analysis, the image was analyzed by color for each stain used. Channels 1 (blue) and 3 (brown) were assigned to hematoxylin and DAB, respectively, which left channel 2 blank. The percentage of channel 3 (DAB) from each animal was used to compare groups. Results were expressed as group mean ± standard deviation (SD). Data were analyzed using a 2-sided t-test and P < .05 was considered a statistically significant difference between groups.
Quantitative Real-Time Polymerase Chain Reaction
Real-time polymerase chain reaction (RT-PCR) gene expression analysis can be more sensitive and specific than microarrays and thus is routinely used to validate microarray results. Therefore, in this study, a subset of 15 altered genes were selected for analysis by quantitative RT-PCR (qRT-PCR). Approximately one half of the genes in this subset (eg, RT1-Da, IL-18bp, Bgn, CD36, CD21b, TNFRSF21, Alas2, and Cdkn1a) were selected because these transcripts are known to have altered expression in human RA. First-strand complementary DNA (cDNA) was generated from 1.0 μg of purified total RNA by using SuperScript II with Olgo (dt)12–18 primer (Invitrogen, Carlsbad, CA). Gene-specific primers (Table 1) of selected genes were designed by using ABI Primer Express 2.0 software (Applied Biosystems, Foster City, CA). PCR was run with 5 μl of cDNA template in 20-μl reactions in triplicate on an ABI SDS 7900 using the ABI power SYBR Green Master Mix (Applied Biosystems) and gene-specific primers at a concentration of 0.2 μM each. Gene-specific amplification was confirmed by a single peak in the ABI Dissociation Curve software (Applied Biosystems). No template controls were used to control for sample contamination and no reverse transcriptase controls were used to control for hybridization to genomic DNA. Average threshold cycle (Ct) values for clyclophilin (PPIA, used as housekeeping gene) were used to normalize average Ct values of the gene of interest. These values were used to calculate the average Ct values between groups, and the relative quantity (power of –ΔΔCt) was used to calculate fold change between each group. To determine concordance between qRT-PCR and microarray results, log-transformed fold change values of transcripts were plotted.
Primers Used for Quantitative Real-Time Polymerase Chain Reaction in This Study
Results
Lewis Rat AIA Model
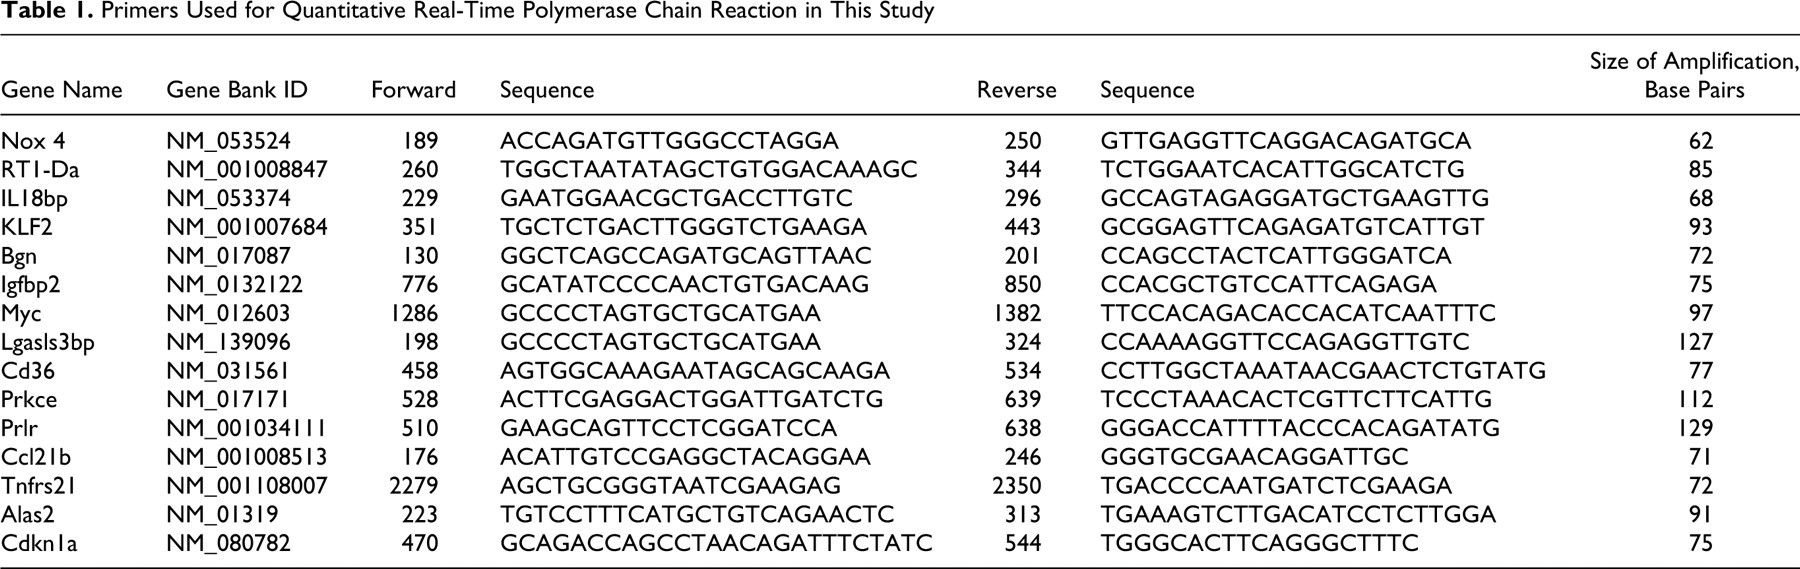
On day 12, animals with established disease, as determined by paw volume measurements, were randomized into treatment groups (n = 8 rats/group) and were orally administered either vehicle, prednisolone at 5, 10, 20 mg/kg, or dexamethasone at 0.5 mg/kg once daily until day 20. Starting on day 13 there was a dose-dependent decrease in paw volume measurements in animals administered prednisone compared with vehicle controls (Fig. 1). As anticipated from published reports 4 and unpublished in-house results, dexamethasone administered at 0.5 mg/kg once daily caused a 100% reduction in paw volume measurements, whereas prednisolone elicited a dose-dependent reduction in these values ranging from approximately 50% at 5 mg/kg to 75% at 20 mg/kg (Fig. 1).
Lewis rat AIA model: There was a dose-dependent reduction of paw volume measurements with administration of prednisone at 5, 10, and 20 mg/kg and dexamethasone at 0.5 mg/kg starting on day 12 (onset of disease). Each point represents daily mean paw volume measurement (n = 8 rats/group). Error bars represent standard error of the mean.
Liver Histology
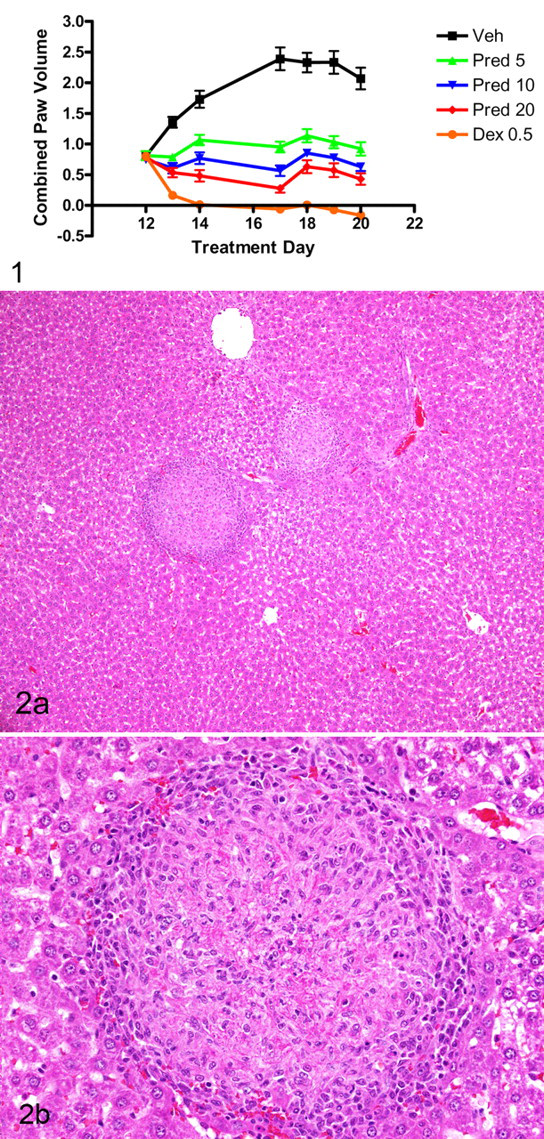
On day 21 post CFA administration, all animals administered vehicle had random, multifocal, variably sized hepatic granulomas (Fig. 2a). Granulomas were well formed, containing a central necrotic core surrounded by a zone of neutrophils, lymphocytes, epithelioid macrophage, and rare syncytial cells, surrounded by a thin rim of lymphocytes (Fig. 2b). Quantitative assessment of area of granulomas indicated that granulomas ranged in size from 5 × 10⁻³ to 1.2 × 10⁻¹ mm2 and varied in density from 3.8 × 10⁻⁵ to 9.5 × 10⁻³ mm2 per unit area of tissue examined. There was a decrease in the group mean granuloma ratio with GC treatment (Fig. 3) ranging from a significant decrease in the incidence of these granulomas with prednisolone treatment (10 and 20 mg/kg) to a complete absence in rats administered dexamethasone at 0.5 mg/kg (Fig. 3).
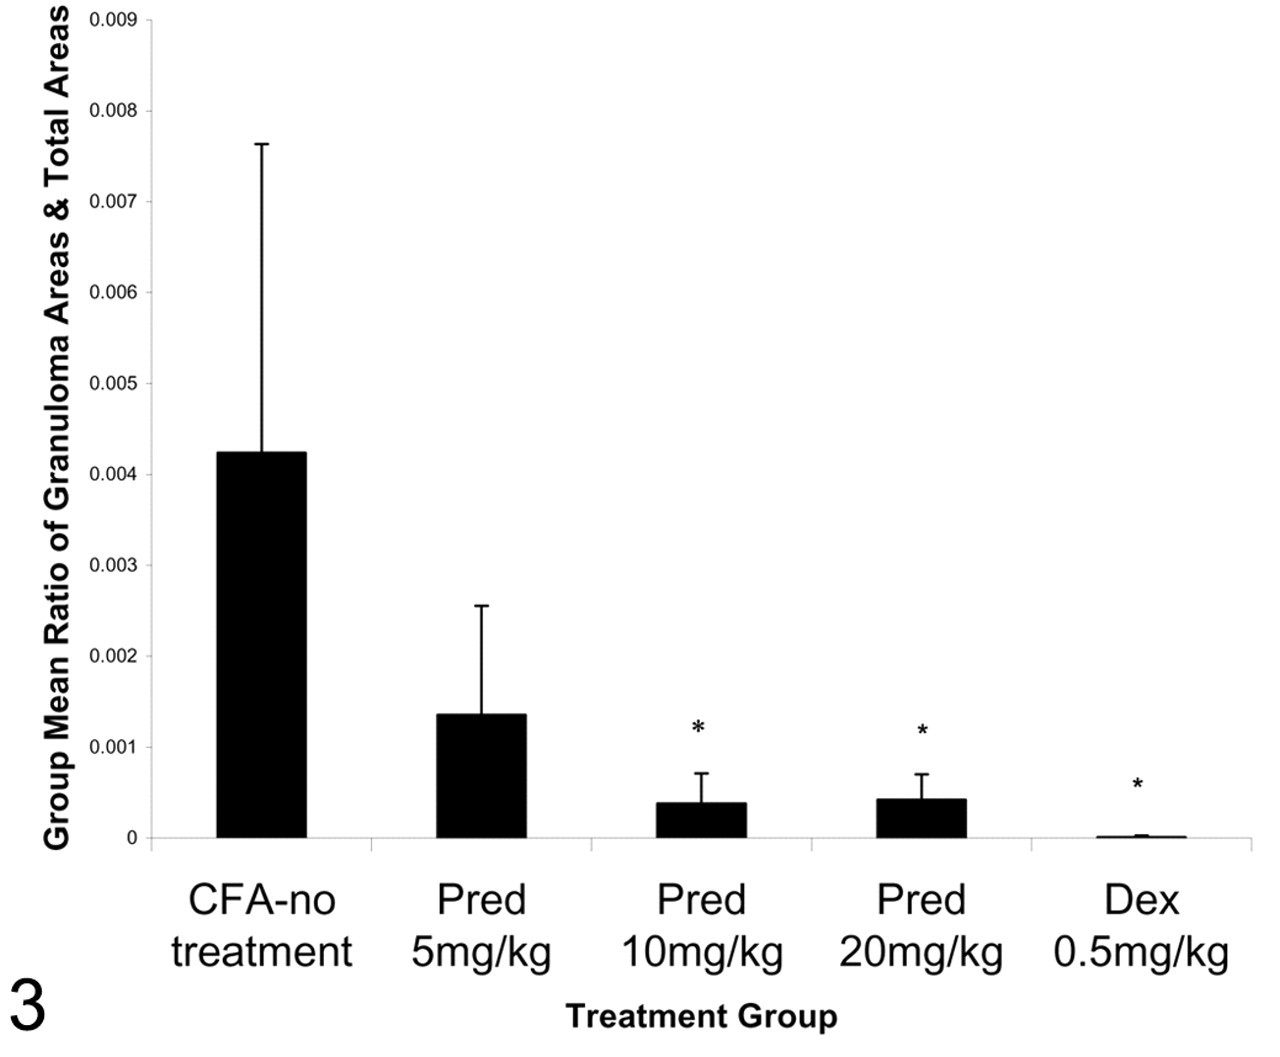
The mean granuloma ratio (n = 5 rats per group) decreased in a dose-dependent manner with prednisolone (Pred) treatment and was completely absent in rats administered dexamethasone (Dex) at 0.5 mg/kg. Error bars represent standard deviation. P < .05, statistically significant. CFA, complete Freund’s adjuvant.
Immunohistochemistry
To immunophenotype livers, IHC was performed. There was no effect on cellular composition of granulomas in GC-treated animals as assessed by IHC for T lymphocytes (CD3, CD4, and CD8), B lymphocytes (CD45R), and resident and activated macrophages (ED1 and ED2, respectively). However, despite no difference in inflammatory cell composition of hepatic granulomas between GC- and vehicle-treated animals, there was a significant reduction in infiltrating CD3+ lymphocytes in the hepatic parenchyma in animals administered either prednisolone at 20 mg/kg or dexamethasone at 0.5 mg/kg (Fig. 4). This microscopic finding and the clinical pathology results (Table 2) indicating that GC treatment reduced circulating lymphocytes (statistically significant for dexamethasone, but only a trend for prednisolone at all doses) in peripheral blood are consistent with known glucocorticoid pharmacology. In addition, MHC II expression at both the mRNA (Affymetrix) and protein (IHC) levels indicated that CFA treatment increased antigen-presenting cells (APCs), an effect that was partially or totally reversed by prednisolone and dexamethasone treatment, respectively.
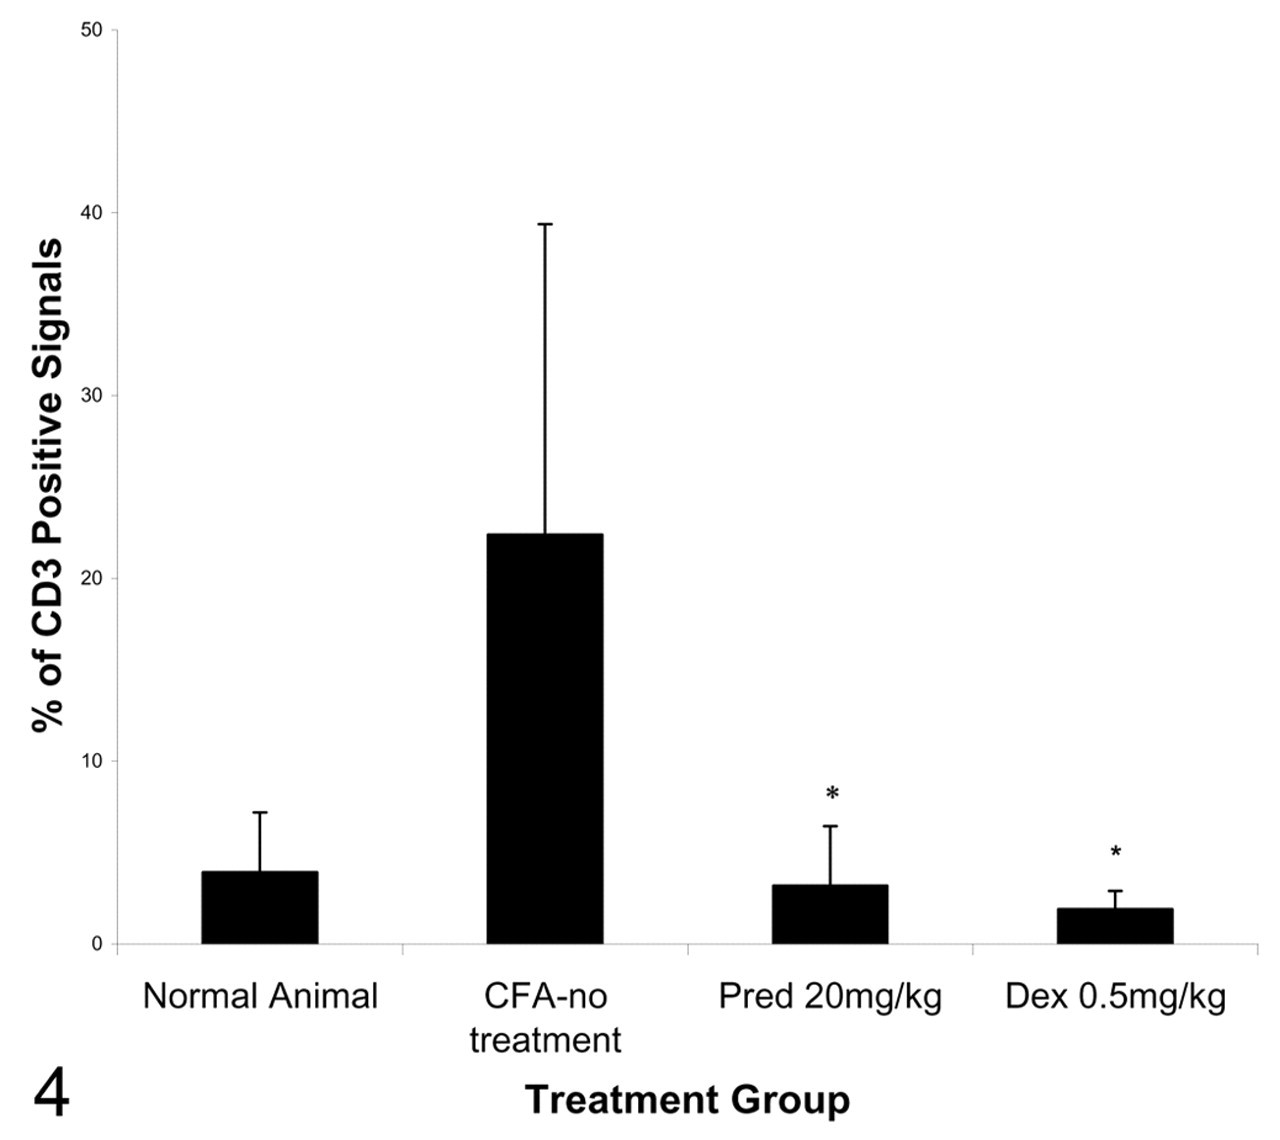
There was an increase in the infiltration of CD3+ lymphocytes in hepatic parenchyma in adjuvant-induced arthritic animals administered vehicle, which was significantly reduced (P < .05) with prednisolone (Pred) or dexamethasone (Dex) treatment. Mean (n = 5/group) CD3+ cell counts. Error bars represent standard deviation. CFA, complete Freund’s adjuvant.
Hematology
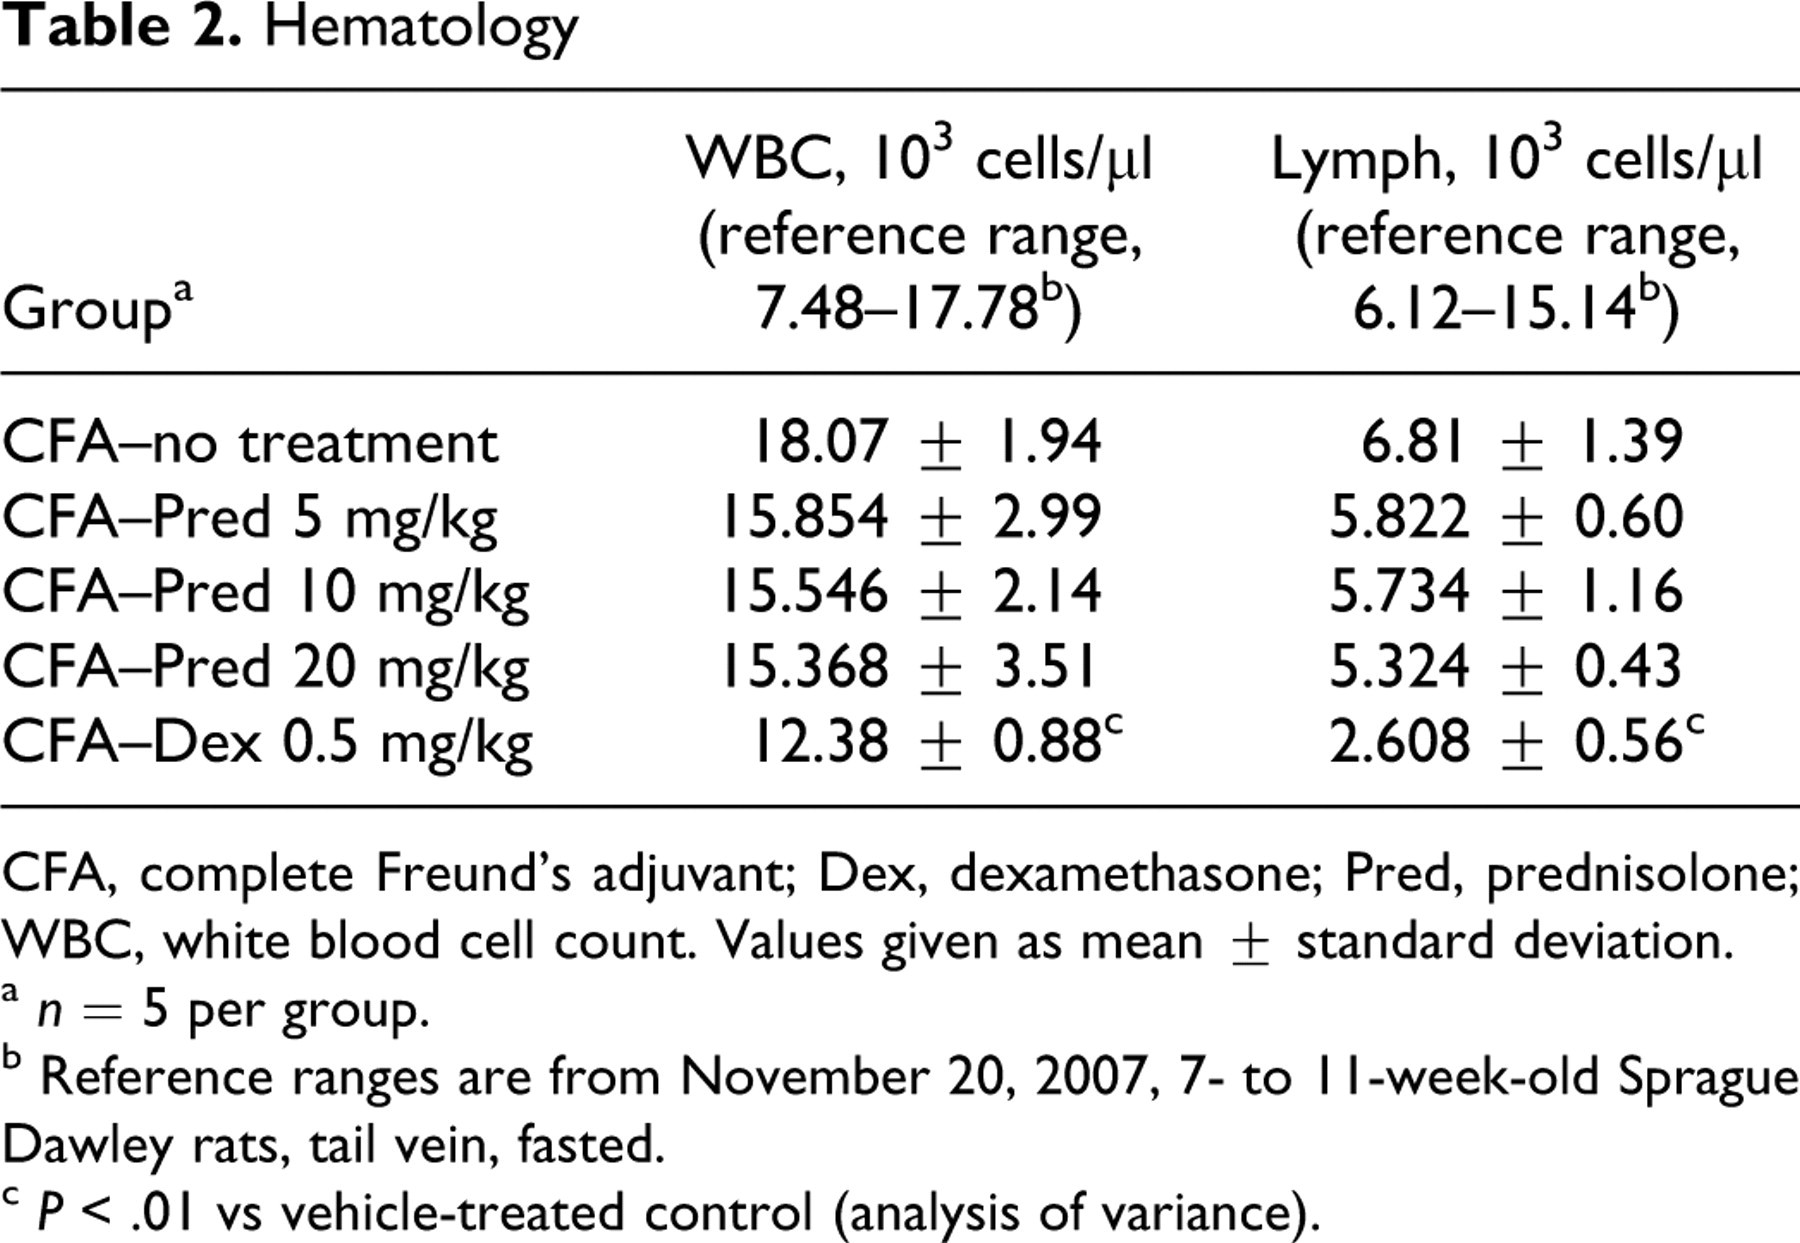
CFA, complete Freund’s adjuvant; Dex, dexamethasone; Pred, prednisolone; WBC, white blood cell count. Values given as mean ± standard deviation.
a n = 5 per group.
b Reference ranges are from November 20, 2007, 7- to 11-week-old Sprague Dawley rats, tail vein, fasted.
c P < .01 vs vehicle-treated control (analysis of variance).
Expression Profiling of Liver
CFA-induced hepatic transcript abundance and response to GC treatment were assayed in liver by DNA microarray. The percentage of all hepatic transcripts assayed by Affymetrix that changed at a t-test P < .01 is presented in Table 3. The table indicates that relative to CFA alone, dexamethasone and the higher doses of prednisolone altered more hepatic transcripts than did lower doses of prednisolone. The hepatic transcript abundance changes observed with corticosteroid treatment of CFA-treated rats were mostly a reversal of transcriptional effects of CFA relative to naive rats (Fig. 5). When naive rats were compared with rats administered CFA alone, approximately 10% of all hepatic transcripts measured were altered (P < .01). Corresponding to the differences in efficacy between dexamethasone and prednisolone, as determined by paw volume measurements, approximately 31% of these hepatic transcripts were partially reversed by treatment with dexamethasone and about 13% by treatment with prednisolone. Restricting analysis to strongly altered hepatic transcripts (P < .01 and ≥2-fold), approximately 818 microarray transcripts were altered following CFA treatment (for a complete list of these genes, please refer to the table in the supplemental data which can be found at http://vet.sagepub.com/supplemental). Approximately half of these hepatic transcripts had changes in abundance following treatment with 0.5 mg/kg dexamethasone and/or 25 mg/kg prednisolone. The top 20 hepatic transcripts increased or decreased by CFA treatment are summarized in Tables 4 and 5, respectively. Of particular interest are increased hepatic transcripts corresponding to immune signal transduction and proliferation pathways, such as MHCII, S100A9, prolactin receptor, chemokine (C-C motif) ligand 21 (Ccl21), secretoneurin II, and CD36, that have been associated with RA (Table 4). The hepatic transcripts CD36 (Table 4) and Ccl21 (supplemental data) are increased approximately 12-fold and fivefold when naive animals are compared with CFA-treated animals. Other increased hepatic transcripts are related to pathways associated with molecular transport, acute phase response, oxidative stress, and proteases (Table 4). The major decreased hepatic transcripts are from pathways related to metabolism, molecular transport, proliferation and differentiation, extracellular matrix, and transcription factors (Table 5).
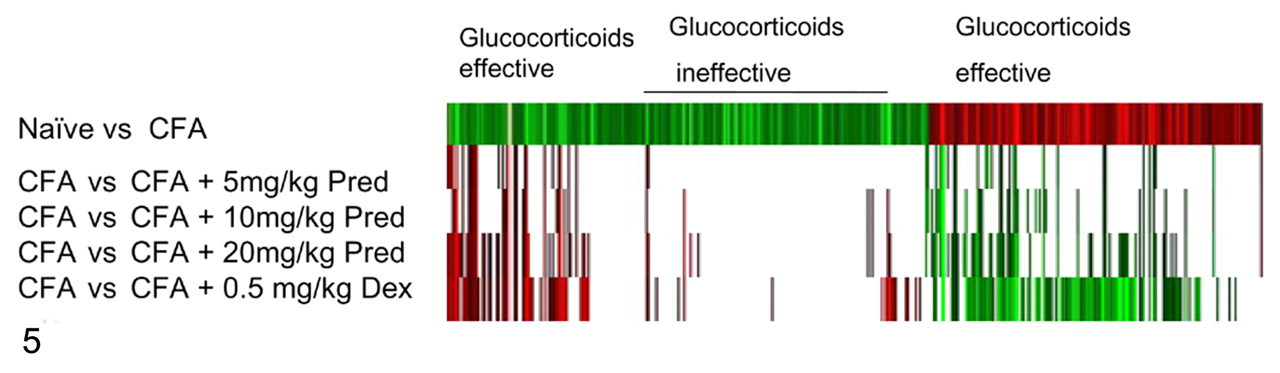
Two-dimensional cluster of 818 strongly altered (twofold or greater at P < .01) hepatic transcripts in rat liver following treatment with complete Freund’s adjuvant (CFA). Markers are green if downregulated and red if upregulated relative to the baseline (white if P > .01; untreated animals are the baseline in the first row and CFA-treated animals are the baseline in all other rows). Many but not all markers that respond to CFA relative to naive by induction or repression have less induction or less repression with glucocorticoid treatment.
Summary of % P < .01 Change of CFA-Rat Liver (of 24,183 Probe Sets)
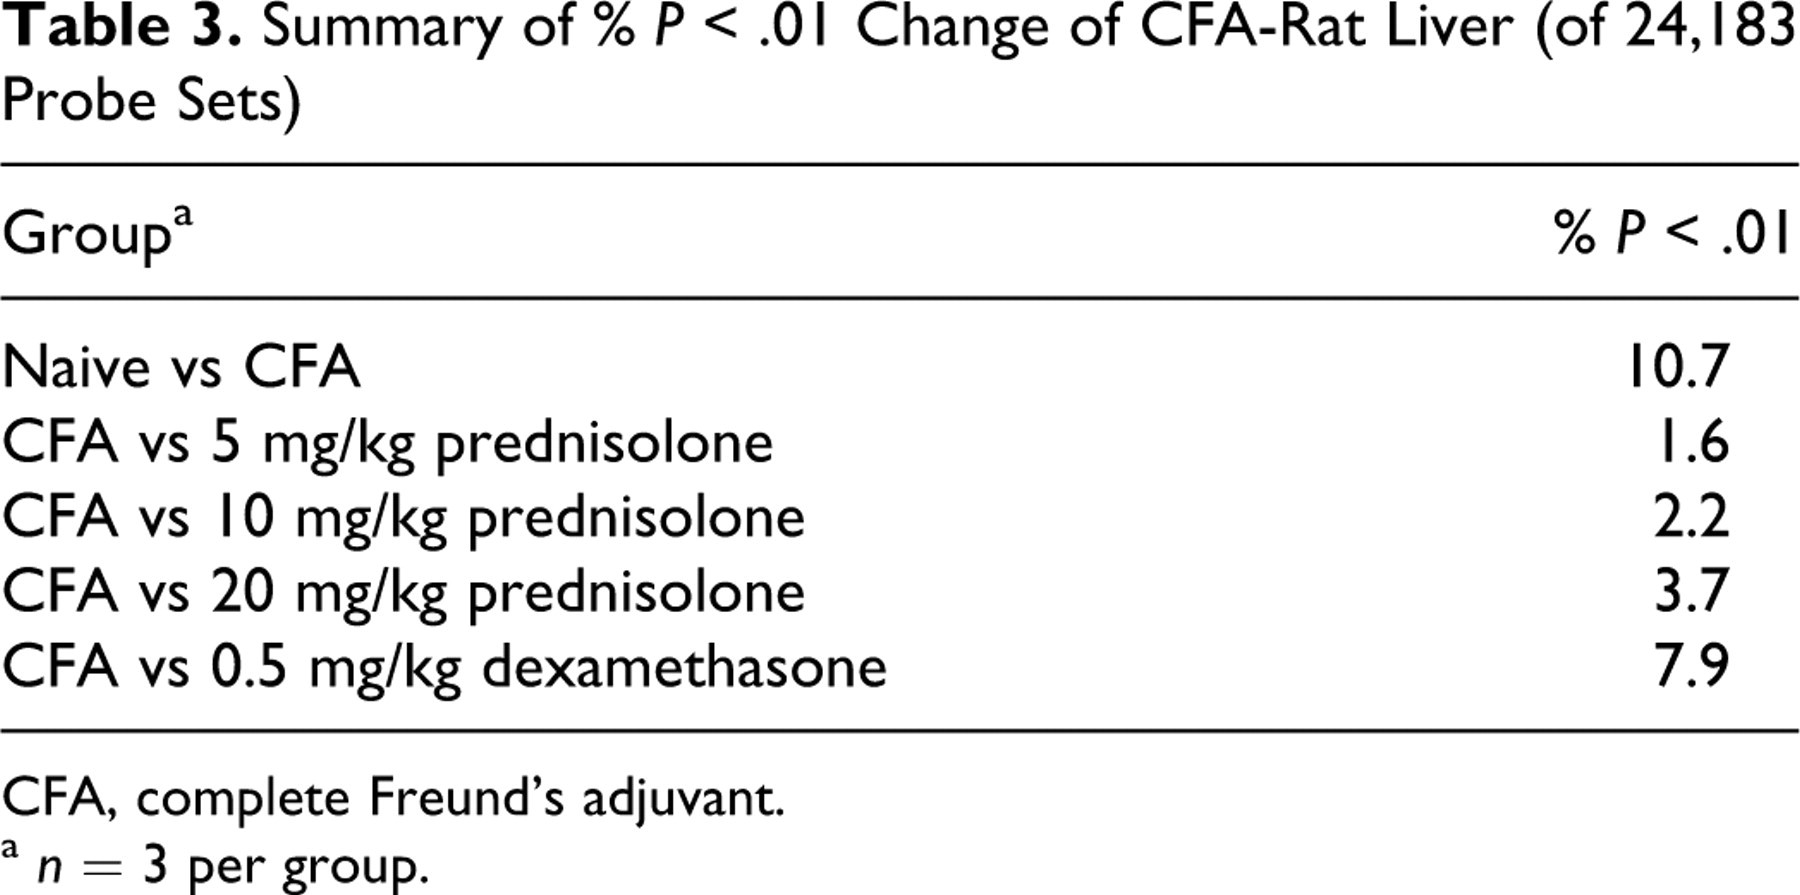
CFA, complete Freund’s adjuvant.
a n = 3 per group.
Top 20 Hepatic Transcripts Increased by CFA Treatment in Rats (P < .01 and Twofold or Greater Change) and Responsive to Prednisolone and/or Dexamethasone (P < .01 Relative to CFA): Hepatic Transcripts Are Organized by Associated Pathways
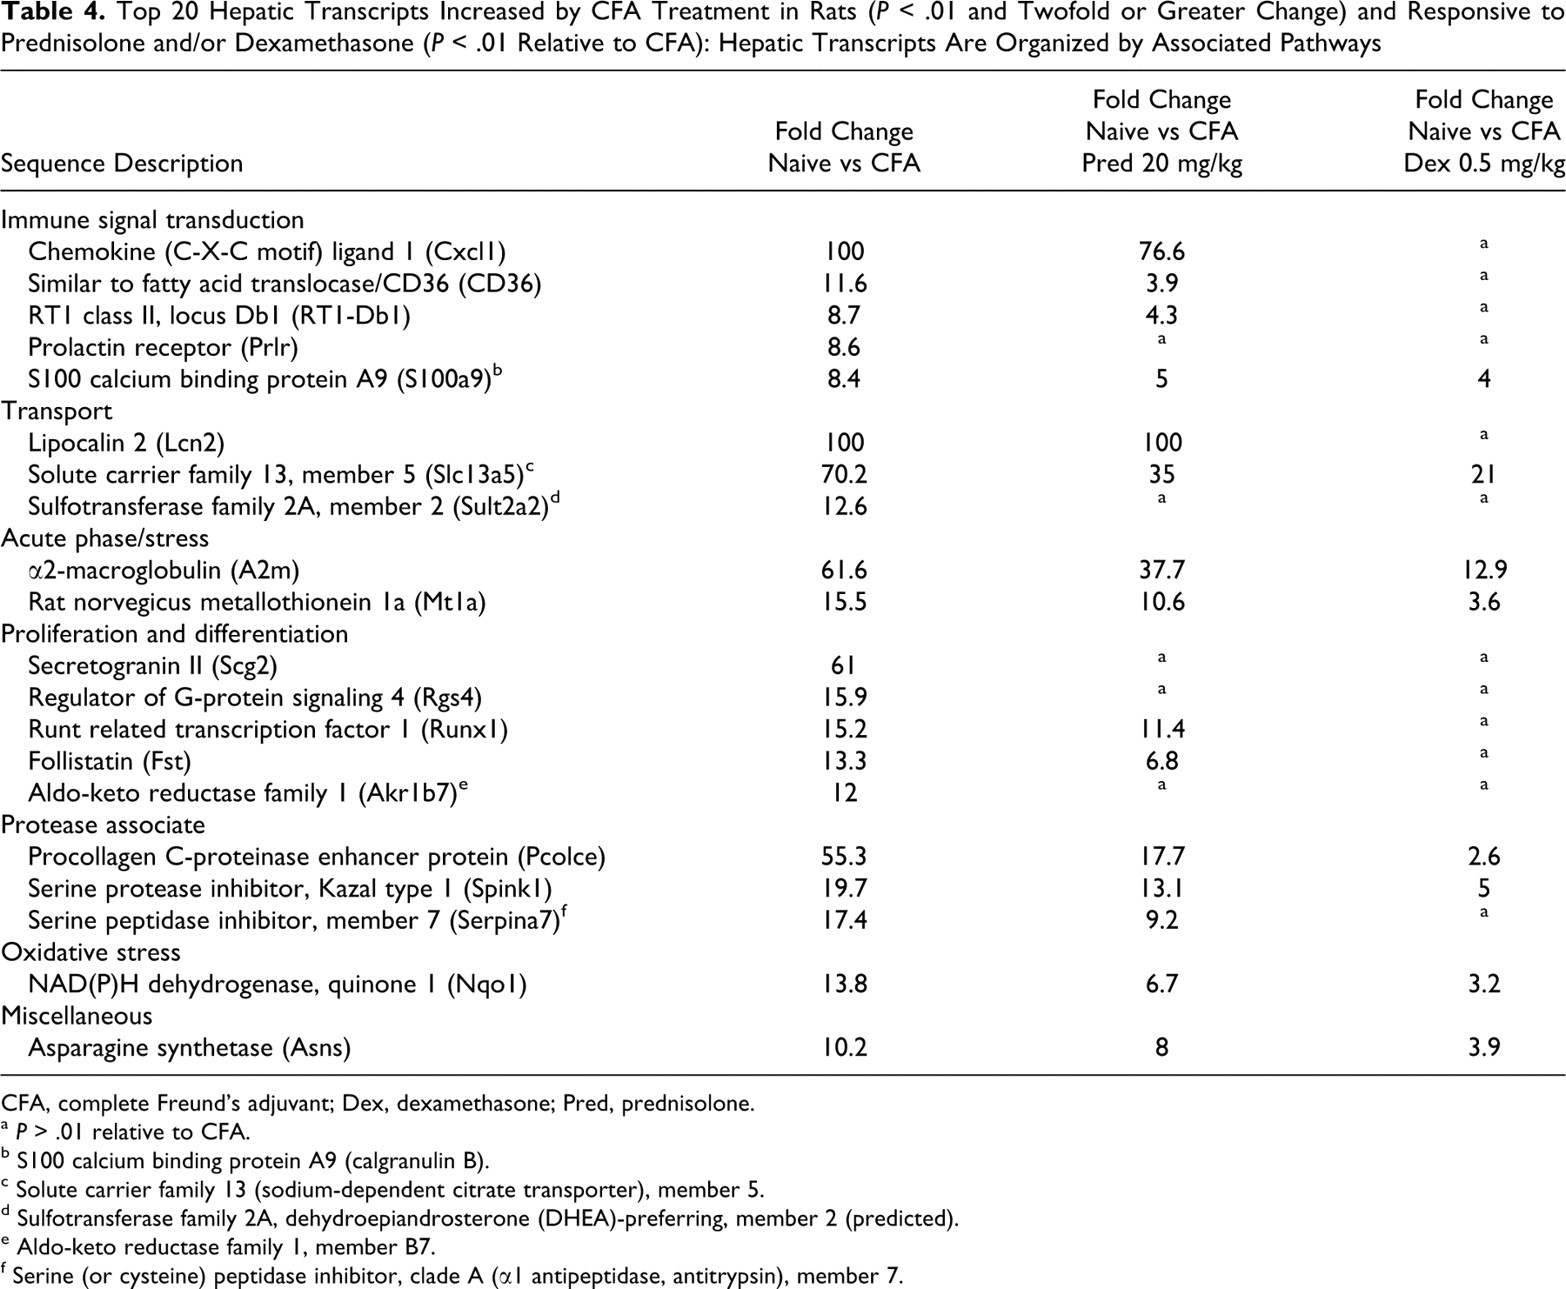
CFA, complete Freund’s adjuvant; Dex, dexamethasone; Pred, prednisolone.
a P > .01 relative to CFA.
b S100 calcium binding protein A9 (calgranulin B).
c Solute carrier family 13 (sodium-dependent citrate transporter), member 5.
d Sulfotransferase family 2A, dehydroepiandrosterone (DHEA)-preferring, member 2 (predicted).
e Aldo-keto reductase family 1, member B7.
f Serine (or cysteine) peptidase inhibitor, clade A (α1 antipeptidase, antitrypsin), member 7.
Top 20 Hepatic Transcripts Decreased by CFA Treatment in Rats (P < .01 and Twofold or Greater Change) and Responsive to Prednisolone and/or Dexamethasone (P < .01 Relative to CFA): Hepatic Transcripts Are Organized by Associated Pathways
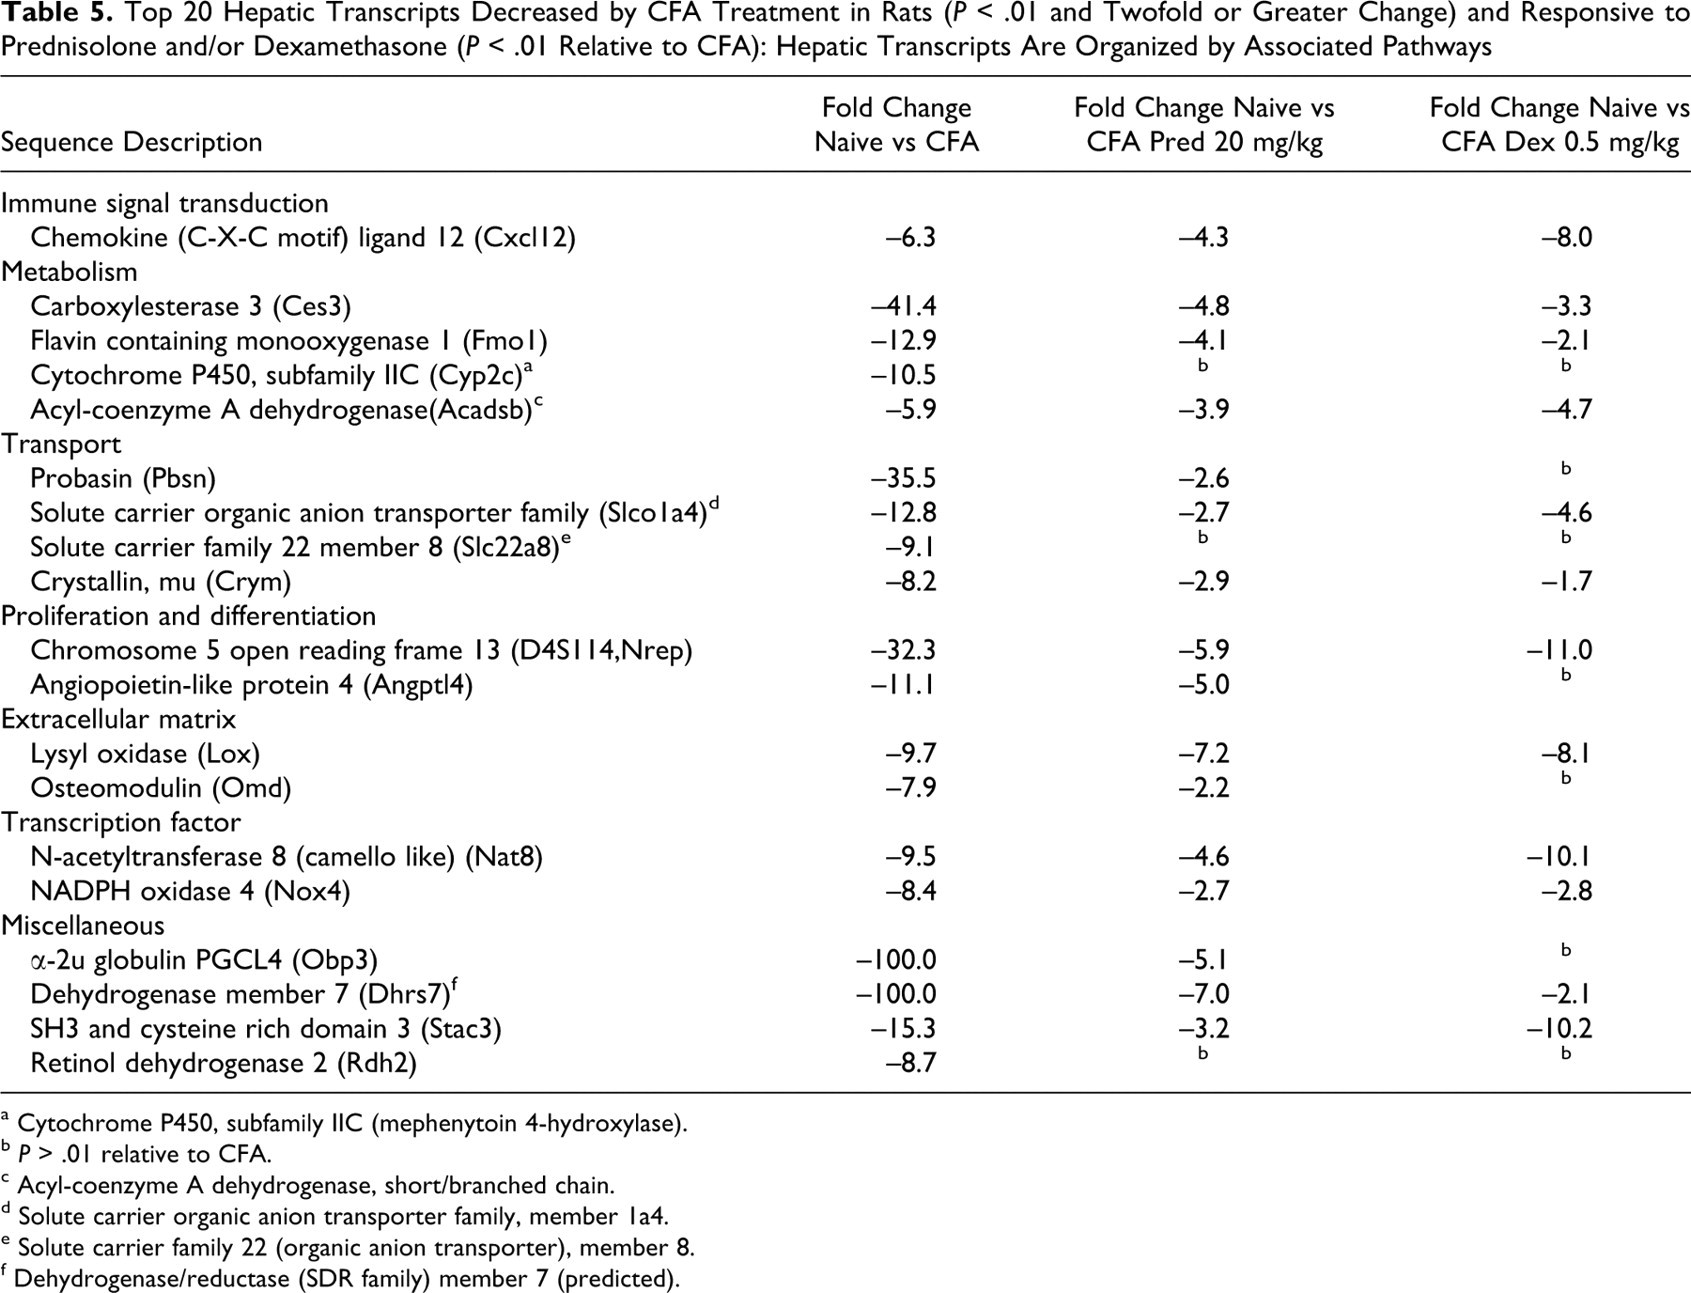
a Cytochrome P450, subfamily IIC (mephenytoin 4-hydroxylase).
b P > .01 relative to CFA.
c Acyl-coenzyme A dehydrogenase, short/branched chain.
d Solute carrier organic anion transporter family, member 1a4.
e Solute carrier family 22 (organic anion transporter), member 8.
f Dehydrogenase/reductase (SDR family) member 7 (predicted).
Quantitative Real-Time Polymerase Chain Reaction
A subset of genes representing 15 altered hepatic transcripts were selected for analysis by qRT-PCR to validate microarray results. For all of these altered hepatic transcripts (Table 1), there was excellent correlation (0.96 concordance) in fold change values between RT-PCR and DNA microarray techniques.
Discussion
In this study, the rat AIA model was used to study the effects of prednisolone and dexamethasone on a systemic inflammatory process. The Lewis rat AIA model is not only a model of polyarthritis but also induces pathologic changes in a variety of other tissues including the liver and spleen. 4 Thus, to identify transcriptional changes associated with adjuvant-induced systemic inflammation, hepatic transcript abundance of normal untreated (naive) rats to those administered CFA was analyzed by Affymetrix array. Furthermore, hepatic transcript abundance was evaluated from CFA-treated rats that were also administered GC (eg, prednisolone and dexamethasone) at the onset of CFA-induced clinical disease (~12 days post CFA). When naive rats were compared with rats administered CFA alone, approximately 10% of hepatic transcripts were altered (P < .01) in the liver. Approximately 31% of these hepatic transcript abundance changes were partially reversed with treatment with dexamethasone and about 13% with prednisolone.
As this was a model of systemic inflammation, the focus of this study was on increased hepatic transcript abundance associated with CFA administration that was altered by GC administration. As expected, there was increased abundance of numerous transcripts associated with immune signal transduction, whereas others increased by CFA were classified as having roles in molecular transport, acute phase response, and oxidative stress and as proteases. Transcripts with treatment-related decreases in abundance were associated with metabolism, molecular transport, proliferation and differentiation, extracellular matrix, and transcription. Hepatic transcript abundance demonstrated a clear therapeutic response to GC treatment, which correlated with improved clinical score (eg, paw volume measurement) and a significant decrease in the incidence and severity score for hepatic granulomas. Despite differences in potency between dexamethasone and prednisone in the reduction in paw volume measurements (100% for dexamethasone at 0.5 mg/kg vs 75% for prednisolone at 20 mg/kg), treatment-related changes in transcript abundance for GC treatment indicate that both GCs have similar or overlapping anti-inflammatory effects. For instance, MHC II hepatic transcript abundance, which was induced by CFA, was partially or completely reversed by prednisolone or dexamethasone treatment. Furthermore, MHC class II protein expression pattern as expressed by IHC correlated with the mRNA expression pattern. MHC class II genes have been reported to be involved in the pathogenesis of RA in mouse models and in RA patients. 8,17,27 Induced expression of MHC class II genes involved in antigen presentation and subsequent cytokine secretion and lymphocyte recruitment are important for the development of RA. 17 It has been suggested that the level of MHC class II expression on myeloid cells inversely correlates with disease progression in RA patients. 38 The reduction in MHC class II hepatic transcript abundance following treatment with GCs in this study may be secondary to inhibition of interferon-γ–induced MHC class II expression, which indirectly alters the balance of Th1/Th2 cytokines—blocking the proinflammatory and favoring the anti-inflammatory processes. 3 The observed decrease in CD3-positive cells infiltrating the liver after GC treatment in the face of decreased MHC class II mRNA and protein expression in this study parallels clinical observations and is compatible with the known mechanism of action of GCs.
In a study using a slightly different rat AIA model protocol, transcriptional profiling indicated that 30% of the genes in the liver were regulated by CFA. 15 This group also evaluated the anti-inflammatory effects of an estrogen receptor (ER) β-selective ligand in the rat AIA model and the liver transcriptional profile after administration of this ERβ-selective ligand, and their finding was similar to the expression patterns described in our study. For instance, changes in hepatic transcript abundance of immune signal transduction (S100A9, IL6Ra, Prlr, Gas 6, Stap2, JAK3), innate immunity (Lbp, Hmox1), acute phase (A2M, Lyz), oxidative stress (Nqo1), protease associated (Spink1, Serpina7), and transport (Lcn2, Slc21A10) were similar between the two studies. Of particular interest is abundance change for calcium-binding proteins S100A9 (calgranulin B), which is generally coexpressed with S100A8 (calgranulin A) to form a heterocomplex, and high expression of both genes is closely associated with the pathogenesis of RA. 11,16 Both S100A9 and S100A8 have been reported to regulate leukocyte transmigration. 39,51 However, differences in response between the ERβ-selective ligand and GC treatment occurred in that the ER ligand treatment reversed the expression of S100A8, whereas in our study S100A8 in CFA-treated animals did not have a significant fold-change from naive animals nor was there an effect with GC treatment (data not shown). However, it has been reported that GCs can upregulate S100A8 gene expression and enhance S100A8 mRNA stability via multiple pathways. 23 In the absence of coexpression of S100A9, high S100A8 expression level alone might protect against oxidative damage since S100A8 has been shown to express anti-inflammatory properties in oxidative defense in acute inflammation. 46
In this study there was in increase an hepatic transcript abundance of secretogranin II (Scg2, ~60-fold change) by CFA, which was totally reversed by GC treatment. Elevated expression of Scg2 has been observed in the synovium of patients with RA and osteoarthritis (OA). 12,55 Scg2 belongs to the granin family of secretion proteins, and Scg2-derived secretoneurin (SN) is a neuropeptide with chemotactic activity for fibroblasts and monocytes. 26,49 By in situ hybridization, it has been shown that SN mRNA was widely distributed in the synovial tissue from both RA and OA patients, but the SN protein level was much lower in RA than that observed in OA. 55 Eder et al 12 showed similar elevations in protein levels. 12 These results indicated that SN is mainly involved in acute phases of synovial inflammation but might not play a major role in the more prolonged inflammatory processes and may underscore the palliative effects of GC treatment for this condition. 12
In the current study, elevated prolactin receptor (PRLR) expression level was observed with CFA administration to rats, which was reversed by GC treatment. It has been reported that the expression of prolactin (PRL) and its receptor PRLR in RA synovium enhanced RA synovial cell proliferation. 40 PRLR has been shown to be exclusively expressed on fibroblast-like synovial cells and in infiltrating lymphocytes in the synovium in patients with RA. 40,48 PRLs can affect RA synovial cell functions through enhancing T-lymphocyte immune reactivity as well as through their influence on synovial fibroblasts to exacerbate RA lesions. 21,33,52 Other mechanisms of PRL involved in RA pathogenesis included the synthesis of catabolic enzymes such as matrix metalloproteinases that contribute to changes in extracellular components for joint destruction 35 and the effect on transcription factors leading to cell proliferation, such as PRL-affected STAT-5 of primary synovial fibroblasts from patients with RA. 22 The role, if any, of systemic PRLR expression as observed in rat AIA remains unknown.
Two other hepatic transcripts induced by CFA administration in rats and associated with RA in humans are chemokine (C-C motif) ligand 21 (Ccl21) and CD36, 30 both of which were attenuated by GC treatment in this study. Local high expression of Th1 cytokines has been shown to contribute to the mechanisms of RA pathogenesis. 44 The migration of Th1 proinflammatory cytokine–producing cells into inflammatory sites has been associated with the expression Ccl21. 45 Ccl21 also participated in ectopic lymphoid tissue formation in RA. 34 Koch et al 29 showed that CD36 and its ligand thrombospondin-1 (TSP) are abundantly coexpressed in macrophages and endothelial cells in chronically inflamed rheumatoid synovium. Both CD36 and TSP have chemotactic effects of leukocytes to inflammatory sites in RA. TSP is a costimulator for the activation of autoreactive T cells through interaction with CD36 on antigen-presenting cells (APCs) and with CD47 on T cells. 18 The trimolecular complex formation of CD47-TSP-CD36 significantly decreases the threshold of T-cell activation and increases the recruitment of tissue-infiltrating T cells. 57 Furthermore, CD36 is a coreceptor for Toll-like receptor 2 (TLR2) involved in signaling pathways, such as nuclear factor κB or p38 mitogen-activated protein kinase, which induce the production of cytokines such as tumor necrosis factor and interferon-α, thus having an important role in the pathogenesis of RA. 42
CFA administration in rats resulted in decreased hepatic transcript abundance for hepatic transcripts associated with various cellular processes. In general, many of these responses have been shown to be altered by inflammatory responses. For instance, as observed in this study, expression of cytochrome P4502C family members, male rat–specific α2 urinary globulin, and carboxylesterases can be downregulated secondary to inflammation and exposure to peroxisome proliferators. 1,7,10,14,53 Numerous other hepatic transcripts that were downregulated in this study (Table 5) have also been shown to be reduced secondary to inflammatory processes either directly or via altered cellular metabolism (eg, Fmo1, Lox, Rdh2, Slco1a4, Slc22a8) 2,13,28,32 and may be reversed by GC-mediated reduction of inflammation, tissue regeneration, and remodeling (eg, Lox, Dhrs7) 58,59 or via induction by GCs (eg, Ces3, Fmo1). 31,56
In conclusion, the Lewis rat AIA model shares many similarities to human RA. It is interesting to note that for many of these genes that are playing important roles in the pathogenesis of human RA at the site of injury, the corresponding rat transcripts were expressed systemically in the liver after CFA administration and responded to GC treatment in this study. Treatment of rat AIA with GCs reversed the majority of hepatic transcripts altered by CFA. Thus, these data establish molecular changes in the liver and the effect of GCs in rat AIA, which can be used to aid in understanding the mechanism of action of novel anti-inflammatory compounds.
Footnotes
Acknowledgements
We thank Karen Phillips, Brenda Lehman, and Chris Hasson for their invaluable assistance for necropsy and histology support; Yijin She for assistance with Aperio image analysis; and Aiqing He, Stefan Ruepp, and Shen-jue Chen for assistance with microarray data analysis.
The authors declared that they had no conflicts of interest with respect to their authorship or the publication of this article.
The authors declared that they received no financial support for their research and/or authorship of this article.