
Abstract
Chronic 6- and 12-month rat toxicology studies were evaluated for their ability to predict tumor outcome in 2-year rat carcinogenicity studies for 80 pharmaceuticals from commercial and Merck databases. The data consisted of 62 (6-month) and 54 (12-month) studies, which included 30 rat carcinogens and 50 noncarcinogens in 2-year studies. The histopathology findings considered as evidence of potential preneoplasia in the chronic studies were hyperplasia, cellular hypertrophy, and atypical cellular foci. The authors hypothesized that a whole animal–based approach should be taken, wherein (1) evidence of potential preneoplasia in any tissue may serve as a sensitive predictor of tumor outcome in any tissue in the whole animal and not necessarily the same tissue and (2) the absence of evidence for potential preneoplasia in all tissues may serve as a strong negative predictor of tumor outcome in any tissue. Based on this whole animal approach, 25 of 30 rat carcinogens showed histopathologic signals in chronic toxicology studies, yielding a test sensitivity of 83%. The negative predictivity of the absence of histopathology findings in chronic toxicology studies of 50 nontumorigenic compounds was 88%. The value of the extra 6-month treatment was not apparent. The 5 false negatives (negative chronic studies but positive 2-year studies) are for marketed drugs approved for non-life-threatening conditions and associated with rat-specific mechanisms. The absence of preneoplasia in the whole animal is a reliable predictor of negative tumor outcome in 2-year rat studies, and approximately 50% rat carcinogenicity studies could be eliminated for the 80 pharmaceuticals examined, with no risk to humans and with a substantial reduction in animal usage and drug development time.
Keywords
The 2-year carcinogenicity study in rats evaluates the carcinogenic potential of pharmaceuticals and industrial chemicals. 7 Because of the long duration, the use of large numbers of animals, the high cost of studies, and the often nonrelevance of tumors observed to humans, the number of compounds that have been evaluated for carcinogenic potential is limited. Many investigators have evaluated whether the histopathological changes seen in shorter-term animal toxicology studies could successfully predict carcinogenicity outcome of 2-year studies.
Allen et al 1 assessed the correlation between liver lesions in toxicology studies up to 12-month duration and liver tumors in 2-year carcinogenicity studies in rats (87 compounds) and mice (83 compounds) from the National Toxicology Program database. Chronic histopathological changes considered for correlations included hepatocellular necrosis, hepatocellular hypertrophy, hepatocellular cytomegaly, bile duct hyperplasia, hepatocellular degeneration, and increased liver weight. They concluded that hepatocellular cytomegaly, hepatocellular hypertrophy, and hepatocellular necrosis predict carcinogenicity outcome. They also found that the inclusion of increased liver weights in the evaluation increased not only the number of liver carcinogens successfully predicted but also the false-positive prediction.
Melnick et al 12 reported that cytotoxicity and mitogenesis, which could lead to cell replication, were not strongly correlated with tumor outcome.
Jacobs 10 examined 13-week rat toxicology studies for prediction of carcinogenicity outcome for 60 pharmaceutical compounds. The data were obtained from a Food and Drug Administration (FDA) Center for Drug Evaluation and Research database, and the studies included those submitted between January 2002 and December 2005. Jacobs 10 concluded that various short-term indicators such as hyperplasia, hypertrophy, increased organ weights, tissue degeneration or atrophy, and mineralization in a tissue—did not always result in tumors in that tissue, although these indicators are generally considered signs of potential carcinogenicity concern. The tissues examined were the liver, kidney, mammary, thyroid, adrenal, urinary bladder, and lung.
In this report, we extend the studies of Jacobs 10 to evaluate the predictivity of preneoplastic changes observed in 6- and 12-month chronic rat toxicology studies with tumor outcome in rat 2-year carcinogenicity studies for pharmaceuticals. In agreement with Jacobs, we observed that the appearance of histopathological changes indicative of hyperplasia, cellular hypertrophy, and atypical cell foci were not reliable predictors of tumor outcome in the corresponding tissues. Our analysis showed that the accuracy of such histopathology findings in chronic toxicology studies to identify tumor positive compounds on a tissue-by-tissue basis (sensitivity) varied from 0% to 100%, depending on the tissue. We also analyzed the data using the whole animal response instead of individual tissues, testing a new more focused hypothesis that no evidence for preneoplasia in any tissue can accurately predict a compound’s lack of carcinogenic potential. If confirmed, then the presence of histopathologic preneoplastic evidence is not a definitive indicator of tumorigenic potential but rather requires that a 2-year rat carcinogenicity study be run and all tissues examined. If sufficient proof for this “whole animal negative predictivity hypothesis” can be generated, then the absence of any such changes in a chronic rat toxicology study can support a conclusion that the test compound is negative for carcinogenicity in rats and no further assessment in rats is needed. We provide data in support of this hypothesis (whole animal negative predictivity) and show that for the 80 compounds evaluated, such an approach would have introduced no risk to human health. These results have been communicated (V. Reddy, “Evaluation of Six- and Twelve-Month Rat Toxicity Assays as Predictors of Tumorigenicity,” Session on Carcinogenicity Testing Database, Drug Information Association Annual Meeting, June 2007, Atlanta, GA).
Materials and Methods
Rat Chronic Toxicology and Rat Carcinogenicity Studies: Rules for the Selection of Valid Pairs for Comparison
The rat carcinogenicity and chronic toxicology data used for evaluation came from 2 sources. The internal archives of Merck & Co, Inc, were mined, and Leadscope was contracted to establish a database of all freedom-of-information, publicly available rat chronic toxicology and 2-year carcinogenicity study data for pharmaceuticals. This evaluation focused on the rat carcinogenicity studies and not the mouse carcinogenicity studies because chronic toxicity studies are routinely conducted in rats but not mice. Six rules were applied for inclusion of studies, as stated in Table 1 and based on the study outcomes and the dose levels used. Studies were included in the evaluation when the dose levels in the chronic study and the carcinogenicity study did not differ by more than 25%. The value of ±25% was chosen to accommodate any day-to-day experimental variations between chronic toxicology and carcinogenicity studies (eg, dose preparation, dose received). Compounds were also included for analysis where the chronic study was negative at doses higher than those tested in the carcinogenicity study (rule 1); the chronic study doses were higher than those in carcinogenicity studies but where at least 1 dose in the chronic study was positive and matched the high dose used in the carcinogenicity study (rule 3); the chronic study was positive for the histopathologic signal, even if the relevant doses were less than 75% of the doses used in carcinogenicity studies (rule 4); and the chronic study was negative and the top dose was less than 75% of the top dose used in carcinogenicity studies, but lower doses in the carcinogenicity study matched those in the chronic study and there were positive tumor findings (rule 6).
Compounds were excluded on the basis of 2 criteria: First, the chronic study was positive for the histopathology signal only at doses more than 25% higher than the highest dose used in the carcinogenicity study (rule 4); second, the highest dose in the chronic study was less than 25% the lowest dose in the carcinogenicity study and was negative for histopathology signal (rule 5). Overall, these rules provide the most balanced data set for comparison of the 2 study durations. Note that although some of the compounds were excluded from the main evaluation based on the above rules, the results of including the entire data set have been presented and discussed.
Rules for Defining Valid Pairs of Chronic and Carcinogenicity Studies Based on Comparable Doses a
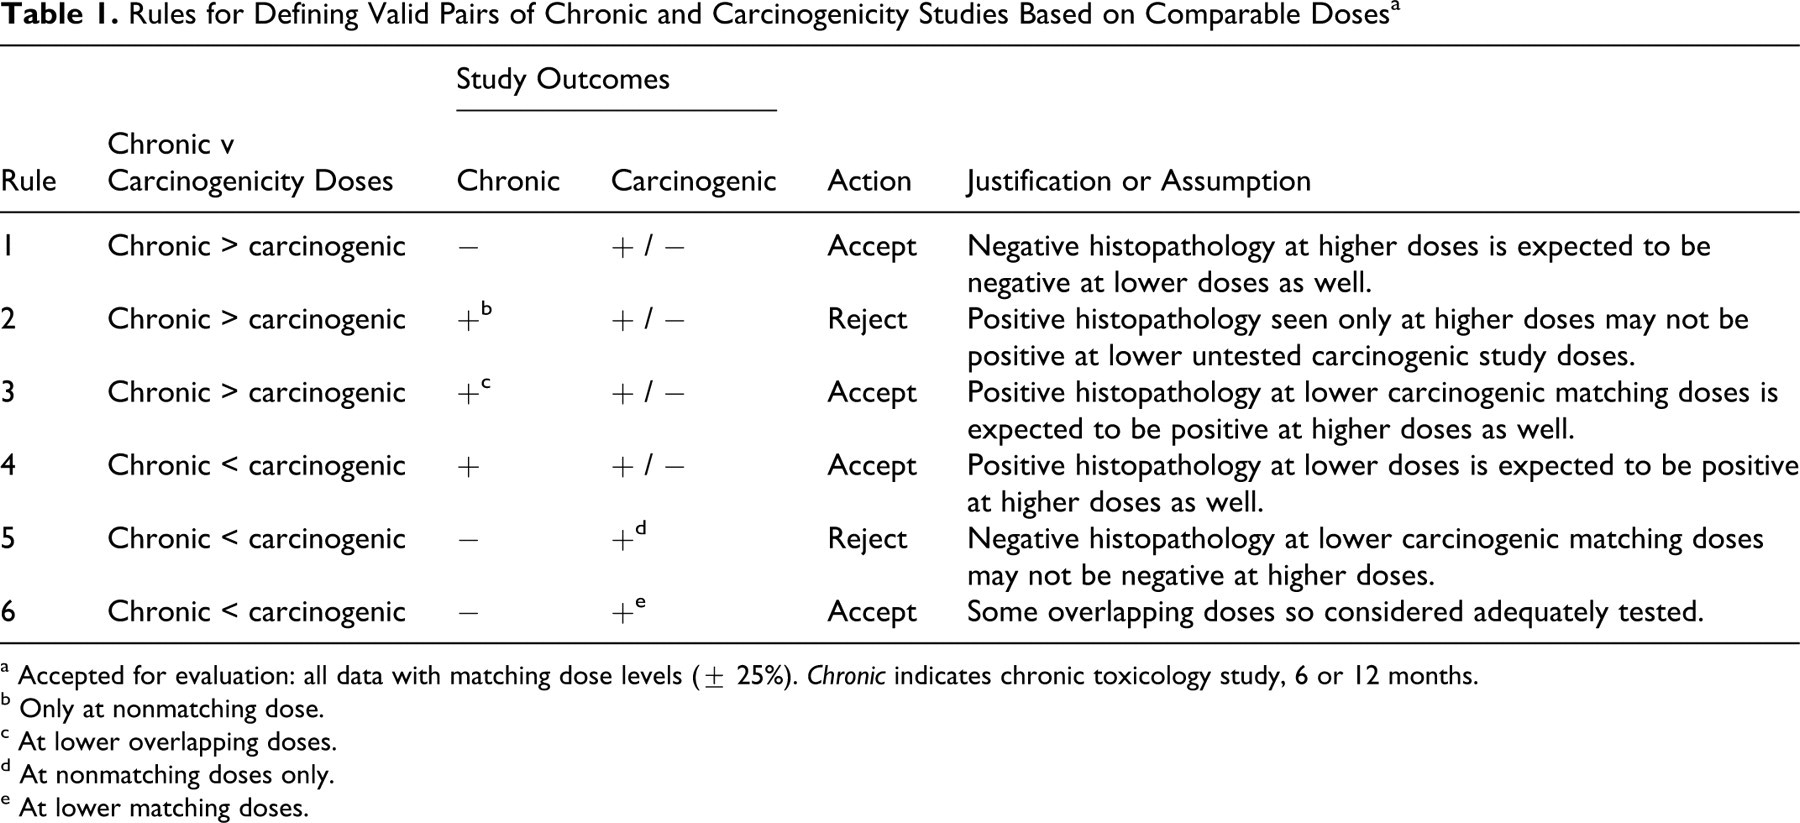
a Accepted for evaluation: all data with matching dose levels (± 25%). Chronic indicates chronic toxicology study, 6 or 12 months.
b Only at nonmatching dose.
c At lower overlapping doses.
d At nonmatching doses only.
e At lower matching doses.
Chronic Toxicology Study Data
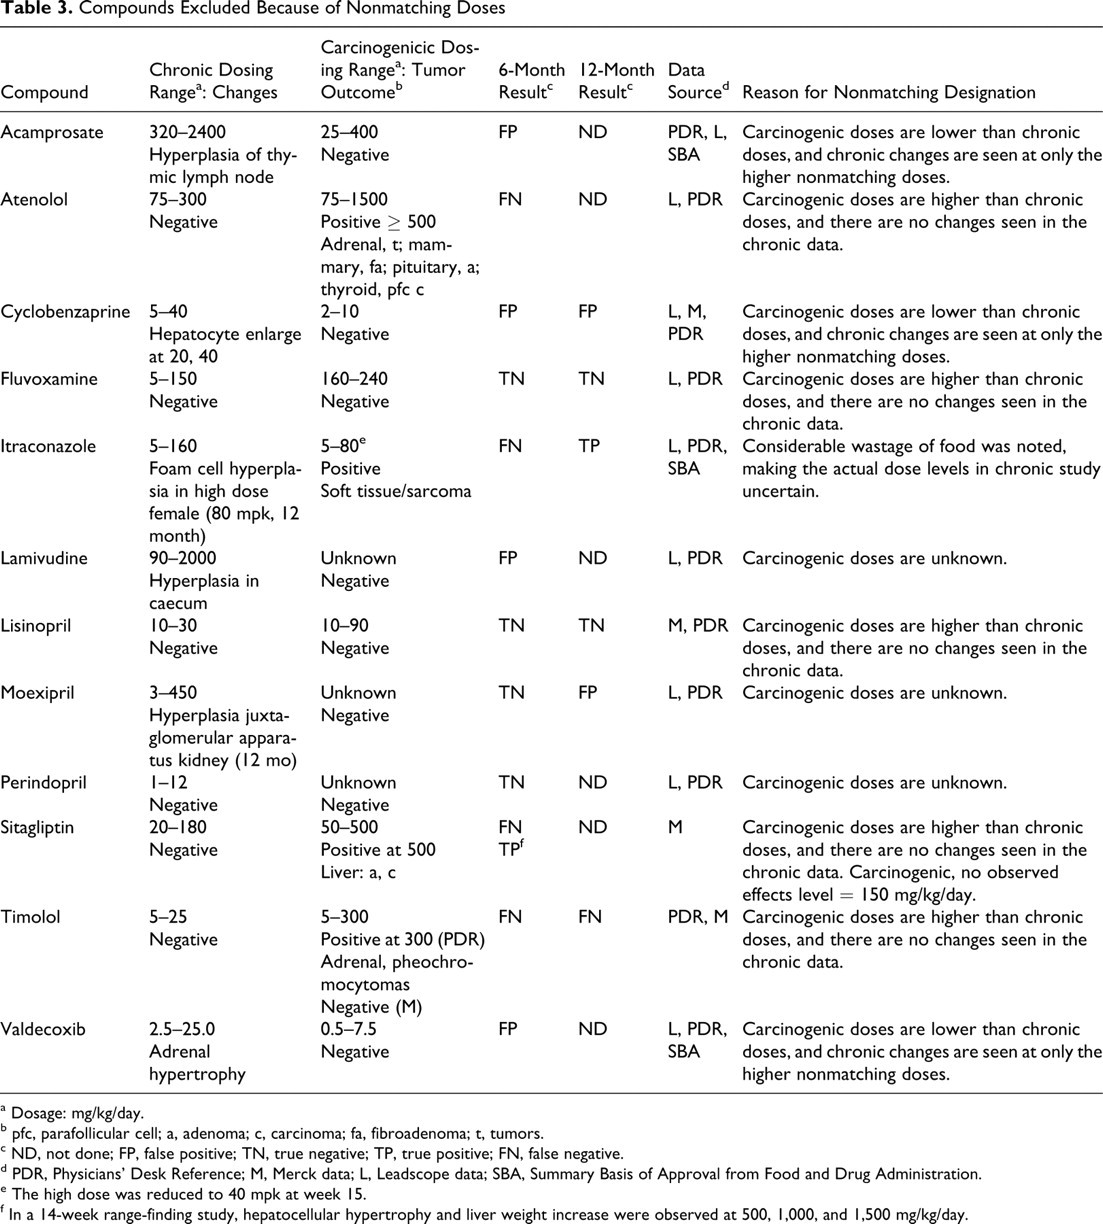
Leadscope was contracted to build a relational database of 6- and 12-month rat chronic toxicology study findings from publicly available sources, such as New Drug Application (NDA) reviews for each drug available through freedom-of-information requests. The data set from Leadscope covered drugs approved between 1939 and 2005 to the extent the data were publicly available, but it did not encompass all drugs approved in this time frame. The database contained FDA-approved pharmaceutical drugs and was searchable by drug name, tissue type, each of several toxicity endpoints, and duration of study or any combination of these parameters. We searched the Leadscope database by tissue for selected histopathological findings as evidence of potential preneoplasia from the 6- or 12-month chronic toxicology results (see Compound Classification section). Of 92 drugs in the Leadscope database, 57 drugs (25 carcinogen, 32 noncarcinogen) were identified as being valid for comparison (Table 2 ). Forty-four drugs (20 carcinogen, 24 noncarcinogen) had 6-month study data, and 33 drugs had 12-month study data (17 carcinogen, 16 noncarcinogen). A total of 20 drugs had both 6- and 12-month chronic studies. Of 92 drugs, 22 were excluded from the analysis because they had only 3-month toxicology studies, which were not included in the scope of this analysis. Eight others (plus 4 in the Merck database; see below) were excluded from the evaluation because they did not meet the criteria for the matching dose levels between the chronic toxicology studies and the 2-year carcinogenicity studies as defined in Table 1. Table 3 lists the 12 drugs from Leadscope and Merck that were excluded because of the nonmatching doses. To support these data and fill in any missing data, we acquired information from NDAs, SBAs (Summary Basis of Approval), and the latest labels from Drugs@FDA.com, from Physicians' Desk Reference (PDR) online, through the PharmaPendium database, and via specified freedom-of-information requests.
Leadscope and Merck Databases Used for Evaluating the 6- or 12-Month Chronic Studies as Predictors of the 2-Year Carcinogenicity Outcomes
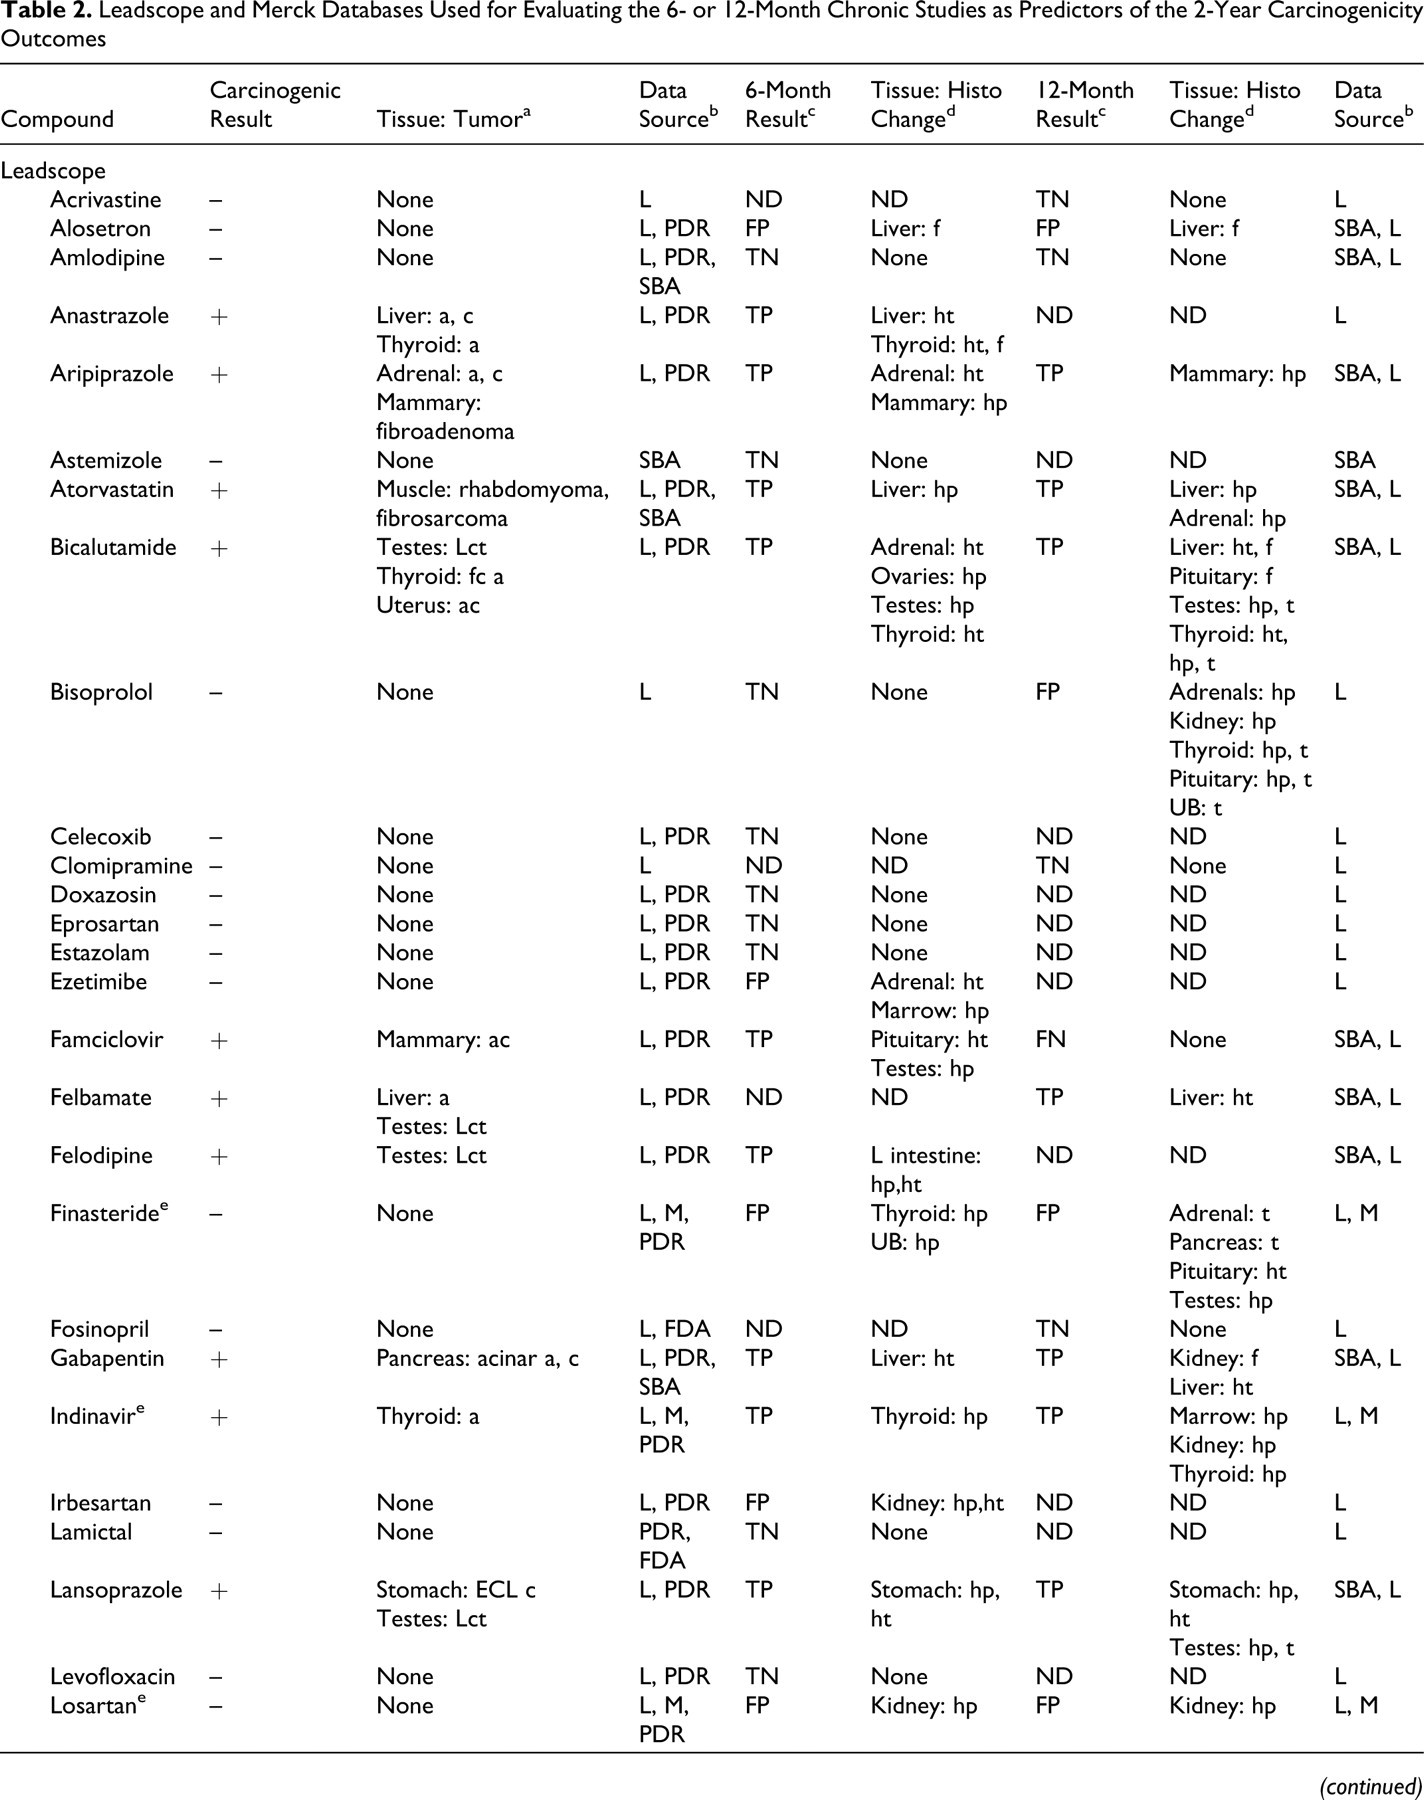
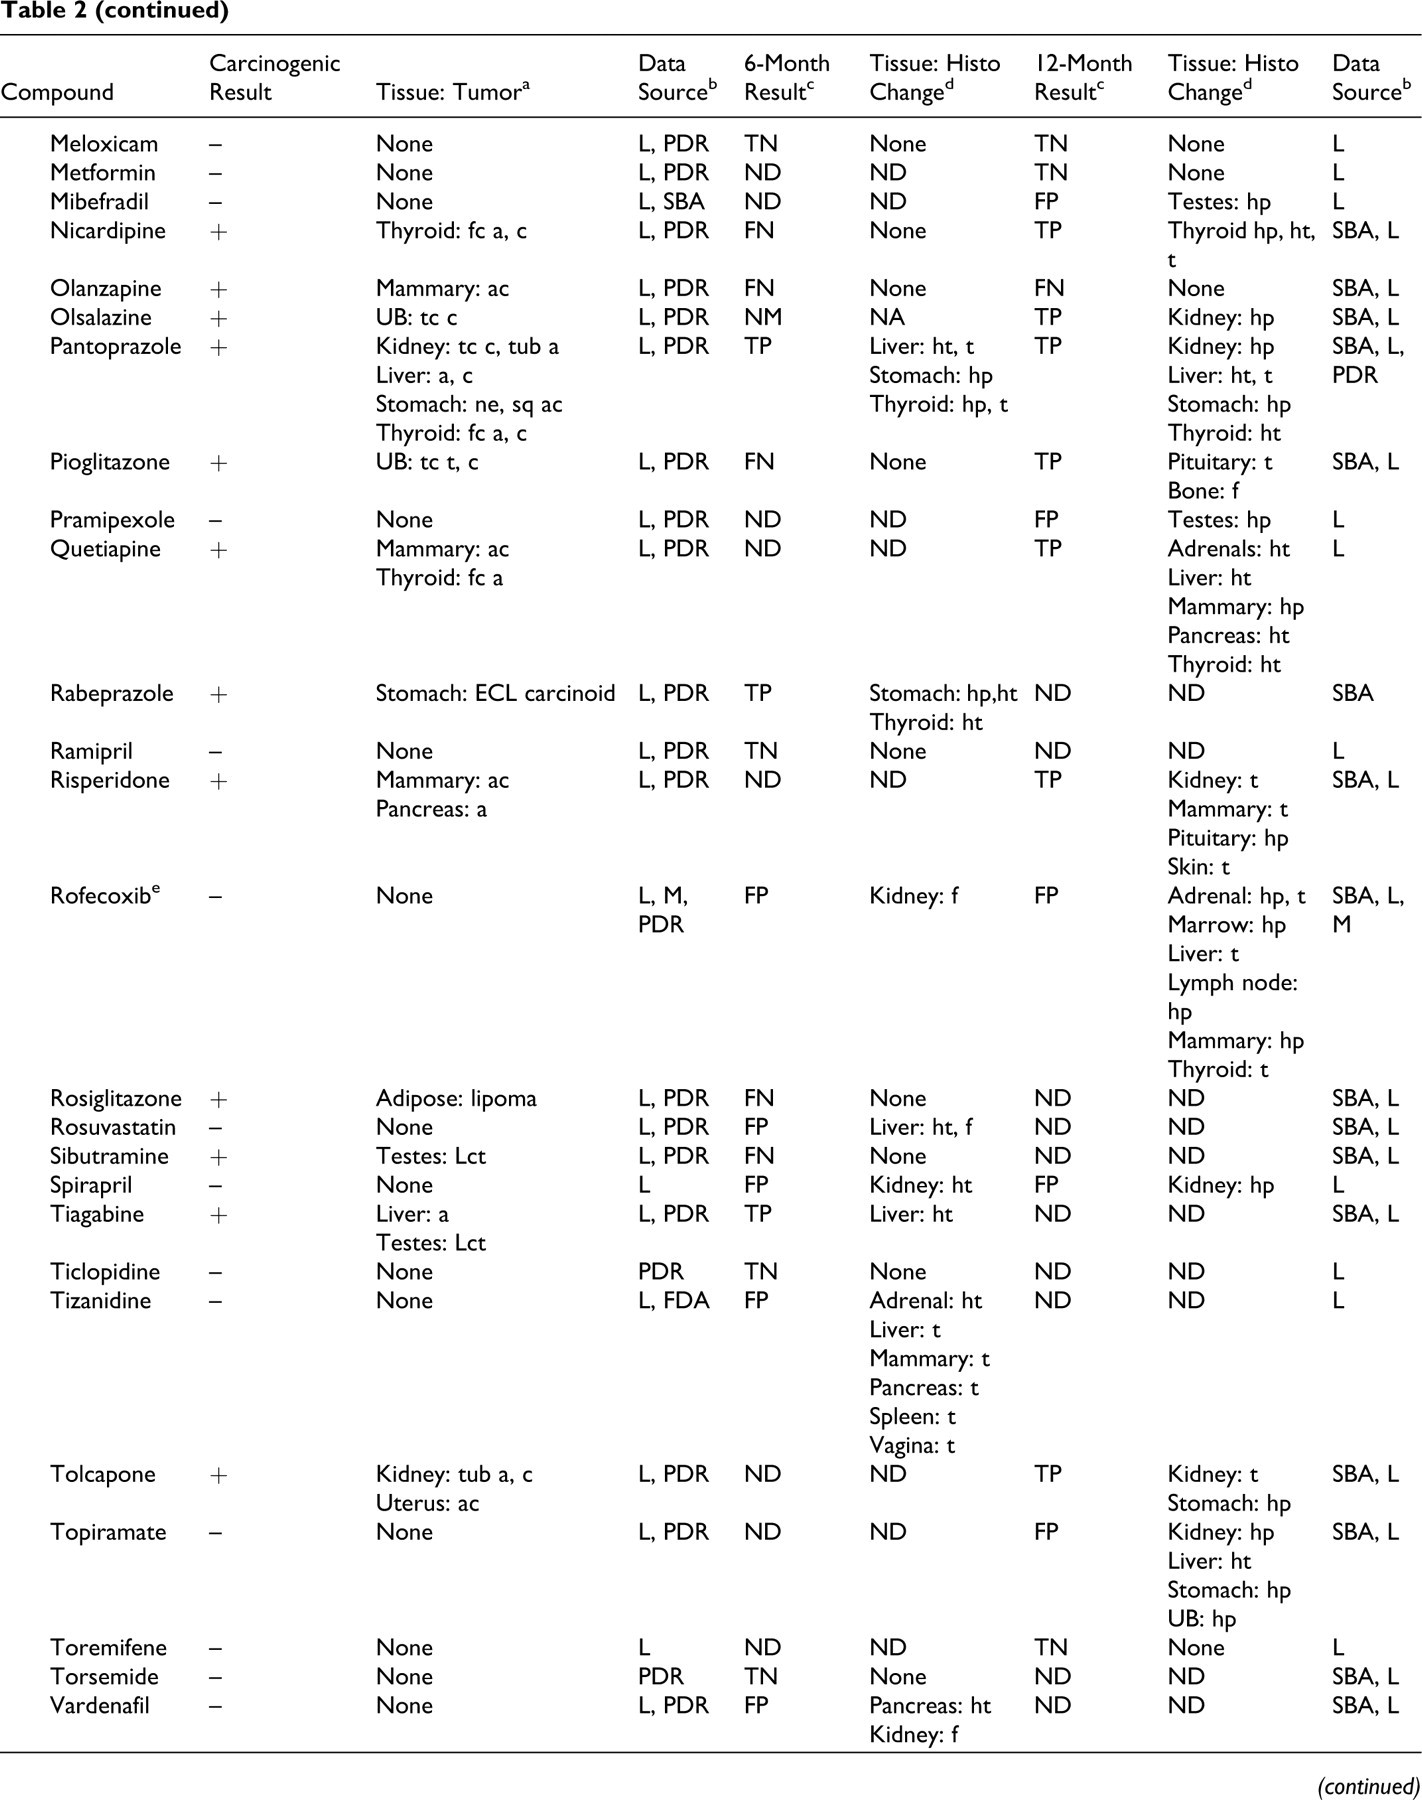
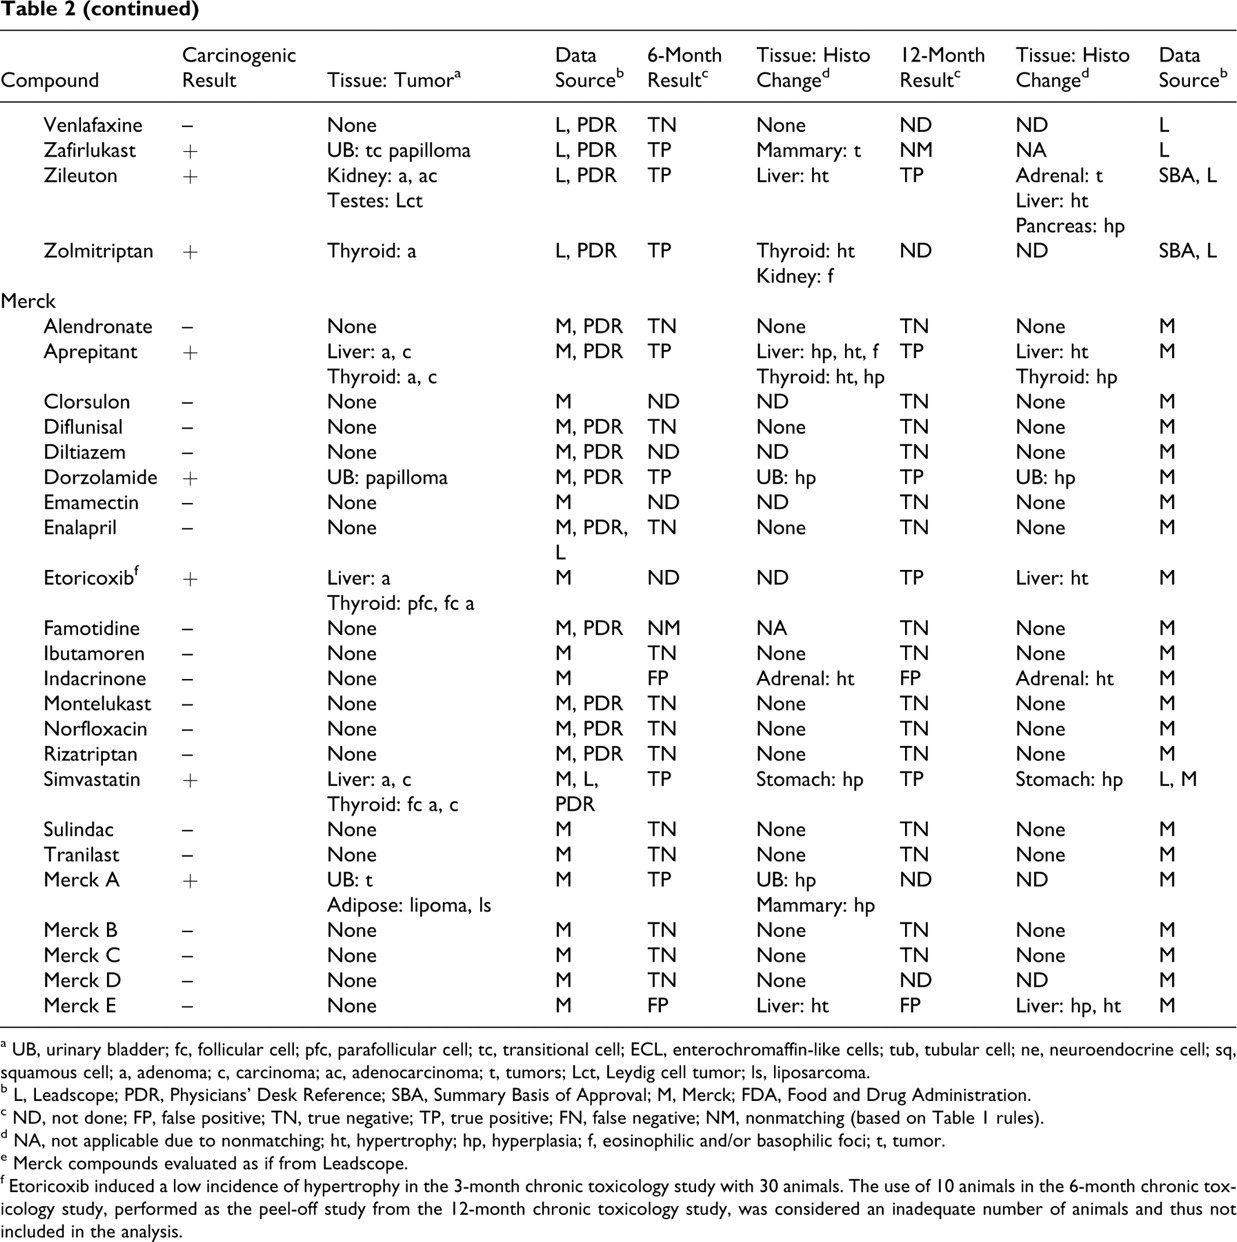
a UB, urinary bladder; fc, follicular cell; pfc, parafollicular cell; tc, transitional cell; ECL, enterochromaffin-like cells; tub, tubular cell; ne, neuroendocrine cell; sq, squamous cell; a, adenoma; c, carcinoma; ac, adenocarcinoma; t, tumors; Lct, Leydig cell tumor; ls, liposarcoma.
b L, Leadscope; PDR, Physicians' Desk Reference; SBA, Summary Basis of Approval; M, Merck; FDA, Food and Drug Administration.
c ND, not done; FP, false positive; TN, true negative; TP, true positive; FN, false negative; NM, nonmatching (based on Table 1 rules).
d NA, not applicable due to nonmatching; ht, hypertrophy; hp, hyperplasia; f, eosinophilic and/or basophilic foci; t, tumor.
e Merck compounds evaluated as if from Leadscope.
f Etoricoxib induced a low incidence of hypertrophy in the 3-month chronic toxicology study with 30 animals. The use of 10 animals in the 6-month chronic toxicology study, performed as the peel-off study from the 12-month chronic toxicology study, was considered an inadequate number of animals and thus not included in the analysis.
Compounds Excluded Because of Nonmatching Doses
a Dosage: mg/kg/day.
b pfc, parafollicular cell; a, adenoma; c, carcinoma; fa, fibroadenoma; t, tumors.
c ND, not done; FP, false positive; TN, true negative; TP, true positive; FN, false negative.
d PDR, Physicians' Desk Reference; M, Merck data; L, Leadscope data; SBA, Summary Basis of Approval from Food and Drug Administration.
e The high dose was reduced to 40 mpk at week 15.
f In a 14-week range-finding study, hepatocellular hypertrophy and liver weight increase were observed at 500, 1,000, and 1,500 mg/kg/day.
In-house data were retrieved from Merck’s Safety Assessment archives. Unlike the Leadscope database, Merck data contained approved and nonapproved drugs. The required data were extracted from the Merck Study Registry summary records, which contained a summary of histopathology and carcinogenicity interpretations by the study pathologists. The pathology postmortem reports were used for the clarification of summary results and for retrieval of the numbers of preneoplastic lesions and tumors. Of 31 compounds, 23 were valid pairs for comparison (5 carcinogens and 18 noncarcinogens); 18 included 6-month studies (4 carcinogens and 14 noncarcinogens); and 21 (4 carcinogens and 17 noncarcinogens) included 12-month studies (Table 2). Four drugs (Table 3) were excluded from evaluation for not meeting the criteria for matching dose levels. Four other Merck compounds were already present in the Leadscope database.
Carcinogenicity Data
Leadscope provided the carcinogenicity data, which were transcribed from the approved labels and NDA reviews. The carcinogenicity calls for the Merck compounds were based on the company’s summary records, which were the calls made by the study pathologists.
Compound Classification
The compounds were scored as positive for histopathology findings when any of the selected histologic changes were reported as being increased in the chronic toxicology studies—namely, hyperplasia, cellular hypertrophy, and atypical cellular foci. The diagnostic terms found in reports and tables included multinucleated cells, basophilia, basophilic foci, eosinophilic foci, cellular enlargement, cytomegaly, cellular swelling, cellular alteration, dysplasia, and tumor. The scope of terms encompassed within hyperplasia and cellular hypertrophy were operationally considered changes with preneoplastic potential, although they may not classically be considered strong evidence of preneoplasia because those terms are associated with atypical foci. The diagnostic terms are context dependent with respect to their association with potential preneoplasia. Histologic alterations—vaginal metaplasia and myocardial hypertrophy—were noted and not considered evidence of potential preneoplasia. These alterations were excluded because vaginal metaplasia is a cyclical change seen during estrous, and cardiac hypertrophy represents a functional response known not to be a step toward tumorigenicity. Vaginal metaplasia was noted for only 2 drugs: olanzapine and pramipexole.
The compounds were scored as negative for histopathologic evidence of potential preneoplasia when these changes were absent or not considered as being increased by treatment. The histopathology data from Leadscope were searched for the selected histopathology findings with these as keywords for each tissue and compound. If the histopathology incidences were retrieved, they were noted. All incidences higher than the control values were considered positive; with no access to original study reports, no attempts were made to reevaluate them in terms of whether they were treatment related or statistically significant. The incidences were low in some cases and could be within-background values but were considered increased when greater than control values. The Merck histopathology diagnoses were considered positive when identified in the narrative of the study report as being increased owing to treatment.
Compounds were considered positive for carcinogenicity when an increase in tumors was reported in the PDR or in NDA reviews. Compounds were considered negative in the 2-year study when no increase in tumors was reported or when observed tumors were reported as being not statistically significant or not treatment related in PDR and NDA reviews. A positive tumor effect for Merck compounds was based on the summary records.
Compounds that are positive for both histopathology findings and carcinogenicity are considered true positives (TPs). Compounds that are positive for histopathology findings but negative for carcinogenicity are considered false positives (FPs). Compounds that are negative for histopathology findings but positive for carcinogenicity are considered false negatives (FNs). Compounds that are negative for both histopathology findings and carcinogenicity are considered true negatives (TNs).
Results
Study Data
Table 2 lists the compounds, the carcinogenicity calls, the tumors observed, the carcinogenicity data source, their categorization (as TP, FN, FP, or TN at the whole animal level) based on the histopathologic evidence for preneoplasia documented in 6- or 12-month chronic toxicology studies, and the sources used for the data acquisition. The compounds from the Leadscope database are listed, followed by the unique compounds from the Merck database.
Testing the Hypothesis at the Whole Animal Level With the 6- or 12-Month Chronic Toxicology Studies: Combined Leadscope and Merck Data
When either 6- or 12-month chronic toxicology studies were considered, a total of 80 compounds could be evaluated (Table 4). The negative predictivity was 88% and the sensitivity was 83%. Based on a negative histology call, 50% of the 2-year bioassays could have been eliminated at the risk of 5 FNs (6%). For these analyses, when valid 6- and 12-month chronic study data were both available, the 6-month data were used to categorize a compound as TP, FP, TN, or FN. The sensitivity is a measure of the chronic toxicology study to accurately identify carcinogens—that is, the accuracy of any of the selected histologic lesions to predict positive carcinogenicity outcome. The specificity is the measure of the chronic toxicology study to correctly identify the noncarcinogens. Negative predictivity is the fraction of total compounds lacking the selected histologic lesions in the chronic toxicology study that were noncarcinogens. Positive predictivity is the fraction of total compounds presenting with 1 or more of the selected histologic lesions in the chronic toxicology study that were rat carcinogens. The concordance was an overall accuracy of the chronic toxicology study to successfully identify the rat carcinogens and noncarcinogens.
Predictivity of the 6- or 12-Month Chronic Toxicology Study With the Whole Animal Response a
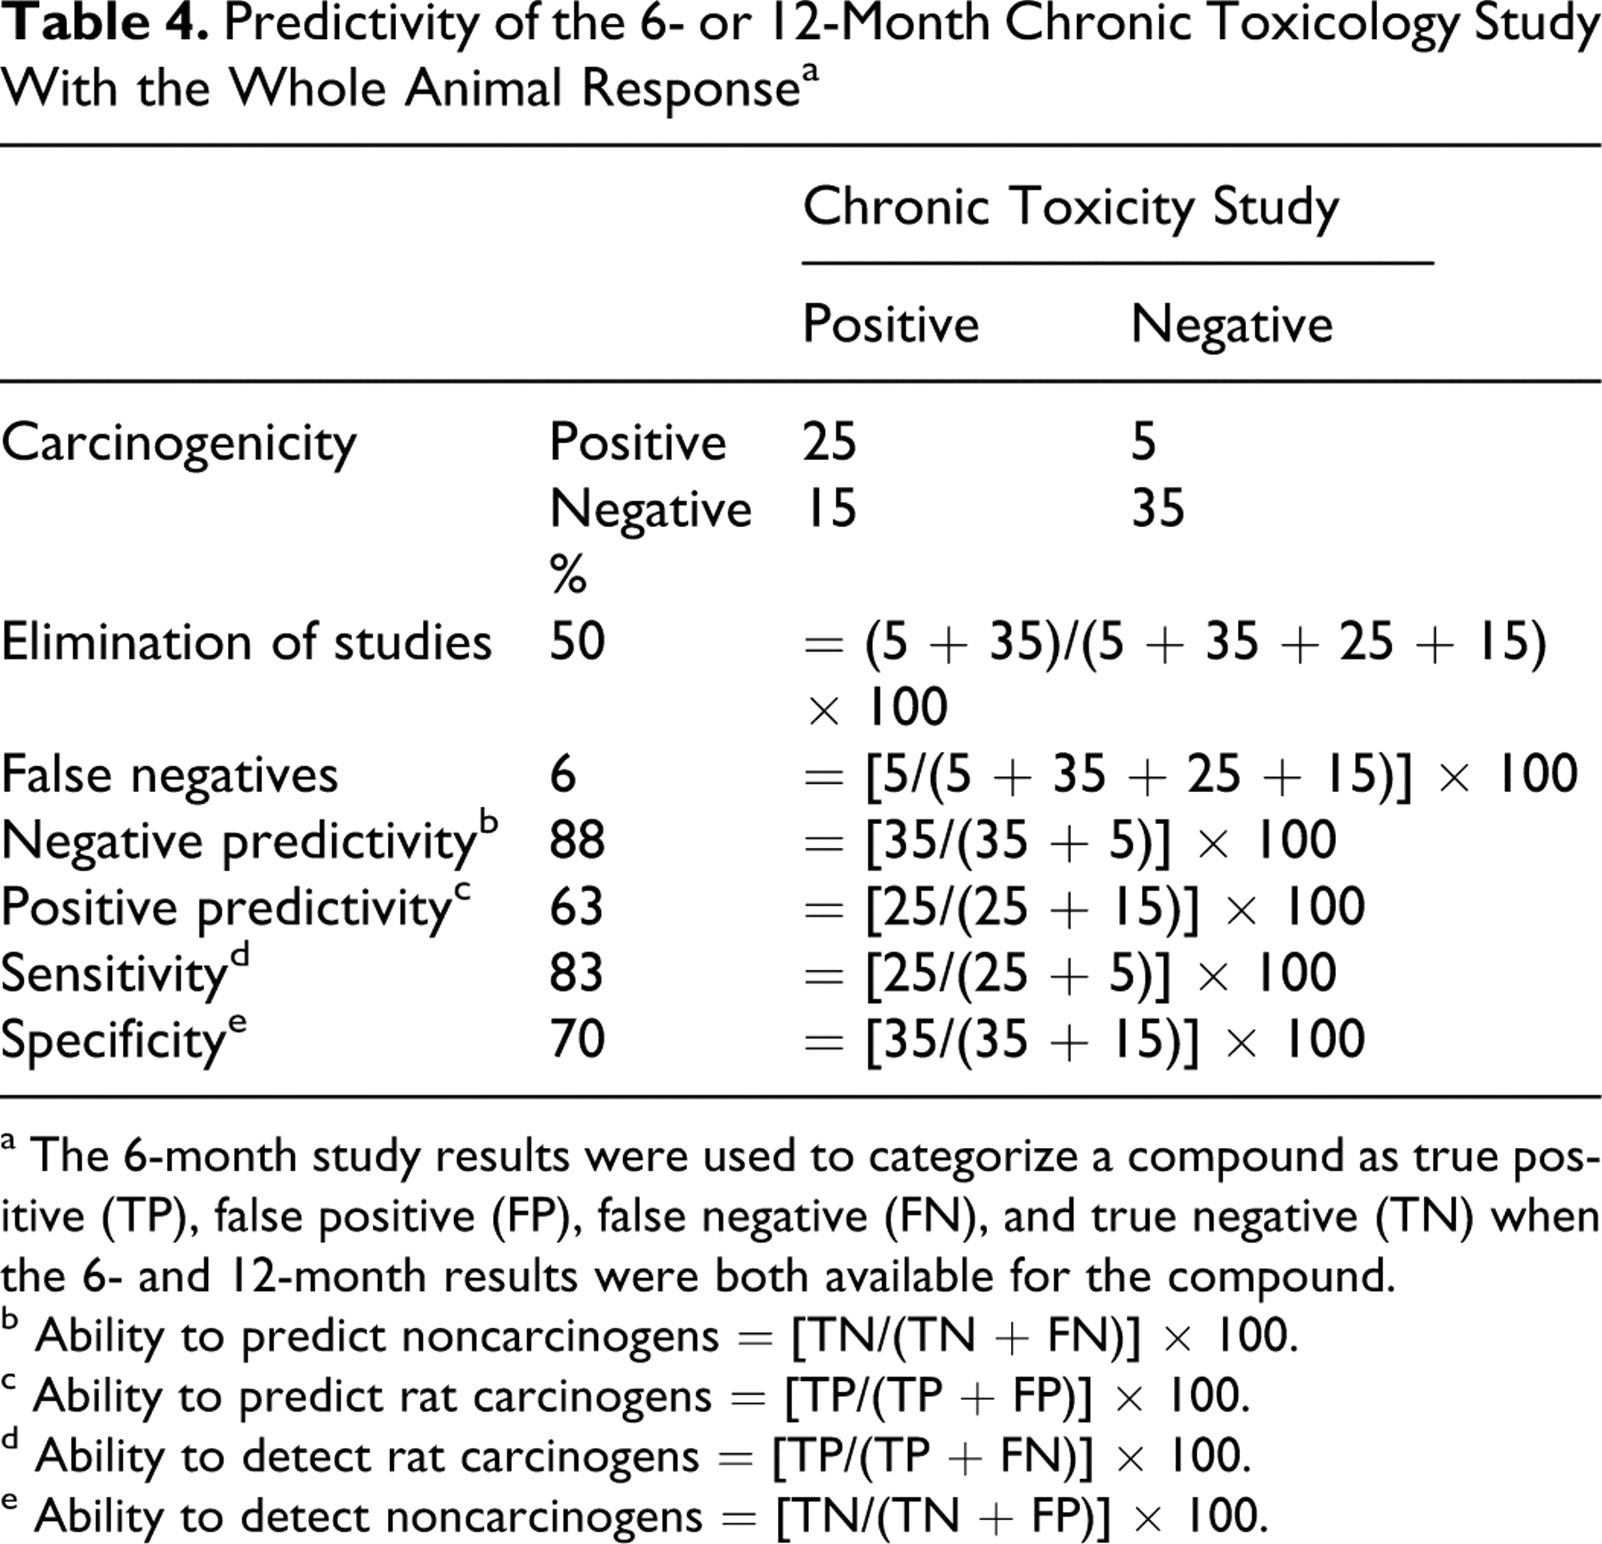
a The 6-month study results were used to categorize a compound as true positive (TP), false positive (FP), false negative (FN), and true negative (TN) when the 6- and 12-month results were both available for the compound.
b Ability to predict noncarcinogens = [TN/(TN + FN)] × 100.
c Ability to predict rat carcinogens = [TP/(TP + FP)] × 100.
d Ability to detect rat carcinogens = [TP/(TP + FN)] × 100.
e Ability to detect noncarcinogens = [TN/(TN + FP)] × 100.
The 6-month chronic toxicology data for 62 compounds listed in Table 2 showed a negative predictivity of 84% and sensitivity of 79%. The values for the 12-month chronic toxicology studies for 54 compounds listed in Table 2 were 92% negative predictivity and 90% sensitivity. Although the 12-month study shows slightly improved negative predictivity and sensitivity, another way to assess any advantage of additional 6-month treatment is to compare the outcomes for the same compound.
To evaluate the effect of the additional 6 months of treatment on the accuracy of prediction, just the data for compounds containing 6- and 12-month studies were examined (Table 5). There were 36 compounds (derived from Table 2), a relatively small number, with both 6- and 12-month chronic toxicology studies. Various calculated parameters were similar in the 6- and 12-month studies, including percentage elimination of studies (47% versus 42%), percentage FNs (8% versus 6%), percentage negative predictivity (82% versus 87%), percentage positive predictivity (63% versus 62%), percentage sensitivity (80% versus 87%), and percentage specificity (67% versus 62%). Thus, the classification of compounds into 4 categories—namely, TP, FN, FP, and TN—was not markedly affected by extending the studies for an additional 6 months. The classification remained the same (as derived from Table 2) for 32 of 36 compounds. One TN changed to FP; 1 TP changed to FN; and 2 FNs changed to TPs. Overall, these data indicate that there may be no clear advantage gained by the additional 6 months of treatment.
Predictivity of Tumor Outcome From the 6- and 12-Month Chronic Toxicology Studies for the Same 36 Compounds
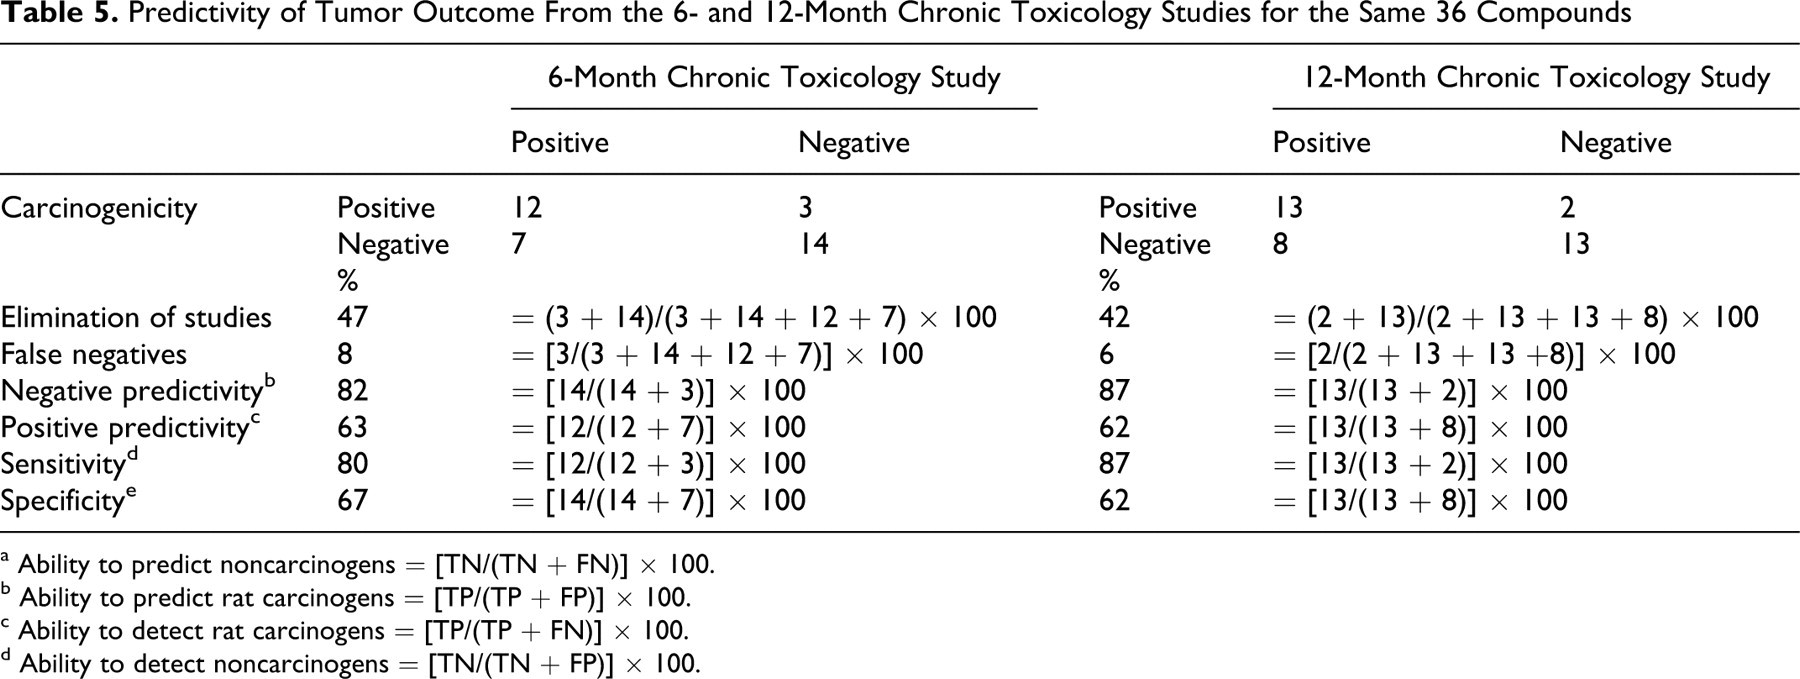
a Ability to predict noncarcinogens = [TN/(TN + FN)] × 100.
b Ability to predict rat carcinogens = [TP/(TP + FP)] × 100.
c Ability to detect rat carcinogens = [TP/(TP + FN)] × 100.
d Ability to detect noncarcinogens = [TN/(TN + FP)] × 100.
By accepting the hypothesis, one misidentifies 5 compounds as noncarcinogens (FNs) from the 6-month chronic toxicology study data. As such, we asked the question, what are the risks of accepting these as FNs? Table 6 shows the tumor incidences and suggested mechanisms for the tumorigenicity of these 5 FNs. All produced tumors based on proliferative or hormonal effects, 12,13 and the top dose in the carcinogenicity study was equal to or less than 25 times the human dose (as area under the curve or mg/m2). All are approved drugs for non–life-threatening conditions and for diseases where alternative therapies exist, suggesting that their risk is considered low by both the sponsors and the regulatory authorities. Table 7 lists the other histopathological changes seen with the 5 FNs. None showed any significant evidence of preneoplastic potential. The vaginal metaplasia noted in the 12-month study with olanzapine is considered a treatment-related effect on the estrous cycle, likely through hormonal modulation but not in itself evidence of preneoplasia in vaginal tissue. The 5 FNs were all negative in the 2-year mouse carcinogenicity assay (data not shown). None of these compounds were positive in genotoxicity assays (data not shown).
Tumor Data and Comments on Changes in the 6-Month Chronic Toxicology Studies Relevant to Increased Tumors in Carcinogenicity Studies for the 5 False Negatives
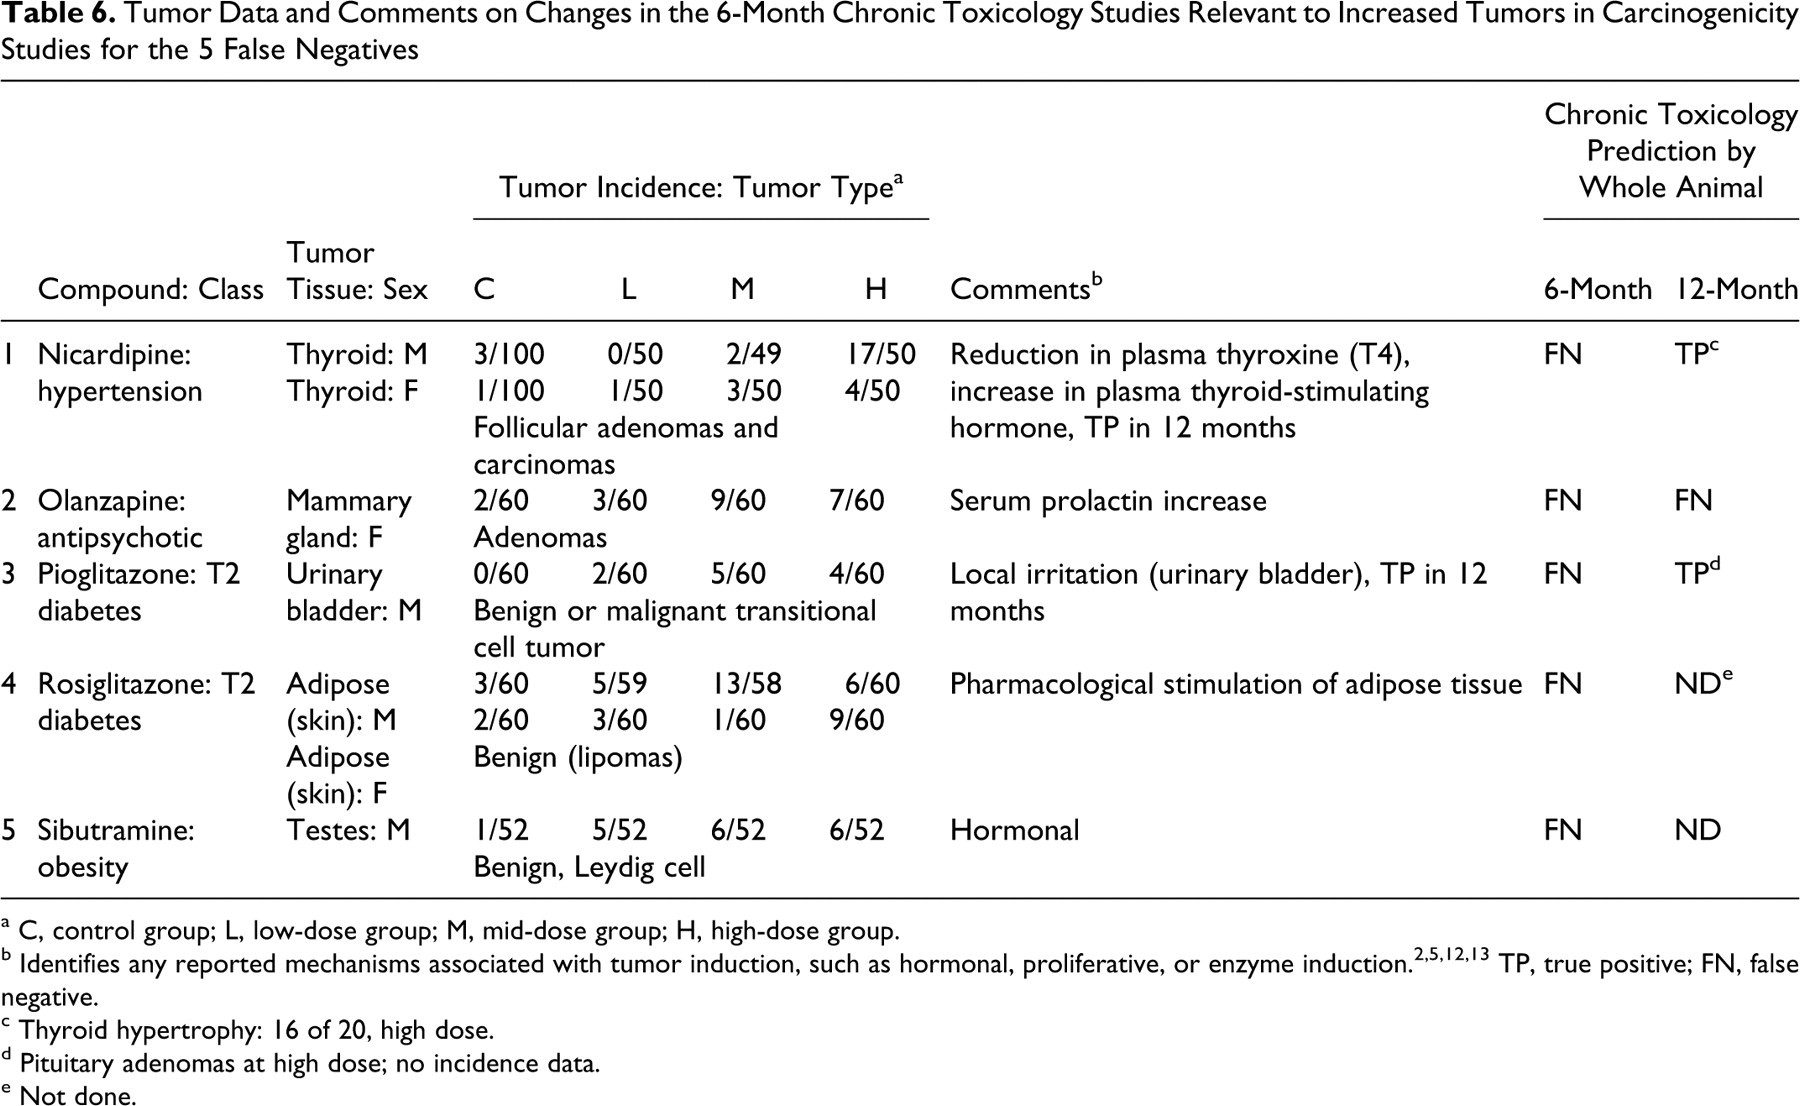
a C, control group; L, low-dose group; M, mid-dose group; H, high-dose group.
b Identifies any reported mechanisms associated with tumor induction, such as hormonal, proliferative, or enzyme induction. 2,5,12,13 TP, true positive; FN, false negative.
c Thyroid hypertrophy: 16 of 20, high dose.
d Pituitary adenomas at high dose; no incidence data.
e Not done.
19 a False-Negative Compounds on a Tissue-by-Tissue Basis in the 6- or the 12-Month Chronic Toxicology Studies
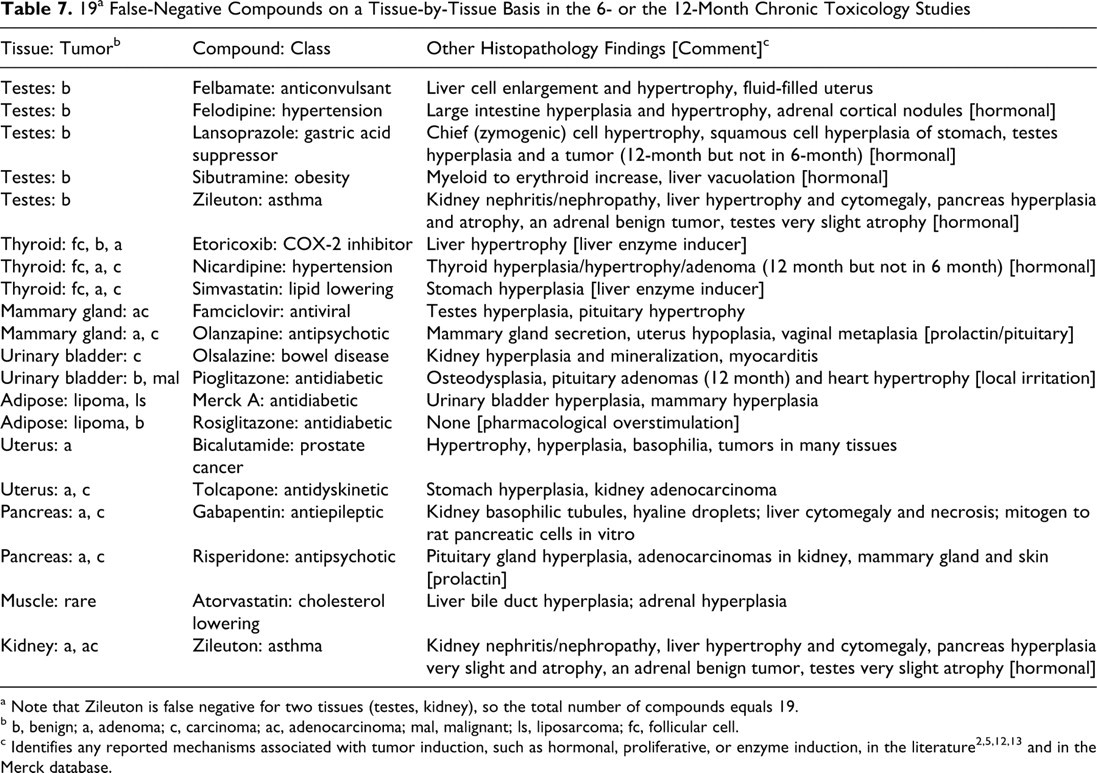
a Note that Zileuton is false negative for two tissues (testes, kidney), so the total number of compounds equals 19.
b b, benign; a, adenoma; c, carcinoma; ac, adenocarcinoma; mal, malignant; ls, liposarcoma; fc, follicular cell.
Compounds Not Evaluated Because of Nonmatching Doses
Table 3 lists the 12 compounds excluded from the analyses, including the dose levels used in the chronic toxicology and carcinogenicity studies, the tumor outcome, the preneoplastic changes seen, and the reason for classifying as nonmatching. The most frequent reason for exclusion was the use of higher dose levels in the carcinogenicity studies than in the chronic toxicology studies in which no preneoplastic changes were observed. The second-most-frequent reason was the reverse situation, in which preneoplastic changes were observed at higher doses than those evaluated in carcinogenicity studies.
If the data were considered without any exclusion criteria based on overlapping doses, the categorization calls for these 12 compounds, by the projected whole animal response shown in Table 3, are as follows for the 6-month study: 0 TPs, 4 TNs, 4 FPs, and 4 FNs. The negative predictivity rate was 50%, as compared with 88%, obtained for the compounds with matched dose levels. The test sensitivity for the 4 carcinogenicity-positive compounds among these 12 dose-mismatched compounds was 0%, as compared to 83%, seen for the 30 carcinogenicity positives among the 80 dose-matched compounds. The 4 FNs were as follows: sitagliptin for liver tumors, atenolol for multiple tumors (adrenal, mammary, pituitary, thyroid), itraconazole for soft tissue sarcomas, and timolol for adrenal tumors. Sitagliptin at matching doses from a 14-week dose range–finding study—as performed for the selection of dose levels for the carcinogenicity study—indicated that it is likely a TP if dosed equivalently for a chronic study, given that hepatocellular hypertrophy was observed at doses of 500 mg/kg and higher. This example further underscores the appropriateness of the initially defined exclusion criteria and the need to pay careful attention to matching doses for any such evaluations of results across study durations. Nevertheless, if the 12 excluded compounds are included into the analyses of the 80 dose-matched compounds of Table 2, the overall test sensitivity is reduced from 83% to 74%, and the negative predictivity is reduced from 88% to 81%. Of the 12 compounds excluded, 6 compounds had 6- and 12-month chronic toxicology data. The categorization calls for 4 compounds did not change; 1 changed from TN to FP (moexipril); and the other changed from FN to TP (itraconazole).
Prediction of Tumor Outcome at the Tissue Level Using the 6-Month Chronic Toxicology Studies
The ability of the 6-month chronic toxicology study to predict tissue-specific tumor outcome was evaluated for each tissue, and the results are shown in Table 8. The results are presented in terms of the sensitivity, specificity, and concordance for each tissue. For the liver, the sensitivity was 100%; the specificity was 93%; the negative predictivity was 100%; the positive predictivity was 43%; and the overall concordance was 93%. There were no FNs. Figure 1 shows a plot of the incidences of preneoplastic changes for carcinogens (TPs) and noncarcinogens (FPs). Hypertrophy was observed with carcinogens and noncarcinogens. The severity and incidence of hypertrophy was a poor positive predictor of liver-specific tumor outcome. Similarly, foci, tumor, and biliary hyperplasia were poor indicators, although the number of compounds with these findings was smaller than the number with hypertrophy. Because of the small number of compounds, the results of the 6- and 12-month toxicology studies are shown together (Fig. 1) rather than separately.
Ability of Individual Tissue Findings in the 6-Month Chronic Toxicology Study to Predict Tumor Outcome in the Same Tissues
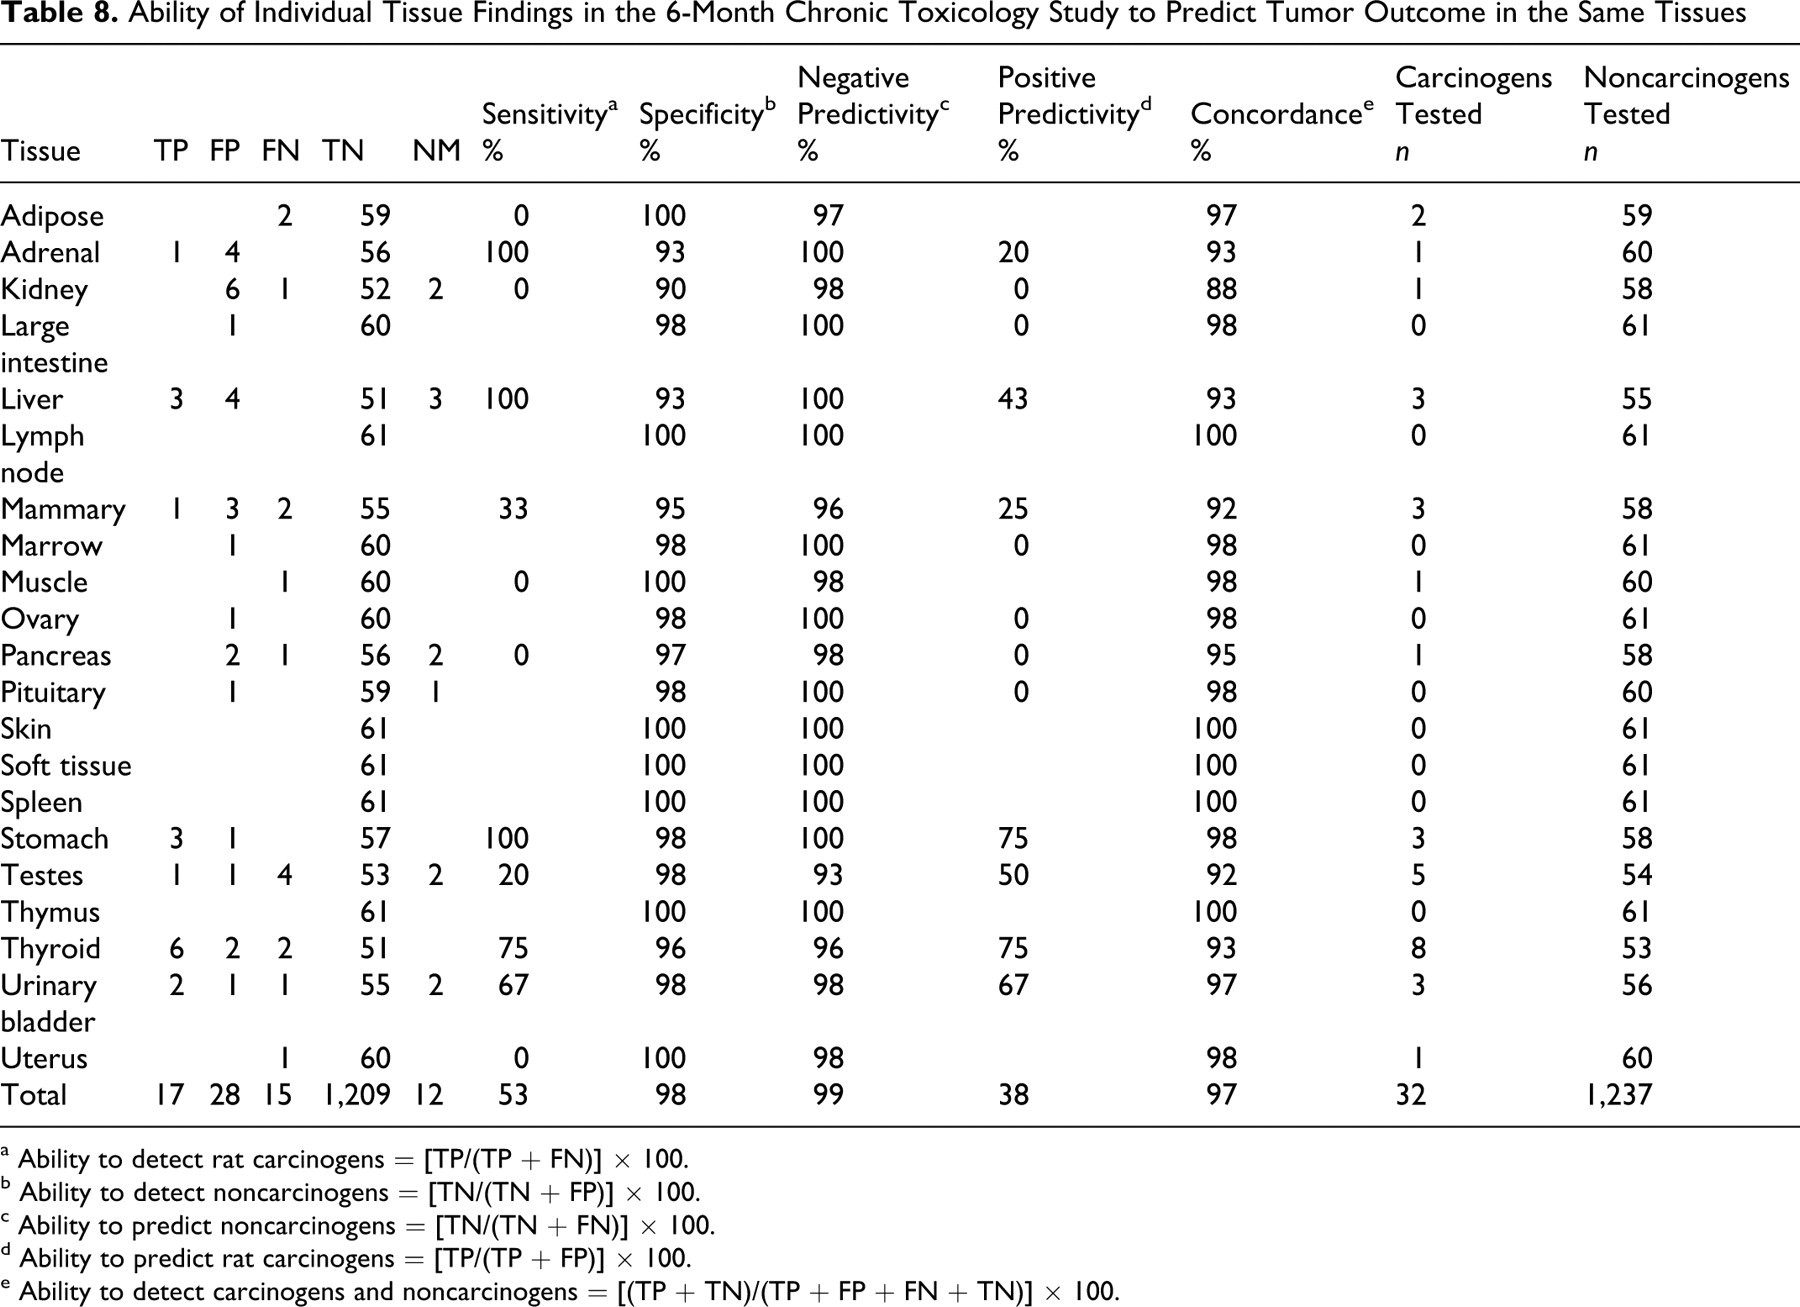
a Ability to detect rat carcinogens = [TP/(TP + FN)] × 100.
b Ability to detect noncarcinogens = [TN/(TN + FP)] × 100.
c Ability to predict noncarcinogens = [TN/(TN + FN)] × 100.
d Ability to predict rat carcinogens = [TP/(TP + FP)] × 100.
e Ability to detect carcinogens and noncarcinogens = [(TP + TN)/(TP + FP + FN + TN)] × 100.
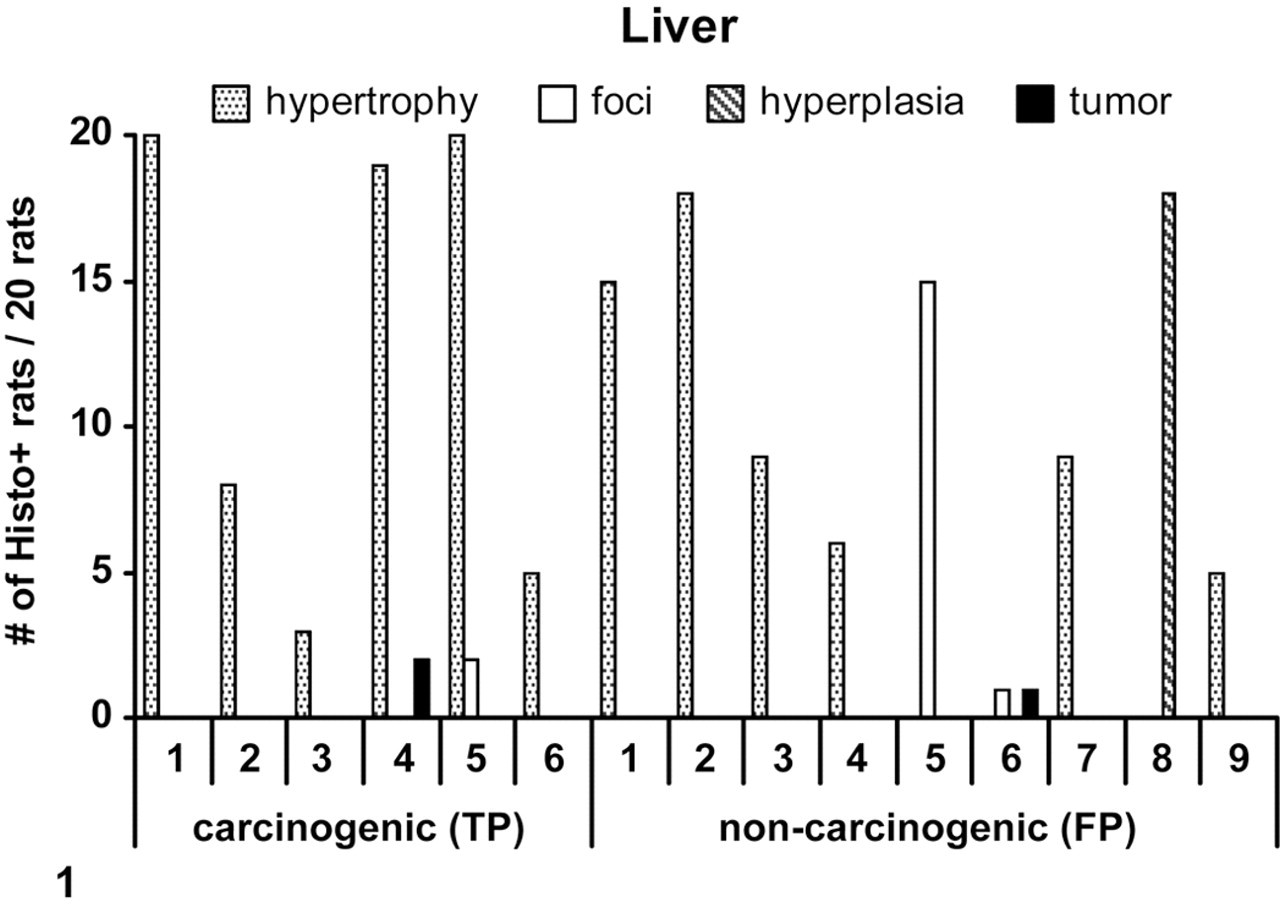
A plot of incidences of selected preneoplastic changes seen in the liver in rat chronic toxicology studies for carcinogens (true positive [TP]) and noncarcinogens (false positive [FP]). The numbers on the x-axis are the compounds. For TP: 1, anastrazole; 2, felbamate; 3, tiagabine; 4, pantoprazole; 5, aprepitant; 6, etoricoxib. For FP: 1, bicalutamide; 2, quetiapine; 3, Merck E; 4, topiramate; 5, alosetron; 6, rofecoxib; 7, rosuvastatin; 8, atorvastatin; 9, gabapentin. The results were from the 6- and 12-month toxicology studies, as follows. For TPs: 1, 6-month; 2, 12-month; 3, 6-month; 4, 6-month; 5, 6-month; 6, 12-month. For FPs: 1, 12-month; 2, 12-month; 3, 12-month; 4, 12-month; 5, 12-month; 6, 12-month; 7, 6-month; 8, 6-month; 9, 12-month. One FP (zileuton) is not represented, because of nonavailability of the incidences for hypertrophy.
For the testes, the sensitivity was only 20%, compared to 100% for the liver; the specificity was 98%; and the concordance was 92% (Table 8). Four compounds causing an increase in neoplasia in the rat testes were not identified by a predictive signal in the 6-month toxicity study (FNs). Figure 2 shows a plot of incidences of preneoplastic changes for rat carcinogens (TPs) and noncarcinogens (FPs) in 6- and 12-month studies. Hyperplasia was observed for rat carcinogens and noncarcinogens. The severity and incidence of hyperplasia was a poor positive predictor of tumor outcome in testes. Both carcinogens showed a low incidence of tumors in the 12-month study. Testicular Leydig cell tumors have been a predominant tumor type seen in rats, and it has been attributed to metabolic disturbances and higher activity of liver enzymes, which in turn lead to changes in steroid levels and hormonal feedback. 17 This proposed mechanism may help explain the high FN rate for testis.
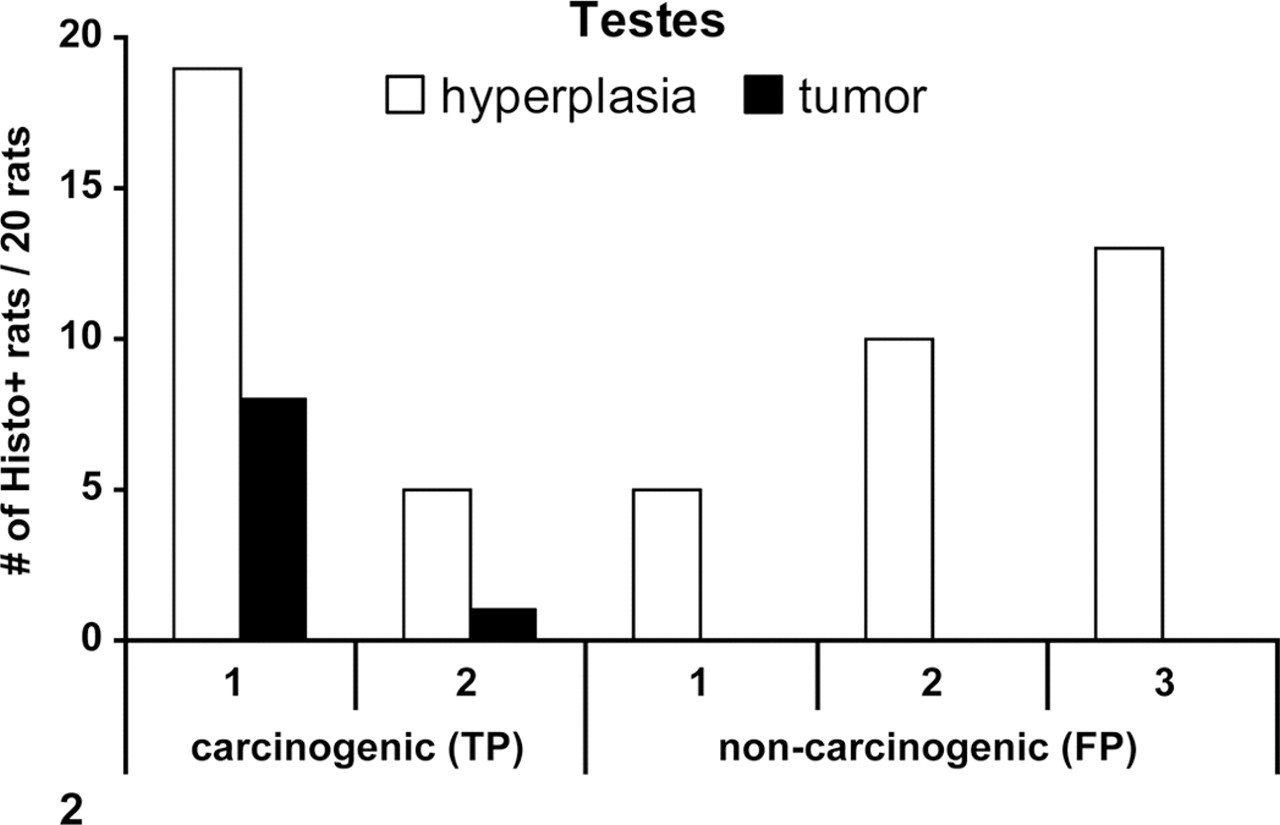
A plot of incidences of selected preneoplastic changes seen in the testes in rat chronic toxicology studies for carcinogens (true positive [TP]) and noncarcinogens (false positive [FP]). The numbers on the x-axis are the compounds. For TP: 1, bicalutamide; 2, lansoprazole. For FP: 1, finasteride; 2, pramipexole; 3, famciclovir. The results were from the 6- and 12-month toxicology studies as follows. For TPs: 1, 12-month; 2, 12-month. For FPs: 1, 12-month; 2, 12-month; 3, 6-month. One FP (mibefradil) is not represented, because of nonavailability of the incidences for hyperplasia.
Table 8 summarizes the ability of the 6-month chronic toxicology study to correctly predict the tumor outcome for all other tissues examined, including the liver and testes. Overall, the sensitivity varied from 0% to 100%, indicating that the preneoplastic changes predicted tumor outcome better for some tissues than others. The accuracy of prediction (percentage sensitivity) for each tissue decreased as such, in order: liver = stomach = adrenal > thyroid > urinary bladder > mammary gland > testes > adipose = kidney = muscle = pancreas = uterus. Several tissues were not targets for tumorigenicity. The sensitivity values were derived from a small number of rat carcinogens, ranging from 1 to 8, for each tissue presenting with tumors. The positive predictivity of the 6-month study was 0% to 75%, depending on the tissue. The ability to correctly predict the nontumor outcome (percentage specificity) was high for each tissue (90% to 100%) based on the data from a larger number of noncarcinogens classified as such on a tissue-specific-only basis, ranging from 53 to 61 chemicals for each tissue. There were 15 FNs out of 32 tissue × carcinogen-positive pairs to yield an overall test sensitivity of 53% considered at the individual tissue level.
Prediction of the Tumor Outcome at the Tissue Level Using the 12-Month Chronic Toxicology Studies
The ability of the 12-month chronic toxicology study to correctly predict tissue-specific tumor outcome was evaluated for various tissues and is summarized in Table 9. For the liver, the sensitivity was 100%, with no FNs; the specificity was 82%; the concordance was 83%; and the positive predictivity was 31%. For the testes, the sensitivity was 50%; the specificity was 94%; and the concordance was 91%. As in the 6-month chronic toxicology studies, the sensitivity was less for the testes than for the liver. Of the 4 compounds that cause an increase in neoplasia in the rat testes, 2 were not identified by a predictive signal in the 12-month toxicity study (FNs).
Ability of Individual Tissue Findings in the 12-Month Chronic Toxicology Study to Predict Tumor Outcome in the Same Tissues
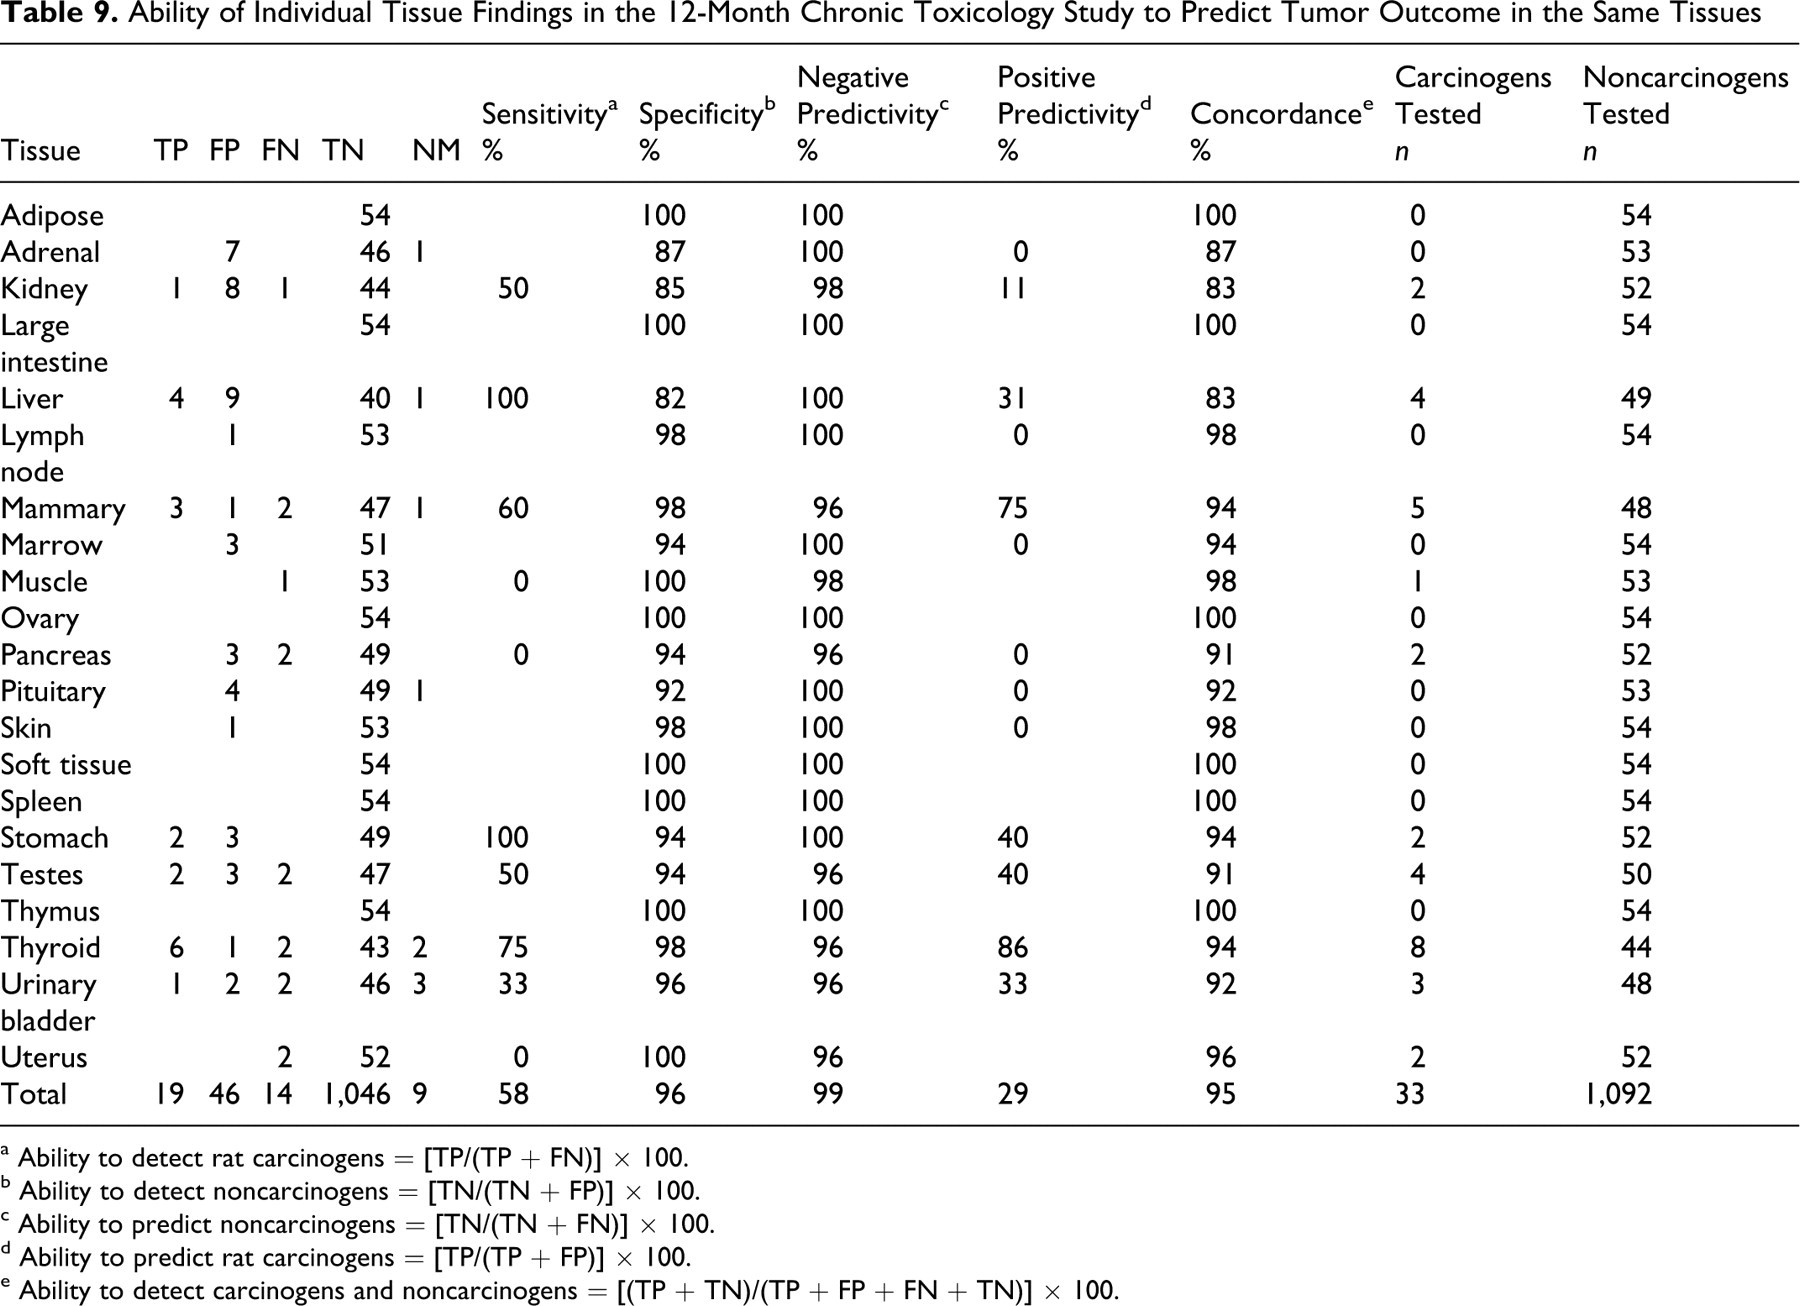
a Ability to detect rat carcinogens = [TP/(TP + FN)] × 100.
b Ability to detect noncarcinogens = [TN/(TN + FP)] × 100.
c Ability to predict noncarcinogens = [TN/(TN + FN)] × 100.
d Ability to predict rat carcinogens = [TP/(TP + FP)] × 100.
e Ability to detect carcinogens and noncarcinogens = [(TP + TN)/(TP + FP + FN + TN)] × 100.
Table 9 summarizes the ability of the 12-month chronic toxicology study to correctly predict the tumor outcome for all other tissues examined, including liver and testes. Overall, the sensitivity varied from 0 to 100%, suggesting again that the prediction accuracy for tumor outcome was better in some tissues than others. The accuracy of prediction for each tissue decreased as such, in the following order: liver = stomach > thyroid > mammary > kidney = testes > urinary bladder > muscle = pancreas = uterus. The sensitivity values were derived from a small number of carcinogens, ranging from 1 to 8, depending on the tissue evaluated. The ability to correctly predict the nontumor outcome (percentage specificity) was high for each tissue (82% to 100%) owing to the large number of noncarcinogens classified at the tissue level, ranging from 44 to 54 chemicals. There were 14 FNs (Table 4) out of 33 tissue × carcinogen-positive pairs, yielding a test sensitivity of 58% when based on performance at the tissue level.
19 FNs and the Hypothesis
Overall, 19 tumor-positive compounds were not successfully identified (FNs) at the tissue level by the chronic toxicology studies. Table 7 lists the 19 FNs: The testis was the tissue that was most often unidentified, with 5 compounds as FNs. The thyroid had 3 FNs. The mammary gland, urinary bladder, adipose tissue, uterus, and pancreas showed 2 FNs each, whereas kidney and muscle showed 1 FN each. For each of these compounds, any histopathological changes at sites other than the tumor site are noted (Table 7). As discussed above, 14 of the 19 tissue-level FNs presented with preneoplastic changes at alternate distal sites, supporting our conclusion that preneoplastic changes at any site in a study are better predictors of the whole animal tumor response.
Discussion
The test sensitivity of the 6- and 12-month chronic toxicology studies for predicting tumor outcome based on the chosen preneoplastic changes was poor at the tissue level, indicating an agreement with others 1,10,12 that this approach is not useful. The proposed whole animal negative predictivity approach to redefining and limiting the need for 2-year rat carcinogenicity testing is a new concept, and it represents a pragmatic approach based on the accepted protocols of conducting chronic rat toxicology and carcinogenicity studies (ie, all tissues are examined). If we accept the proposed hypothesis that value is gained from only those 2-year carcinogenicity studies conducted for compounds that show any of the selected preneoplastic changes in chronic studies and thus have higher potential to yield tumor responses, then we eliminate about 50% of the rat carcinogenicity studies.
The 5 rat carcinogens that were “missed” because of the lack of preneoplastic lesions in the 6-month chronic toxicology studies, termed FNs, are approved drugs marketed for non-life-threatening diseases, with a history of human safety. The relevance to human health of their tumorigenic activity in animals is questionable on the basis of possible mechanisms, as discussed below. The tumors for these 5 compounds were seen in a single species and at a single site—and for 3 of 5 compounds, in a single sex. These compounds cause an increase in tumors based on direct or indirect sustained proliferative effects, as discussed in the drug labels. 13 The proliferative effects seen with these FNs did not result in preneoplastic changes (such as hyperplasia) at 6 months, likely because such effects are multistep and have both a time- and dose-dependent threshold of microscopic visibility in 1 tissue, 1 species, and often only 1 sex at a time point beyond 6 months of sustained dosing. Among the 5 FNs, nicardipine-induced tumors have been attributed to chronic stimulation of the thyroid by thyroid-stimulating hormone, following activated liver metabolism, a consequent reduction of plasma thyroxine levels, and activated secretion of thyroid-stimulating hormone by the pituitary. Rats on an iodine-deficient diet showed thyroid hyperplasia after nicardapine treatment for 1 month, 13 but the thyroid hyperplasia was seen in rats on a normal diet in the 12-month chronic toxicology study and not in the 6-month study (Table 2). Olanzapine-induced mammary tumors are proposed to be mediated by pharmacological blockade of dopamine inhibition of prolactin secretion by the pituitary, resulting in increased prolactin serum levels, a mechanism proposed for mammary tumors seen with other antipsychotic drugs. 2 Pioglitazone-induced bladder tumors are believed to result from local irritation by urinary crystals, resulting in sustained proliferation of the bladder mucosa, as demonstrated immunohistochemically with nuclear bromodeoxyuridine incorporation studies. 5 Rosiglitazone-induced benign adipose tissue tumors have been attributed to persistent high-dose pharmacological stimulation of adipose tissue. 14 A further mechanistic understanding of rosiglitazone-induced tumors suggests a positive correlation with PPARs (peroxisome proliferator-activated receptors) expression levels in bladder epithelium, 6 and the relevance of these findings to humans has yet to be understood. Compounds in the glitazone class have been mostly dropped from development because of additional data, such as mouse carcinogenicity findings. Sibutramine produced benign tumors of the testicular interstitial cells, which are common in rats and considered to be hormonally mediated through an indirect mechanism. 14
The impact of appropriately excluding 12 compounds because of nonmatching dose levels between the carcinogenicity studies and chronic toxicology studies is seen in the data for 4 compounds that would otherwise be inappropriately classified as FNs, if included. Of these, itraconazole-induced soft tissue sarcomas were attributed to hypercholesterolemia, which was seen in only rats and not dogs and humans, 15 but the doses achieved in the chronic study were unclear. Sitagliptin produced liver adenomas and carcinomas in rats at 500 mg/kg, which is equivalent to 60 times the maximum recommended human dose based on area under the curve, but not at 150 mg/kg (20 times the maximum recommended human dose). In a 14-week range-finding study to support the dose level selection for a carcinogenicity study, sitagliptin caused liver weight increase and hepatocellular hypertrophy at doses of 500 mg/kg and higher. Sitagliptin is thus a likely TP, had the chronic study been conducted at matching doses. Similarly, atenolol induced tumors at 500 mg/kg in 1 study, about 250 times the human antihypertensive dose, but no tumors were observed up to 300 mg/kg in another study, and no evidence of preneoplasia potential was noted at the same dose in chronic studies. A 13-week study for atenolol was conducted at doses up to 200 mg/kg and was unremarkable for preneoplastic findings. Tumors observed in the 2-year carcinogenicity study with atenolol were as follows: benign adrenal medullary tumors in males and females, mammary fibroadenomas in females, and anterior pituitary adenomas and thyroid parafollicular cell carcinomas in males. The affected tissues indicated that the mechanism is likely to be hormonal, although no such information is provided in the label. 13,14 If the highest dose in the carcinogenicity study had been reasonably limited to 300 mg/kg, providing exposures in excess of 25-fold human exposures, atenolol would be considered a TN. Adrenal pheochromocytomas were seen with timolol in male rats at 300 mg/kg and not 100 mg/kg. The dose of 300 mg/kg corresponded to about 42,000 times the human systemic exposure, following the maximum recommended human ophthalmic dose; however, for an ophthalmic drug, the carcinogenicity study is not needed under current guidelines. Although the product label information in the PDR indicates an increase in pheochromocytomas for timolol, the pathology report concludes that these changes are not statistically different from control. None were malignant. The 13-week chronic toxicology study for timolol used doses up to 50 mg/kg with no indication of preneoplasia.
Under current regulatory guidelines, 8 a dose that provides a 25-fold margin over the human exposure is an appropriate top dose; so, it is unlikely that sitagliptin, atenolol, or timolol would be positive in such a 2-year study design. Furthermore, these examples underscore that when a high dose showing toxicity is deliberately included in a 2-year study, the likely outcome is toxicity-related tumors, emphasizing the critical importance of selecting doses that appropriately assess carcinogenicity. This point has been previously noted: that most carcinogens induce tumors only at 1/3 or greater the maximum tolerated dose. 3 Thus, the carcinogenicity of 3 FNs excluded for nonmatching doses was seen at only these high doses, with a substantial safety margin relative to human therapeutic doses. Tumors were not seen at lower doses that are appropriate under current testing standards and that did not show preneoplastic findings in chronic studies; therefore, these compounds would be considered TNs rather than FNs. For all 4 compounds, the increase in tumors is considered to be through rat-specific mechanisms, presenting little risk to humans.
The whole animal approach assumes that preneoplastic changes at any site will be indicative of an increase in tumor incidence in that organ or in an organ at a distant site. There are examples of histopathological effects at 1 site leading to an increase in tumors or biological changes at a different site. The correlation among liver enzyme induction, altered thyroid hormone status, and increased thyroid tumors, for example, is a well-known phenomenon, as is the relationship between mammary gland tumors and increased prolactin production by the pituitary and between testicular Leydig cell tumors and excessive stimulation by luteinizing hormone owing to a disorder of the hypothalamic–pituitary axis. Liver enzyme induction leading to thyroid tumors involves the following sequence of events: increased glucuronidation, enhanced biliary clearance of thyroxine (T4), stimulation of thyroid organ by thyroid-stimulating hormone to maintain T4 levels in the serum, and enhanced proliferation of thyroid, leading to tumors. It took many years of research to understand these relationships. Table 7 shows, for example, evidence for biological links between mammary gland and pituitary (olanzapine, famciclovir), between liver and thyroid (simvastatin), and between liver and testes (zileuton, felbamate). It has recently been reported that the X-ray irradiation of the scalp of animal leads to changes in the DNA methylation status in distant sites, such as the unexposed area of the skin of the animal. 9,11 The secretion of cytokines has been suggested as a possible mechanism. Achieving understanding of the biological links between distant sites and organs relative to where the histopathology is seen for all the TPs in this study is a challenging undertaking, requiring many years of research.
The practical utility of the whole animal approach is significant, with low risk relative to benefit for humans based on the analysis of results for these 80 compounds. Elimination of about 50% of the 2-year rat carcinogenicity studies will help reduce animal usage and will redirect the resources of the pharmaceutical companies conducting these studies and the regulatory agencies reviewing them into more fruitful endeavors.
The negative predictivity of the whole animal approach is currently being evaluated by increasing the number of chemicals in the database through the participation of many pharmaceutical companies in a study sponsored by the Pharmaceutical Research and Manufacturing Association. The preliminary results of this collaboration have recently been made available to the FDA in an effort to validate the premises upon which the outcome of this analysis will be based (F. Sistare, personal communication). Other regulatory agencies and pharmaceutical companies in Europe and Japan are considering looking into their databases for an independent validation of the whole animal approach. Such broad participation by different organizations will offer the benefit of evaluating the approach for a larger number of pharmaceuticals with a wider range of pharmacological and therapeutic targets.
Additional endpoints are being considered to further reduce FNs, without significantly reducing TNs. They include the use of genotoxicity assay results and evidence for hormonal targets and perturbations. For example, if all evidence of the mechanisms and targets discussed above is applied as an additional discriminator, then the 5 FNs seen at the whole animal level are eliminated because of known hormonal mechanisms and targets. Furthermore, any new reduced rodent-testing paradigm proposal for assessing compound tumorigenicity potential will be expected to maintain a transgenic mouse carcinogenicity test. 4, 7,16
Conclusions
The absence of histopathological evidence of preneoplastic findings in rat chronic toxicology studies using a whole animal approach is reliable for predicting negative tumor outcome in the 2-year rat carcinogenicity study. As such, this may serve as a practical approach to reducing the number of rat carcinogenicity studies—and, thus, animal usage and expenditure of resources—by accepting those drugs with no preneoplastic signals in any tissue in the chronic studies as rat noncarcinogens. The 5 compounds that caused an increase in neoplasia but were not identified by the whole animal approach in the chronic studies are all approved drugs for the treatment of non-life-threatening diseases and are considered safe in humans. The use of additional endpoints such as knowledge of hormonal perturbation and the results of genetic toxicity assays are being explored to further reduce FNs in a wider collection of pharmaceutical test agent data.
Footnotes
Acknowledgements
We thank Dr Sheila Galloway for the support of this work and Dr Chihae Yang of Leadscope Inc for providing clarification of the Leadscope database and for use of the search tool. We would like to thank Dr Tom Davies, formerly of Pfizer, for providing freedom-of-information Summary Basis of Approval documents on several compounds.
The authors declared that they had no conflicts of interest with respect to their authorship or the publication of this article.
The authors declared that they received no financial support for their research and/or authorship of this article.