
Abstract
Objective
This study aimed to systematically investigate the independent predictive value of the platelet-to-neutrophil ratio and platelet-to-lymphocyte ratio for 28-day all-cause mortality in patients with sepsis and to further evaluate their incremental discriminatory capacity when added to conventional prognostic scoring models.
Methods
This single-center retrospective cohort study involved 287 adult patients diagnosed with sepsis according to the Sepsis-3 criteria. Patients were stratified into high- and low-level groups based on the median values of platelet-to-neutrophil ratio and platelet-to-lymphocyte ratio, and baseline characteristics, and clinical outcomes were compared between groups. Univariate and multivariate Cox proportional hazards regression models were used to assess the independent associations of platelet-to-neutrophil ratio and platelet-to-lymphocyte ratio with 28-day mortality risk. To evaluate predictive performance, multiple models were constructed and compared, including Sequential Organ Failure Assessment score alone, Acute Physiology and Chronic Health Evaluation II score alone, each combined separately with platelet-to-neutrophil ratio or platelet-to-lymphocyte ratio, and a composite model integrating Acute Physiology and Chronic Health Evaluation II, day-3 lactate level, platelet-to-neutrophil ratio, and platelet-to-lymphocyte ratio. Model performance was rigorously assessed using receiver operating characteristic curves, calibration plots, decision curve analysis, integrated discrimination improvement, and net reclassification improvement, enabling a comprehensive evaluation of discrimination, calibration, clinical utility, and the incremental value of novel biomarkers.
Results
Multivariate Cox regression analysis revealed that lower platelet-to-neutrophil ratio (hazard ratio = 0.97, 95% confidence interval: 0.95–0.99, p = 0.012) and higher platelet-to-lymphocyte ratio (hazard ratio = 1.01, 95% confidence interval: 1.01–1.01, p = 0.043) were independently associated with increased 28-day all-cause mortality. Kaplan–Meier survival analysis confirmed significantly higher cumulative mortality in the low-platelet-to-neutrophil ratio and high-platelet-to-lymphocyte ratio groups (log-rank p < 0.05). The composite model incorporating Acute Physiology and Chronic Health Evaluation II, day-3 lactate level, platelet-to-neutrophil ratio, and platelet-to-lymphocyte ratio demonstrated superior predictive accuracy, with an area under the receiver operating characteristic curve (area under the curve) of 0.824 (95% confidence interval: 0.778–0.871), significantly outperforming both the Acute Physiology and Chronic Health Evaluation II only model (area under the curve: 0.746, p < 0.001) and the Sequential Organ Failure Assessment only model (area under the curve: 0.667, p < 0.001). Decision curve analysis showed that this model provided greater clinical net benefit across a broad range of threshold probabilities. Furthermore, both integrated discrimination improvement and net reclassification improvement analyses confirmed statistically significant improvements in discrimination and reclassification accuracy after the inclusion of platelet-to-neutrophil ratio and platelet-to-lymphocyte ratio (both p < 0.001).
Conclusion
Platelet-to-neutrophil ratio and platelet-to-lymphocyte ratio are independent predictors of 28-day mortality in patients with sepsis. Incorporating these readily available and cost-effective inflammatory markers into traditional prognostic systems—such as Acute Physiology and Chronic Health Evaluation II—and combining them with dynamic lactate monitoring substantially enhances the discrimination, calibration, and clinical utility of risk prediction models. These findings provide robust evidence supporting the use of platelet-to-neutrophil ratio and platelet-to-lymphocyte ratio for early risk stratification and individualized prognostic assessment in clinical practice.
Keywords
Introduction
Sepsis is a life-threatening organ dysfunction caused by a dysregulated host response to infection and is pathophysiologically characterized by a systemic inflammatory cascade—commonly referred to as a cytokine storm—that disrupts immune homeostasis. This uncontrolled immune activation can rapidly lead to acute organ failure, with highly variable clinical presentations and substantial mortality. Despite advances in critical care and growing insights into sepsis biology, the precise molecular and cellular mechanisms underlying disease progression remain incompletely understood. 1 According to data from the 2017 Global Burden of Disease Study, which analyzed trends across 195 countries and territories between 1990 and 2017, there were approximately 48.9 million incident cases of sepsis globally each year, resulting in 11 million deaths, corresponding to an overall case fatality rate of nearly 19.7%. 2 Although improvements in early recognition and standardized management have reduced mortality in some high-income regions, sepsis continues to be a leading cause of death worldwide, particularly in low- and middle-income countries where healthcare resources are limited and the associated health and economic burdens are disproportionately high. 3 The dual burden of high incidence and poor outcomes places immense strain on healthcare systems. For example, a Dutch study integrating published evidence with national registry data estimated that sepsis incurs an annual direct medical cost of 3.4 billion euros, with indirect costs ranging from 416 million to 3.1 billion euros. Nevertheless, timely diagnosis and intervention remain major clinical challenges. Several clinical and laboratory variables have been consistently identified as independent predictors of mortality in patients with sepsis. Widely adopted tools such as Quick Sequential Organ Failure Assessment (qSOFA), Sequential Organ Failure Assessment (SOFA), and Acute Physiology and Chronic Health Evaluation II (APACHE II) scores assist in risk stratification but suffer from suboptimal sensitivity during the early phases of sepsis and limited discriminative performance, potentially delaying critical treatment decisions. 4 Advanced age is a well-established nonmodifiable risk factor, with meta-analyses showing that each 1-year increase in age raises mortality risk by approximately 1%. Serum lactate is a key marker of tissue hypoperfusion incorporated into the Sepsis-3 definition and the qSOFA score, and it independently predicts mortality, with pooled analyses reporting an hazard ratio (HR) of 1.07 per unit increase. 5 However, lactate may be elevated because of nonseptic causes such as trauma or liver failure, limiting its specificity. Procalcitonin (PCT) has demonstrated prognostic value as a marker of bacterial infection, but its slow kinetics and reduced specificity in certain populations (e.g. postoperative or pregnant patients) constrain its utility. 6 Other individual markers—such as creatinine and bilirubin, reflecting renal and hepatic dysfunction, and white blood cell count and platelet count, reflecting immune and coagulation status—each capture only one dimension of sepsis pathophysiology and cannot fully describe its complex, multiorgan nature. Consequently, there remains an unmet need for readily available, cost-effective biomarkers that can be serially monitored and integrated into existing prognostic frameworks. Therefore, achieving accurate risk prediction and prognostic assessment prior to overt organ dysfunction—and enabling early, individualized interventions—holds significant potential for improving patient survival. In this context, the identification and validation of biomarkers with high sensitivity and specificity represent a crucial step toward refining diagnostic and therapeutic strategies.
Platelets serve as pivotal mediators at the intersection of inflammation and coagulation, contributing actively to the pathogenesis of sepsis. They can be activated through direct pathogen interaction, undergo excessive activation and consumption because of inflammatory mediators, and promote tissue injury by stimulating monocytes/macrophages to release neutrophil extracellular traps (NETs), thereby exacerbating microvascular dysfunction and end-organ damage. 7 Concurrently, an imbalance between neutrophils and lymphocytes reflects a key feature of immunological dysregulation in sepsis. This dyshomeostasis not only promotes a state of compensatory immunosuppression but also impairs the immune system’s capacity for self-regulation, creating a self-perpetuating cycle that drives clinical deterioration.8,9 Notably, research by Sreeramkumar et al. 10 highlighted the critical role of platelet–neutrophil interactions in driving thromboinflammatory processes, prompting increased interest in hematological indices derived from routine blood counts. Given that platelets, neutrophils, and lymphocytes are routinely measured, easily accessible, and cost-effective, the derived ratios—platelet-to-neutrophil ratio (PNR) and platelet-to-lymphocyte ratio (PLR)—have emerged as promising and practical inflammatory biomarkers. Among these, PLR has been extensively investigated for its prognostic value in sepsis. Although elevated PLR is generally associated with worse outcomes, the nature of this association remains inconsistent across studies. For instance, Shen et al. 11 reported that high-PLR was significantly associated with increased mortality, whereas low-PLR showed no predictive utility; in contrast, other findings suggest a U-shaped relationship between baseline PLR and in-hospital mortality, with both extremes conferring higher risk, and early declines in PLR independently predicting adverse outcomes. 12 In comparison, evidence regarding PNR is more limited. A study by Wu et al. 13 found that PNR demonstrated poor predictive performance. Importantly, previous studies indicate that combining conventional clinical scores—such as SIRS or qSOFA—with the neutrophil-to-lymphocyte ratio significantly enhances prognostic accuracy. 14 Building on this principle, the present study aimed to systematically assess the independent association of PNR and PLR with 28-day all-cause mortality in patients with sepsis and to evaluate their incremental predictive value when integrated into established prognostic models such as APACHE II and SOFA. By constructing and comparing multiple composite models, we comprehensively examined improvements in discrimination, calibration, and clinical net benefit, with the goal of providing robust empirical support for the use of PNR and PLR as novel prognostic indicators and advancing the development of more precise, individualized risk stratification frameworks.
Materials and methods
Participants
This retrospective cohort study enrolled adult patients diagnosed with sepsis upon admission to the intensive care unit (ICU) of Zhenjiang First People's Hospital between September 2022 and December 2024. A total of 491 consecutive patients were initially identified from electronic medical records. After applying predefined eligibility criteria, 204 patients were excluded because of missing key data or fulfillment of exclusion criteria. The final analytical cohort comprised 287 patients. The study protocol was reviewed and approved by the Clinical Research Ethics Committee of Zhenjiang First People's Hospital (Zhenjiang, China) (Approval No [2025] KYW001-88, dated 9 December 2025), and all procedures were conducted in strict accordance with the ethical principles outlined in the Declaration of Helsinki (as revised in 2024). Given the retrospective nature of the study and its reliance on anonymized clinical data, the requirement for individual informed consent was waived by the ethics committee (the informed consent requirement was exempted, as documented in the approval record). All patient data were de-identified prior to analysis to ensure that no individual could be identified in any way. The reporting of this observational retrospective cohort study followed the Strengthening the Reporting of Observational Studies in Epidemiology (STROBE) guidelines. 15
Inclusion criteria
The inclusion criteria were as follows: (a) confirmation of sepsis based on the Third International Consensus Definitions for Sepsis and Septic Shock (Sepsis-3) (1); (b) age ≥18 years; (c) availability of complete 28-day follow-up data to enable accurate assessment of the primary outcome—28-day all-cause mortality; (d) ICU or hospital length of stay ≥3 days; (e) availability of a complete blood count test performed within 24 h of admission, including documented platelet, neutrophil, and lymphocyte counts, allowing calculation of both the PNR and PLR.
Exclusion criteria
The exclusion criteria were as follows: (a) pregnancy or lactation; (b) pre-existing hematologic disorders known to affect platelet or leukocyte counts, such as leukemia, aplastic anemia, myelodysplastic syndrome, or idiopathic thrombocytopenic purpura; (c) active malignancy with receipt of chemotherapy, radiotherapy, or immunotherapy within the preceding 6 months; (d) history of solid organ or hematopoietic stem cell transplantation, or chronic use of high-dose immunosuppressive agents or glucocorticoids (defined as ≥20 mg/day prednisone or equivalent for more than 2 consecutive weeks); (e) presence of end-stage liver disease (e.g. Child–Pugh class C), end-stage renal disease requiring maintenance dialysis, or established autoimmune diseases, as these conditions may independently alter immune function and inflammatory biomarkers; (f) withdrawal of active life-sustaining treatment or documentation of a “Do Not Resuscitate” order within 24 h of ICU admission, indicating a decision against aggressive intervention.
Data collection
Clinical data for all enrolled patients were retrospectively extracted from the hospital’s electronic medical record system. The collected variables were categorized into five domains: (a) Demographic and baseline clinical characteristics: Age, sex, and pre-existing comorbidities—including hypertension, diabetes, and heart failure—were documented. (b) Disease severity and physiological status scores: The worst values recorded within 24 h of ICU admission were used to calculate the Acute Physiology and Chronic Health Evaluation II (APACHE II), SOFA, and Glasgow Coma Scale (GCS) scores. (c) Laboratory test results: Initial laboratory measurements obtained within 24 h of admission were collected, including complete blood count parameters (white blood cell count (WBC), neutrophil count (Neu), lymphocyte count (LYC), monocyte count (Mono), and platelet count (PLT)), from which the PNR and PLR were calculated; inflammatory markers (procalcitonin (PCT), C-reactive protein (CRP)); coagulation profile (prothrombin time (PT), activated partial thromboplastin time (APTT)); liver and renal function tests (alanine aminotransferase (ALT), aspartate aminotransferase (AST), albumin (ALB), creatinine (Cr), and blood urea nitrogen (BUN)); electrolytes (sodium (Na), chloride (Cl), potassium (K), and calcium (Ca)); and the arterial partial pressure of oxygen to fraction of inspired oxygen ratio (PaO2/FiO2 ratio). Blood lactate (Lac) levels at admission were also recorded. (d) Dynamic monitoring parameters: To evaluate disease progression, key biomarkers were collected on postadmission day 3, including PCT, WBC, CRP, Lac, and PaO2/FiO2 ratio, designated as PCT D3, WBC D3, day-3 lactate level (Lac D3), and oxygenation index D3, respectively. (e) Treatment-related complications and outcomes: The occurrence of acute kidney injury (AKI), septic shock, and intestinal dysbiosis during ICU stay was recorded. The primary outcome was 28-day all-cause mortality, with final survival status confirmed at follow-up. Secondary outcomes included ICU length of stay, total hospital length of stay, and overall survival time.
Statistical analysis
Continuous variables were assessed for normality using the Shapiro–Wilk test. Normally distributed continuous variables were presented as mean ± standard deviation and compared between groups using the unpaired Student’s t-test; nonnormally distributed variables were reported as median (interquartile range (IQR)) and analyzed using the Mann–Whitney U test or Kruskal–Wallis test, as appropriate. Categorical variables were expressed as frequency (percentage) and compared using the χ2 test or Fisher’s exact test, depending on expected cell counts. Patients were stratified into high- and low-risk groups based on the median values of the PLR and PNR, and baseline characteristics were compared across these subgroups. Univariate and multivariate Cox proportional hazards regression models were performed to identify independent prognostic factors associated with 28-day all-cause mortality. Multicollinearity was evaluated using variance inflation factors (VIFs), with a VIF >10 indicating significant collinearity. Based on the multivariate model, a composite predictive model incorporating APACHE II score, Lac D3, PLR, and PNR was developed. This model was then compared with several reference models: SOFA score alone, SOFA plus PLR/PNR, APACHE II alone, and APACHE II plus PLR/PNR. Model discrimination was assessed using receiver operating characteristic (ROC) curve analysis and quantified by the area under the curve (AUC); pairwise comparisons of AUCs were conducted using DeLong’s test. Calibration was evaluated using bootstrapping (1,000 resamples) to generate calibration curves and calculate the Brier score. Clinical usefulness was further assessed through decision curve analysis (DCA) to evaluate net benefit across a range of threshold probabilities. Finally, the incremental predictive value of adding PLR and PNR to established severity scores (SOFA and APACHE II) was quantified using the integrated discrimination improvement (IDI) and net reclassification improvement (NRI) indices. All statistical tests were two-sided, and statistical significance was defined as p < 0.05. Analyses were performed using R software (version 4.3.1) and SPSS (version 27.0).
Given the retrospective design, no a priori sample size calculation was performed; however, the final cohort of 287 patients yielded stable estimates with narrow confidence intervals, providing adequate statistical power for the primary analyses.
Results
Baseline characteristics of patients according to PNR status
This study retrospectively included 491 adult patients diagnosed with sepsis who met the predefined inclusion criteria and were admitted to the Department of Critical Care Medicine at the **** Hospital between September 2022 and December 2024. After applying prespecified exclusion criteria, 287 patients were ultimately enrolled in the analysis cohort; the detailed patient selection process is illustrated in Figure 1. Patients were stratified into high- and low-PNR groups based on the median PNR, resulting in a high-PNR group (n = 144) and a low-PNR group (n = 143). Baseline characteristics for both groups are summarized in Table 1. No significant differences were observed between the two groups regarding age, sex distribution, or prevalence of common comorbidities, including hypertension, diabetes, and heart failure (all p > 0.05), indicating adequate baseline comparability. In terms of disease severity, the high-PNR group exhibited significantly lower SOFA scores compared with the low-PNR group (7.00 (4.50, 11.00) vs. 9.00 (6.00, 13.00), p < 0.01), suggesting less severe organ dysfunction. Laboratory analyses revealed that the high-PNR group had markedly reduced systemic inflammation, as evidenced by significantly lower white blood cell counts (9.25 (6.66, 12.96) vs. 14.20 (9.55, 19.92), p < 0.01) and procalcitonin (PCT) levels (1.25 (0.30, 4.73) vs. 3.23 (0.89, 12.70), p < 0.01). Furthermore, the high-PNR group demonstrated superior circulatory and coagulation profiles, reflected by lower lactate levels, APTT, and PT. With respect to organ function, renal indicators (creatinine and BUN) and hepatic enzymes (ALT and AST) were significantly better in the high-PNR group (all p < 0.05). Notably, no statistically significant differences were found between the groups in GCS score, Acute Physiology and Chronic Health Evaluation II (APACHE II) score, serum electrolytes (Na+, K+, Cl−, and Ca2+), CRP, albumin, or oxygenation index (all p > 0.05).
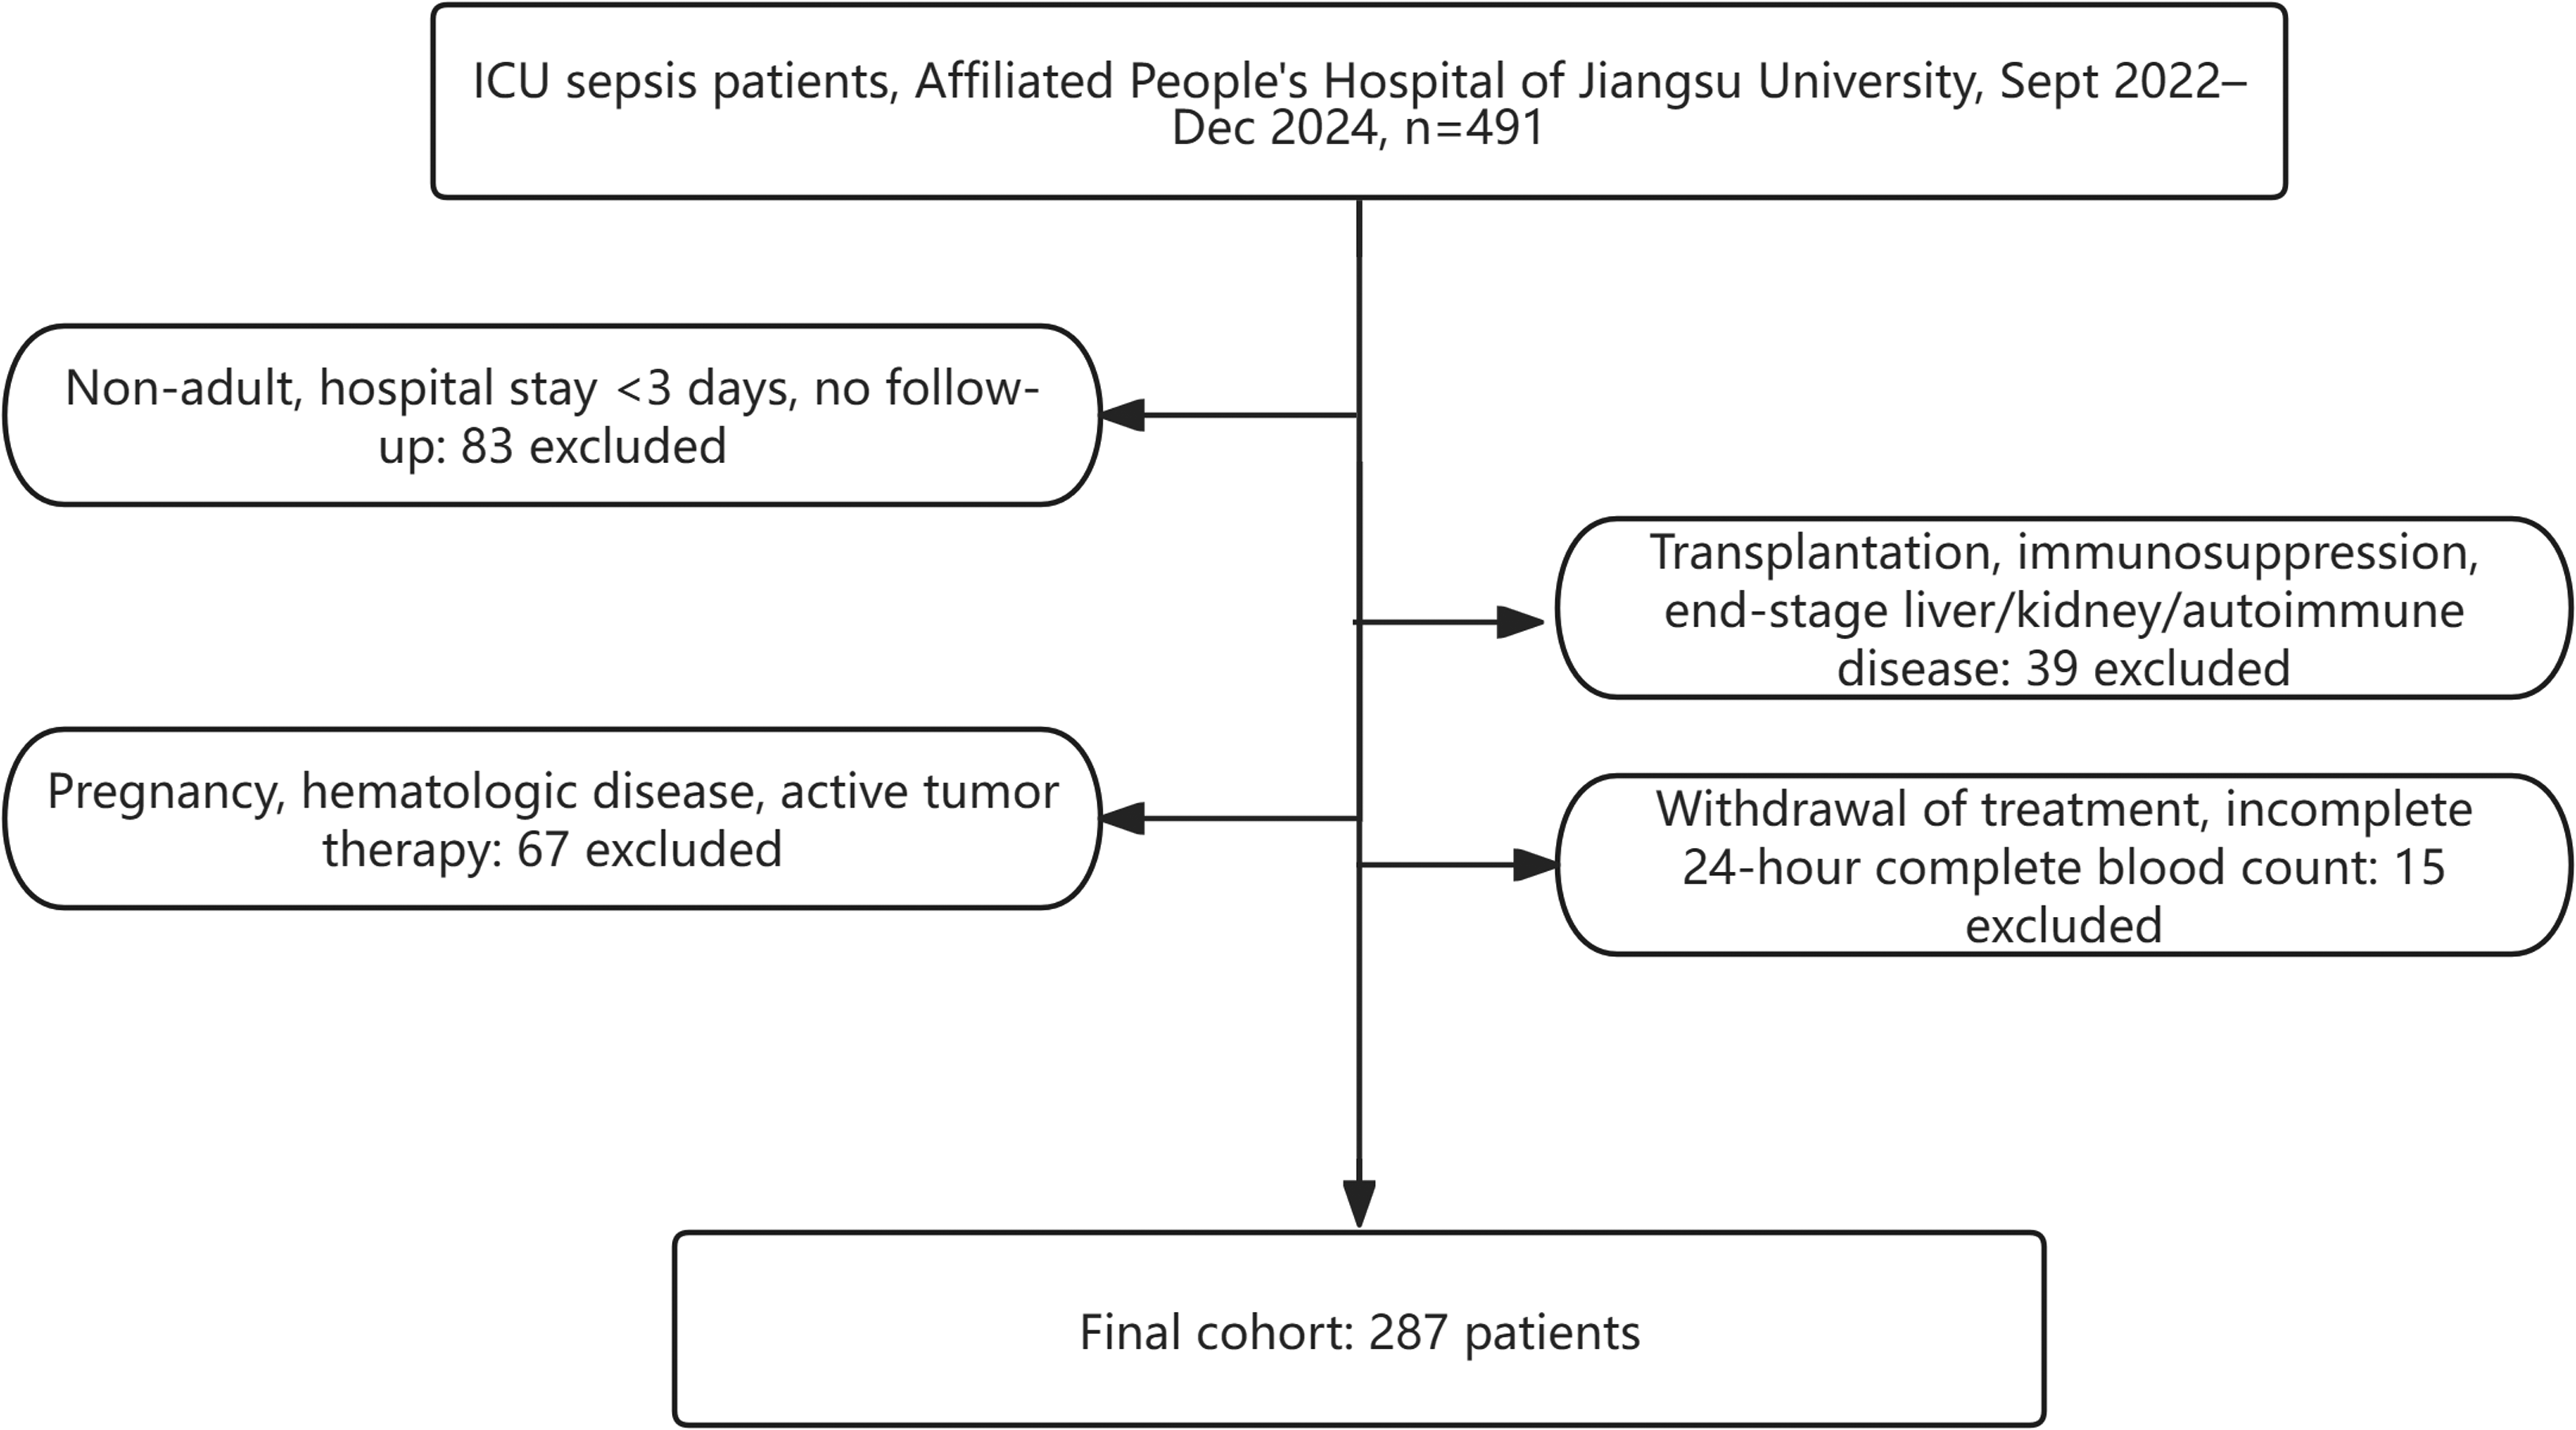
Flowchart of the study population screening process.
Comparison of baseline characteristics between higher and lower PNR groups.

ALB: albumin; ALT: alanine aminotransferase; APTT: activated partial thromboplastin time; AST: aspartate aminotransferase; BUN: blood urea nitrogen; Ca: calcium; Cl: chloride; Cr: creatinine; CRP: C-reactive protein; GCS: Glasgow Coma Scale; K: potassium; Lac: lactate; LYC: lymphocyte count; Na: sodium; Neu: neutrophil count; PCT: procalcitonin; PLR: platelet-to-lymphocyte ratio; PLT: platelet count; PNR: platelet-to-neutrophil ratio; PT: prothrombin time; SOFA: Sequential Organ Failure Assessment; WBC: white blood cell count.
Bolded text indicates statistically significant differences (p < 0.05).
Comparison of clinical outcomes, complications, and dynamic monitoring parameters between high- and low-PNR groups
Comparison of dynamic monitoring indicators showed that on day 3 of hospitalization, the high-PNR group exhibited a more favorable recovery trajectory in terms of inflammation and metabolic burden. Specifically, levels of procalcitonin (PCT), WBC, CRP, and blood lactate (Lac) were significantly lower in the high-PNR group compared with the low-PNR group (all p < 0.05), indicating a more pronounced attenuation of systemic inflammatory response and tissue hypoxia. No statistically significant difference was observed in the oxygenation index between the two groups on day 3 (p = 0.51), suggesting comparable improvements in pulmonary gas exchange function.
With regard to clinical outcomes, the high-PNR group had a significantly lower 28-day all-cause mortality rate than the low-PNR group (33.57% vs. 54.17%, p < 0.01), along with significantly longer cumulative survival time over 28 days (p < 0.01), reflecting a superior short-term survival benefit. Although the low-PNR group had a shorter total hospital stay (13.0 (7.5, 22.0) days vs. 18.0 (10.0, 30.0) days, p < 0.01), this finding—when interpreted alongside its higher mortality—likely reflects early death due to rapid disease progression, resulting in incomplete hospitalization, a phenomenon consistent with “death truncation bias.” There was no significant difference in ICU length of stay between groups (p = 0.13), further supporting similar requirements for acute-phase critical care support. Regarding complications, no statistically significant differences were observed between the two groups in the incidence of AKI or shock (both p > 0.05) (Table 2), suggesting that PNR stratification has limited utility in predicting the occurrence of these specific adverse events.
Comparison of clinical outcomes, complications, and day-3 laboratory profiles between higher and lower PNR groups.

AKI: acute kidney injury; CRP: C-reactive protein; ICU: intensive care unit; Lac D3: day-3 lactate level; PCT: procalcitonin; PNR: platelet-to-neutrophil ratio; WBC: white blood cell count.
Bolded text indicates statistically significant differences (p < 0.05).
Baseline characteristics of patients according to PLR status
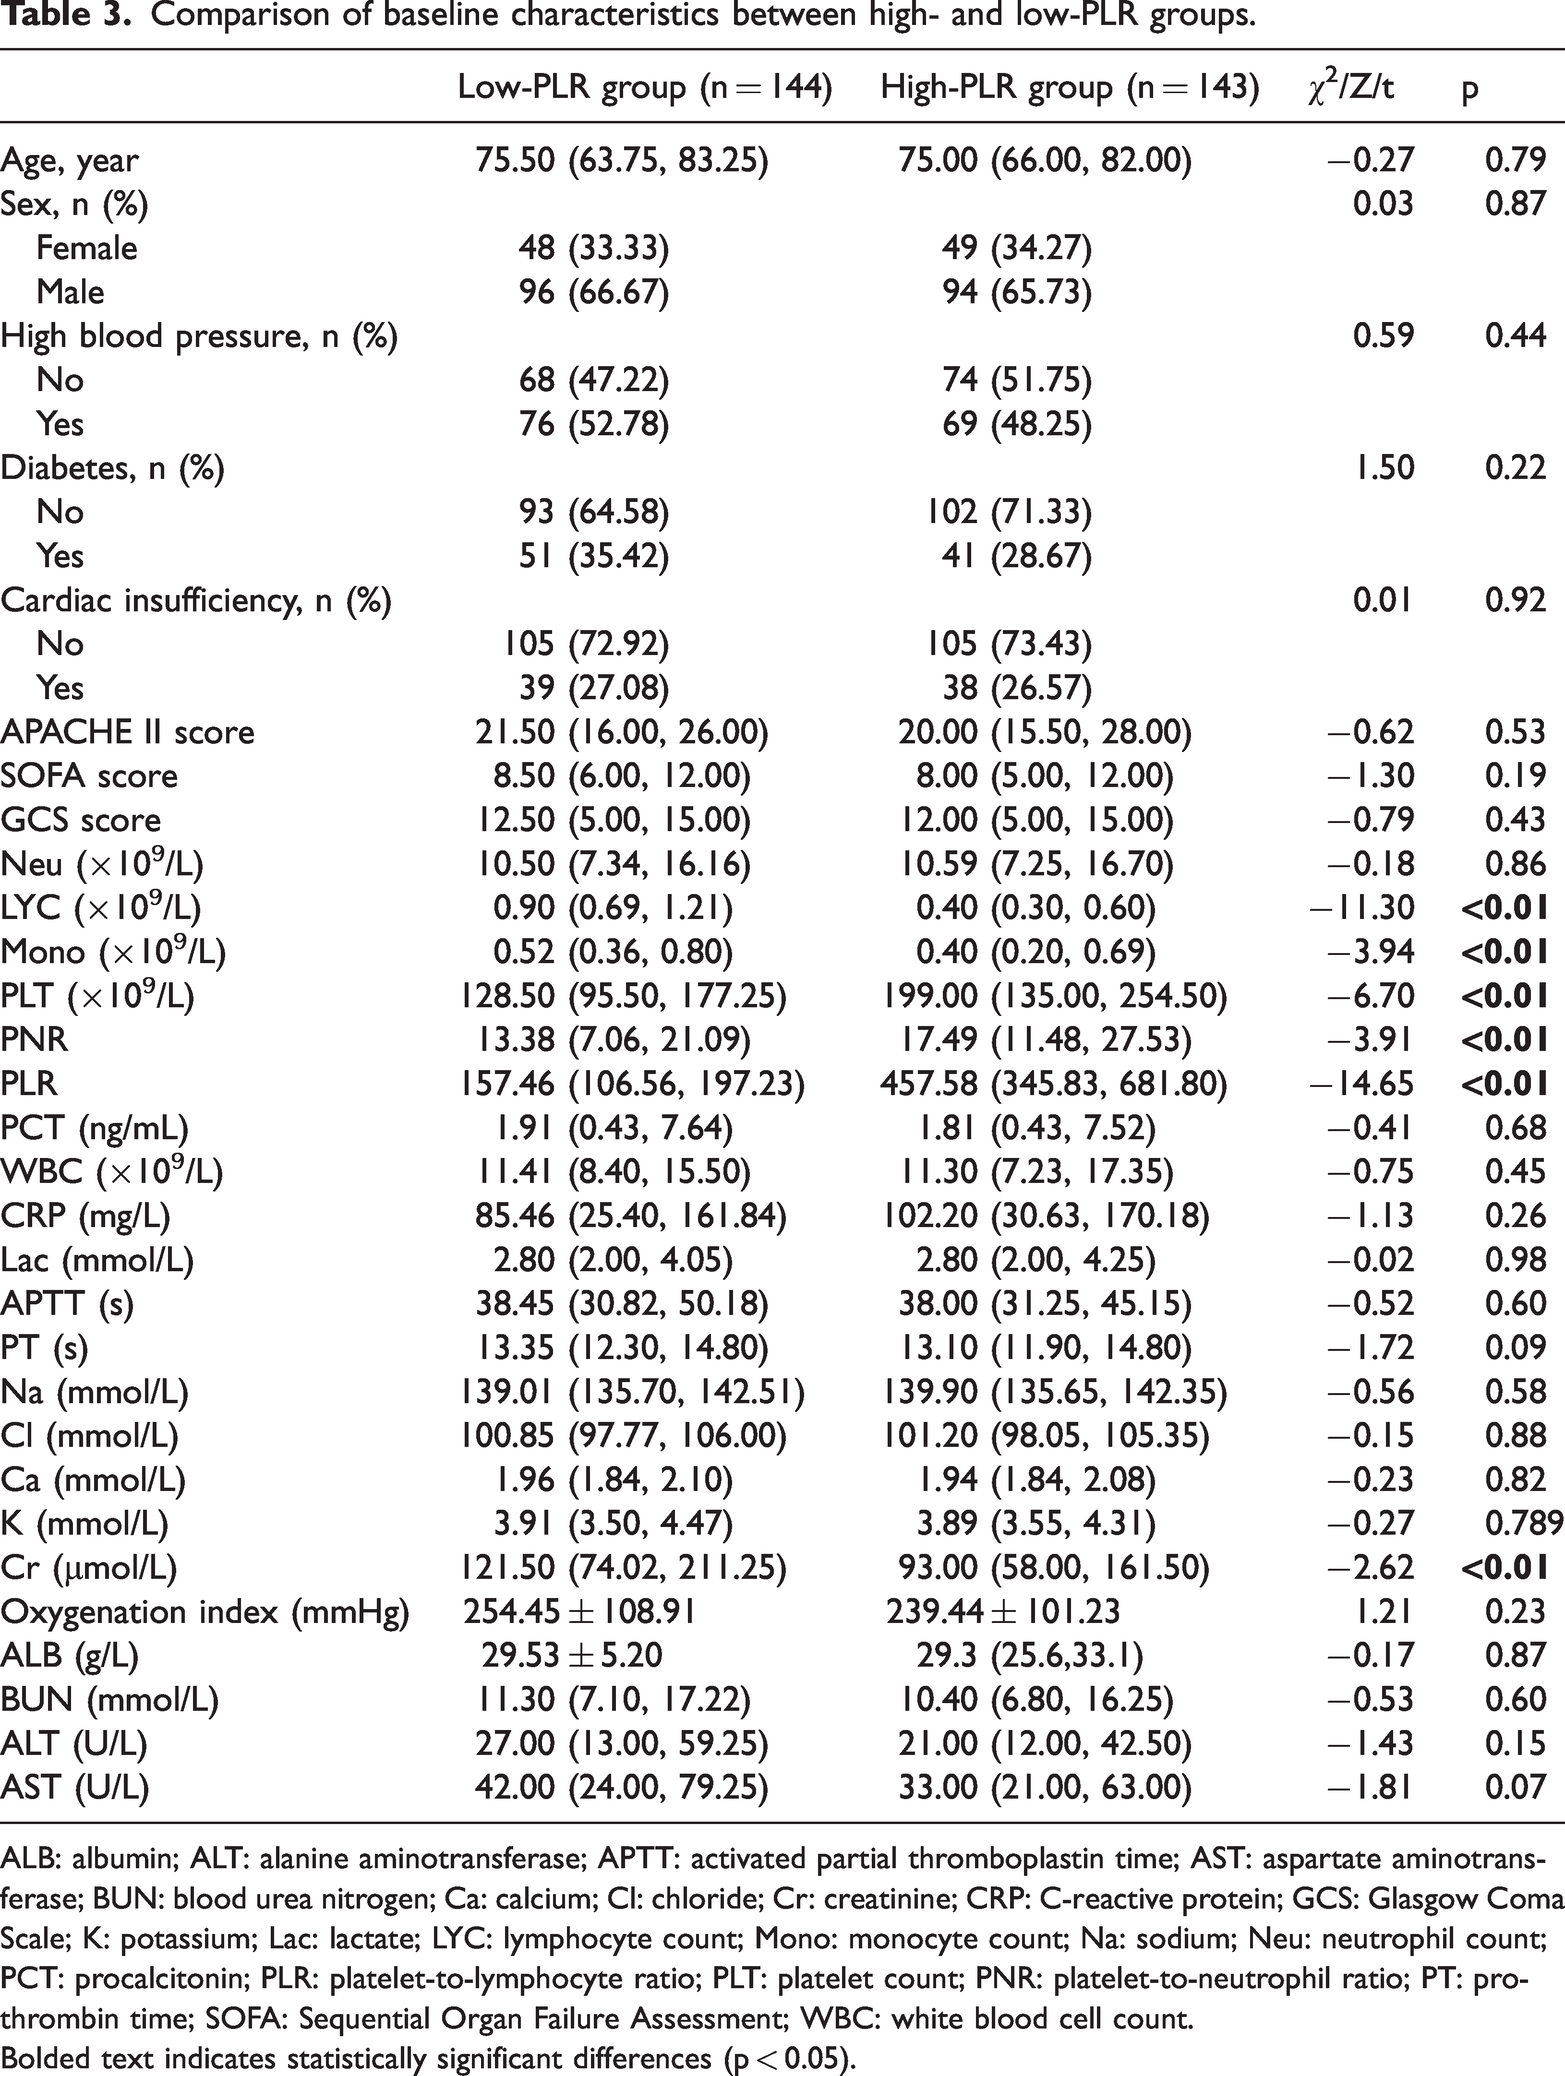
This study stratified the enrolled patients into two groups according to the median PLR. No statistically significant differences were observed between the groups in terms of age, sex, or the prevalence of comorbidities, including hypertension, diabetes, and heart failure (all p > 0.05), indicating good baseline comparability. As expected, the PLR value was significantly higher in the high-PLR group compared with the low-PLR group (457.58 (345.83, 681.80) vs. 157.46 (106.56, 197.23), p < 0.01), confirming the validity of the stratification. The high-PLR group also exhibited a higher platelet count (PLT) and PNR, along with lower LYC and monocyte count (Mono) (all p < 0.01), consistent with the underlying hematological profile associated with elevated PLR. However, no significant differences were found in disease severity scores—APACHE II, SOFA, and GCS—or in key inflammatory markers such as procalcitonin (PCT), WBC, CRP, and blood lactate levels (all p > 0.05), suggesting comparable initial illness severity between groups. With regard to organ function and biochemical parameters, the high-PLR group demonstrated better renal function, as evidenced by significantly lower serum creatinine levels (93.00 (58.00, 161.50) vs. 121.50 (74.02, 211.25) μmol/L, p < 0.01). There were no statistically significant differences in coagulation profiles, electrolytes, oxygenation index, albumin, BUN, alanine aminotransferase (ALT), or aspartate aminotransferase (AST) levels between the two groups (Table 3).
Comparison of baseline characteristics between high- and low-PLR groups.
ALB: albumin; ALT: alanine aminotransferase; APTT: activated partial thromboplastin time; AST: aspartate aminotransferase; BUN: blood urea nitrogen; Ca: calcium; Cl: chloride; Cr: creatinine; CRP: C-reactive protein; GCS: Glasgow Coma Scale; K: potassium; Lac: lactate; LYC: lymphocyte count; Mono: monocyte count; Na: sodium; Neu: neutrophil count; PCT: procalcitonin; PLR: platelet-to-lymphocyte ratio; PLT: platelet count; PNR: platelet-to-neutrophil ratio; PT: prothrombin time; SOFA: Sequential Organ Failure Assessment; WBC: white blood cell count.
Bolded text indicates statistically significant differences (p < 0.05).
Comparison of clinical outcomes, complications, and dynamic monitoring parameters between high- and low-PLR groups
As shown in Table 4, no statistically significant differences were observed between the two groups in inflammatory and metabolic parameters on day 3 of hospitalization, including WBC, CRP, blood lactate (Lac), and oxygenation index (all p > 0.05), indicating comparable short-term physiological responses during early treatment. In terms of clinical outcomes, the high-PLR group exhibited a poorer prognosis. The 28-day all-cause mortality rate was significantly higher in the high-PLR group compared with the low-PLR group (51.75% vs. 36.11%, p < 0.01), and median survival time over 28 days was significantly shorter (23.0 (10.0, 28.0) vs. 28.0 (12.75, 28.0) days, p = 0.03), suggesting a reduced probability of survival. Notably, despite worse survival, the high-PLR group had a longer total hospital stay (16.0 (9.0, 30.0) days vs. 15.0 (8.0, 24.0) days, p = 0.04), while no significant difference was observed in ICU length of stay between groups (p = 0.62). With regard to complications, the incidence of AKI and shock did not differ significantly between the two groups (all p > 0.05), implying that PLR may have limited association with these specific adverse events.
Comparison of clinical outcomes, complications, and day-3 laboratory parameters between high- and Low-PLR groups.

AKI: acute kidney injury; CRP: C-reactive protein; ICU: intensive care unit; Lac D3: day-3 lactate level; PCT: procalcitonin; PLR: platelet-to-lymphocyte ratio; WBC: white blood cell count.
Bolded text indicates statistically significant differences (p < 0.05).
Comparison of baseline characteristics between patient groups with different clinical outcomes
Patients were classified into a survival group (n = 161) and a death group (n = 126) according to 28-day survival status for comparative analysis (Table 5). The death group was significantly older than the survival group (78.00 (68.25, 85.75) vs. 74.00 (60.00, 80.00) years, p < 0.01) and exhibited markedly higher disease severity scores (APACHE II, SOFA) and blood lactate levels (all p < 0.01), while the GCS score was significantly lower (p > 0.05). These findings indicate a more severe systemic inflammatory response and greater organ dysfunction in nonsurvivors. At hospital admission, patients in the death group had significantly higher levels of lactate, sodium, BUN, and aspartate aminotransferase (AST), along with a significantly lower oxygenation index (all p < 0.05), reflecting worse baseline physiological status. Dynamic monitoring revealed that these differences persisted during the clinical course: on day 3, the death group continued to exhibit significantly elevated levels of inflammatory markers (procalcitonin (PCT), WBC) and metabolic parameters (lactate (Lac)), as well as a lower oxygenation index, suggesting poorer control of inflammation and impaired recovery of organ function compared with the survival group (all p < 0.01). Furthermore, the incidence of AKI was significantly higher in the death group (50.79% vs. 30.43%, p < 0.01), and total hospital stay was significantly shorter (p < 0.01), which may reflect early mortality due to rapid clinical deterioration rather than successful recovery.
Clinical characteristics of patients by prognostic outcomes.

ALB: albumin; ALT: alanine aminotransferase; APTT: activated partial thromboplastin time; AST: aspartate aminotransferase; BUN: blood urea nitrogen; Ca: calcium; Cl: chloride; Cr: creatinine; CRP: C-reactive protein; GCS: Glasgow Coma Scale; ICU: intensive care unit; K: potassium; Lac D3: day-3 lactate level; LYC: lymphocyte count; Mono: monocyte count; Na: sodium; Neu: neutrophil count; PCT: procalcitonin; PLR: platelet-to-lymphocyte ratio; PLT: platelet count; PNR: platelet-to-neutrophil ratio; PT: prothrombin time; SOFA: Sequential Organ Failure Assessment; WBC: white blood cell count.
Bolded text indicates statistically significant differences (p < 0.05).
The association of PNR and PLR with 28-day mortality risk
To investigate the independent effects of PNR and PLR on 28-day all-cause mortality in patients with sepsis, we first performed univariate Cox regression analysis, followed by inclusion of variables with p < 0.05 from the univariate analysis into a multivariate Cox proportional hazards model. After adjusting for potential confounders, the multivariate analysis revealed that PNR (HR = 0.97, 95% CI: 0.95–0.99, p = 0.012), PLR (HR = 1.01, 95% CI: 1.01–1.01, p = 0.043), APACHE II score (HR = 1.05, 95% CI: 1.02–1.08, p < 0.001), and day-3 blood lactate (Lac D3) (HR = 1.30, 95% CI: 1.17–1.45, p < 0.001) were independently associated with 28-day mortality (Supplementary Material S1). The forest plot illustrating these results is presented in Supplementary Material S2.
The independent associations between PNR, PLR, and 28-day all-cause mortality were systematically assessed using four sequentially adjusted multivariate Cox regression models (Table 6). In the crude model without adjustment, each unit increase in PLR was associated with a 0.1% higher risk of death (HR = 1.001), whereas each unit increase in PNR was associated with a 3% lower risk (p < 0.001). Model 1 adjusted for demographic characteristics (age, sex) and pre-existing comorbidities (hypertension, diabetes, heart failure); Model 2 further incorporated serological markers and acute complications (shock, AKI); Model 3 additionally included disease severity scores (SOFA, APACHE II, and GCS); and Model 4 adjusted for all variables significant in univariate analysis (APACHE II, Lac D3).
Multivariable cox proportional hazards regression analysis of the association between PNR/PLR and 28-day all-cause mortality across sequential adjustment models.

The crude model included only PNR and PLR. Model 1 additionally adjusted for demographic characteristics (age, sex) and pre-existing comorbidities (hypertension, diabetes, and heart failure). Model 2 further incorporated serological laboratory parameters and acute complications. Model 3 added disease severity scores—SOFA, APACHE II, and GCS—to the previous model. Model 4 adjusted for all variables that were statistically significant in univariate analysis (p < 0.05), to assess the independent associations of PNR and PLR with 28-day mortality.
CI: confidence interval; HR: hazard ratio; PLR: platelet-to-lymphocyte ratio; PNR: platelet-to-neutrophil ratio.
Following progressive multivariable adjustment, PNR consistently demonstrated a robust protective effect—each unit increase remained significantly associated with approximately a 3% reduction in mortality risk across all models (p < 0.001). In contrast, the effect size of PLR varied during the adjustment process. In the fully adjusted Model 4, each unit increase in PLR was associated with a 1% increase in mortality risk (p = 0.043), indicating that although the strength of the association attenuated after controlling for key confounders, it remained statistically significant.
The cumulative incidence curves (Figure 2(a) and (b)) demonstrate a progressive divergence in survival probabilities over time, with the low-PNR group and high-PLR group exhibiting significantly higher mortality risks compared with their respective counterparts—the high-PNR and low-PLR groups (log-rank test: p < 0.001 for PNR; p = 0.014 for PLR).

Kaplan–Meier curves for cumulative survival by platelet-to-neutrophil ratio (PNR) and platelet-to-lymphocyte ratio (PLR) groups.
Subgroup analysis and interaction tests
In the subgroup analysis, continuous variables were stratified using median values. Predefined subgroup variables included age, sex, underlying comorbidities (heart failure, diabetes, hypertension), concomitant complications (shock, AKI), and disease severity indices (SOFA score, APACHE II score, GCS score). Separate subgroup analyses were performed for PNR and PLR to assess the robustness of their associations with 28-day mortality risk. As shown in Figure 3, the protective effect of PNR (HR < 1) was more pronounced in male patients, those without a history of heart failure, those with high-PLR, individuals aged >75 years, and those with higher disease severity—specifically, APACHE II score >20, SOFA score >8, or GCS score <12 (all p < 0.05). However, no significant interaction was observed between PNR and any subgroup variable (all p for interaction > 0.05), indicating that the protective effect of PNR remains consistent across different patient subgroups (Figure 3(a)). Similarly, elevated PLR was significantly associated with increased 28-day all-cause mortality risk in several subpopulations, including females, patients with AKI, shock, low-PNR, age >75 years, APACHE II >20, SOFA >8, and GCS >12 (all subgroup-specific p < 0.05). Despite these associations, formal interaction tests revealed no statistically significant heterogeneity across subgroups (all p for interaction > 0.05), suggesting that the adverse effect of PLR on mortality is independent of these clinical characteristics (Figure 3(b)).

Forest plots of subgroup analyses for the associations between platelet-to-neutrophil ratio (PNR), platelet-to-lymphocyte ratio (PLR), and 28-day all-cause mortality.
Performance comparison and validation of predictive models
To evaluate the incremental prognostic value of PNR and PLR in sepsis, this study developed and compared multiple predictive models. Based on multivariate Cox regression analysis, a composite model incorporating APACHE II score, Lac D3, PLR, and PNR was established. As shown in Tables S3 and S4, this model exhibited the highest discriminative ability for predicting 28-day all-cause mortality, with an AUC of 0.824 (95% CI: 0.778–0.871), significantly greater than that of SOFA score alone (AUC: 0.667, DeLong test p < 0.001) or APACHE II score alone (AUC: 0.746, DeLong test p < 0.001). Furthermore, adding PNR and PLR to either SOFA score or APACHE II score improved predictive performance (AUC: 0.758 and 0.808, respectively; both p < 0.01), with statistically significant differences (Figure 4(a)).

(a) Receiver operating characteristic (ROC) curves for predicting 28-day mortality by different prognostic models. (b) Nomogram for predicting 28-day mortality (incorporating APACHE II, Lac D3, PNR, and PLR). (c) Calibration curves of the prognostic models for predicting 28-day mortality. (d) Decision curve analysis of the prognostic models. APACHE II: Acute Physiology and Chronic Health Evaluation II; Lac D3: day-3 lactate level; PLR: platelet-to-lymphocyte ratio; PNR: platelet-to-neutrophil ratio.
Based on the optimal composite prediction model, this study developed an individualized prognostic nomogram (Figure 4(b)) that translates the value of each predictor into corresponding points, enabling straightforward quantification of 28-day mortality risk for individual patients. Furthermore, through comprehensive evaluation of calibration curves and key model performance metrics, the composite model (APACHE II + Lac D3 + PNR + PLR) demonstrated superior predictive performance and was selected as the final preferred model (Figure 4(c)). This model achieved the lowest Brier score (0.173) among all candidates, indicating minimal overall discrepancy between predicted probabilities and observed outcomes. Its C-index reached 0.824—the highest value across models—reflecting the strongest ability to discriminate between patients with different prognoses. Although the Hosmer–Lemeshow test indicated a statistically significant deviation from perfect calibration in certain risk strata (p = 0.025), the calibration slope and intercept remained close to ideal values (1.00 and 0.00, respectively). After comprehensive consideration of discrimination, calibration, and overall accuracy, this composite model provides the most reliable prediction of 28-day all-cause mortality in patients with sepsis and is recommended as the primary predictive tool.
DCA was employed to assess the net benefit of each prediction model across various clinical decision thresholds, as illustrated in Figure 4(d). Within the overall threshold range of 5%–40%, the composite prediction model (APACHE II + Lac D3 + PNR + PLR) consistently demonstrated the highest net benefit. This advantage became particularly pronounced in the medium- to high-risk threshold range of 15%–40%. For instance, at a 20% decision threshold, the net benefit of the composite model reached 0.3441, significantly exceeding that of the APACHE II + PNR + PLR model (0.3345) and the APACHE II-only model (0.3040). Model comparisons revealed a stepwise improvement in clinical net benefit when PNR and PLR were sequentially added to the APACHE II score, with further enhancement upon incorporation of Lac D3. Notably, in the low-threshold range (5%–10%), all models exhibited net benefits similar to those of the “treat all” strategy; however, beyond a 10% threshold, the composite model incorporating PNR and PLR began to demonstrate clear clinical utility. These findings indicate that risk stratification using the composite model (APACHE II + Lac D3 + PNR +PLR) provides superior decision support for clinicians across a broad spectrum of clinical scenarios, resulting in greater net clinical benefit.
Based on the analysis of IDI and NRI, this study systematically assessed the improvement in predictive performance achieved by incorporating novel biomarkers into the baseline model (Table 7). When increasingly complex variable combinations were incrementally added to the SOFA score, the model demonstrated significant and progressive gains in predictive accuracy. The composite model (APACHE II + Lac D3 + PNR + PLR) exhibited the greatest improvement, with an IDI of 0.2047 (p < 0.001) and an NRI of 0.7015 (p < 0.001), indicating not only substantial enhancement in discrimination between deceased and surviving patients but also marked improvement in risk reclassification accuracy. Notably, even the addition of PNR and PLR to the SOFA score alone (SOFA + PNR + PLR) yielded a statistically significant improvement (IDI = 0.0963, p < 0.001; NRI = 0.3796, p < 0.001). Similarly, sequential inclusion of PNR and PLR into the APACHE II score (APACHE II + PNR + PLR), and further incorporation of Lac D3 to form the full model, resulted in significant enhancements in predictive performance (both IDI and NRI, p < 0.001). However, compared with the single-variable APACHE II model, neither the SOFA score alone (IDI = −0.0863, p = 1; NRI = −0.3444, p = 0.999) nor the SOFA + PNR + PLR model (IDI = 0.0101, p = 0.353; NRI = −0.0259, p = 0.7) demonstrated a statistically significant improvement. Collectively, these findings indicate that integrating PNR and PLR with conventional critical illness severity scores—particularly when augmented with dynamic lactate assessment (Lac D3)—substantially improves the prediction of 28-day all-cause mortality in patients with sepsis and holds significant potential for clinical application and implementation.
Improvement in predictive performance: IDI and NRI for model comparisons.

APACHE II: Acute Physiology and Chronic Health Evaluation II; IDI: integrated discrimination improvement; NRI: net reclassification improvement; PLR: platelet-to-lymphocyte ratio; PNR: platelet-to-neutrophil ratio; SOFA: Sequential Organ Failure Assessment.
Discussion
Sepsis is characterized by acute onset and rapid disease progression, coupled with high morbidity and mortality rates, prolonged hospital stay, readmission, and death, posing a severe threat to patient survival and imposing a substantial global healthcare burden. In patients undergoing colorectal surgery, Panos and colleagues reported that surgical site infections—a common precursor or concomitant condition of sepsis—occurred in 21.8% of cases, with significantly higher frequencies among older adults, patients with diabetes, and chronic steroid users. 16 Mulita et al. 17 further demonstrated that postoperative sepsis following colorectal procedures occurred in 12.77% of cases and was significantly more common among patients over 65 years of age, those with higher American Society of Anesthesiologists (ASA) scores, and those with comorbidities such as diabetes and cardiovascular disease. As a life-threatening condition driven by dysregulated host immune responses, the pathophysiology of sepsis involves complex multisystem interactions. Its pathogenesis integrates multiple interrelated pathological processes, including immune cell dysfunction, cytokine network imbalance, coagulation system activation, endothelial injury, complement-mediated inflammation, intestinal microbiota dysbiosis, neuroendocrine dysregulation, and metabolic disturbances, collectively contributing to progressive multiorgan dysfunction. 18 Despite significant advances in understanding the underlying mechanisms of sepsis, the clinical challenge of achieving early and accurate risk stratification and prognostic assessment—essential for guiding individualized therapeutic strategies—remains unresolved. 19 In this context, the present study focuses on the PNR and PLR—two cost-effective, readily accessible inflammatory biomarkers derived from routine complete blood counts—to systematically evaluate their incremental value in enhancing prognostic model performance in sepsis. The identification of such biomarkers represents a critical step toward improving early risk stratification, potentially reducing avoidable complications, hospital readmissions, and downstream healthcare expenditures.
Platelets play a dual role in sepsis, not only maintaining hemostatic homeostasis but also functioning as multifunctional effector cells that actively participate in host defense, inflammatory regulation, and thrombo-immune crosstalk, thereby serving as critical mediators of organ dysfunction. 20 Pathogen-induced platelet activation occurs through multiple mechanisms, including direct binding to platelet surface receptors, plasma protein–mediated bridging, or exposure to pathogen-derived soluble factors. Upon activation, platelets release a wide array of granular contents and proinflammatory mediators, which subsequently activate monocytes/macrophages, neutrophils, and other immune cells, establishing a self-amplifying cycle of coagulation and inflammation that exacerbates tissue injury and drives multiorgan failure.21,22 This pathophysiological mechanism is further supported by omics-based evidence: Shen et al. 23 demonstrated, through intercellular communication analysis and pseudotime trajectory reconstruction, that the signaling network between platelets and various immune and nonimmune cells is significantly intensified in patients with sepsis, with platelets exhibiting disease stage–specific upregulation during the late phase—findings that collectively underscore their central role from both functional interaction and dynamic expression standpoints. Notably, beyond baseline platelet counts, the temporal trajectory of platelet dynamics is strongly associated with clinical outcomes; in particular, the duration of thrombocytopenia has been established as a key prognostic indicator in sepsis.24–26
In addition to platelets, neutrophil dysfunction plays a pivotal role in the progression of sepsis. These cells undergo a phenotypic shift from being “antimicrobial defenders” to becoming core drivers of inflammation–immune imbalance. Their dysregulation is characterized by immunosuppression due to expansion of immature inhibitory subsets, aberrant migration and tissue accumulation resulting from chemokine receptor dysregulation, and the promotion of inflammatory storms and microthrombosis via abnormal cell death pathways such as NETosis—all of which synergistically contribute to multiorgan dysfunction. 8 Concurrently, lymphocytes, as central components of adaptive immunity, experience profound quantitative depletion and functional exhaustion during sepsis. This state of acquired immune paralysis represents a key pathological mechanism underlying increased susceptibility to secondary infections, progression to multiple organ failure, and elevated mortality. 27
The pathological and physiological alterations induced by sepsis—particularly the synergistic interplay between abnormal platelet activation and lymphocyte apoptosis and depletion—directly contribute to an elevated PLR. Our findings support this mechanistic hypothesis: PLR is an independent predictor of 28-day all-cause mortality (HR = 1.01, p = 0.043), a result consistent with prior evidence. Shen et al., 11 in a MIMIC-III database analysis of 5,537 patients with sepsis, reported that higher PLR levels were significantly associated with increased mortality risk. However, consensus remains limited across existing studies. For instance, Zheng et al. 12 cohort analysis of 3,303 patients with sepsis revealed a U-shaped association between PLR and mortality—where both excessively high and low-PLR values predicted poor outcomes—and demonstrated that nonsurvivors exhibited a more rapid decline in PLR during early disease progression, suggesting that its dynamic trajectory may be closely linked to clinical prognosis. These apparently conflicting observations collectively suggest that persistently elevated PLR may reflect sustained inflammatory activity and immune dysregulation, with discrepancies among studies potentially attributable to differences in patient populations, inclusion criteria, or statistical modeling approaches.
This study offers a novel integrative perspective on these heterogeneous findings: the defining characteristic of the high-PLR group is not heightened systemic inflammation—as evidenced by comparable procalcitonin (PCT) and CRP levels relative to the low-PLR group—but rather marked lymphopenia accompanied by relatively preserved platelet counts. This key observation implies that the prognostic value of PLR extends beyond conventional severity scores and acute-phase inflammatory markers, potentially capturing a distinct dimension of sepsis immunopathology. Elevated PLR may thus identify a specific immune phenotype characterized by “relatively preserved platelet function” and “profound lymphocyte depletion.” Notably, despite similar baseline illness severity scores upon admission, the high-PLR group exhibited superior renal function (lower serum creatinine, p < 0.01), further underscoring the unique nature of their prognosis: even in the presence of relatively preserved organ function, underlying immune imbalance—particularly severe lymphopenia—may still predispose patients to adverse outcomes. This provides a compelling rationale for interpreting PLR as an independent risk factor—not as a direct indicator of acute inflammatory intensity, but as a sensitive marker of depleted host immune reserve, i.e. “immune paralysis.” In the course of sepsis, persistent lymphocyte apoptosis and numerical decline constitute central features of immunosuppression and are strongly associated with secondary infections and mortality. 28 By integrating platelets, which reflect the thrombo-inflammatory axis, and lymphocytes, which represent adaptive immune competence, PLR bridges two pivotal pathological pathways. 29 Its elevation may therefore signify the transition from hyperinflammation to late-stage immune exhaustion. This mechanism elegantly explains why elevated PLR can independently predict mortality beyond traditional scoring systems in this and other studies: 30 it captures a critical, yet often underrecognized, driver of poor prognosis in sepsis—immune failure.
Comparative analysis across different PNR strata revealed that patients in the low-PNR group exhibited greater disease severity, as evidenced by significantly higher SOFA scores (p < 0.01). This group also demonstrated a more pronounced systemic inflammatory response and more extensive organ dysfunction, characterized by elevated levels of inflammatory markers (e.g. PCT and WBC), impaired coagulation function (prolonged APTT and PT), and significantly worse renal (elevated Cr and BUN) and hepatic (elevated ALT and AST) parameters compared with the high-PNR group (all p < 0.05). These clinical features closely align with the “persistent platelet consumption” phenotype described by Zhou et al. 31 in their study on platelet dynamics in sepsis, which is associated with marked multiorgan dysfunction and increased mortality. Collectively, these findings indicate that a low-PNR value is strongly associated with a more severe disease phenotype in patients with sepsis. With regard to disease trajectory, our observations are consistent with prior evidence. Xie et al. 32 conducted a retrospective analysis of 367 patients fulfilling Sepsis-3 criteria and reported that nonsurvivors maintained heightened inflammatory activity and poorer tissue perfusion on day 3, with significantly higher IL-6D3 and PCTD3 levels than survivors (both p < 0.01), suggesting resolution of inflammation in survivors vs. sustained activation in nonsurvivors. In parallel, patients in the low-PNR group continued to exhibit persistent inflammation and compromised organ perfusion on day 3, with significantly elevated PCTD3, WBCD3, CRPD3, and Lac D3 levels relative to the high-PNR group (all p < 0.05). This suggests that the pathological state reflected by low-PNR is not transient but rather indicative of ongoing, poorly controlled systemic inflammation and tissue hypoxia. In terms of clinical outcomes, the low-PNR group experienced a substantially higher burden of illness: they had a significantly higher 28-day all-cause mortality rate compared with the high-PNR group (54.17% vs. 33.57%, p < 0.01), along with a significantly shorter 28-day cumulative survival time (p < 0.01). Notably, although this group had a shorter median hospital length of stay, this finding—when interpreted alongside their higher mortality—likely reflects early death due to rapid clinical deterioration rather than milder disease. Thus, the reduced hospitalization duration represents an indirect marker of adverse prognosis. These data collectively demonstrate that PNR is not merely a prognostic risk stratification tool but also a biologically meaningful indicator reflecting dysregulation within the “inflammation-coagulation-immunity” axis in sepsis. Emerging evidence further supports the biological relevance of PNR: it has been shown to correlate significantly with the extent of NET formation in the peripheral blood of patients with sepsis, implicating it in the pathogenesis of immunothrombosis.10,33
Multivariable Cox proportional hazards regression, with comprehensive adjustment for potential confounders, confirmed that both lower PNR and higher PLR values are independent predictors of 28-day all-cause mortality in patients with sepsis. Kaplan–Meier survival analysis further substantiated this finding, revealing statistically significant differences in cumulative survival probabilities across PNR and PLR groups (log-rank p < 0.05), underscoring their strong association with mortality risk. This observation is corroborated by previous studies; for instance, Wang et al. 34 reported in a pediatric sepsis cohort that a high-PLR was associated with increased 28-day mortality and faster disease progression. Moreover, multiple studies have validated the utility of PNR in both the diagnosis and prognostic evaluation of sepsis.13,35,36 Furthermore, we performed a systematic subgroup analysis to assess the prognostic performance of PNR and PLR across diverse patient populations, including stratifications by age, sex, comorbidities, and baseline disease severity. The protective effect of PNR (HR < 1) and the adverse prognostic impact of PLR (HR > 1) remained consistently present across all subgroups. Importantly, no significant heterogeneity was observed in interaction tests (p for interaction > 0.05), indicating that the predictive value of these ratios is robust and largely independent of baseline demographic and clinical characteristics. These results reinforce the reliability and broad applicability of PNR and PLR as stable and generalizable biomarkers for risk prediction in patients with sepsis.
To systematically evaluate the prognostic performance of PNR and PLR and their incremental value over conventional scoring systems, we conducted a comprehensive model comparison analysis. ROC curve analysis revealed that the AUC for the SOFA score alone was 0.667, while that for the APACHE II score alone was 0.746. Notably, integrating PNR and PLR into these traditional models significantly enhanced predictive accuracy: the AUC of the SOFA + PNR + PLR model increased to 0.758 (DeLong test, p < 0.01 vs. SOFA alone), and the AUC of the APACHE II + PNR + PLR model rose to 0.808 (DeLong test, p < 0.01 vs. APACHE II alone). This finding aligns with prior work by Shi et al., 37 who demonstrated that incorporating the novel inflammatory biomarker neutrophil-to-lymphocyte–platelet ratio into the SOFA score improved the AUC for predicting in-hospital mortality from 0.654 to 0.718. Collectively, these results indicate that augmenting traditional prognostic scores with composite biomarkers reflecting immune and coagulation status can systematically improve risk prediction in patients with sepsis. Building on key predictors identified through multivariable analysis, we developed a composite prognostic model incorporating the APACHE II score, Lac D3, PNR, and PLR. This model exhibited excellent discriminative ability, achieving an AUC of 0.824—significantly higher than all other candidate models (all p < 0.01). These findings underscore that PNR and PLR not only possess robust independent predictive power but also contribute substantial incremental information beyond established clinical scores, thereby enabling the construction of a more precise and clinically informative risk assessment tool.
Although the composite model demonstrated strong discrimination, its ultimate clinical utility depends on its applicability in real-world settings. To facilitate individualized risk estimation and support clinical decision-making, we translated the model into a user-friendly nomogram. Calibration was assessed using calibration curves, and model performance was compared across five candidate models. The final model achieved the lowest Brier score (0.173) and the highest discrimination (AUC = 0.824). While the Hosmer–Lemeshow test indicated a statistically significant deviation from perfect calibration (p = 0.025), the average absolute error was minimal (Eavg = 0.043), indicating close agreement between predicted and observed outcomes. Given its high C-index (0.824) and low overall prediction error, we consider the slight calibration discrepancy to be clinically acceptable and outweighed by its superior discriminatory performance and overall accuracy. DCA further confirmed the model’s clinical net benefit: within the clinically relevant threshold probability range of 5%–40%, the composite model consistently yielded the highest net benefit compared with alternative strategies. This range corresponds closely to decision thresholds commonly used in clinical practice for initiating preventive or intensified therapies in patients with sepsis. Importantly, the model outperformed both the “treat all” and “treat none” strategies, demonstrating that its use can lead to better-informed decisions and improved patient management. These findings provide strong evidence supporting the model’s potential as a practical clinical decision-support tool. Finally, we quantitatively evaluated the improvement in predictive performance using IDI and NRI metrics. The results confirmed that adding PNR and PLR to traditional models significantly enhanced both discrimination and reclassification (both IDI and NRI, p < 0.01). Further inclusion of Lac D3 yielded the greatest incremental gains across all performance measures. Collectively, these analyses demonstrate that integrating PNR and PLR into conventional prognostic frameworks substantially improves the prediction of 28-day all-cause mortality in patients with sepsis, offering clinicians a more reliable, nuanced, and actionable tool for risk stratification and personalized management.
This study has several key strengths. First, through a rigorously adjusted multivariable regression model, we demonstrated that PNR is an independent protective factor for 28-day all-cause mortality in patients with sepsis, providing robust evidence for its potential clinical utility as a novel prognostic biomarker. Second, the study features innovative model integration and systematic validation: although the combined use of PNR and PLR has been previously suggested, this is the first study to systematically evaluate and confirm their incremental predictive value when added to established clinical scoring systems such as SOFA and APACHE II. We developed a hierarchical modeling framework—from individual predictors to composite models—and comprehensively validated performance using multiple statistical approaches, including ROC curve analysis, calibration plots, DCA, IDI, and NRI. This multidimensional analytical strategy enhances methodological rigor and supports the reliability of our conclusions. Several limitations should also be acknowledged. First, due to the retrospective, single-center design, despite extensive adjustment for potential confounders, residual selection bias and information bias cannot be fully excluded. Furthermore, the observational nature of the study precludes causal inference, and associations identified should be interpreted as hypothesis-generating rather than definitive. Second, the scope of biomarkers analyzed was limited—our focus was primarily on PNR and PLR, without incorporating other emerging inflammatory or immune markers (e.g. cytokine profiles, microbiome data) for comparative assessment. This may constrain the comprehensiveness of the model. Future studies could integrate multiomics data to develop more comprehensive risk prediction tools. Finally, the dynamic trajectories of PNR and PLR over time were not fully explored. As the analyses relied on baseline measurements obtained early after admission, longitudinal monitoring of these ratios throughout the septic course was lacking. Investigating their temporal evolution and time-dependent association with clinical outcomes represents a promising direction for future research.
In addition to PNR and PLR, butyrylcholinesterase (BChE) has recently drawn attention as a potential biomarker in infectious diseases. BChE is a nonspecific cholinesterase primarily synthesized in the liver, and its activity decreases significantly during systemic inflammation. 38 A prospective study in patients undergoing colorectal surgery found that low postoperative BChE levels were independently associated with an increased risk of surgical site infections. 39 Direct evidence from septic populations indicates that critically ill patients with sepsis who exhibited a sustained reduction in BChE activity had significantly higher 90-day mortality. 40 Mechanistically, BChE is thought to reflect the activity of the cholinergic anti-inflammatory pathway—a distinct neuroimmune axis that modulates cytokine release, which differs from the platelet–lymphocyte and platelet–neutrophil axes captured by PNR and PLR. 38 Integrating BChE with PNR and PLR may offer a more comprehensive immunometabolic profile for early risk stratification in patients with sepsis.
While our findings highlight the standalone value of PNR and PLR, their clinical utility could be further enhanced by leveraging emerging technologies. Beyond the prognostic value of PNR and PLR established in this study, emerging technologies such as the Internet of Things (IoT) and three-dimensional (3D) printing offer promising avenues for clinical translation. IoT-based telemonitoring systems have been successfully used in surgical patients to remotely track physiological parameters, including heart rate, activity status, and vital signs, facilitating early detection of complications and reducing unplanned clinic visits. 41 Extending this capability to sepsis management, future IoT networks could integrate wearable sensors to obtain serial hematological measurements, thereby enabling dynamic tracking of PNR and PLR trajectories—rather than relying on single static assessments—and potentially providing real-time early warnings of clinical deterioration. In parallel, 3D printing has already demonstrated broad utility in medicine, from patient-specific anatomical models and bioprosthetic materials to enhanced surgical training. 42 Recent advances have produced a 3D-printed modular microfluidic device that magnetically captures bacteria from whole blood and purifies their genomic DNA in approximately 50 min, achieving a PCR-based detection limit as low as 10 CFU/mL. 43 This technology directly addresses the critical bottleneck of timely pathogen identification in sepsis, overcoming low bacterial concentrations and amplification inhibitors in blood. When integrated with PNR/PLR-based risk stratification, such 3D-printed diagnostic tools could guide targeted antimicrobial therapy, bridging early warning and precision treatment. The combination of IoT, 3D printing, and cost-effective biomarkers holds great promise for personalized, real-time management of patients with sepsis.
Conclusion
This study systematically developed and validated multiple prediction models, suggesting that the PNR and PLR may serve as independent predictors of 28-day mortality in patients with sepsis. The integration of PNR and PLR into conventional prognostic scoring systems—specifically SOFA and APACHE II—yielded composite models that demonstrated superior performance in discrimination, calibration, and clinical DCA. Notably, the comprehensive model incorporating the APACHE II score, day-3 lactate level (Lac D3), PNR, and PLR exhibited the highest predictive accuracy (AUC = 0.824). These findings suggest that PNR and PLR may effectively capture key pathophysiological aspects of “inflammation-coagulation-immunity” axis dysregulation in sepsis, thereby potentially offering incremental prognostic value beyond established assessment tools. The nomogram derived from this model may provide a practical and reliable instrument for individualized risk stratification and timely clinical intervention, with potential for clinical translation. Given the observational design of this study, definitive causal conclusions cannot be drawn, and further prospective validation is warranted.
Supplemental Material
sj-pdf-1-imr-10.1177_03000605261452559 - Supplemental material for The incremental prognostic value of platelet-to-neutrophil and platelet-to-lymphocyte ratios in patients with sepsis: A retrospective cohort study
Supplemental material, sj-pdf-1-imr-10.1177_03000605261452559 for The incremental prognostic value of platelet-to-neutrophil and platelet-to-lymphocyte ratios in patients with sepsis: A retrospective cohort study by Chunhui Ni, Fang Ye, Xi Zhang, Jianwei Song, Hongfeng Yang and Jundan Cai in Journal of International Medical Research
Footnotes
Acknowledgments
The authors gratefully acknowledge the support from the Medical Education Collaborative Innovation Fund of Jiangsu University (No. JDY2022008) and the Zhenjiang Key Research and Development Program – Social Development (No. SH2023005). We thank our colleagues for their assistance in data collection and laboratory work. Special thanks are given to the patients who participated in this study. Artificial intelligence‑assisted language polishing was used to improve the English of this manuscript. The AI tool was used solely for grammar, spelling, and stylistic improvements, and not for any aspect of the research design, data collection, data analysis, or interpretation of results.
Author contributions
Chunhui Ni: Writing – review & editing, Writing – original draft, visualization, validation, software, resources, project administration, methodology, investigation, formal analysis, data curation, conceptualization. Fang Ye: Writing – original draft, project administration, methodology, investigation, formal analysis, data curation, conceptualization. Xi Zhang: methodology, investigation, formal analysis, data curation, conceptualization. Jianwei Song: visualization, validation, software, resources. Hongfeng Yang: supervision, conceptualization, funding acquisition. Jundan Cai: methodology, investigation, formal analysis, supervision.
Consent for publication
Written informed consent for publication was obtained from all participants.
Competing interests
The authors declare no competing interests.
Code availability
Not available.
Data availability
The authors confirm that the data supporting the findings of this study are available in the article.
Data availability statement
Data used and analyzed in this study are available from the corresponding author upon reasonable request.
Declarations
Ethical approval for this study (Approval No: (2025) KYW001-88) was granted by the Ethics Committee of The Affiliated People’s Hospital of Jiangsu University. The committee waived the need for informed consent given the retrospective design of the research, which was performed in accordance with local regulatory standards.
Funding
Supported by the Medical Education Collaborative Innovation Fund of Jiangsu University (No. JDY2022008) and the Zhenjiang Key Research and Development Program – Social Development (No. SH2023005).
Supplemental material
Supplemental material for this article is available online.
References
Supplementary Material
Please find the following supplemental material available below.
For Open Access articles published under a Creative Commons License, all supplemental material carries the same license as the article it is associated with.
For non-Open Access articles published, all supplemental material carries a non-exclusive license, and permission requests for re-use of supplemental material or any part of supplemental material shall be sent directly to the copyright owner as specified in the copyright notice associated with the article.