
Abstract
Background
Postoperative delirium is a frequent and serious complication after noncardiac surgery, linked to increased morbidity, prolonged hospitalization, and long-term cognitive decline. Although several prediction models have demonstrated good discriminative ability in external validation, challenges remain regarding implementation across clinical settings and model interpretability. This study compared three machine learning models—eXtreme Gradient Boosting, logistic regression, and support vector machine—for early postoperative delirium prediction.
Methods
A retrospective cohort of 143 adults undergoing elective noncardiac surgery was analyzed (incidence of postoperative delirium = 15.4%). Data regarding 11 perioperative variables, including age, American Society of Anesthesiologists class, Mini-Mental State Examination score, surgery duration, and lowest intraoperative mean arterial pressure, were collected. Data were split in an 80:20 ratio into training and validation sets. Performance was assessed using area under the receiver operating characteristic curve, sensitivity, specificity, accuracy, and calibration. Shapley Additive Explanations analysis evaluated feature contributions.
Results
Age, Mini-Mental State Examination score, hemoglobin, surgery duration, opioid dose, lowest mean arterial pressure, blood loss, and American Society of Anesthesiologists class were significant predictors. eXtreme Gradient Boosting achieved the best validation performance (area under the receiver operating characteristic curve = 0.852; 95% confidence interval = 0.781–0.923), outperforming logistic regression (0.715) and support vector machine (0.698), with good calibration (Hosmer–Lemeshow, p = 0.89). Shapley Additive Explanations identified age, Mini-Mental State Examination score, and lowest mean arterial pressure as the most influential features.
Conclusion
eXtreme Gradient Boosting is an accurate and interpretable tool for postoperative delirium risk prediction, capturing complex nonlinear interactions and supporting targeted perioperative prevention.
Introduction
Postoperative delirium (POD) is defined as an acute, fluctuating disturbance in attention and cognition, and it is one of the most frequent and costly complications in surgical patients, particularly older adults.1–3 Incidence rates can reach up to 50% in high-risk populations, and POD is independently associated with increased 1-year mortality, prolonged hospitalization, and accelerated long-term cognitive decline. 4 Given these severe consequences, the ability to accurately identify patients at high risk of POD I a timely manner is paramount for implementing preventive strategies and optimizing patient outcomes. 5
The underlying pathophysiology of POD is multifactorial, involving a complex interplay between predisposing patient vulnerability and precipitating perioperative insults. Key mechanisms include neuroinflammation, disruption of the blood–brain barrier (BBB) integrity, and dysregulation of neurotransmitter systems, particularly cholinergic and dopaminergic pathways. 6 Patient-specific factors such as advanced age, pre-existing cognitive impairment (reflected by low Mini-Mental State Examination (MMSE) scores), and high comorbidity burden (American Society of Anesthesiologists (ASA) class ≥3) represent a state of reduced brain reserve and heightened vulnerability to stress.
Traditional risk assessment tools, including ASA class and various clinical scoring systems, are typically based on linear combinations of predefined predictors. 7 These models have demonstrated clinically meaningful discriminative ability in some recent external validation studies, with reported area under the receiver operating characteristic (ROC) curve (AUC) values approaching 0.86.8,9 However, POD arises from dynamic interactions between multiple predisposing and precipitating factors, and the relative contribution of these interactions may vary across patient populations and perioperative contexts. In this setting, more flexible modeling approaches may offer complementary advantages by capturing potential nonlinear patterns and higher-order interactions.
Machine learning (ML) techniques have increasingly been applied to perioperative risk prediction. 10 Algorithms such as eXtreme Gradient Boosting (XGBoost) are capable of modeling complex relationships in structured clinical data while maintaining strong predictive performance.11,12 In addition, the integration of explainability methods, such as Shapley Additive Explanations (SHAP), facilitates transparent interpretation of model outputs and may enhance clinical trust and applicability. Recent reviews have highlighted the growing interest in ML-based approaches for POD prediction, although methodological rigor and internal validation strategies remain critical considerations.2,13
This study was designed to develop and internally validate a predictive model for POD in a cohort of noncardiac surgery patients. We specifically aimed to compare the performance of three widely used modeling approaches—XGBoost, logistic regression (LR), and support vector machine (SVM)—to establish the most effective computational strategy for perioperative risk stratification, while also providing insights into model calibration and feature contributions.
Methods
Study design and patient population
This study employed a retrospective cohort design using real-world clinical data from 143 adult patients who underwent elective noncardiac surgery. The cohort primarily consisted of older adults undergoing major elective procedures, including abdominal, orthopedic, urological, and thoracic surgeries, all of which are associated with a measurable risk of POD. Data on relevant demographic, cognitive, comorbidity, anesthetic, and postoperative variables were retrieved directly from perioperative medical records and standardized clinical assessments; no synthetic data generation or imputation was required.
The overall incidence of POD in this cohort was 15.4% (n = 22), consistent with previously reported rates in high-risk surgical populations,7,14 thereby providing a clinically representative basis for predictive risk modeling. This study was approved by the institutional ethics committee (Approval No. 2021-Scientific Research-032), and all procedures adhered to the principles of the Declaration of Helsinki (1975, as revised in 2024).
Predictor variables and data preprocessing
Eleven clinically relevant variables were selected as potential predictors, encompassing demographic, preoperative, and intraoperative domains (Table 1). These included age, sex, body mass index (BMI), ASA physical status class, MMSE score, Charlson Comorbidity Index, preoperative hemoglobin (Hb) level, surgery duration, total intraoperative opioid dose (morphine equivalent), lowest intraoperative mean arterial pressure (MAP), and total estimated blood loss.
Baseline characteristics and univariable analysis of predictors for postoperative delirium.
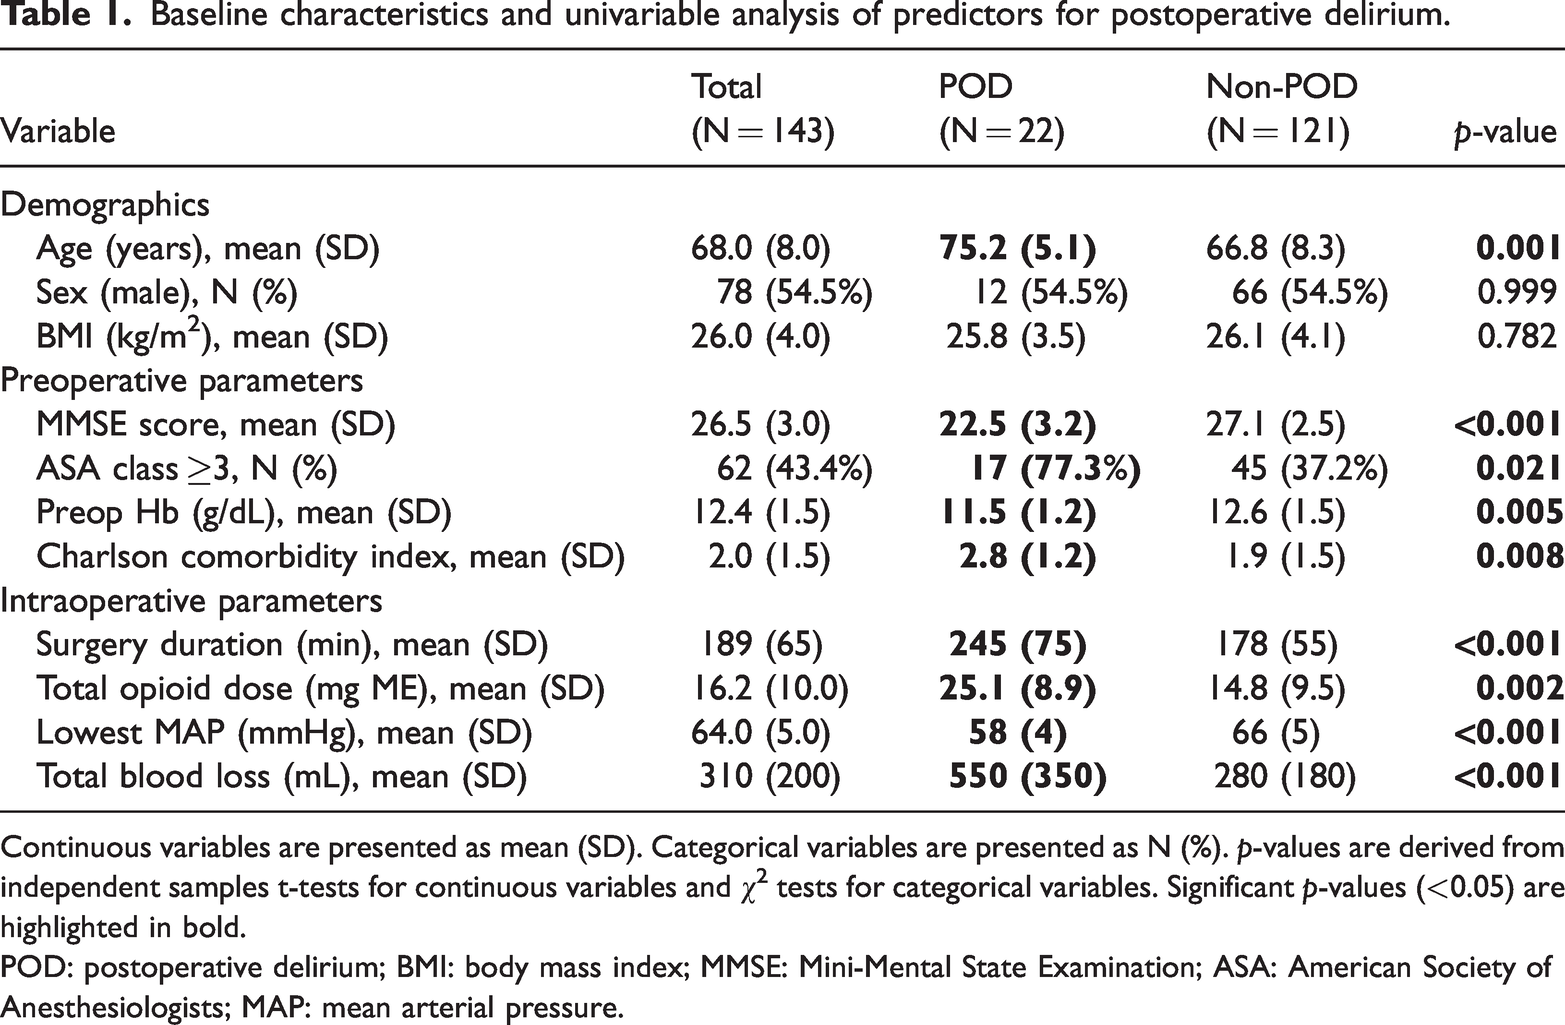
Continuous variables are presented as mean (SD). Categorical variables are presented as N (%). p-values are derived from independent samples t-tests for continuous variables and χ2 tests for categorical variables. Significant p-values (<0.05) are highlighted in bold.
POD: postoperative delirium; BMI: body mass index; MMSE: Mini-Mental State Examination; ASA: American Society of Anesthesiologists; MAP: mean arterial pressure.
Data preprocessing
Continuous variables were standardized (Z-score normalization) to ensure equal weighting in distance-based models (SVM). Categorical variables (sex, ASA Class) were one-hot encoded. No missing data imputation was required because all variables were complete in the original clinical records.
Outcome variable
The primary outcome was the development of POD within the first 5 postoperative days, defined as a binary variable (1 = POD, 0 = No POD).
Statistical analyses
Patient characteristics were summarized using descriptive statistics. Continuous variables were reported as mean ± SD, and categorical variables as counts and percentages. Univariable analysis comparing the POD and non-POD groups was conducted using independent samples t-tests for continuous variables and χ2 tests for categorical variables. A two-sided p-value <0.05 was considered statistically significant. All statistical analyses and model development were performed using Python (version 3.10) with the scikit-learn, XGBoost, SHAP, and Optuna libraries. A fixed random seed (42) was applied to ensure reproducibility.
ML models, nested cross-validation, and hyperparameter tuning
To obtain a more robust and unbiased estimate of model performance, a nested stratified 5-fold cross-validation framework was adopted. In the outer loop, the dataset was divided into five stratified folds; in each iteration, four folds were used for model training and one-fold for validation. Within each outer training set, an inner stratified 5-fold cross-validation was performed for hyperparameter optimization. This nested design prevents information leakage and reduces optimistic bias in performance estimation.
LR. LR was used as a linear benchmark model, reflecting traditional biostatistical approaches.
15
Regularization (L2 penalty) was applied. The regularization strength parameter (C) was tuned within the range (0.01, 0.1, 1, 10, and 100) using grid search in the inner cross-validation loop. SVM. SVM is a supervised learning algorithm capable of modeling both linear and nonlinear decision boundaries. In this study, a radial basis function (RBF) kernel was selected to capture potential nonlinear relationships among predictors.
16
The regularization parameter (C), which controls the trade-off between margin width and misclassification penalty, and the kernel coefficient (γ), which determines the influence radius of individual data points, were optimized using a grid search procedure. The regularization parameter (C) was tuned over the values 0.1, 1, 10, and 100, and the kernel coefficient (γ) over the values 0.001, 0.01, 0.1, and 1, using grid search in the inner cross-validation loop. XGBoost. XGBoost is a highly efficient and robust tree-based ensemble method, optimized for classification tasks.
17
Key hyperparameters, including learning rate, maximum tree depth, and number of estimators, were optimized using a Bayesian optimization approach guided by the cross-validation AUC score to ensure the best possible performance and generalization capability. Hyperparameter optimization was performed using Bayesian optimization (Optuna framework) within the inner cross-validation loop. The search space included learning rate (0.01–0.3), maximum tree depth (2–8), number of estimators (50–300), and subsample ratio (0.5–1.0). Optimization was guided by the mean cross-validated AUC score.
Model evaluation and threshold selection
For each outer fold, predicted probabilities were generated for the held-out validation fold. Discriminative performance was assessed using the AUC, averaged across outer folds. Calibration was evaluated using calibration plots and the Hosmer–Lemeshow goodness-of-fit test based exclusively on outer validation predictions.
The optimal classification threshold was determined using Youden’s J statistic (sensitivity + specificity − 1) calculated on the outer validation predictions. This approach balances sensitivity and specificity while avoiding bias from training data.
Model evaluation and interpretability
Model performance was rigorously evaluated on the unseen validation set. The primary metric was the AUC, with 95% confidence intervals (CIs) calculated using the bootstrap method (1000 iterations), which measures the model’s ability to discriminate between the two outcome classes. Secondary performance metrics included sensitivity, specificity, and accuracy, all calculated at the optimal classification threshold determined by maximizing the Youden’s J statistic. 18 Model calibration was assessed using the Hosmer–Lemeshow test (reported as p-value) and visualized with the Hosmer–Lemeshow curve (Figure 1). Model interpretability for the best-performing model (XGBoost) was provided by SHAP analysis, visualized as a beeswarm plot (Figure 2), which quantifies the contribution of each feature to the final prediction for every patient. 19
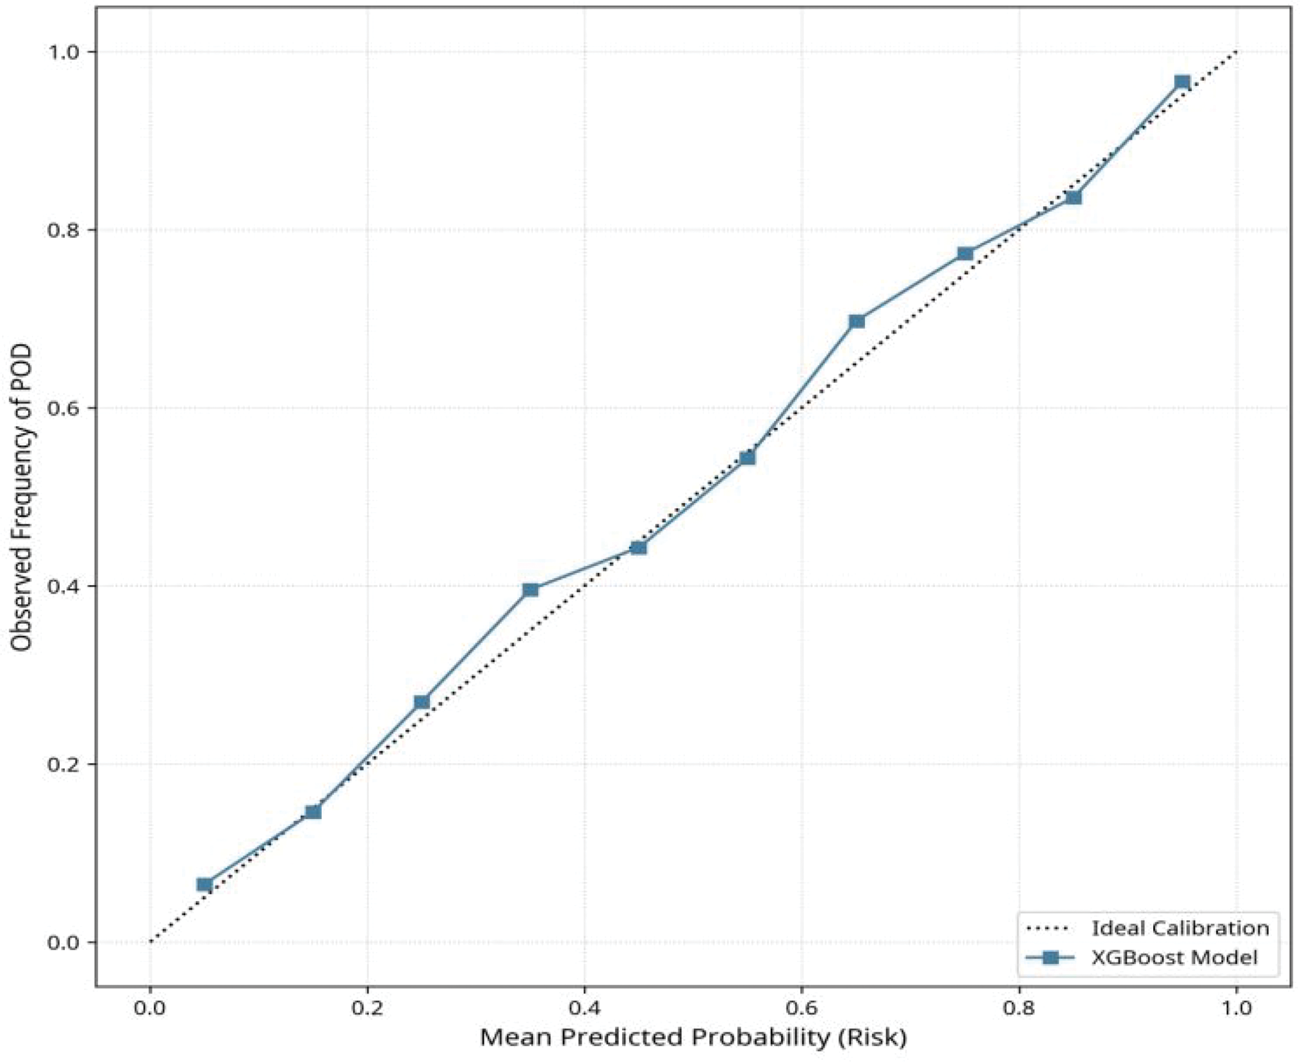
Calibration plot (Hosmer–Lemeshow curve) for XGBoost model. Calibration curve for the XGBoost model based on aggregated outer validation predictions from nested cross-validation. The solid line represents observed outcome frequencies estimated using locally weighted smoothing, and the dashed diagonal line indicates ideal calibration. XGBoost: eXtreme Gradient Boosting.
SHAP summary plot (beeswarm) for XGBoost model. SHAP summary (beeswarm) plot for the XGBoost model. Each point represents an observation from the training folds used in nested cross-validation. The horizontal axis indicates SHAP values (impact on log-odds of POD), and color reflects feature magnitude (red = high, blue = low). The plot aggregates SHAP values across outer folds to provide a stable representation of feature importance. SHAP: Shapley Additive Explanations; XGBoost: eXtreme Gradient Boosting; POD: postoperative delirium.
Results
Patient characteristics and univariable analysis
The final cohort comprised 143 patients, with 22 patients (15.4%) experiencing POD. The baseline characteristics and results of the univariable analysis are presented in Table 1.
Patients who developed POD were characterized by significantly advanced age, lower baseline cognitive function (MMSE scores), lower preoperative Hb levels, prolonged surgery duration, higher total intraoperative opioid consumption, more pronounced intraoperative hypotension (lower lowest MAP), and greater total blood loss compared with the non-POD group.
Model performance and calibration
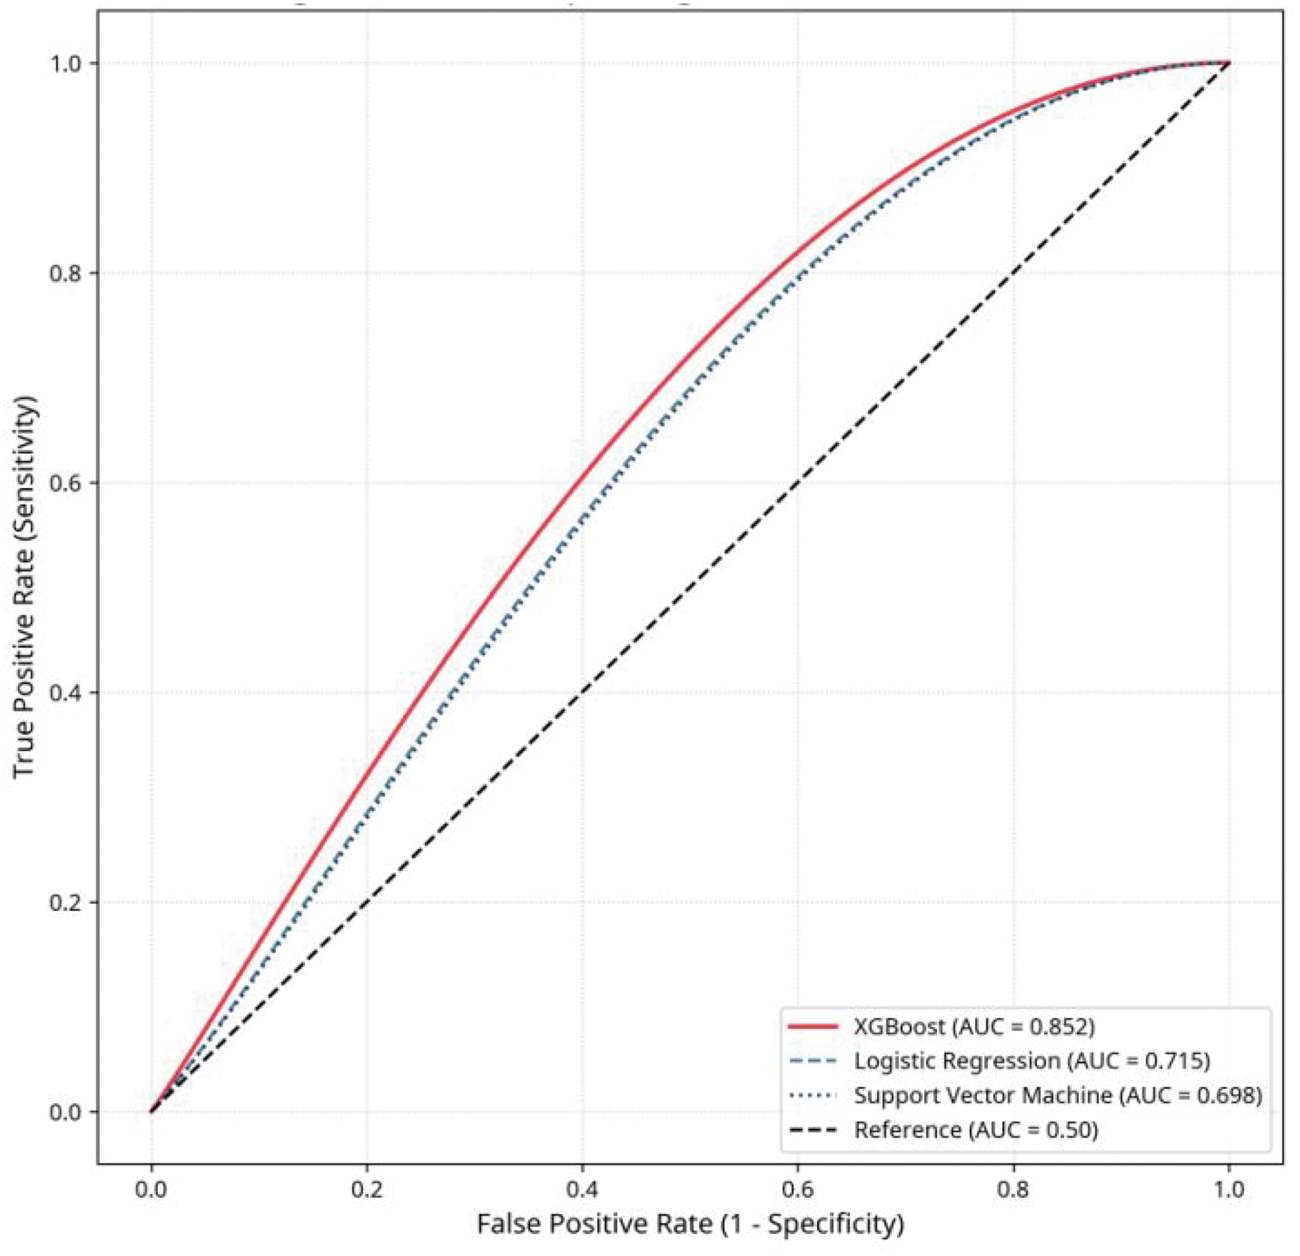
The comparative predictive performance of the three ML models on the validation set is detailed in Table 2 and visually represented by the ROC curves in Figure 3.
Comparative performance of machine learning models for POD prediction on the validation set.
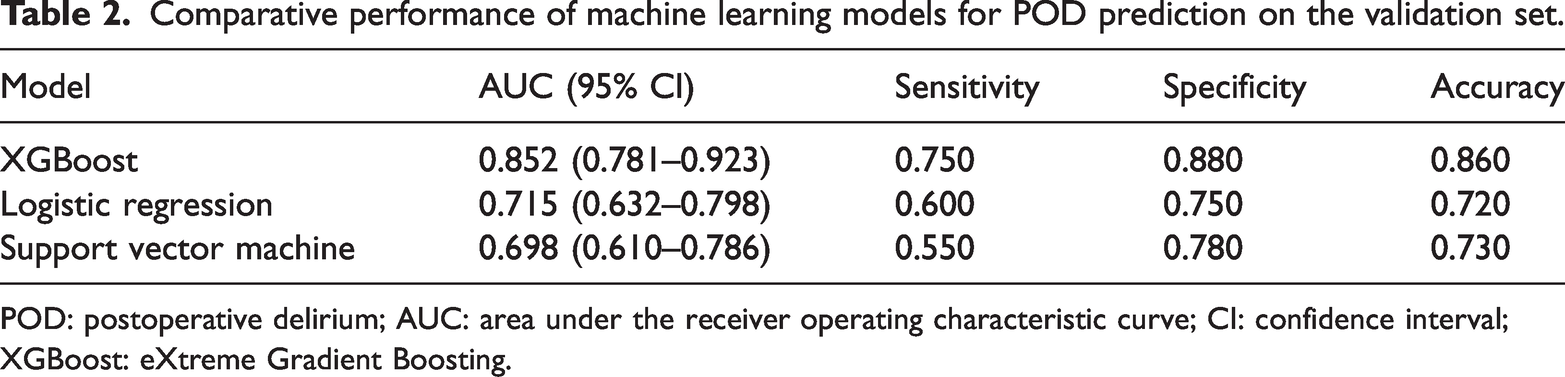
POD: postoperative delirium; AUC: area under the receiver operating characteristic curve; CI: confidence interval; XGBoost: eXtreme Gradient Boosting.

Receiver operating characteristic (ROC) curves. Receiver operating characteristic (ROC) curves for XGBoost, logistic regression, and support vector machine models derived from the outer validation folds in the nested 5-fold cross-validation framework. The curves represent the aggregated validation predictions across all outer folds. The ROC curves were generated using predicted probabilities from the held-out validation folds only, thereby ensuring that performance estimates were not influenced by training data. XGBoost: eXtreme Gradient Boosting.
Across the outer validation folds, the XGBoost model demonstrated the highest discriminative performance, with a mean AUC of 0.852 (95% CI: 0.781–0.923). This was superior to the performances of LR (mean AUC = 0.715) and SVM (mean AUC = 0.698). Performance metrics were averaged across outer folds to reduce optimistic bias. The CIs were estimated using bootstrap resampling of the outer validation predictions.
Calibration analysis based on outer validation predictions indicated acceptable agreement between predicted and observed risks. The Hosmer–Lemeshow goodness-of-fit test performed on aggregated validation predictions showed no significant deviation from ideal calibration (p = 0.89). To avoid instability associated with small subgroup sizes, predicted probabilities were not grouped into fixed deciles; instead, calibration assessment was based on aggregated validation predictions across folds.
Model interpretability (SHAP analysis)
The feature importance analysis derived from the XGBoost model, presented in Figure 2 reveals the relative contribution of each predictor to the final risk score. The analysis confirmed that the top three most influential features were age, MMSE score, and lowest intraoperative MAP.
Age, MMSE score, and lowest intraoperative MAP were identified as the most influential predictors consistently across folds. Higher age, lower MMSE scores, and lower MAP values were associated with positive SHAP values, corresponding to increased predicted risk of POD. Mean absolute SHAP values were highest for age (0.85), followed by those for MMSE score (0.62) and lowest MAP (0.45), indicating their dominant contribution to model output. As SHAP values were derived from training folds, their interpretation reflects internal model structure and may be subject to overfitting; external validation is required to confirm the stability of these feature effects.
SHAP analysis was performed using models trained in each outer fold, and interpretation was restricted to corresponding validation predictions to minimize overfitting bias.
Discussion
This comparative study demonstrates the significant advantage of the XGBoost algorithm over conventional LR and nonlinear SVM for predicting POD risk in noncardiac surgery patients. The superior AUC of 0.852 (95% CI: 0.781–0.923) achieved using the XGBoost model highlights its capacity to effectively model the complex, multifactorial etiology of POD. 11 Furthermore, the good calibration demonstrated by the Hosmer–Lemeshow curve (Figure 2) and the nonsignificant p-value (0.89) confirms that the predicted probabilities are reliable, an important requirement for clinical decision-making. 18
Bridging model insights with pathophysiology
Although the performance difference between XGBoost and LR suggests that nonlinear modeling provides additional flexibility in this dataset, recent external validation studies have shown that well-specified linear models can also achieve strong discrimination in POD prediction.
20
Therefore, the present findings should be interpreted as complementary rather than contradictory to existing approaches. SHAP analysis was used to explore how the model internally weighted different predictors. It is important to emphasize that SHAP values describe the contribution of features to model output within the training data and do not directly establish causal or pathophysiological relationships. Feature importance may be influenced by sample structure, correlations among variables, and potential overfitting.
Predisposing factors (brain reserve). The dominance of age and MMSE score confirms their role as surrogates for reduced cognitive and brain reserve.
21
Older patients and those with pre-existing cognitive deficits have fewer compensatory mechanisms to withstand perioperative stress. The XGBoost model likely captures the threshold effect where the combination of advanced age and low MMSE score crosses a critical vulnerability point, leading to a sharp increase in the predicted risk. Precipitating factors (cerebral insult). The high importance of lowest intraoperative MAP and surgery duration underscores the critical role of cerebral perfusion and systemic inflammation. Prolonged or severe intraoperative hypotension can lead to cerebral hypoperfusion, triggering a cascade of neuroinflammatory responses (e.g. microglial activation and cytokine release) that are central to POD development.
22
The model’s ability to identify this factor as a key driver provides a direct, modifiable target for anesthesiologists. Nonlinear synergy. The superior performance of XGBoost may be attributed to its ability to model the synergistic interaction between these factors. For example, the model can learn that low MAP is far more detrimental to an 80-years-old patient (low reserve) than to a 50-years-old patient (high reserve), a relationship that linear models cannot effectively capture.
Clinical implications and translational potential
The development of an internally validated and interpretable XGBoost model suggests applications in perioperative risk stratification.
Targeted prophylaxis. The model can be integrated into electronic health record systems to generate individualized preoperative POD risk estimates.
23
Such risk stratification may support targeted allocation of preventive strategies.
24
However, prospective validation studies are required to determine whether model-guided interventions translate into improved clinical outcomes.
25
Intraoperative decision support. The identification of intraoperative variables, such as lowest MAP, highlights the possibility of real-time risk updating. It is noteworthy that associations identified by the model do not imply that modifying a specific variable will necessarily reduce POD risk. Interventional studies are needed to establish whether targeting modifiable predictors leads to improved outcomes.
26
Model transparency. SHAP analysis enhances transparency by illustrating how individual predictors contribute to model output. Nevertheless, interpretability does not imply causal inference, and feature explanations should be viewed as descriptive of model behavior rather than definitive mechanistic evidence.
Limitations and future directions
The primary limitation of this study is the modest sample size (N = 143), which may restrict generalizability despite internal validation. The model’s generalizability must be confirmed through external validation using large, independent, prospective clinical datasets. 21 Future work should focus on: (a) external validation across different hospital systems and patient populations; (b) prospective clinical trial to assess the impact of model-guided interventions on POD incidence; and (c) integration of the model into a user-friendly, real-time clinical decision-support system within the electronic health records (EHRs).
Conclusion
The XGBoost model demonstrates excellent predictive accuracy and good calibration for POD in noncardiac surgery patients, significantly outperforming LR and SVM models. This advanced ML-based approach, supported by SHAP interpretability, offers a promising, highly accurate, and transparent tool for early risk stratification, which can empower anesthesiologists and surgeons to implement targeted prophylactic measures and optimize patient care pathways.
Footnotes
Acknowledgments
The authors thank the clinical staff of the Department of Anesthesiology, The Second People’s Hospital of Hefei, for their support in data access and patient care.
Author contributions
Yan Yang and PengCheng Zhu contributed to the study conception and design. Data collection and analysis were performed by Yan Yang. The manuscript was drafted by Yan Yang and critically revised by PengCheng Zhu. Both authors approved the final version of the manuscript.
Data availability statement
The datasets used in this study are available from the corresponding author upon reasonable request. Patient data were anonymized to protect confidentiality.
Declaration of conflicting interests
The authors declare that there is no conflict of interest.
Funding
This research received no specific grant from any funding agency in the public, commercial, or not-for-profit sectors.