
Abstract
Objective
To comprehensively examine hypertension- and heart failure–related mortality rates in the United States to develop a targeted approach to health policy development.
Methods
We analyzed death certificates from the Centers for Disease Control and Prevention Wide-Ranging Online Data for Epidemiologic Research database, focusing on mortality caused by hypertensive heart failure in adults aged ≥25 years from 2006 to 2020. Age-adjusted mortality rates per 1,000,000 and annual percent changes were calculated and categorized by year, sex, race, urban status, age group, and census region.
Results
A total of 268,545 deaths occurred due to hypertensive heart failure between 2006 and 2020. The overall age-adjusted mortality rates increased from 60.5 in 2006 to 134.9 in 2020. Males had higher age-adjusted mortality rates than women (76.6 vs. 73.8). Older-aged people exhibited significantly higher age-adjusted mortality rates than young and middle-aged adults. Age-adjusted mortality rates were highest in non-Hispanic Blacks/African Americans and lowest in non-Hispanic Asians/Pacific Islanders (126.8–43.6). Furthermore, age-adjusted mortality rates were highest in individuals from nonmetropolitan areas and the Western region.
Conclusion
Following a period of decline, the age-adjusted mortality rates increased until 2020. The highest age-adjusted mortality rates were observed in non-Hispanic Blacks and nonmetropolitan areas. An urgent restructuring of healthcare policy is needed to reduce heart failure-associated mortality.
Keywords
Introduction
Hypertension (HTN) remains the most prevalent modifiable health risk factor for cardiovascular (CV) disease and is the leading cause of death worldwide. Internationally, HTN contributes to more than 8.5 million deaths each year. 1 As of 2019, the number of deaths rose to 51,253 in the United States, with an annual percent increase of 1.3%.2,3 Concerningly, it remains the leading cause of mortality and accounts for upward of US$52 billion in annual health care costs. 4
Hypertensive heart disease (HHD) is among the most life-threatening end-organ complications of HTN. It accounts for approximately one-quarter of all heart failure (HF) cases. 5 This is critical because CV disease is a predominant cause of mortality in the US.
Previous studies have shown that risk factors such as HTN and diabetes mellitus (DM) result in a marked increase in HF mortality in both young and older adults. Interpreting the effects on mortality due to the coexistence of HF and HTN is crucial for tailoring treatment patterns and improving patient care. Recognition of race, sex, and region-associated fatality trends can facilitate the adoption of more targeted measures for high-risk populations. 6
Consequently, this study aimed to evaluate the mortality trends due to coexisting HF and HTN in individuals aged ≥25 years between 2006 and 2020.
Methodology
Study setting and population
This descriptive study used death certificate data extracted from the Centers for Disease Control and Prevention Wide-Ranging Online Data for Epidemiologic Research (CDC WONDER) database. Hypertensive HF–related mortality data from 2006 to 2020 were retrieved via codes from the International Statistical Classification of Diseases and Related Health Problems-10th Revision (ICD-10) as follows: I11.0. The same ICD codes have been used previously to identify hypertensive HF in administrative databases.7,8 The period from 2006 to 2020 was chosen to capture contemporary national trends across multiple ICD-10 coding eras and to allow assessment of the potential impact of recent public health changes up to the onset of the coronavirus disease 2019 (COVID-19) pandemic. Death certificates from all 50 states and the District of Columbia were included in this dataset. The Multiple Cause-of-Death Public Use record death certificates were studied to select hypertensive HF–related deaths, defined as deaths in which hypertensive HF was reported anywhere on the death certificate, either as a contributing or underlying cause of death. This study focused on adults aged ≥25 years at the time of the study. Previous studies have used a comparable age cutoff to describe adults.9,10 A deidentified, government-issued publicly available dataset was used in our study; hence, it was exempt from local institutional review board approval. The reporting of this study conformed to the Strengthening the Reporting of Observational Studies in Epidemiology (STROBE) guidelines.
Data abstraction
Data were extracted for population size, year, demographics, urban–rural classification, region, and age groups. The demographic variables included sex, age group, and race/ethnicity. Race/ethnicity was classified as Non-Hispanic (NH) White, NH Black or African American, Hispanic or Latino, and NH Asian or Pacific Islander. Age groups were categorized into young adults aged 25–44 years, middle-aged adults aged 45–64 years, and older adults aged 65–85 years and above. Individuals aged >85 years were excluded to maintain comparability with prior national analyses using similar age strata and to reduce potential distortion from small and heterogeneous death certificate data in the very elderly group. This information relies on reported data regarding death certificates and has also been used in previous analyses of the WONDER database. 11 The National Center for Health Statistics Urban–Rural Classification Scheme was used to assess the population of metropolitan (large metropolitan area (population >1 million), medium/small metropolitan area (population 50,000–999,999)) and nonmetropolitan (population <50,000) counties, as per the 2013 US census classification. 12 According to the US Census Bureau definitions, regions were classified into the Northeast, Midwest, South, and West. 13
Statistical analysis
Crude and age-adjusted mortality rates (AAMRs) with 95% confidence intervals (CIs) per 1,000,000 individuals from 2006 to 2020 were calculated to determine the trends in hypertensive HF–related mortality. Crude mortality rates were calculated by dividing the number of hypertensive HF–related deaths by the corresponding US population of that particular year. AAMRs required the standardization of hypertensive HF–related deaths to the year 2000 US population. 13 The primary outcome was the annual AAMR per 1,000,000 population due to hypertensive HF (ICD-10 I11.0). To determine the annual percent change (APC) with 95% CI in the AAMR, the Joinpoint Regression Program (Joinpoint version 4.9.0.0, National Cancer Institute) was used.14,15 Joinpoint regression was selected because it allows detection of significant inflection points in temporal trends rather than assuming a constant linear change. This method identifies significant changes in the AAMR over time by using log-linear regression models, where variation in time occurs. APCs were considered increasing or decreasing if the slope describing the change in mortality significantly differed from zero via two-tailed t tests. A P-value of ≤0.05 was considered statistically significant in our study.
Results
A total of 268,545 hypertensive HF–related deaths occurred between 2006 and 2020. Of these, 160,932 deaths occurred in women, whereas 107,613 occurred in men (Table 1). Because CDC WONDER is a publicly available population-level mortality database, there were no missing data for the key variables analyzed (age, sex, race, region, and urbanization); nevertheless, misclassification cannot be excluded.
Baseline characteristics.

Annual trends for hypertensive HF–related AAMR
The overall AAMR for hypertensive HF–related deaths in individuals aged ≥25 years was 60.5 in 2006. It declined to 57.4 in 2012 (APC: −0.9, 95% CI: −2.1 to 0.04) and was followed by an increase to 71.8 until 2016 (APC: 5.9, 95% CI: 4.2–8.2). After 2016, a significant increase was observed until 2020 (APC: 16.5, 95% CI: 15.7–17.9). The overall AAMR was 134.9 (95%: 133.5–136.3) at the end of the study period (Tables 2 and 3, Figure 1).
Annual percent change (APC) of hypertensive heart failure–related age-adjusted mortality rates per 1,000,000 in older adults in the United States, 2006 to 2020.
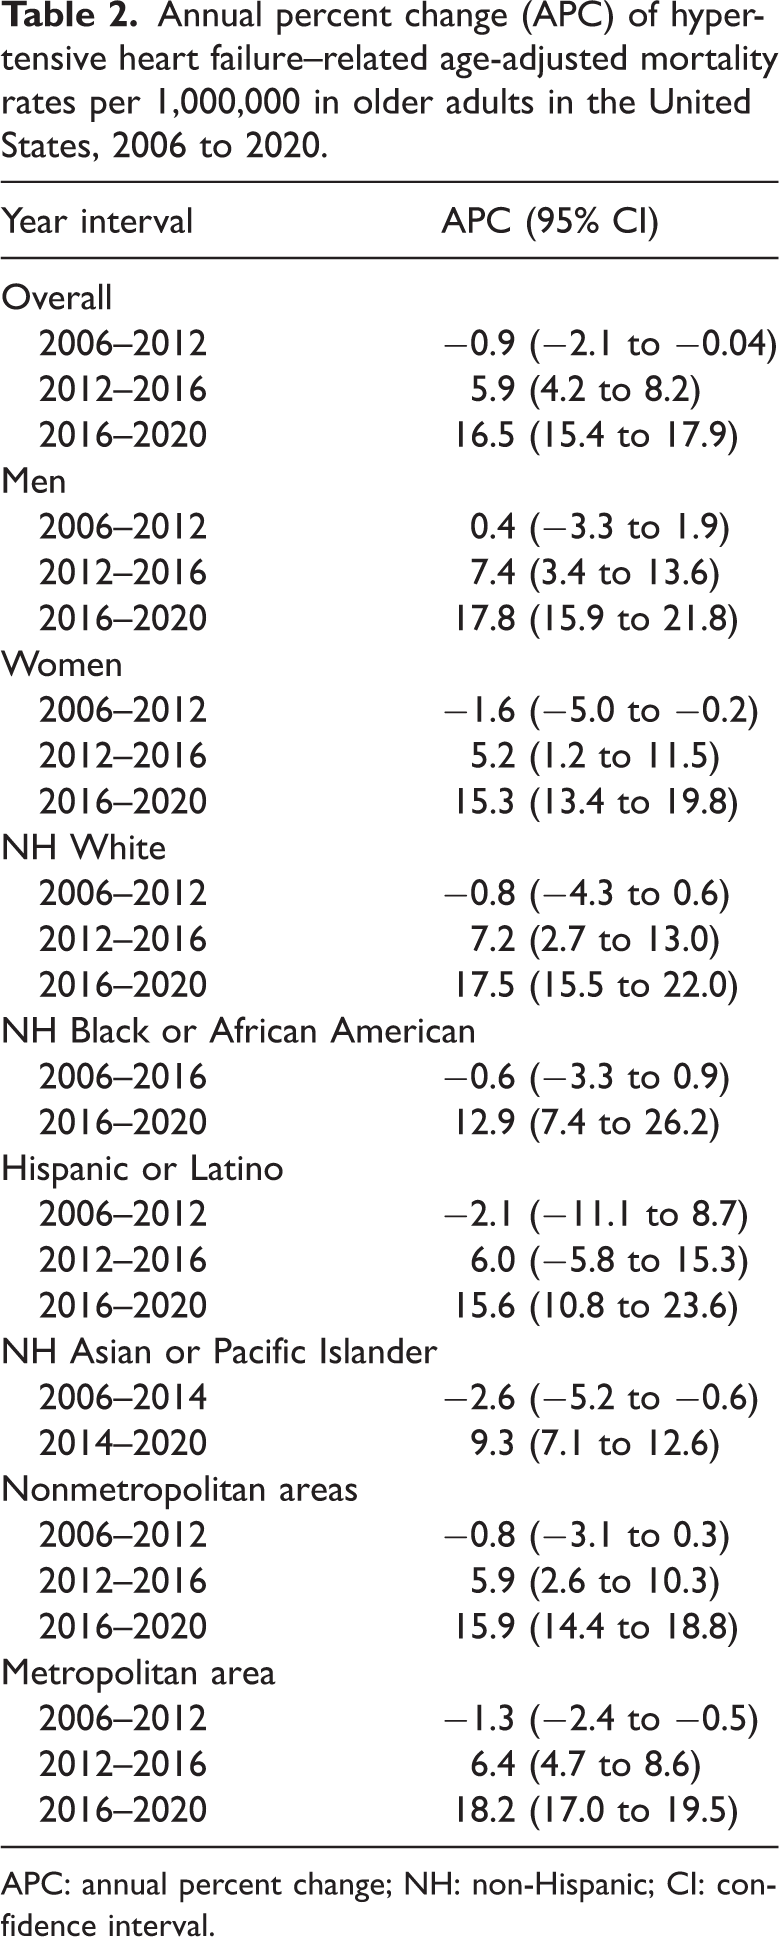
APC: annual percent change; NH: non-Hispanic; CI: confidence interval.
Overall and sex‐stratified hypertensive heart failure–related age-adjusted mortality rates per 1,000,000 in the United States, 2006 to 2020.

CI: confidence interval.

Overall and sex-stratified hypertension heart failure–related AAMR per 1,000,000 in the United States, 2006 to 2020. * Indicates that the APC is significantly different from zero at α = 0.05. AAMR: age-adjusted mortality rate; APC: annual percent change; CI: confidence interval.
Hypertensive HF–related AAMR stratified by sex
Overall, women exhibited higher AAMRs than men until 2006, while the trend reversed after 2012, with men having higher AAMRs than women (overall AAMR men: 76.6, 95% CI: 76.2–77.1; women: 73.8, 95% CI: 73.5–74.2). The AAMR of males was stable (APC: 0.40, 95% CI: −3.3 to 1.9), whereas that of women decreased until 2012 (APC: −1.6, 95% CI: −5.0 to −0.2). The AAMR of men and women steadily increased until 2016 (male APC: 7.4, 95% CI: 3.4–13.6; female APC: 5.2, 95% CI: 1.2–11.5), followed by a significant increase until 2020 (male APC: 17.8, 95% CI: 15.9–21.8; female APC: 15.3, 95% CI: 13.4–19.8) (Tables 2 and 3, Figure 1).
Hypertensive HF–related AAMR stratified by race/ethnicity
When stratified by race/ethnicity, AAMRs were highest among NH Black or African American patients, followed by NH White, Hispanic or Latino, and NH Asian or Pacific Islander populations (overall AAMR NH Black or African American: 126.8, 95% CI: 125.5–128.1; NH White: 72.2, 95% CI: 71.8–72.5; Hispanic or Latino: 62.1, 95% CI: 61.1–63.1; NH Asian or Pacific Islander: 43.6, 95% CI: 42.4–44.7). The AAMRs of NH White and Hispanic or Latino adults declined from 2006 to 2012. The AAMRs of NH Asian or Pacific Islander and NH Black or African American differed; they declined until 2014 and 2016, respectively. From 2016 onward, the AAMRs of all races/ethnicities significantly increased until the end of the study period (Tables 2 and 4, Figure 2).
Hypertensive heart failure–related age-adjusted mortality rates per 1,000,000 stratified by race in the United States, 2006 to 2020.

NH: non-Hispanic; CI: confidence interval.

Hypertensive heart failure–related AAMR per 1,000,000, stratified by race in the United States, 2006 to 2020. * Indicates that the APC is significantly different from zero at α = 0.05. AAMR: age-adjusted mortality rate; APC: annual percent change; CI: confidence interval.
Hypertensive HF–related AAMR stratified by age group
Older adults (65–85 years) exhibited significantly higher AAMRs than middle-aged (45–64 years) and young (25–44 years) adults. The AAMRs of young and middle-aged adults increased until 2016, followed by a significant increase until 2020. In contrast, the AAMRs of older adults decreased from 2006 to 2012 (APC: −1.31, 95% CI: −4.71 to −0.03), followed by an increase until 2016 (APC: 6.15, 95% CI: 2.23–11.88). By 2020, the AAMR had significantly increased to 607.6 (APC: 16.55, 95% CI: 14.78–20.31) (Tables 2 and 5, Figure 3).
Hypertensive heart failure–related age-adjusted mortality rates per 1,000,000, stratified by age groups in the United States, 2006 to 2020.
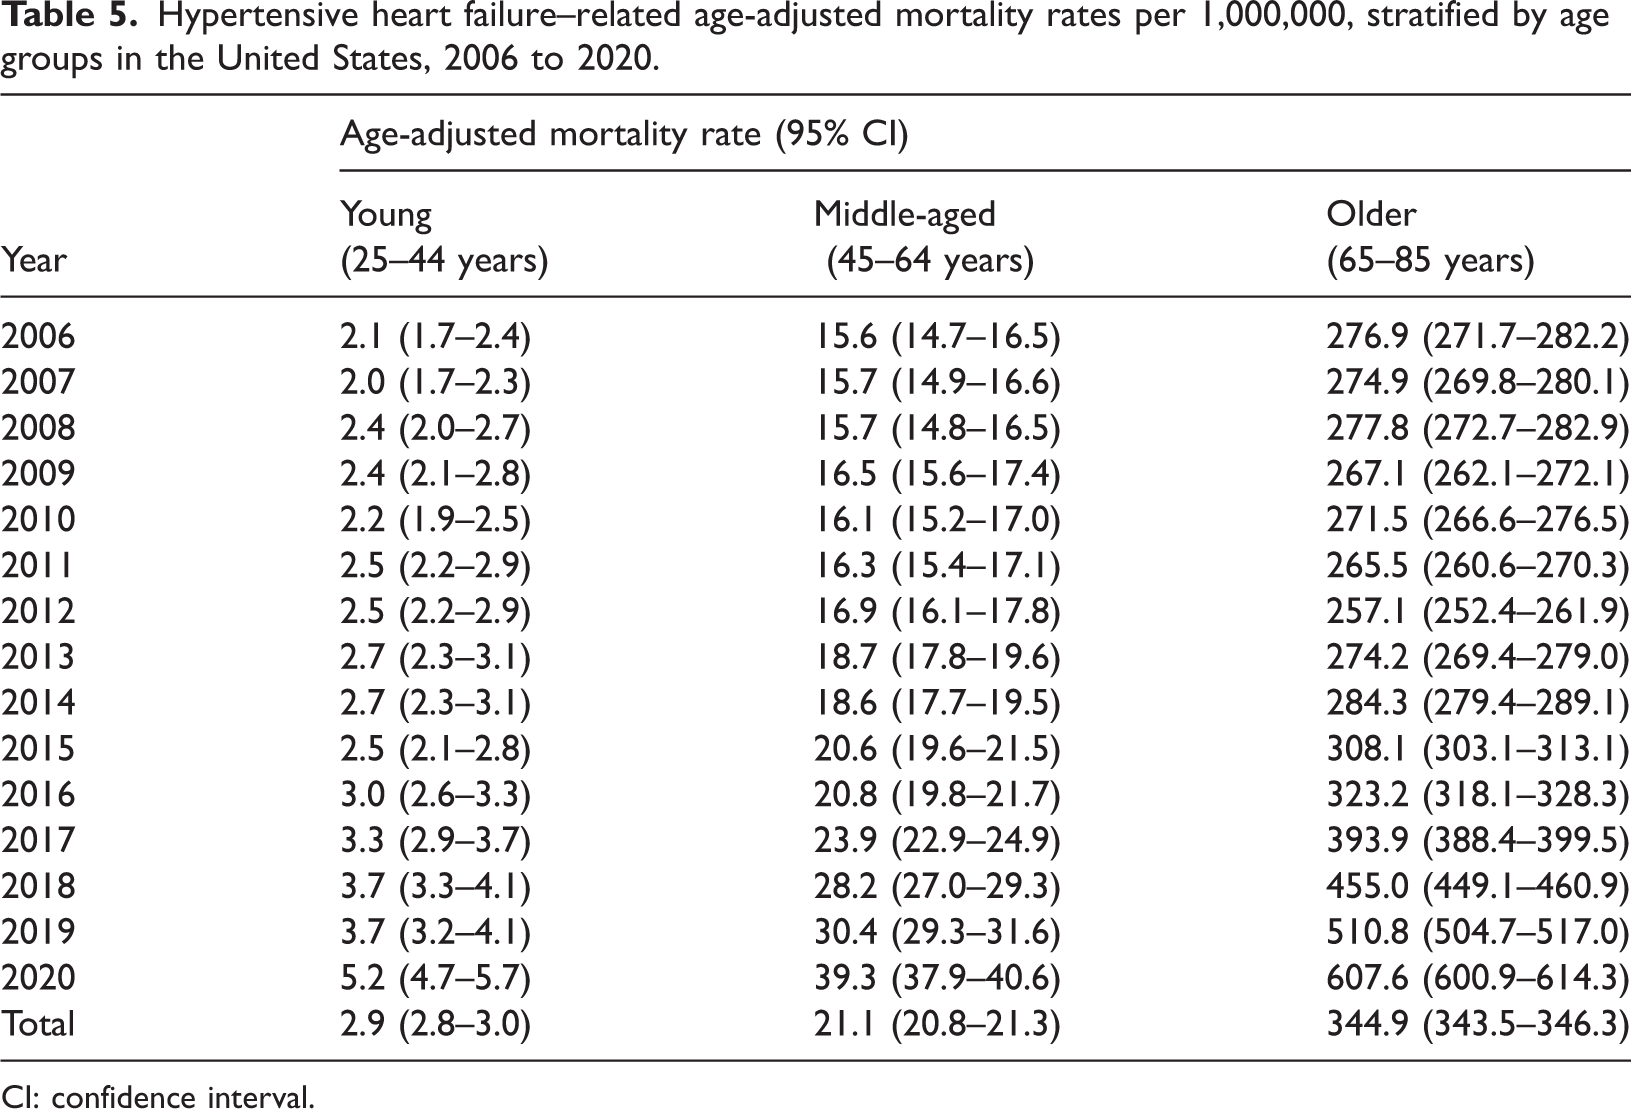
CI: confidence interval.
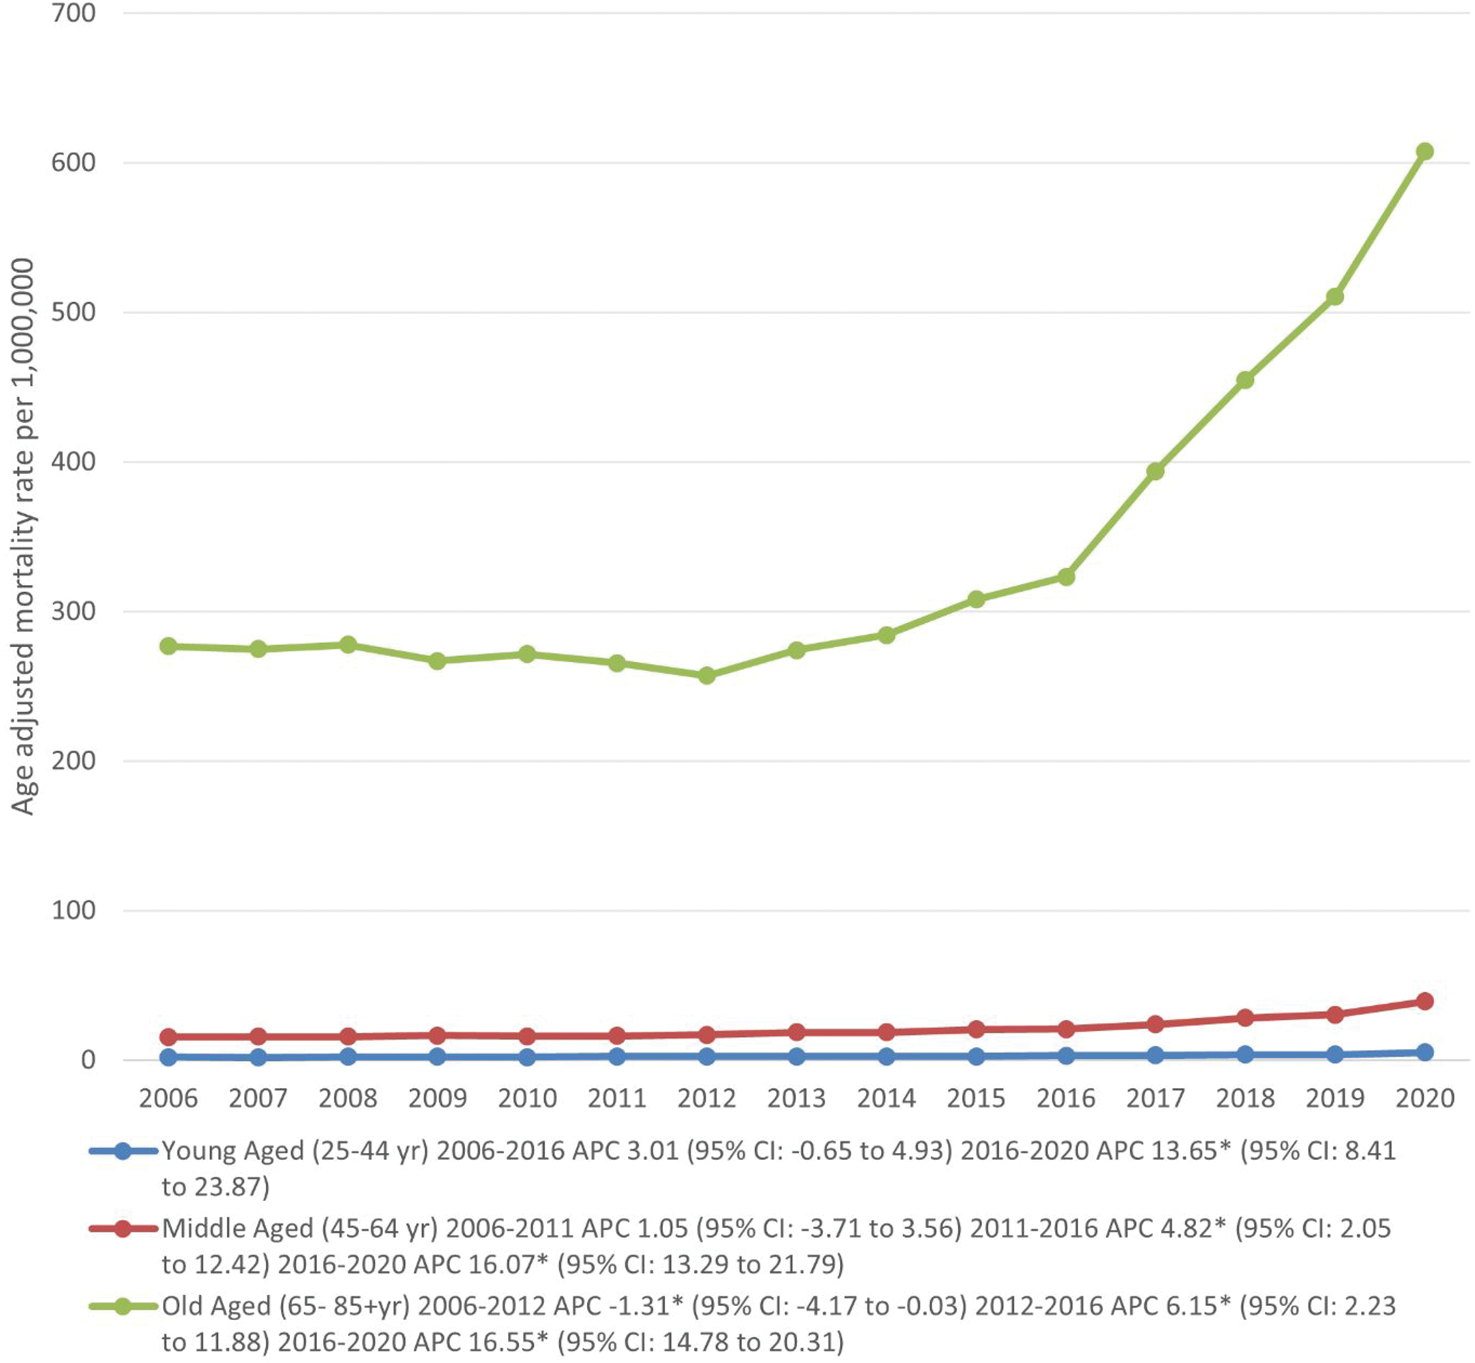
Hypertensive heart failure–related AAMR per 1,000,000, stratified by age groups in the United States, 2006 to 2020. * Indicates that the APC is significantly different from zero at α = 0.05. AAMR: age-adjusted mortality rate; APC: annual percent change; CI: confidence interval.
Hypertensive HF–related AAMR stratified by geographical region
Nonmetropolitan areas exhibited consistently higher hypertensive HF–related AAMRs than metropolitan areas throughout the study period, with overall AAMRs of 80.8 (95% CI: 80.1–81.6) in nonmetropolitan areas and 75.2 (95% CI: 74.9–75.5) in metropolitan areas. The AAMRs of individuals in nonmetropolitan areas declined from 2006 to 2012 (nonmetropolitan: APC: −1.3, 95% CI: −2.4 to −0.5), whereas those of individuals in metropolitan areas remained stable (metropolitan: APC: −0.8, 95% CI: −3.1 to 0.2). This was followed by a steady increase in the AAMRs of metropolitan and nonmetropolitan areas until 2016. From 2016 onward, a significant rise in AAMRs was observed until the end of the 2020 study period (nonmetropolitan: APC: 18.2, 95% CI: 17.0–19.5; metropolitan: APC: 15.9, 95% CI: 14.4–19.8) (Tables 2 and 6, Figure 4).
Hypertensive heart failure–related age-adjusted mortality rates per 1,000,000, stratified by urban–rural classification in the United States, 2006 to 2020.
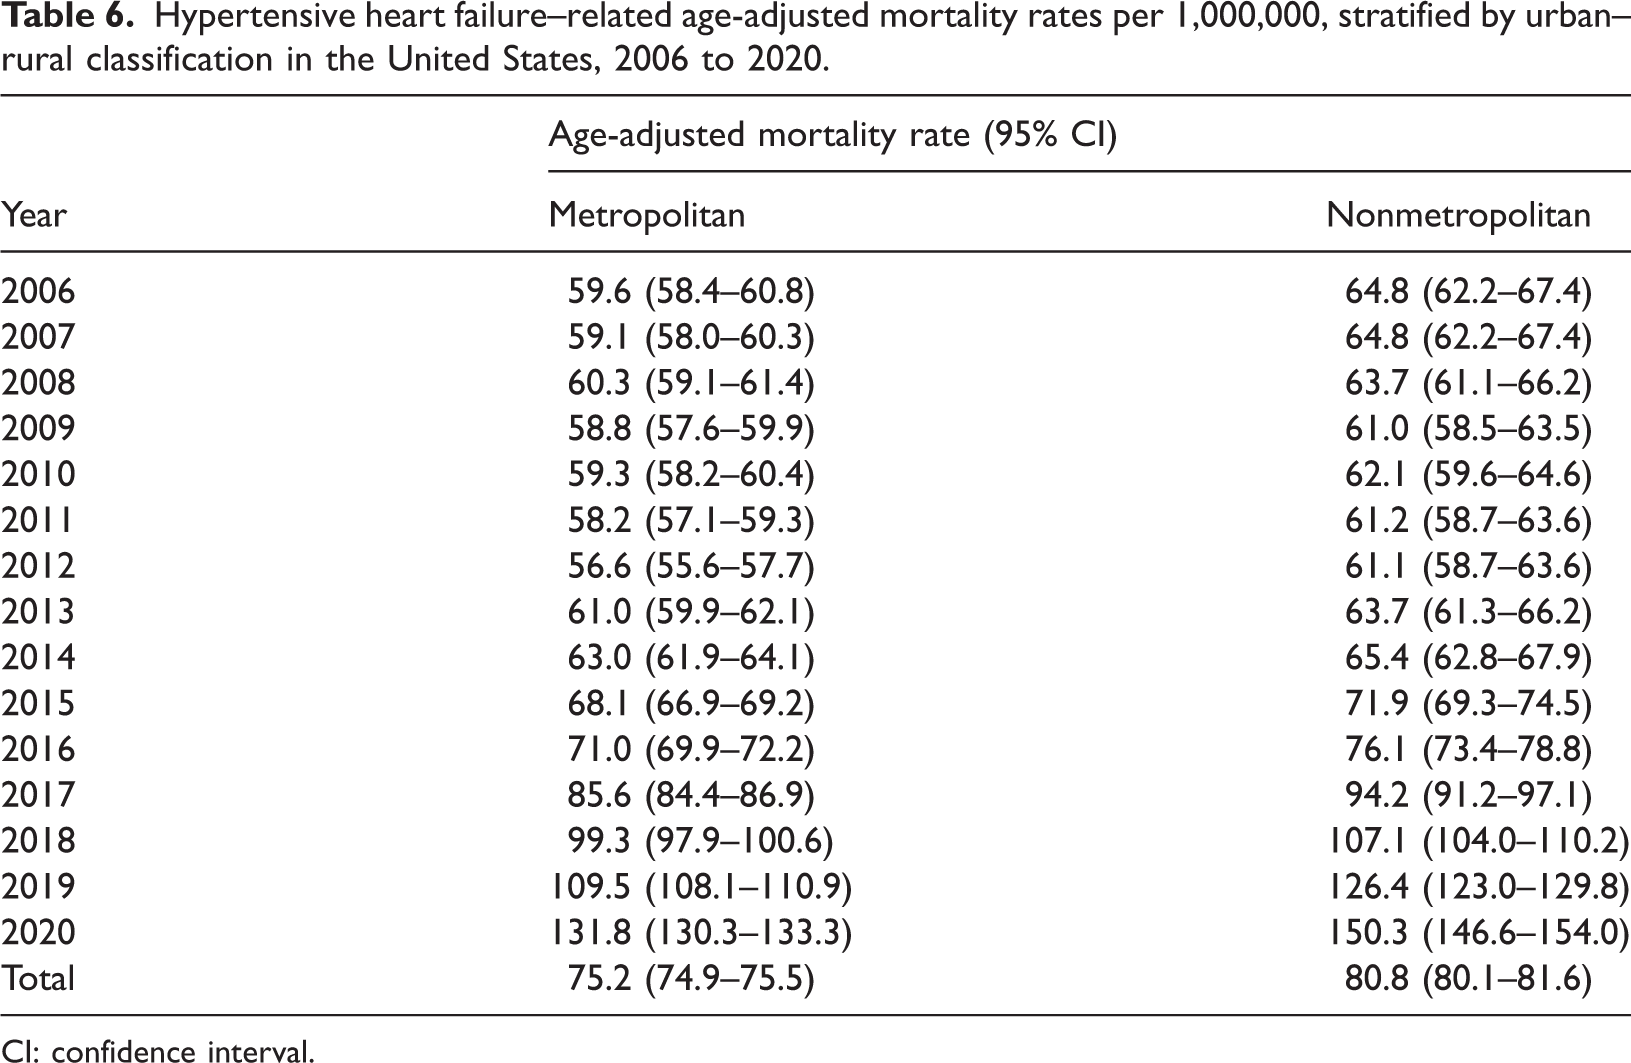
CI: confidence interval.

Hypertensive heart failure–related AAMR per 1,000,000, stratified by the urbanization groups in the United States, 2006 to 2020. * Indicates that the APC is significantly different from zero at α = 0.05. AAMR: age-adjusted mortality rate; APC: annual percent change; CI: confidence interval.
In the census regions during the study period, the highest mortality was observed in the Western region (AAMR: 87.4, 95% CI: 86.8–88.1), followed by the Southern (AAMR: 85.2, 95% CI: 84.7–85.7), Midwestern (AAMR: 68.1, 95% CI: 67.5–68.6), and Northeastern (AAMR: 56.2, 95% CI: 55.7–56.8) regions (Tables 2 and 7, Figure 5).
Hypertensive heart failure–related age-adjusted mortality rates per 1,000,000, stratified by the census region in the United States, 2006 to 2020.
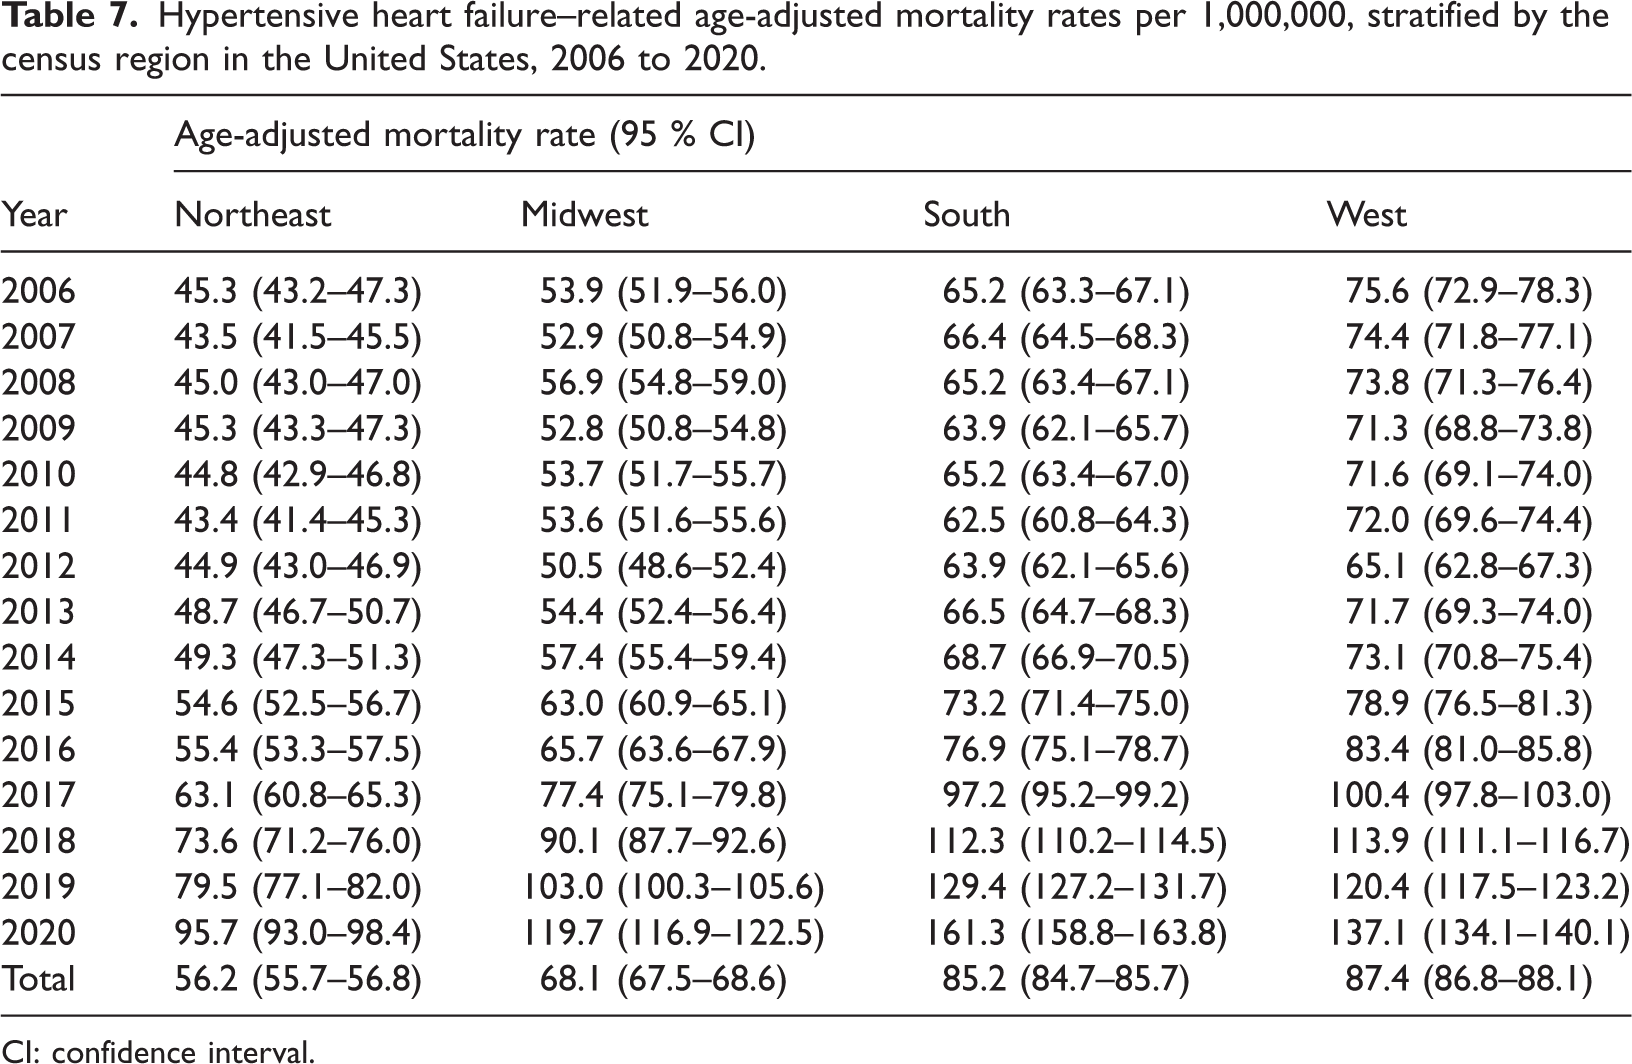
CI: confidence interval.

Hypertensive heart failure–related age-adjusted mortality rates per 1,000,000, stratified by census regions in the United States, 2006 to 2020.
The sharp rise in mortality observed in 2020 likely reflects, in part, the indirect and direct impacts of the COVID-19 pandemic, which disrupted routine HTN management and increased cardiovascular mortality nationwide.
Discussion
Our analysis of mortality rates for individuals aged ≥25 years from 2006 to 2020 revealed an increase in mortality across various demographic parameters, including sex, race, and geographical region. These results mirror those of another study reporting an increase in the mortality rates due to HHD in all race–sex groups.16,17 The sharp inflection in mortality trends observed after 2016 may reflect a combination of factors, including an aging population, plateauing HTN control rates, persistent obesity and diabetes prevalence, and potential shifts in death certification or coding practices.
Overall, in the initial years, women exhibited a higher mortality rate than men. In the later years of the study period, the trend shifted to men exhibiting worse outcomes, with higher mortality rates. As shown in Table 1, men and women exhibited significant increases in AAMRs. The general trends for both groups, however, remained the same. Men usually have more risk factors for HHD, which explains the increasing mortality rates. 18 These methods range from tobacco use, alcohol consumption, and insulin insensitivity to a hesitation toward presenting to healthcare facilities, with notably lower hospital admission rates. 16 A previous US-based study showed that factors such as cultural perceptions of masculinity and health literacy are linked to a reluctance to seek healthcare. 19 However, the lower mortality rates in women can be attributed to the fact that estrogen provides a protective effect in premenopausal women against CV diseases and HTN. 20 Moreover, women pay greater attention to their health and hypertensive status. A study revealed that 85% of women recognized their hypertensive status, whereas 80% of men were not aware that they had HTN. 21
Another study showed that the increase in mortality rates among men can be explained by a lack of awareness regarding hypertensive status among young adults and working-age adults, resulting in delayed diagnosis and limited access to HTN treatment. Given that it is a chronic condition and has long-term consequences, a contributing factor may be negligence in attending regular physical check-ups and seeking healthcare services. 22
Interestingly, among individuals aged ≤45 years, men have a greater incidence of HTN than women. However, this trend reverses in older age groups, with a greater percentage of hypertensive patients being women older than 45 years. These changes are attributed to the onset of menopause and, specifically, to a decrease in estrogen levels. 23 Reduced estrogen levels increase susceptibility to endothelial damage and promote atherosclerotic plaque formation, leading to a loss of elasticity and stiffening of the vessel walls. Collectively, these changes result in elevated blood pressure. 24
Endothelial dysfunction also increases sympathetic nerve activity, which, in turn, activates the renin–angiotensin II system. The combined effect of endothelial dysfunction and angiotensin can cause oxidative stress, ultimately resulting in HTN. 25 Additionally, declining estrogen levels in postmenopausal women are associated with a greater risk of developing left ventricular hypertrophy (LVH). 26 Women are also less responsive to standard treatment options than men. 27 This phenomenon has been linked to the poorly understood role of differences in genetic profiles and hormonal effects on drug metabolism. 28
Our study also revealed a significant disparity in mortality rates among different races. AAMRs were highest among NH Black/African American adults, intermediate among NH White and Hispanic/Latino adults, and lowest among NH Asian/Pacific Islander adults. Although these results are consistent with those of other studies and highlight critical inequities, they do not establish causality, and the underlying mechanisms are likely multifactorial, involving a complex interplay of structural, social, and biological factors.16,23 African Americans are more likely to be afflicted by poverty, unemployment, lower rates of health insurance, and lower levels of education. These are some of the factors underlying the differences in mortality rates. 29 Furthermore, although substantial amounts of blood pressure medications are prescribed in the US, only a subset of patients adhere to their physician's directives, with decreased adherence among Black adults. 30 Notably, risk factors such as obesity, DM, and HTN remain more prevalent in Black Americans, with their rate of disease control also being lower than that of White Americans. This race difference may be due to their DNA, which involves genes such as SCNN1B, ARMC5, and GRK4. These genes are significantly involved in the renin–angiotensin aldosterone system (RAAS) and are implicated in increasing hypertensive risk among the Black population. 31 Recent national data also show that from 2011 to 2018, HTN awareness, treatment, and control declined in the US, with Black, Hispanic, and Asian adults experiencing persistently lower blood pressure control than White adults and group-specific gaps in awareness and treatment along the HTN care cascade. 32 Such disparities in awareness, treatment intensity, and adherence likely exacerbate the racial differences in hypertensive HF mortality observed in our study. A recent review of clinical trials revealed that African Americans constitute only 4% of the study population, indicating a lack of racial representation. This underrepresentation contributes to the results, subsequent healthcare policy-making, and drug optimization strategies that may not adequately address the needs of Black patients. The odds of medication nonadherence increased by 94% among individuals experiencing discrimination, highlighting a critical link between social stigma and health behaviors. 33 The intermediate mortality rate observed in the Hispanic or Latino population may be influenced by factors such as the “Hispanic paradox,” where favorable outcomes in some health metrics coexist with significant barriers to care, including language differences, immigration status, and limited access to preventive services. 34 For the NH Asian or Pacific Islander population, who had the lowest AAMR in our study, aggregation of diverse subgroups can mask significant health disparities within this heterogenous category. Furthermore, cultural factors, health literacy in non-native languages, and structural barriers can delay diagnosis and treatment for all non-White groups, even if the magnitude of disparity varies. 35 Therefore, although the burden is most acute for NH African Americans, a broader view of systemic inequities is warranted to fully understand the mortality patterns observed in all racial and ethnic minorities.
Our study also demonstrated a difference in mortality rates based on geographical distribution. The observed regional disparities, with the highest mortality rates in the West and South, may be influenced by several factors. These regions have been documented to have higher prevalence rates of cardiovascular risk factors, such as obesity and diabetes, and lower rates of HTN control compared with those in the Northeast and Midwest. Furthermore, structural factors including varying levels of healthcare access, Medicaid expansion status, and the distribution of primary care providers and cardiology specialists across census regions likely contribute to these geographical mortality gradients. 36 Additionally, the literature corroborates our findings, with increased mortality rates in nonmetropolitan areas compared with those in metropolitan areas. 37 This rural versus urban disparity in healthcare outcomes is not uncommon. A study from China reported similar results, with higher levels of AAMR in rural populations. This can be attributed to decreased health-related awareness and fewer treatment options in rural populations. There are only a few tertiary care institutes, and cardiac specialists are not readily available.38–40 This situation is further aggravated by the fact that large numbers of rural dwellers are uninsured. 41 Furthermore, there is a delay in adopting preventive and curative treatment strategies in rural areas for reasons similar to those cited above.42,43
In the age strata, our study indicated a significant difference in mortality rates among young, middle-aged, and older populations, with older people having the highest mortality rates and young people having the lowest rates. There are multiple reasons for this phenomenon. Older individuals are at increased risk of developing dyslipidemia, glucose intolerance, and LVH. This increases the risk of further adverse coronary events, leading to mortality. 44 Similarly, LVH has been shown to increase the risk of atherosclerotic coronary events in older people threefold. 45 Older adults also suffer from orthostatic hypotension, which is associated with an increased number of falls and increased mortality rates among older people. Additionally, COVID-19 has a significant impact on the mortality rates of older individuals. This can be explained by the fact that older individuals with COVID-19 are more vulnerable to the adverse effects of comorbid HTN. This vulnerability was partly due to end-organ damage caused by chronic HTN and, in part, due to cellular aging, which in turn led to a decline in respiratory, immune, and vascular functions in older individuals. 46 Recently, there has also been an increase in the mortality rates among middle-aged individuals, which can be explained by the fact that people of working age have limited healthcare engagement. 8 Another study predicted that mortality among individuals aged ≥55 years may further increase in the next 30 years; however, this can largely be attributed to the increase in population size of this age group. 47
Future interventions
These findings highlight the need for utilizing resources and encouraging clinicians, public health professionals, and policymakers in counties across the country to emphasize the prevention, detection, and control of HTN, along with coordinated efforts at the national, state, and local levels. 48
Primary prophylaxis, organization, and data analysis for the prevention of heart disease in high-risk areas should be conducted in parallel with the regions with better conditions. Similar efforts have been made in the UK, and a strategy involving increased screening for heart disease has been revealed, directed toward the highest-risk individuals. 16
Health education initiatives have made remarkable progress in the handling and knowledge of HTN. Consequently, these programs should be supported and improved. 49
Transit care through home visits by trained nurses has improved recovery among individuals. 50 Moreover, fixed-dose combinations can be used but are underutilized. Improved telehealth opportunities have also resulted in favorable health-related outcomes in individuals. Initiatives such as the Barbershop Initiative, Surgeon General's Call to Action to Control Hypertension (Call to Action), and the Million Hearts Initiative have led to measurable reductions in mortality associated with heart disease and HTN among high-risk groups such as the Black community. Similar evidence-based approaches that can be tailored and expanded to diverse settings across the US. 8
Limitations
This study has several limitations. First, most importantly, there may be unintended records of HTN and HF as the cause of death due to the dependence on death certificates and ICD codes. 6 A change in physician reporting patterns or coding emphasis for HHD could also partly explain the observed inflection in mortality trends after 2016. Second, clinical variables such as the ejection fraction, vital signs, and laboratory findings that are important for assessing disease severity and progression are not available in this database. Similarly, there are no accessible data on the use of HF treatment or any medical interventions in the listed cases. 22 Finally, conditions that could lead to death in patients with HF, such as atrial fibrillation and cardiomyopathy, were not included in the database.
Conclusion
Mortality trends among individuals aged ≥25 years demonstrated an initial period of decline, which was followed by a surge until 2016. Subsequently, a significant increase was observed in the mortality rates until 2020. The highest mortality rates were observed in NH African Americans and nonmetropolitan areas in specific age strata. These factors are associated with several modifiable and nonmodifiable risk factors. With a considerable margin for reducing morbidity and mortality, this study highlights the growing need for reforms in the preventive approach to hypertensive HF.
Footnotes
Author contributions
MF conceptualized the study and wrote the primary manuscript. PS and SMH framed the study methodology and wrote the primary manuscript. AZ and MAH collected data and wrote the primary manuscript. MM, ARF, FNA, and FL analyzed and interpreted the data and wrote the primary manuscript. RM and AD supervised the project and wrote the final manuscript. All authors read and approved the final manuscript.
Consent to participate
Informed consent for this study is not applicable, as this research involves the use of secondary deidentified data from publicly available governmental databases.
Consent for publication
Not applicable.
Data availability statement
All the data generated or analyzed during this study are included in this article.
Declaration of conflicting interests
The authors declare that they have no conflicts of interest.
Ethical considerations
Ethics approval for this study is not applicable, as this research involves the use of secondary deidentified data from publicly available governmental databases.
Funding
There is no external source of funding or sponsorship.