
Abstract
Objective
Acute myocardial infarction is a leading cause of global mortality. Early detection and accurate risk stratification in patients with stable angina pectoris are crucial for improving clinical outcomes. This study aimed to identify novel lipid biomarkers for predicting the risk of acute myocardial infarction in patients with stable angina pectoris using nontargeted lipidomics.
Methods
This cross-sectional study enrolled 260 participants (40 non-cardiovascular disease controls, 180 patients with stable angina pectoris, and 40 patients with acute myocardial infarction) from August 2022 to December 2023. Plasma samples were analyzed via nontargeted lipidomics. Orthogonal partial least squares discriminant analysis was used to assess the differences in lipid profiles between the three groups. Random forest regression was used to identify key lipid metabolites. Independent associations between selected variables and the risks of cardiovascular disease and acute myocardial infarction were assessed using stepwise multivariate logistic regression. Model performance was evaluated using receiver operating characteristic curves.
Results
Lipidomic analysis identified two specific phosphatidylethanolamine species, phosphatidylethanolamine(37:4) and phosphatidylethanolamine(17:0/20:4), as progressively elevated from non-cardiovascular disease controls to patients with stable angina pectoris and further to patients with acute myocardial infarction. Notably, in the multivariate models, phosphatidylethanolamine(17:0/20:4) emerged as an independent predictor of acute myocardial infarction risk in patients with stable angina pectoris (odds ratio = 3.13, 95% confidence interval: 1.33–7.38), while phosphatidylethanolamine(37:4) was independently associated with the overall cardiovascular disease risk (odds ratio = 4.01, 95% confidence interval: 1.30–12.38). Integrating these phosphatidylethanolamine species with conventional clinical parameters significantly improved the predictive accuracy for the risks of cardiovascular disease (area under the curve = 0.93) and acute myocardial infarction (area under the curve = 0.88).
Conclusion
This study demonstrates the potential of nontargeted lipidomics in discovering novel lipid biomarkers for predicting acute myocardial infarction risk in patients with stable angina pectoris. The identified phosphatidylethanolamine species provide a basis for improving cardiovascular risk stratification and may serve as targets for future therapeutic interventions.
Keywords
Introduction
Cardiovascular disease (CVD), the leading cause of global mortality, is responsible for a significant proportion of deaths worldwide. 1 Among CVD manifestations, acute myocardial infarction (AMI) is a particularly devastating condition associated with high morbidity and mortality, causing an estimated 9 million CVD-related deaths annually. 2 The high incidence and acute nature of AMI underscore the need for effective early detection and risk stratification strategies. Current clinical approaches for assessing myocardial infarction (MI) risk, such as electrocardiography, 3 cardiac enzyme assays, and traditional risk scores, 4 have certain limitations in providing early and personalized predictions. These methods may not detect early-stage MI, and conventional risk scores often do not fully capture the complexity of AMI pathogenesis. Therefore, more sensitive and specific biomarkers are urgently needed for earlier and more accurate AMI risk assessment. In response, researchers in this field are actively exploring novel indicators beyond traditional risk scores—including genetic predictors and electrolyte balances such as the urinary sodium–potassium ratio 5 —in addition to in-depth metabolic profiling, which is the focus of our study.
Stable angina pectoris (SAP) is a common manifestation of CVD, characterized by chest pain or discomfort due to myocardial ischemia, significantly affecting the quality of life and daily activities of many individuals. 6 Importantly, patients with SAP are at increased risk of progression to AMI; however, predicting this progression can be challenging.7,8 Unfortunately, current clinical tools and risk scores often fail to accurately identify patients with SAP at the greatest risk of AMI progression. This emphasizes the urgency to identify novel predictive biomarkers, particularly in patients with SAP, to facilitate earlier interventions and improve clinical outcomes.
Lipid metabolism plays a crucial role in the pathogenesis of CVD, including both SAP and AMI. 9 Traditional lipid measurements, such as total cholesterol, low-density lipoprotein cholesterol, and triglyceride levels, although clinically relevant, are insufficient for predicting the AMI risk in all individuals.10,11 Furthermore, the intricate nature of lipid metabolism warrants a more in-depth investigation into specific lipid classes and their associated metabolic pathways.12–14 Alterations in certain lipid classes have been linked to various cardiovascular conditions, and further studies of these lipid species may provide novel insights into the mechanisms of disease progression and aid in the identification of biomarkers for risk prediction.15,16
Nontargeted lipidomics, a high-throughput analytical approach, provides a comprehensive analysis of lipid molecules in biological samples.17,18 Compared with targeted approaches, nontargeted lipidomics offers a significant advantage in discovering novel biomarkers associated with diseases, such as potential risk indicators related to SAP and AMI. 19 This method allows for the identification of novel biomarkers that traditional methods might overlook, thereby contributing to a more complete understanding of the lipid landscape in the context of disease progression. 20 This study aimed to utilize nontargeted lipidomics to identify potential lipid biomarkers for predicting the risk of MI in patients with SAP. By analyzing lipid profiles in healthy individuals, patients with SAP, and patients with AMI, we sought to discover specific lipid molecules that are significantly associated with the progression from SAP to AMI. Our findings may provide a crucial tool for improving personalized risk prediction for AMI in patients with SAP, potentially facilitating the development of targeted therapies and interventions with substantial clinical significance.
Materials and methods
Participants
This study utilized a cross-sectional design to investigate the lipidomic profiles of patients with SAP and AMI, alongside those of non-CVD controls (NCs). From August 2022 to December 2023, patients with SAP (n = 180) and AMI (n = 40) were consecutively recruited from the Department of Cardiology ward and emergency room at the Affiliated Hospital of Nanjing University of Chinese Medicine. Patients with AMI were diagnosed based on the presence of chest pain lasting longer than 30 min, typical elevations in circulating biochemical markers including troponin-I and creatine kinase-MB (CK-MB)/creatine phosphokinase, ischemic symptoms lasting ≥30 min, and ST-segment elevation of ≥2.0 mm in two or more typical electrocardiogram leads. SAP was defined as the presence of chest pain in patients at rest or during exertion, without progression in the preceding 6 months. All patients with AMI were hospitalized within 12 h of symptom onset. NCs (n = 40), matched for age and sex with the patient groups, were unrelated individuals with no family history of cardiovascular disease, no detectable cardiovascular risk factors, and no current medication use; they were recruited from the Danyang Cohort 21 in Jiangsu Province, China.
Data collection
Data on sociodemographic characteristics, smoking and alcohol consumption habits, and personal medical history were collected from all enrolled participants using standardized questionnaires. Body mass index (BMI) and waist circumference (measured midway between the lowest rib and iliac crest) were measured for all participants. Blood pressure (BP) was measured using a digital monitor (Omron, Japan) after a 5-min rest period. Hypertension was defined as a systolic BP (SBP) >140 mmHg, diastolic BP (DBP) >90 mmHg, or current use of antihypertensive medication. 22 Diabetes was defined as a fasting blood glucose (FBG) level >7.0 mmol/L or current use of antidiabetic medication. 23 All patient-related data were fully deidentified prior to analysis to protect patient confidentiality.
Blood sample collection and processing
Fasting blood samples were collected from all participants within 12 h of admission. Blood samples were processed to obtain plasma for lipidomic analysis and serum for biochemical parameter measurements. Serum assays included whole blood cell count, platelet count, serum triglyceride (TG), total cholesterol (TC), low-density lipoprotein cholesterol (LDL-C), high-density lipoprotein cholesterol (HDL-C), aspartate transaminase (AST), alanine transaminase (ALT), blood urea nitrogen (BUN), uric acid (UA), FBG, and glycated hemoglobin (HbA1c). All biochemical assays were performed by the Clinical Laboratory Department of the Affiliated Hospital of Nanjing University of Chinese Medicine. Plasma samples for lipidomics analysis were stored at −80°C until further processing.
Nontargeted lipidomics analysis
Lipids were extracted from 60 μL of plasma samples using a modified methyl tert-butyl ether (MTBE) method. Briefly, 340 μL of water and 960 μL of extraction solution (MTBE:methanol = 5:1, v/v) were added to each 60-μL plasma sample. The mixture was then vortexed, sonicated, and centrifuged. An aliquot (500 μL) of the supernatant was collected. The remaining sample was then re-extracted twice, each time with 500 μL of MTBE. The combined supernatants were vacuum-dried, reconstituted, and centrifuged. The final supernatant was used for liquid chromatography–mass spectrometry (LC–MS) analysis, and a portion was pooled to create quality control (QC) samples. Lipid separation was performed on an Agilent 1290 UHPLC system equipped with a C18 column using a gradient elution method, with mobile phases consisting of water/acetonitrile and acetonitrile/isopropanol mixtures. The flow rate was 0.3 mL/min, column temperature was 55°C, and injection volume was 2.0 μL. A timsTOF Pro mass spectrometer was used for tandem mass spectrometry data acquisition in both positive and negative modes. Key MS parameters included sheath gas conditions, capillary voltages, and a mass range of 100–1700 Da. All ion fragmentation (AIF) was utilized for MS/MS data acquisition. The raw MS data were converted to mzXML format via ProteoWizard. Peak alignment, identification, and area extraction were performed using XCMS with specific minfrac and cutoff parameters. Lipid identification was performed using in-house software based on XCMS; Lipid4DAnalyzer, a self-written R package; and the lipidIMMS database. Complete information for all identified lipids, including retention times, m/z values, and MS/MS fragments, is provided in Supplementary Materials.
QC samples, prepared by pooling aliquots from all samples, were injected periodically throughout the analytical run to monitor system stability. The QC samples exhibited tight clustering in principal component analysis. Critically, the relative standard deviations (RSDs) of two internal standards, PC(17:0/17:0) and SM(d18:1/12:0), across all QC injections were 1.92% and 1.74%, respectively, confirming excellent instrument stability.
Construction and evaluation of the Random Forest (RF) model
To identify key variables differentiating the groups (i.e. NCs vs. CVD patients and SAP patients vs. AMI patients), we employed an RF algorithm. The dataset was split into a training set (70%) and test set (30%) using stratified random sampling to preserve class distribution. The training set was used for model construction and parameter optimization via 5-fold cross-validation (repeated 100 times).The test set served as an independent validation cohort. Feature importance was assessed using the Gini importance index. The top 10 features were then selected for subsequent analysis. As group imbalance was concerning, RF was used primarily for predictive feature identification, while logistic regression was used for final model development and validation.
Statistical analysis
Data normality was assessed using the Kolmogorov–Smirnov test. Normally distributed continuous variables were presented as mean ± SD, while non-normally distributed data were presented as median (interquartile range (IQR)). Unpaired t-tests and chi-squared tests were used to compare means and proportions, respectively, between the NC, AMI, and SAP groups, where appropriate. Univariable regression was performed for all variables as a screening step, and the variables with P < 0.05 were used as candidate variables. For the purpose of risk stratification analysis distinguishing patients from NCs, individuals in the SAP and AMI groups were combined into a single “CVD” group.
Candidate variables from the univariable regression were included in RF regressions. Separate clinical and lipidomic models were established by stepwise binary logistic regression, using the key features from RF analysis. We then performed a receiver operating characteristic (ROC) analysis, based on the predictions generated by the logistic regression model on the test set, and used the cross-validation results to evaluate the validity of our models. Statistical analysis were performed and figures were generated using R software (version 4.4.2, R Foundation for Statistical Computing, Vienna, Austria; https://www.R-project.org/) and SPSS (IBM SPSS Statistics for Windows, Version 26.0. IBM Corp., Armonk, NY, USA). The reporting of this study conforms to the Strengthening the Reporting of Observational Studies in Epidemiology (STROBE) guidelines. 24
Results
Demographic and clinical characteristics of the study cohorts
A total of 260 participants were included, comprising 40 NCs, 180 patients with SAP, and 40 patients with AMI. Baseline demographic and clinical characteristics are presented in Table 1. No significant differences were observed in age or sex distribution across the three groups. Although the BMI was similar between the NC and SAP groups, the AMI group exhibited a significantly higher BMI (25.68 ± 3.70). A significantly higher proportion of smokers was observed in the AMI group (47.50%) than in the NC (35%) and SAP (24.4%) groups, whereas no significant difference was observed in the prevalence of drinking. Notably, hypertension and type 2 diabetes were significantly more prevalent in both SAP (73.89% and 22.22%, respectively) and AMI (47.5% and 15%, respectively) groups than in the NC group. A statistically significant difference was observed in SBP, DBP, and heart rate (HR) across the three groups. Specifically, the AMI group exhibited a significantly higher DBP (82.65 ± 13.18 mmHg) and HR (82.98 ± 14.44 bpm) than the NC and SAP groups.
Demographic and clinical parameters of the participants.

Data are expressed as mean ± SD, number (percentage), or median (interquartile range). aP < 0.05 and bP < 0.01 compared with the NC group; cP< 0.05 and dP < 0.01 compared with the SAP group.
NC: non-cardiovascular disease control; SAP: stable angina pectoris; AMI: acute myocardial infarction; BMI: body mass index; BP: blood pressure; ALT: alanine transaminase; AST: aspartate transaminase; BUN: blood urea nitrogen; UA: uric acid; FBG: fasting blood glucose; HbA1c: glycated hemoglobin; TC: total cholesterol; TG: triglyceride; LDL-C: low-density lipoprotein cholesterol; HDL-C: high-density lipoprotein cholesterol.
Regarding biochemical parameters, the ALT and AST levels were also significantly different among the three groups, with the AMI group exhibiting the highest values. No significant differences were observed in creatinine, BUN, UA, FBG, and HbA1c levels across the three groups. Furthermore, the AMI group exhibited a significantly higher TC level than the other two groups. No significant difference was observed in TG levels, while the LDL-C and HDL-C levels exhibited significant differences among the three groups. The AMI group exhibited higher LDL-C and lower HDL-C levels than the other two groups.
Alterations in lipid metabolism among SAP, AMI, and NC groups
A total of 36,187 peak lipid metabolites were included in the subsequent statistical analysis. Nontargeted lipidomics was performed to evaluate the changes in lipid metabolism. Figure 1(a) shows the relative abundance of each lipid superclass detected, with phosphatidylcholine, TG, phosphatidylethanolamine (PE), and sphingomyelin (SM) identified as major lipid classes. Orthogonal partial least squares discriminant analysis (OPLS-DA) was employed to assess the discrimination of lipid profiles between the three groups. The OPLS-DA score plot for NC and SAP groups (Figure 1(b)) revealed a tendency for separation, indicating distinct lipidomic profiles. Furthermore, a clear separation was observed in the OPLS-DA score plot for the NC and AMI groups (Figure 1(c)). The plot for the SAP and AMI groups (Figure 1(d)) suggested that the lipid profiles of these two patient groups were also distinguishable. These results suggest that distinct lipidomic signatures can differentiate the NC, SAP, and AMI groups.

Lipid profiles and OPLS-DA differentiation among the NC, SAP, and AMI groups. (a) The pie chart illustrates the overall distribution of lipid classes detected in the study. (b–d) The separation of lipid profiles between the NC and SAP groups, NC and AMI groups, and SAP and AMI groups is shown based on the OPLS-DA model scores. OPLS-DA: orthogonal partial least squares discriminant analysis; NC: non-cardiovascular disease control; SAP: stable angina pectoris; AMI: acute myocardial infarction.
Identification of key lipid metabolites that distinguish the AMI group from SAP and NC groups
To identify the key lipid metabolites distinguishing the AMI group from SAP and NC groups, differential lipid metabolites were screened from the OPLS-DA model using a variable importance in projection (VIP) threshold >1.0 and P-value <0.05. The volcano plot for NC versus SAP groups (Figure 2(a)) identified 119 upregulated and 42 downregulated lipids. The volcano plot for NC versus AMI groups (Figure 2(b)) revealed 46 upregulated and 41 downregulated lipids. A comparison between AMI and SAP groups (Figure 2(b)) revealed 72 upregulated and 151 downregulated lipids. To investigate the shared changes, a Venn diagram of differential lipid metabolites was generated (Figure 2(d)). This analysis revealed five overlapping lipid metabolites among the three comparison groups: lysophosphatidylethanolamine(22:5), SM(d20:0), PE(17:0/20:4), PE (37:4), and lysophosphatidylcholine(O-18:0). The expression patterns of these five lipids were analyzed (Figure 2(e)). Among them, only PE(17:0/20:4) and PE(37:4) exhibited a stepwise increasing trend with increasing disease severity, from NC to SAP to AMI (Figure 2(f) and (g)). Given their potential clinical significance, PE(17:0/20:4) and PE(37:4) were selected for further investigation.
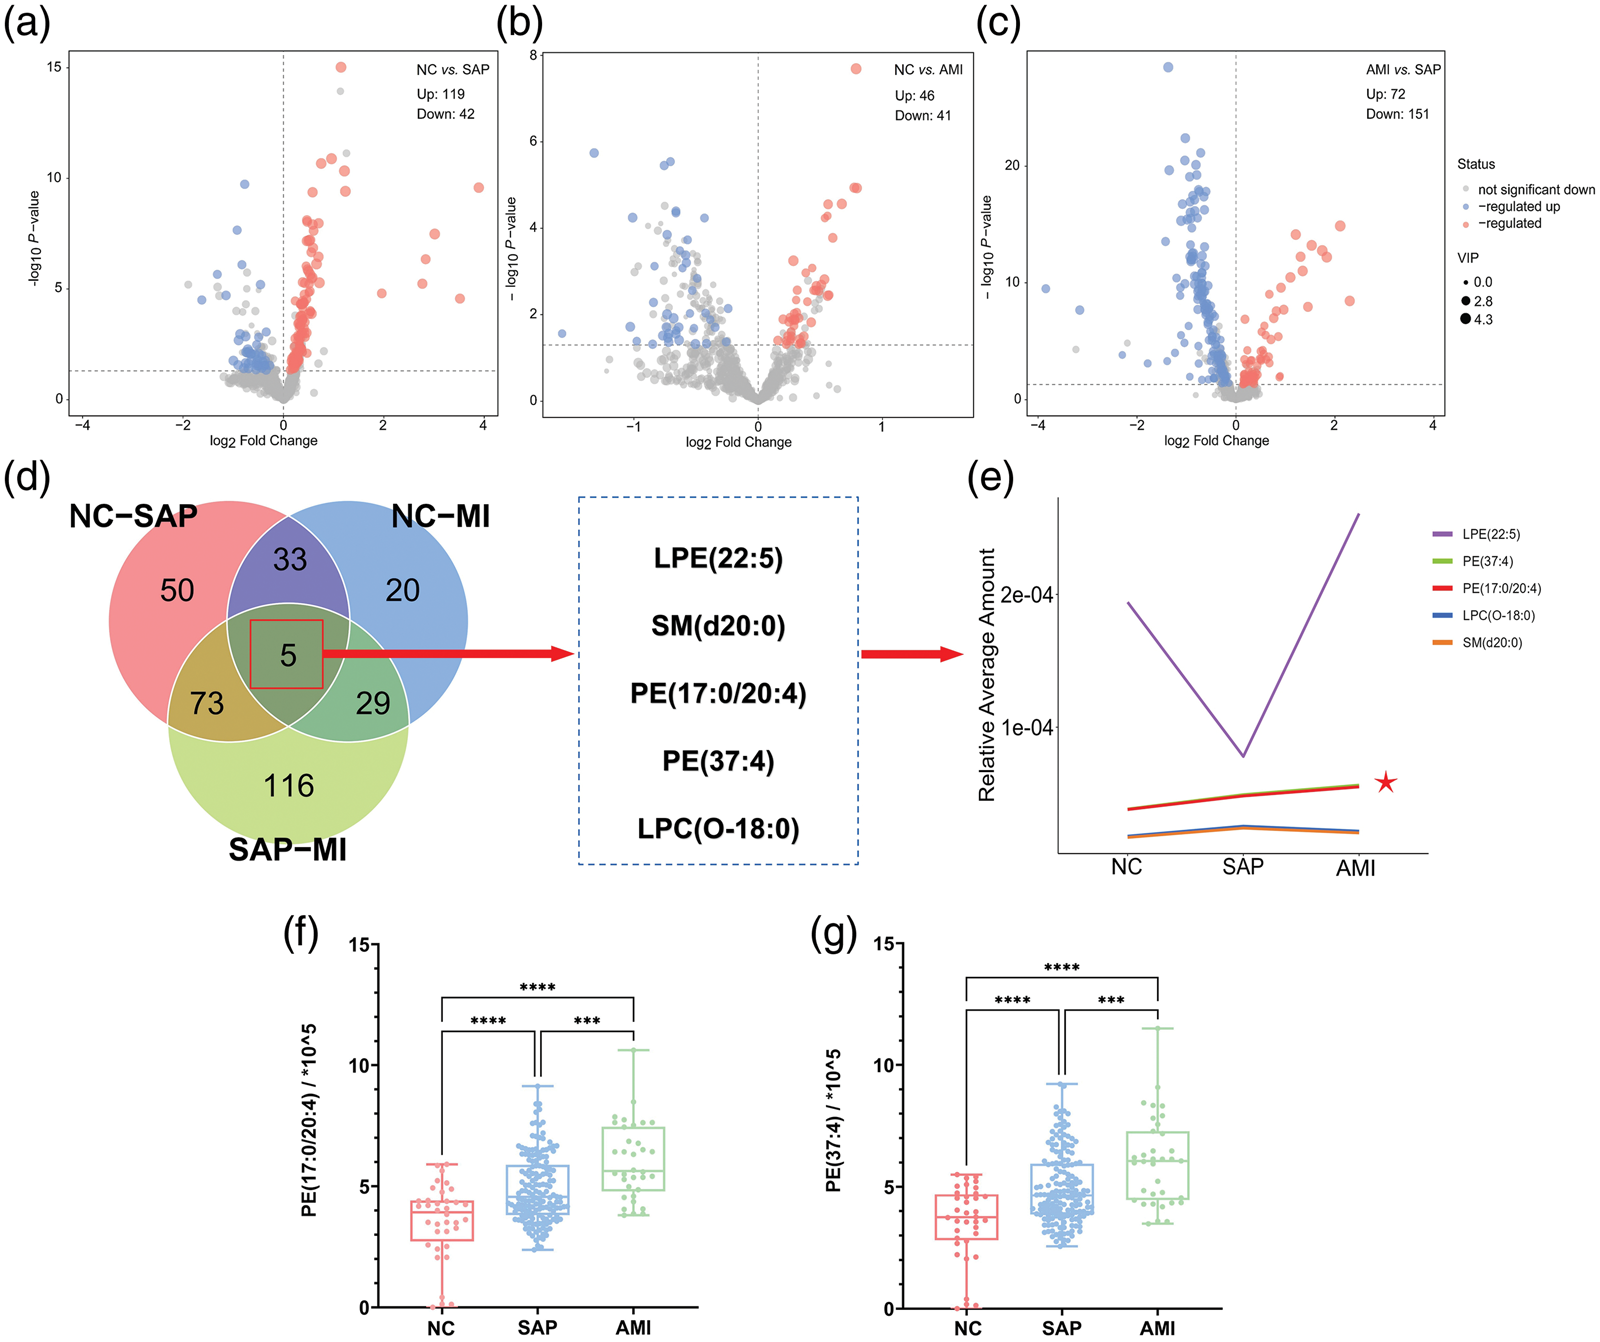
Identification of key lipid metabolites distinguishing SAP, AMI, and NC. (a) The lipidomic profiles of NCs and patients with SAP were compared. (b) The lipidomic profiles of NCs and patients with AMI were compared. (c) The lipidomic profiles of patients with AMI and SAP were compared. (d) Overlay Venn diagrams showing differential lipid metabolites between NC vs. SAP, NC vs. AMI, and SAP vs. AMI groups, with regions containing five common differential lipid metabolites highlighted. (e) The relative abundance of selected lipid metabolites in the NC, SAP, and AMI groups is shown, with asterisks indicating significant differences between groups (f–g). NC: non-cardiovascular disease control; SAP: stable angina pectoris; AMI: acute myocardial infarction.
Model construction for predicting CVD risk
To assess the predictive performance of the identified variables, we employed a two-stage modeling approach. In the first stage, we developed models to distinguish individuals with CVD (combination of SAP and AMI) from NC. An RF model (100 trees) was used to evaluate feature importance via the Gini importance index. The results are shown in Figure 3(a), which shows the importance of the top 10 variables in distinguishing the NC and CVD groups. TC emerged as the most important feature, followed by the key lipid species PE(37:4) and PE(17:0/20:4). Other variables, ranked in order of decreasing importance based on their Gini index score, included BUN, LDL-C, TG, SBP, DBP, HbA1c, and ALT.

Variable importance from the Random Forest analysis for distinguishing NC vs. CVD and SAP vs. AMI. NC: non-cardiovascular disease control participants; CVD: cardiovascular disease; SAP: stable angina pectoris; AMI: acute myocardial infarction.
To evaluate the independent associations with CVD risk, stepwise multivariate logistic regression was performed (Table 2). After adjustment, the model revealed that PE(37:4) (odds ratio (OR) = 4.01, 95% confidence interval (CI): 1.30–12.38), ALT (OR = 1.06, 95% CI: 1.01–1.13), and DBP (OR = 1.06, 95% CI: 1.01–1.12) were significantly associated with increased CVD risk. Conversely, TC (OR = 0.13, 95% CI: 0.03–0.60) was associated with a reduced risk. The predictive performance of these variables, alone and in combination, was then tested using ROC analysis (Figure 4(a)).
Stepwise multivariate logic analysis of risk factors for CVD.

The results presented are adjusted for age, sex, TC, LDL-C, PE(37:4), PE(17:0/20:4), BUN, LDL-C, TG, SBP, DBP, HbA1c, and ALT.
CVD: cardiovascular disease; OR: odds ratio; CI: confidence interval; PE: phosphatidylethanolamine; SBP: systolic blood pressure; DBP: diastolic blood pressure; ALT: alanine transaminase; AST: aspartate transaminase; BUN: blood urea nitrogen; HbA1c: glycated hemoglobin; TC: total cholesterol; TG: triglyceride; LDL-C: low-density lipoprotein cholesterol.

Predictive performance of the clinical and lipid models for CVD and AMI. CVD: cardiovascular disease; AMI: acute myocardial infarction.
A model constructed using only conventional clinical parameters (Model A) yielded an area under the curve (AUC) of 0.87 (95% CI: 0.81–0.94), whereas the two key lipid metabolites alone (Model B) yielded an AUC of 0.81 (95% CI: 0.74–0.88). The combined model (Model C), integrating clinical parameters and lipid species, achieved the highest AUC at 0.93 (95% CI: 0.88–0.98), indicating superior predictive performance.
Model construction for predicting AMI risk
In the second stage, we focused on discriminating patients with SAP from those with AMI. Following the same methodology, RF analysis identified DBP, ALT, and LDL-C, followed by key lipid metabolites PE(37:4) and PE(17:0/20:4), as important discriminatory features (Figure 3(b)). The stepwise multivariable logistic regression model revealed that DBP (OR = 1.06, 95% CI: 1.01–1.12), ALT (OR = 1.05, 95% CI: 1.02–1.08), and PE(17:0/20:4) (OR = 3.13, 95% CI: 1.33–7.38) demonstrated independent associations with AMI risk (Table 3). ROC analysis (Figure 4(b)) revealed that the clinical parameters alone (Model A) yielded an AUC of 0.75 (95% CI: 0.65–0.86), while the two key lipid species alone (Model B) exhibited a higher AUC of 0.85 (95% CI: 0.80–0.86). The combined model (Model C) demonstrated the highest predictive performance, with an AUC of 0.88 (95% CI: 0.82–0.95), indicating improved differentiation of AMI from SAP. At the optimal cutoff point determined by the Youden index, the combined model achieved a sensitivity of 90.2% and specificity of 86.5% for distinguishing CVD as well as a sensitivity of 85.6% and specificity of 82.3% for distinguishing AMI.
Stepwise multivariate logic analysis of risk factors for AMI.

The results presented are adjusted for age, sex, DBP, ALT, LDL-C, PE(17:0/20:4), PE(37:4), TC, HDL-C, hypertension, current smoke, and PLT.
AMI: acute myocardial infarction; TC: total cholesterol; LDL-C: low-density lipoprotein cholesterol; OR: odds ratio; CI: confidence interval; PE: phosphatidylethanolamine; DBP: diastolic blood pressure; ALT: alanine transaminase; PLT: platelet.
Discussion
In this study, nontargeted lipidomics analysis revealed several key findings. Most notably, we identified two specific PE species, PE(17:0/20:4) and PE(37:4), which exhibited a progressive elevation from NCs to patients with SAP and further to patients with AMI. PE(17:0/20:4) emerged as an independent predictor of AMI risk in patients with SAP (OR = 3.13, 95% CI: 1.33–7.38), while PE(37:4) was significantly associated with the overall CVD risk (OR = 4.01, 95% CI: 1.30–12.38). Furthermore, integrating these PE species with traditional clinical parameters substantially improved the prediction accuracy for both CVD (AUC = 0.93) and AMI risk (AUC = 0.88), suggesting their value as novel biomarkers for cardiovascular risk stratification.
Our findings revealed a significant association between PE and CVD, which is consistent with the findings of previous studies.25,26 We identified two specific PE species, PE(17:0/20:4) and PE(37:4), showing a stepwise increase from NC to SAP and further to AMI. PE(17:0/20:4) denotes a PE molecule with a 17:0 fatty acid at the sn-1 position and a 20:4 fatty acid at the sn-2 position. Although PE(37:4) represents PE molecules containing a total of 37 carbons and 4 double bonds in their fatty acyl chains, the designation does not specify the chain configuration, indicating the presence of other structural isomers of PE(17:0/20:4). The concurrent elevation of both PE(17:0/20:4) and PE(37:4) suggests that specific alterations in PE metabolism may occur during disease progression, potentially reflecting common regulatory pathways or distinct metabolic processes. To the best of our knowledge, this specific stepwise trend of PE(37:4) and PE(17:0/20:4) across this spectrum of disease states has not been previously reported. Existing studies have identified the significance of traditional markers such as TC and LDL-C in predicting CVD risk,27,28 which was consistent with our findings. However, these results highlight the additional predictive value of specific PE lipid species, particularly in conjunction with these established markers. Prior studies have similarly identified clinical risk factors—such as hypertension—as independent predictors of CVD, aligning with our findings. 29 However, our study provides new insight by revealing that lipid metabolites also play an independent role. 30 Moreover, although previous studies have indicated that certain lipid metabolites may be biomarkers for disease prediction,31,32 our research emphasizes the enhanced predictive performance of the combined use of clinical and specific PE lipid species.
The potential mechanisms underlying the association between PE species and CVD warrant discussion. PE is a major component of cellular membranes and plays crucial roles in membrane fusion, cell signaling, and inflammation.33,34 The elevated levels of PE(17:0/20:4) and PE(37:4) observed in our study may reflect altered membrane phospholipid metabolism during the progression of coronary artery disease. Additionally, changes in the PE composition could affect membrane fluidity and permeability, 35 potentially contributing to endothelial dysfunction and atherosclerotic plaque instability. 36 Previous studies have shown that oxidative modification of membrane phospholipids, including PE species, may promote foam cell formation and plaque vulnerability.37,38 These molecular alterations might explain why PE(17:0/20:4) emerged as an independent predictor for AMI risk in our study.
The specific structure of PE(17:0/20:4) offers further insight. Its 17:0 (margaric acid) chain is an odd-chain fatty acid not typically synthesized endogenously. This indicates the presence of exogenous sources, such as ruminant fat intake or gut microbiota synthesis, both linked to CVD pathogenesis. This species compellingly combines the 17:0 chain (signaling an altered metabolic background) with the 20:4 arachidonic acid chain (the primary substrate for proinflammatory eicosanoids). Therefore, we speculate that PE(17:0/20:4) acts as an “integrative biomarker” capturing both metabolic predisposition and inflammatory potential, 39 explaining its strong association with AMI risk.
The prediction model established herein demonstrates significant potential for clinical application in several aspects. First, unlike traditional risk assessment tools that rely solely on conventional clinical parameters, our integrated model incorporating PE species offers improved accuracy in identifying high-risk SAP patients (AUC = 0.88). This enhanced predictive power could enable more precise risk stratification, allowing clinicians to identify patients with SAP who require more aggressive intervention or closer monitoring. Second, we identified two independent molecular predictors: PE(17:0/20:4) for predicting AMI risk (OR = 3.13) and PE(37:4) for predicting overall CVD risk (OR = 4.01). These objective molecular markers complement existing clinical risk factors, potentially reducing subjectivity in risk assessment. Third, our findings suggest that routine lipid profiling could be expanded beyond traditional lipid panels to include specific PE species, thereby providing a more comprehensive evaluation of cardiovascular risk. This may be particularly valuable for patients with intermediate risk profiles, for whom current clinical parameters offer insufficient therapeutic guidance. Furthermore, the relatively high predictive value of PE species alone (AUC = 0.85) suggests their utility as a screening tool, which could be especially beneficial in resource-limited settings where comprehensive clinical evaluation may not be readily available.
Several limitations of our study should be acknowledged. First, the relatively modest sample size, particularly for the NC and AMI groups, may limit the generalizability of our findings and the statistical power of subgroup analyses. Second, this was a single-center study, which may introduce selection bias and limit the applicability of our findings to other populations. Third, the nontargeted lipidomics method used, although capable of detecting a broad lipid spectrum, is primarily semiquantitative and lacks the ability to determine absolute metabolite concentrations. Fourth, although we adjusted for multiple known cardiovascular risk factors, residual confounding from factors such as dietary habits, physical activity levels, and medication adherence could not be fully excluded. These factors might influence lipid metabolism and could affect the levels of PE species. Additionally, the study’s cross-sectional design limits our ability to infer causality between lipid metabolite alterations and disease progression. Finally, although strict criteria were used, the clinical classification of SAP and AMI remains challenging and prone to potential misclassification. Other potential confounders cannot be completely excluded due to the observational study design. Therefore, large-scale, multicenter prospective studies are warranted to validate these findings in diverse populations. Further mechanistic investigations are needed to elucidate the precise roles of these PE species in CVD progression and develop standardized assays for clinical translation.
Conclusion
This study demonstrated the potential of nontargeted lipidomics for identifying novel biomarkers predictive of AMI risk in patients with SAP. We found that the levels of PE species, specifically PE(37:4) and PE(17:0/20:4), increased with disease severity and contributed to improved predictive performance in the models developed. These findings offer new insights into the role of specific lipid metabolites in CVD pathogenesis and provide a foundation for improved risk prediction and therapeutic strategies.
Footnotes
Acknowledgements
The authors extend their gratitude for the financial support received and to all team members and contributors who assisted with this study. The authors also acknowledge the use of AI assistance (Gemini by Google) for language editing and polishing of the manuscript.
Author contributions
All authors made substantial contributions to study conception and design, acquisition of data, or analysis and interpretation of data as well as took part in drafting the article or revising it critically for important intellectual content.
Data availability
The datasets generated and/or analyzed during the current study are available from the corresponding author upon reasonable request.
Declaration of conflicting interests
The authors declare that they have no potential conflicts of interest with respect to the research, authorship, and/or publication of this article.
Ethical approval
This study was conducted in accordance with the Declaration of Helsinki and was approved by the Ethics Committee of Affiliated Hospital of Nanjing University of Chinese Medicine (Nanjing, China; Approval Number: 2021NL-175-02; Approval Date: 08 Nov 2021). All participants provided written informed consent prior to enrollment in the study.
Funding
This study was supported by the National Natural Science Foundation of China (grant 82370349), Key program of Jiangsu Chinese Medicine Clinical Medicine Innovation Center for Hypertension (grant k2021j17, grant k2021j17-1, and grant k2021j17-4), and the Social Science and Technology Development Program of Jiangsu Province (grant BE2021752).