
Abstract
Objective
This retrospective cohort study aimed to investigate the independent risk factors for vertebral artery stenosis following radiotherapy for nasopharyngeal carcinoma and construct a nomogram-based prediction model to assess its clinical utility.
Methods
In total, 386 nasopharyngeal carcinoma patients who underwent radiotherapy at a tertiary hospital between 2017 and 2023 were included; the median follow-up duration was 23.3 (interquartile range, 12.5–33.7) months, and the incidence of vertebral artery stenosis was 29.8% (115/386). Univariate Cox regression analysis was used to identify factors associated with vertebral artery stenosis, followed by least absolute shrinkage and selection operator (LASSO) regression analyses to determine the key variables. Multivariate Cox regression was applied to identify independent risk factors, which were used to construct a nomogram prediction model. The model’s accuracy and predictive performance were evaluated using calibration curves and receiver operating characteristic analysis.
Results
Univariate Cox regression analysis identified 12 significant variables, among which 4 key factors were selected through LASSO regression analysis. Multivariate Cox regression analysis revealed that V60 (hazard ratio: 1.09, 95% confidence interval: 1.07–1.10, p < 0.001), hyperlipidemia (hazard ratio: 1.66, 95% confidence interval: 1.05–2.64, p = 0.030), and body mass index (hazard ratio: 1.19, 95% confidence interval: 1.15–1.22, p < 0.001) were independent risk factors for vertebral artery stenosis. The nomogram prediction model constructed using these factors demonstrated high predictive performance, with calibration curves indicating excellent agreement between predicted and observed outcomes. Receiver operating characteristic analysis showed that the areas under the curve for 1-, 2-, and 3-year predictions were 0.99, 0.99, and 0.98, respectively.
Conclusion
The nomogram model based on multiple clinical parameters demonstrated good performance in predicting the risk of vertebral artery stenosis following radiotherapy for nasopharyngeal carcinoma in internal validation. It may serve as a useful tool for the early identification of high-risk patients and support prognosis management strategies.
Introduction
Nasopharyngeal carcinoma (NPC) is one of the most common head and neck malignancies in southern China.1,2 Radiotherapy (RT) is the primary treatment modality for NPC. 3 Advances in RT techniques, such as intensity-modulated radiotherapy (IMRT), have significantly improved treatment outcomes by precisely targeting tumors and minimizing damage to surrounding normal tissues, thereby enhancing patients’ survival and quality of life.4–7 However, RT is associated with long-term complications, including vertebral artery stenosis (VAS), which is particularly concerning.
VAS is associated with an elevated risk of recurrent strokes and transient ischemic attacks (TIAs),8,9 making early detection and effective management crucial. As a common cerebrovascular condition, VAS significantly increases the risk of ischemic events by reducing cerebral blood flow. Factors such as age, sex, hypertension, and hyperlipidemia have been implicated in VAS development.5,10 Importantly, among NPC patients treated with RT, VAS substantially raises the likelihood of cerebrovascular complications and serves as a critical predictor of vascular events. 10
Given these risks, the identification of high-risk individuals is essential for preventing VAS-related complications. Despite the clinical significance of VAS, only a few studies have focused on its occurrence after RT for NPC. Therefore, this study aimed to identify risk factors associated with VAS and develop a clinically applicable prediction model. Our previous study conducted in 2020 provided initial evidence regarding the association between RT and VAS development; the present study builds upon that foundation by including a larger sample size, longer follow-up period, and more rigorous statistical analyses. By constructing a nomogram, we aim to assist clinicians in the early identification of and development of intervention for high-risk patients to lower the incidence of VAS and improve long-term outcomes in NPC patients undergoing RT.
Materials and methods
Study population
This retrospective cohort study included NPC patients diagnosed and treated with RT at a tertiary hospital from January 2017 to May 2023. Inclusion criteria were as follows: (a) age ≥18 years; (b) histopathological confirmation of NPC; and (c) follow-up duration ≥6 months after completion of RT. Exclusion criteria were as follows: (a) preexisting VAS that preceded RT; (b) history of head or neck RT; and (c) concurrent severe systemic diseases. This retrospective study was conducted in accordance with the Declaration of Helsinki (as revised in 2024). The Ethics Committee of Liuzhou Workers’ Hospital, Guangxi, China, reviewed the study protocol and confirmed that formal Institutional Review Board approval was not required for this retrospective analysis. Patient data were fully deidentified to protect privacy, and the requirement for informed consent was waived. This study was designed and reported in accordance with the Strengthening the Reporting of Observational Studies in Epidemiology (STROBE) guidelines for observational studies. 11 A sample size of 386 was determined based on all available data from cases that met the inclusion criteria from January 2017 to May 2023, representing a convenience sample.
Clinical data collection
Clinical data were systematically collected based on potential risk factors for VAS following RT:
Demographic information. Age, sex, height, weight, body mass index (BMI, calculated as weight (kg)/height (m)
2
, smoking history (defined as lifetime consumption of ≥100 cigarettes), and alcohol consumption history (defined as drinking at least once per week for ≥6 consecutive months). Tumor diagnosis and staging. Date of diagnosis and tumor, node, metastasis staging (based on the 8th edition of the American Joint Committee on Cancer (AJCC) staging system). Comorbidities and surgical history. History of diabetes mellitus (fasting glucose >7.0 mmol/L or random glucose >11.1 mmol/L), hypertension (systolic blood pressure ≥140 mmHg and/or diastolic blood pressure ≥90 mmHg), hyperlipidemia (total cholesterol >5.72 mmol/L and/or triglycerides >1.70 mmol/L), pulmonary embolism, cerebral infarction, coronary heart disease, history of neck surgery, and use of a peripherally inserted central catheter (PICC). RT parameters. Total number of RT sessions and dose–volume parameters for the vertebral artery (V60, V50, and V40). Combination therapies. Receipt of induction chemotherapy, concurrent chemotherapy, concurrent targeted therapy, and adjuvant chemotherapy. Treatment outcomes and complications. Tumor treatment efficacy after RT (evaluated according to RECIST 1.1 criteria)
12
and occurrence of radiation-induced dermatitis and neck muscle fibrosis (assessed using Radiation Therapy Oncology Group (RTOG)/European Organization for Research and Treatment of Cancer (EORTC) toxicity criteria).
13
VAS assessment
Bilateral vertebral artery status was evaluated using color Doppler flow imaging before RT and during follow-up. VAS was defined as >50% reduction in the vertebral artery diameter, indicated by a peak systolic velocity (PSV) ≥140 cm/s, end-diastolic velocity ≥35 cm/s, and a PSV ratio between the PSV origin (PSVOR) and PSV intervertebral (PSVIV) segments (PSVOR/PSVIV) ≥2.1. 14
Follow-up protocol
Baseline assessments were conducted before the RT was administered. Patients were monitored every 3 months during the first 2 years post-RT and every 6 months thereafter until VAS development.
Statistical analysis and model development
Statistical analysis
Data analyses were performed using the Statistical Package for Social Sciences (SPSS, version 22.0) and R software (version 4.3.1). Categorical variables were expressed as n (%) and compared using the chi-squared test. Continuous variables were analyzed using independent sample t-tests for normally distributed data and the Mann–Whitney U test for non-normally distributed data. Statistical significance was set at p < 0.05. Univariate Cox regression was used to identify potential risk factors, followed by least absolute shrinkage and selection operator (LASSO) regression to refine variables and reduce selection bias. Multivariate Cox regression was applied to determine independent risk factors, adjusting for confounding. Missing data were assessed across all variables. Minimal missing values were observed for weight, height, and BMI, with one case each (0.3%). Complete case analysis was performed for these variables. Variables with substantial missingness, including VAS location (271 cases, 70.2%), pre-treatment Epstein–Barr virus (EBV) DNA copy number (162 cases, 42.0%), and post-treatment EBV DNA copy number (149 cases, 38.6%), were excluded from the final multivariate analysis to minimize bias. All patients were included in the retrospective medical record–based follow-up analysis. Subgroup analyses and sensitivity analyses were not conducted due to the study’s focus on overall risk prediction and limited sample size variability.
Risk factor identification
Univariate analysis
Potential risk factors were initially analyzed using univariate Cox regression in R 4.3.1, with variables achieving p < 0.05 considered for further analysis.
LASSO regression
Variables identified in univariate analysis were further refined using LASSO regression to minimize multicollinearity while retaining key predictors. 15
Multivariate Cox regression
Key variables identified by LASSO were incorporated into a multivariate Cox proportional hazards model to adjust for confounding factors.
Model development and validation
Nomogram construction
A nomogram was developed based on independent risk factors to predict the VAS risk. The nomogram integrates multiple risk factors into a user-friendly graphical tool that assigns scores to each variable to estimate disease probability. 16
Calibration curve
Calibration curves were plotted to assess the agreement between predicted and observed probabilities, evaluating the model’s accuracy.
Receiver operating characteristic (ROC) analysis
ROC curves were generated to evaluate the model’s predictive performance at different time points, quantified by the area under the curve (AUC).
Risk stratification
The optimal cutoff value for the nomogram risk score was determined to classify patients into high- and low-risk groups for VAS.
Results
Patient characteristics
This study retrospectively analyzed NPC patients treated with RT at a tertiary hospital between January 2017 and May 2023. From the hospital’s medical records, a total of 412 patients were initially identified as potentially eligible based on a diagnosis of NPC and receipt of RT. After applying the inclusion and exclusion criteria, 386 patients were included in the final analysis. The final cohort comprised 279 men (72.3%) and 107 women (27.7%), with a mean age of 54.0 ± 4.6 years. The median follow-up duration was 23.3 months (interquartile range, 12.5–33.7 months), and the incidence of VAS after RT was 29.8% (115/386).
Compared with patients without VAS, those who developed VAS had significantly higher BMI (26.7 ± 2.68 vs. 20.9 ± 2.00 kg/m2, p < 0.001), age (56.0 ± 6.03 vs. 52.8 ± 3.45 years, p < 0.001), prevalence of hyperlipidemia (30.4% vs. 2.58%, p < 0.001), prevalence of pulmonary embolism (4.35% vs. 0.37%, p = 0.010), prevalence of smoking history (21.7% vs. 2.95%, p < 0.001), as well as prevalence of history of neck surgery (6.96% vs. 0.74%, p < 0.001) and neck fibrosis (p = 0.015). Other variables, such as sex; follow-up duration; RT dose parameters (V60, V50, and V40); hypertension; diabetes; coronary heart disease; cerebral infarction; alcohol consumption history; T stage; N stage; RT technique (IMRT, tomotherapy, and volumetric modulated arc therapy); RT fractions; induction chemotherapy (gemcitabine + cisplatin, paclitaxel + cisplatin, and docetaxel + cisplatin + fluorouracil); concurrent chemotherapy; concurrent targeted therapy; adjuvant chemotherapy; radiation dermatitis; PICC placement; and treatment response (complete response, partial response, stable disease, and progressive disease), showed no significant differences (p > 0.05). Detailed baseline characteristics are summarized in Table 1, and tumor-related treatment information is presented in Table 2. The RT target area and angiographic images of an NPC patient diagnosed with VAS following RT are presented in Figure 1.
Baseline data of patients.

Categorical data are expressed as n (%). Continuous data are expressed as mean ± SD (
BMI: body mass index; CHD: coronary heart disease; VAS: vertebral artery stenosis.
Treatment information of the study participants.

Categorical data are expressed as n (%). Continuous data are expressed as mean ± SD (
RT: radiotherapy; IMRT: intensity-modulated radiotherapy; TOMO: tomotherapy; VMAT: volumetric modulated arc therapy; VAS: vertebral artery stenosis; GP: gemcitabine + cisplatin; TP: docetaxel + cisplatin; TPF: docetaxel + cisplatin + fluorouracil; CR: complete response; PR: partial response; SD: stable disease; PD: progressive disease; PICC: peripherally inserted central catheter.

A patient with a positive cervical lymph node near the V1 vertebral artery segment underwent (a) high-dose radiotherapy and (b) vertebral angiography confirming subsequent vertebral artery stenosis.
Screening of risk factors
Univariate Cox regression analysis
Univariate Cox regression identified 12 potential factors associated with the occurrence of VAS:
V60 (hazard ratio (HR) = 1.13, 95% confidence interval (CI): 1.10–1.16, p < 0.001) BMI (HR = 1.40, 95% CI: 1.30–1.50, p < 0.001) RT fractions (HR = 1.43, 95% CI: 1.02–2.02, p = 0.039) T stage (HR = 1.78, 95% CI: 1.22–2.61, p = 0.003) N stage (HR = 5.84, 95% CI: 3.17–10.78, p < 0.001) Smoking history (HR = 9.33, 95% CI: 3.16–27.56, p < 0.001) PICC placement (HR = 4.14, 95% CI: 1.28–13.41, p = 0.018) History of neck surgery (HR = 2.96, 95% CI: 1.20–7.32, p = 0.019) Diabetes (HR = 1.99, 95% CI: 1.05–3.80, p = 0.036) Coronary heart disease (HR = 2.68, 95% CI: 1.10–6.52, p = 0.030) Hypertension (HR = 2.06, 95% CI: 1.06–4.01, p = 0.033) Hyperlipidemia (HR = 4.62, 95% CI: 2.77–7.68, p < 0.001)
The results of univariate analysis are presented in Figure 2.

Univariate Cox regression analysis.
LASSO regression screening
Based on variables with statistical significance identified in the univariate analysis, LASSO regression analysis was conducted, employing cross-validation to determine the optimal penalty coefficient, λmin = 0.1107. At this penalty coefficient, four variables associated with VAS following RT for NPC were identified along with their regression coefficients:
V60 (regression coefficient = 0.0436) BMI (regression coefficient = 0.142) Smoking history (regression coefficient =0.0187) Hyperlipidemia (regression coefficient =0.3074)
The results are presented in Figure 3.

Cross-validation diagram of LASSO regression model. LASSO: least absolute shrinkage and selection operator.
Multivariate Cox regression analysis
The variables identified through LASSO regression were included in the multivariate Cox regression analysis.
V60 (HR = 1.09, 95% CI: 1.07–1.10, p < 0.001) Hyperlipidemia (HR = 1.66, 95% CI: 1.05–2.64, p = 0.030) BMI (HR = 1.19, 95% CI: 1.15–1.22, p < 0.001)
These were independent risk factors for VAS after RT. Smoking history (HR =1.49, 95% CI: 0.90–2.46, p = 0.119) did not reach statistical significance. Detailed results are presented in Figure 4.
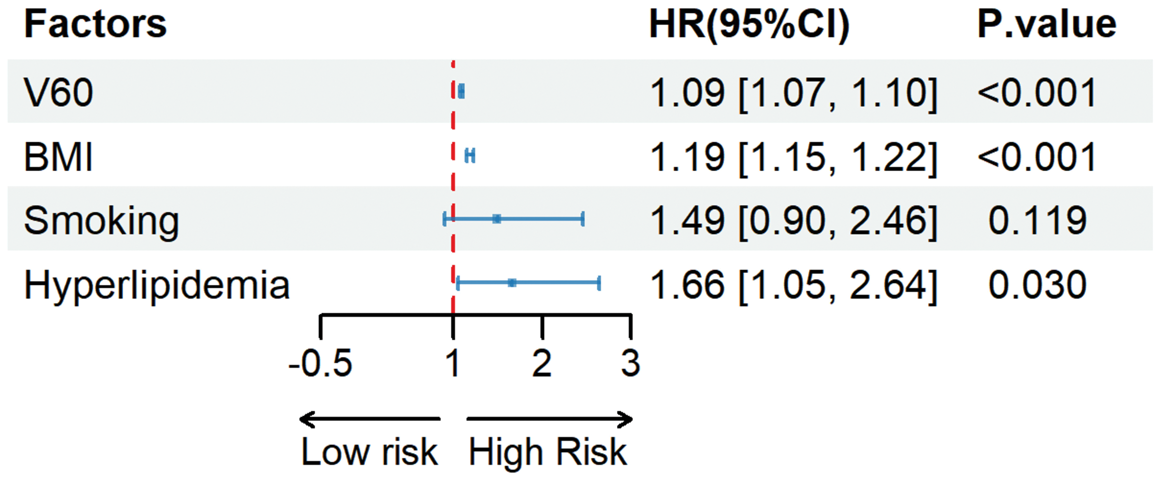
Multivariate Cox regression analysis.
Development of a clinical prediction model
Using the three independent risk factors, a nomogram scoring system was constructed with the R rms package. The scoring system assigned the highest weight to BMI (100 points), followed by V60 (97 points) and hyperlipidemia (9 points). The nomogram is presented in Figure 5.

Nomogram model for predicting vertebral artery stenosis in NPC patients after radiotherapy.
Evaluation of model accuracy and predictive performance
The accuracy of the prediction model was assessed using calibration curves. Calibration curves were generated through 1000 bootstrap resampling iterations, comparing the predicted probabilities with the observed probabilities:
Ideal curve. Represented by the 45° diagonal line, indicating perfect consistency; Apparent curve. Depicted the uncorrected performance of the model; Bias-corrected curve. Showed the performance after bias correction.
The calibration curves demonstrated excellent agreement between predicted and observed probabilities, with bias-corrected points closely aligning with the ideal curve. The Hosmer–Lemeshow test yielded a p-value >0.05, indicating no significant deviation and good calibration (Figure 6(a)). The ROC curve was employed to evaluate the predictive efficiency of the model for VAS at 1-, 2-, and 3-year intervals, with AUC values of 0.99, 0.99, and 0.98, respectively (Figure 6(b)). These results confirmed the model’s high predictive accuracy, providing a robust tool for early identification of high-risk patients.

(a) Calibration curve and (b) ROC curve of the nomogram model. ROC: receiver operating characteristic.
Cutoff value and risk stratification with the nomogram model
Using the R survminer package, the optimal cutoff value for the nomogram risk score was determined to be 40.33 (Figure 7(a)). Based on this cutoff, patients were categorized into high-risk and low-risk groups. The incidence of VAS was significantly higher in the high-risk group than in the low-risk group, with a marked statistical difference (p < 0.0001). The risk stratification effectively distinguished patients with varying probabilities of VAS post-RT for NPC, as presented in Figure 7(b).

Optimal cutoff value for the (a) nomogram risk score (b) and Kaplan–Meier curve for risk stratification of patients.
Discussion
VAS is a significant risk factor for cerebrovascular events, including TIAs. 10 Patients with hyperlipidemia, diabetes, and other comorbidities have a notably higher incidence of vascular events following RT. 17 Our preliminary study identified a mean vertebral artery dose >60 Gy, hyperlipidemia, hypertension, and smoking as independent risk factors for VAS after RT for NPC patients. 18 However, due to the limited sample size and the cross-sectional nature of the logistic regression analysis, these findings do not adequately account for the time dimension and require further validation.
In the present study, we expanded the sample size, increased the follow-up duration, and included more potential risk factors. Through univariate Cox regression, LASSO regression, and multivariate Cox regression analyses, three independent risk factors for VAS were identified after RT for NPC: V60, BMI, and hyperlipidemia. Based on these factors, we constructed a nomogram model that demonstrated robust predictive performance, as validated using calibration and ROC curves.
Among the risk factors, BMI achieved the highest score in the model, indicating that patients with higher BMI have a greater risk of VAS after RT. 9 The relationship between obesity and cardiovascular diseases is well-documented. Individuals with elevated BMI, particularly those categorized as obese, are reported to have a significantly higher risk of cardiovascular events. 19 Furthermore, obesity is closely associated with other cardiovascular risk factors such as hypertension, diabetes, and hypercholesterolemia, which collectively exacerbate the risk of vascular events. 20
The RT dose–volume parameter V60 also emerged as a critical determinant of VAS. Our preliminary study found that a mean vertebral artery dose >60 Gy was a significant risk factor for VAS, although the threshold was not precisely defined. 18 In this study, we included V40, V50, and V60 in the analysis to refine the dose threshold associated with VAS. Both univariate (HR = 1.13, 95% CI: 1.10–1.16, p < 0.001) and multivariate (HR = 1.09, 95% CI: 1.07–1.10, p < 0.001) Cox regression analyses confirmed that V60 is an independent risk factor, with higher V60 values correlating with increased VAS incidence. Interestingly, the primary site of VAS occurrence was the V1 segment,21,22 likely due to its smaller diameter and thinner vessel wall. The abrupt changes in flow velocity and pressure at the transition from the subclavian artery to the V1 segment may generate turbulence, increasing the local shear stress and accelerating atherosclerosis. 22 Therefore, during RT target designing, it is crucial to minimize the V60 dose to the V1 segment while ensuring tumor control.
Hyperlipidemia and smoking, both identified as significant factors in our preliminary study, 18 are closely associated with atherosclerosis. Elevated cholesterol levels promote lipid deposition in the arterial intima, accelerating atherosclerosis progression. 23 Smoking significantly increases the carotid intima-media thickness and is directly linked to the advancement of atherosclerosis. Moreover, smoking interacts with other cardiovascular risk factors, such as hyperlipidemia and hypertension, further exacerbating the atherosclerotic risk. 24 Although smoking was significant in both univariate Cox and LASSO regression, it did not remain an independent factor in multivariate Cox analysis. This discrepancy may stem from collinearity between smoking and other variables such as hyperlipidemia and BMI. After adjusting for confounding factors in the multivariate model, the independent contribution of smoking to VAS risk was less pronounced. However, its significance in univariate and LASSO analyses underscores its clinical importance as a synergistic factor in the vascular risk. Interventions targeting these risk factors, such as dietary improvements and smoking cessation, are essential for reducing the atherosclerosis risk.
Notably, although several variables were significant in the univariate Cox regression, LASSO and multivariate Cox analyses, which accounted for variable interactions and collinearity, identified only V60, BMI, and hyperlipidemia as independent risk factors. The effects of other variables, such as T stage, N stage, and RT sessions, may be explained by critical factors such as V60. Similarly, the impact of variables such as diabetes, PICC placement, and coronary heart disease may be indirectly reflected through BMI or hyperlipidemia. The variable selection process in LASSO further validated the dominant roles of these key factors, while the influence of smoking, although retained in LASSO, diminished in the multivariate Cox model due to the presence of stronger factors. Although hyperlipidemia (HR = 1.66) was an independent risk factor, its nomogram score was relatively low because it is a binary variable, contributing only a fixed increment, while BMI and V60 are continuous variables with wider ranges. This scoring difference reflects variable scaling rather than diminished clinical importance, and hyperlipidemia remains a meaningful predictor.
For example, increasing the number of RT sessions may elevate the risk of long-term adverse effects such as vascular sclerosis, muscle fibrosis, and endocrine dysfunction. 25 Advanced N stage represents larger and more numerous lymph node metastases located closer to the V1 segment, increasing its RT dose and subsequent atherosclerotic risk. Oxidative stress induced by RT exacerbates endothelial dysfunction, promoting atherosclerosis.26,27 Although variables such as T stage, N stage, RT sessions, and diabetes were not significant in the multivariate Cox analysis, attention should still be given to managing chronic diseases through lifestyle modifications and multidisciplinary care.
To evaluate the accuracy of the predictive model, we plotted calibration and ROC curves. The calibration curve closely aligned with the actual curve, while the AUCs for 1-, 2-, and 3-year predictions were 0.99, 0.99, and 0.98, respectively. These results indicate high accuracy for the model. Nevertheless, the very high AUCs observed for 1-, 2-, and 3-year predictions (0.98–0.99) raise concern regarding potential optimism (overfitting). Although we used LASSO for variable selection and plotted calibration curves with bias-corrected estimates, predictor selection and performance assessment were performed on the same retrospective dataset, which can lead to upwardly biased performance estimates. Therefore, the nomogram should be considered exploratory until externally validated in independent cohorts; future work should report optimism-corrected performance (e.g. via bootstrap resampling or cross-validation), consider shrinkage/penalization approaches, and evaluate generalizability across other centers. However, this study has certain limitations. First, the sample size was relatively small. Second, several variables, including VAS location and EBV DNA copy numbers, had high proportions of missing data (40%–70%) and were excluded from the final analysis, which may have reduced the completeness of risk assessment. Minimal missing values (<1%) for anthropometric measures were unlikely to impact the results. Third, this was a single-center study and only involved data from our institution; therefore, the findings may mainly apply to similar NPC populations receiving RT in comparable clinical settings. Future multicenter studies with larger sample sizes are needed to validate these results. Finally, the predictive model requires further clinical validation.
Conclusion
Our findings demonstrate that V60, BMI, and hyperlipidemia are significantly associated with an increased risk of VAS in NPC patients following RT. These independent risk factors serve as key predictors of VAS. The nomogram developed in this study may assist clinicians in identifying patients at higher risk, facilitating early interventions to reduce the incidence of VAS.
Supplemental Material
sj-pdf-1-imr-10.1177_03000605251396287 - Supplemental material for Risk factors and clinical prediction model for vertebral artery stenosis following radiotherapy for nasopharyngeal carcinoma
Supplemental material, sj-pdf-1-imr-10.1177_03000605251396287 for Risk factors and clinical prediction model for vertebral artery stenosis following radiotherapy for nasopharyngeal carcinoma by Jiang Zhou, Lu Ying, Yang Hui, Xu Zhuohua, Wei Mingjing and Zhu Xiaodong in Journal of International Medical Research
Footnotes
Acknowledgments
We would like to thank all the patients who participated in the study.
Authors’ contributions
Zhou Jiang, Ying Lu, and Xiaodong Zhu contributed to the study design. Zhou Jiang was responsible for writing the manuscript. Hui Yang, Mingjing Wei, and Zhuohua Xu performed data collection and analysis. All authors have read and approved the final manuscript.
Data availability statement
The datasets used and analyzed during the current study are available from the corresponding author upon reasonable request.
Declaration of conflicting interests
The authors declared no potential conflicts of interest with respect to the research, authorship, and/or publication of this article.
Disclosures
The authors have no personal, financial, or institutional interest in any of the drugs, materials, or devices described in this article.
Ethical consideration
This study was approved by the Ethics Committee of the study institution. As a retrospective study, it was exempted from obtaining informed consent from patients by the Ethics Committee.
Funding
This work was supported by the Guangxi Health and Family Planning Commission Research Fund (Grant Nos. Z20200887, Z-B20221437, Z-B20221448) and the Liuzhou Science and Technology Plan Project (Grant No. 2022SB011).
References
Supplementary Material
Please find the following supplemental material available below.
For Open Access articles published under a Creative Commons License, all supplemental material carries the same license as the article it is associated with.
For non-Open Access articles published, all supplemental material carries a non-exclusive license, and permission requests for re-use of supplemental material or any part of supplemental material shall be sent directly to the copyright owner as specified in the copyright notice associated with the article.