
Abstract
Objective
Sepsis-induced cardiomyopathy, a life-threatening complication of sepsis, carries a significant mortality risk. Despite its clinical severity, the immunometabolic mechanisms driving its pathogenesis remain poorly understood. This study aimed to identify immunometabolism-associated genes in sepsis-induced cardiomyopathy and analyze immune infiltration.
Methods
We integrated single-cell and bulk RNA sequencing data from septic cohorts, using a multistep bioinformatic approach involving machine learning and weighted gene co-expression network analysis to identify key immunometabolism-associated genes and explore their role in sepsis-induced cardiomyopathy. Key findings were validated using in vitro and in vivo experiments.
Results
We identified two distinct macrophage subsets (functional and senescent) and prioritized four hub genes, including ABLIM1, BCL9L, SMAD3, and DHRS3, which formed a robust prognostic model (area under the curve = 0.724). In vivo and in vitro validation confirmed significant downregulation of these hub genes in sepsis-induced cardiomyopathy. Immune infiltration analysis demonstrated significant increases in monocytes, M0/M1 macrophages, and neutrophils in sepsis, with hub genes showing significant correlations with specific immune cell subsets.
Conclusions
This study identifies ABLIM1, BCL9L, SMAD3, and DHRS3 genes as pivotal biomarkers and potential therapeutic targets in sepsis-induced cardiomyopathy, linked to immune–metabolic dysregulation and myocardial injury. These findings provide new insights for early diagnosis and precision immunotherapy of sepsis-induced cardiomyopathy.
Keywords
Introduction
Sepsis is a systemic disease triggered by infection that results in widespread immune dysregulation and severe multiple organ failure. 1 From 1990 to 2017, sepsis-related deaths accounted for 19.7% of all global deaths, highlighting its status as a major public health threat and substantial disease burden.2,3 Sepsis-induced cardiomyopathy (SICM), a life-threatening complication characterized by acute cardiac dysfunction, contributes significantly to the high mortality rate among patients with sepsis. 4 Previous studies have identified pathological changes in SICM hearts, including immune cell infiltration, interstitial edema, myocytolysis, and interstitial fibrosis.5,6 Cardiac cytokine storms, along with other sepsis-induced factors, prompt myocardial cells to release damage-associated molecular patterns (DAMPs). 7 These DAMPs are recognized by pattern recognition receptors (PRRs), thereby initiating a cascade of immune responses. This process is a crucial event in the complex pathophysiology of SICM, where the release of DAMPs serves as a key signal to activate the immune system, potentially resulting in further tissue damage and organ dysfunction. 8 Despite advances in critical care, the molecular mechanisms underlying SICM remain poorly understood, hampering the development of targeted therapies. A systematic exploration of immunometabolism-associated genes (IMAGs) and their relationship with immune cell infiltration in SICM is still lacking, creating a critical knowledge gap in this field.
Although systemic inflammation and mitochondrial dysfunction are recognized as key contributors to SICM pathogenesis, emerging evidence highlights the critical role of immunometabolic dysregulation, defined as the interplay between immune cell activation and metabolic reprogramming, in driving myocardial injury during sepsis. 9 Sepsis triggers a profound shift in immune cell metabolism, altering pathways such as glycolysis, oxidative phosphorylation, and fatty acid oxidation to meet the bioenergetic demands of hyperactivated immune responses. 10 These metabolic changes not only influence immune cell phenotypes (e.g. macrophage polarization and T-cell exhaustion) but also exacerbate tissue damage through mechanisms such as reactive oxygen species (ROS) overproduction and proinflammatory cytokine storms. 11 Such immunometabolic disturbances may disrupt cardiomyocyte bioenergetics, impair calcium handling, and promote apoptosis, collectively contributing to systolic dysfunction. Recent single-cell RNA sequencing (scRNA-seq) studies have revealed dynamic immune cell infiltration patterns in septic hearts,12,13 suggesting that crosstalk between infiltrating immune subsets and resident cardiac cells may orchestrate SICM progression. 14 However, the identity of hub IMAGs regulating these processes and their diagnostic or therapeutic potential remains unexplored.
Conventional approaches to studying SICM have relied heavily on candidate gene analyses or isolated pathway investigations, often overlooking the complexity of immune–metabolic networks. Publicly available transcriptomic datasets from SICM patients and preclinical models offer an untapped resource for systems-level insights. Integrating bioinformatics tools, such as weighted gene co-expression network analysis (WGCNA) and machine learning (ML) algorithms, can systematically prioritize IMAGs by correlating their expression with clinical phenotypes, immune cell abundance, and metabolic pathway activity. For instance, ML models such as Least Absolute Shrinkage and Selection Operator (LASSO) regression or random forest (RF) can identify minimal gene signatures with diagnostic utility, whereas deconvolution algorithms (e.g. CIBERSORT) may quantify immune infiltration patterns. Such integrative strategies have proven effective in oncology and autoimmune diseases but remain underutilized in sepsis research.
This study aimed to bridge this gap by combining multicohort transcriptomic analysis, advanced bioinformatics, and ML to (a) identify robust IMAGs associated with SICM pathogenesis; (b) characterize immune infiltration landscapes and their correlation with IMAGs; and (c) construct diagnostic models based on hub genes. We hypothesized that dysregulated immune–metabolic pathways drive myocardial immune cell recruitment and functional impairment in SICM, with specific IMAGs serving as biomarkers or therapeutic targets. The findings of this study may advance our understanding of immune–metabolic mechanisms in SICM, offering novel insights for early diagnosis and precision immunotherapy. Identifying key IMAGs could pave the way for therapies targeting metabolic checkpoints to recalibrate immune responses and mitigate cardiac injury in sepsis.
Materials and methods
Single-cell data preprocessing and analysis
scRNA-seq data from human septic tissues were obtained from the Gene Expression Omnibus (GEO) database (accession: GSE190856). Quality control of scRNA-seq data was performed using the scater R package to filter out low-quality cells (mitochondrial gene content >20% or <200 detected genes). Normalization and imputation of missing values were conducted using the scImpute R and scran R packages, respectively, and doublet removal was performed using DoubletFinder (pK = 0.09). Integration of multiple datasets was achieved by identifying anchor points with the FindIntegrationAnchors function and merging them into a unified Seurat (v4.3.0; https://satijalab.org/seurat/) object using the IntegrateData function. Cell types within the tissue microenvironment were annotated using the SingleR package combined with manual marker-based identification. Metabolic activity across cell clusters was assessed using the AUCell scoring method, and functional enrichment analysis was performed via the org.Hs.eg.db R package. Pseudotime trajectories of cell differentiation were reconstructed using Monocle2 (v2.4.0), whereas intercellular communication networks were analyzed using NicheNet and CellChat to infer ligand–receptor interactions. A comprehensive search for publicly available datasets was conducted up to March 2024, and the selected datasets were chosen based on their direct relevance to sepsis and SICM, sample size, and data quality.
Transcriptomic data preprocessing and differential expression analysis
Bulk RNA-seq data from human septic tissues (GSE65682) were downloaded from the GEO database, comprising 760 sepsis and 42 normal samples profiled on the Affymetrix Human Genome U219 Array (GPL13667). Raw data were normalized using the limma R package. Differentially expressed genes (DEGs) between sepsis and normal tissues were identified with thresholds of log2 fold change (|logFC|) >1 and adjusted p-value of <0.05 (Benjamini–Hochberg false discovery rate (FDR) correction). Upregulated and downregulated DEGs were categorized separately for downstream analyses.
Landscape analysis of communication-related genes
Communication-related genes identified from single-cell analyses were cross-referenced with bulk transcriptomic DEGs using the limma package (|logFC| > 1, p < 0.05). Co-expression networks among these genes were constructed, and gene pairs with Pearson correlation coefficients of >0.4 were visualized using ggplot2.
Functional enrichment of differentially expressed communication-related genes
Gene Ontology (GO) and Kyoto Encyclopedia of Genes and Genomes (KEGG) pathway enrichment analyses were conducted using the clusterProfiler R package. GO terms were categorized into biological processes (BP), molecular functions (MF), and cellular components (CC). To further investigate the functional roles of communication-related genes in sepsis, GO functional annotation and KEGG pathway enrichment analyses were conducted on differentially expressed communication-related genes using clusterProfiler. Significantly enriched GO terms were visualized using the treemap R package. A p-value of <0.05 was considered statistically significant.
Prognostic model construction using communication-related genes
Communication-related genes with significant between-group differences (p < 0.05) were screened using the Wilcoxon test and LASSO regression analysis. The efficiency of the risk scoring model was assessed using the ggrisk R package. Tenfold cross-validation was used to determine the optimal λ value for the LASSO model (λ.min = minimum cross−validation error, coefficient > 0). Patients were stratified into high-risk and low-risk groups based on median risk scores. Survival differences between groups were visualized using Kaplan–Meier curves and statistically evaluated using the log-rank test (survival R package). Receiver operating characteristic (ROC) curves were generated with the timeROC R package to quantify model sensitivity and predictive accuracy, and ggplot2 was used for visualization. The area under the curve (AUC) was employed to assess the diagnostic efficacy of biomarkers.
RF and Support Vector Machine Recursive Feature Elimination (SVM-RFE) for feature gene selection
To evaluate the impact of communication-related genes on sepsis incidence, we constructed an RF prediction model using differentially expressed communication-related genes. RF, an ML method for classification and regression, provides variable importance measures that enhances model interpretability compared with single decision trees. This algorithm is particularly suited for datasets with high-dimensional predictors. For feature selection, we employed SVM-RFE, a sequential backward selection algorithm based on the maximum margin principle of SVM. SVM-RFE iteratively ranks features by their contribution scores, eliminates the least informative features, and retrains the model until the optimal feature subset is identified. Feature genes were selected using SVM-RFE implemented in the e1071 R package.
WGCNA
WGCNs were constructed using the WGCNA R package (v1.72-1; https://cran.r-project.org/web/packages/WGCNA/). Sample clustering dendrograms were first generated to detect and eliminate outliers. WGCNA was then performed on disease group–specific highly expressed genes (|logFC| > 2) and communication-related gene sets to identify co-expression modules. Module eigengenes were correlated with communication-related gene sets and highly expressed gene sets to determine module associations. Modules with higher absolute correlation values were considered biologically significant. The soft-power threshold (β = 6) was specified for network construction, and the minimum module size was set as minModuleSize = 30. Genes meeting the thresholds of gene significance (GS) of >0.6 and module membership (MM) of >0.8 were retained as hub genes.
Hub gene validation and enrichment
Hub genes for sepsis were identified by intersecting candidate genes derived from four independent algorithms: the RF prediction model, SVM-selected feature genes, univariate Cox regression genes, and LASSO-associated prognostic genes. To validate their potential as sepsis biomarkers, diagnostic reliability was first assessed using the AUC. Subsequently, a nomogram incorporating these hub genes was constructed with the rms R package. The nomogram’s predictive accuracy was evaluated via calibration curves, whereas clinical utility was quantified through clinical impact curves and decision curve analysis (DCA).
Communication-related gene subtyping
Consensus clustering was performed using the ConsensusClusterPlus R package (Bioconductor; http://www.bioconductor.org/packages/release/bioc/html/ConsensusClusterPlus.html) based on the expression profiles of communication score module genes. Samples were stratified into distinct subgroups according to module gene expression patterns, with parameters set to 50 replicates (reps = 50) and an 80% resampling rate (pItem = 0.8). To validate cluster robustness, principal component analysis (PCA) was conducted on genome-wide expression data, and results were visualized using ggplot2. Finally, correlations between hub genes and communication-related gene subtypes were analyzed to assess biological relevance
Immune infiltration analysis
To characterize the immune cell infiltration landscape in SICM, the CIBERSORT algorithm (v1.0; https://cibersort.stanford.edu/) was employed to estimate the relative proportions of 22 immune cell subtypes in each sample based on bulk RNA-seq data. The LM22 signature matrix was used as a reference to deconvolute immune cell fractions. Samples with a CIBERSORT output p-value of <0.05 were retained for subsequent analysis to ensure reliable deconvolution results. Differences in immune cell infiltration between SICM and control groups were assessed using the Wilcoxon rank-sum test. To explore the relationship between the identified hub genes (ABLIM1, BCL9L, SMAD3, and DHRS3) and the immune microenvironment, Spearman correlation analysis was conducted between the expression levels of these hub genes and the inferred abundances of specific immune cell populations. This approach enabled a systematic evaluation of immune infiltration patterns and their potential associations with key molecular features in SICM.
Cell culture and lipopolysaccharide (LPS) treatment
In vitro validation was performed using H9c2 rat cardiomyoblasts (CL-0089, Procell; China). Cells were maintained in H9c2-specific complete medium (CM-0089, Procell) at 37°C in a humidified atmosphere with 5% CO2. Upon reaching 80%–90% confluence, cells were subjected to a proinflammatory challenge by introducing LPS (from Escherichia coli O111:B4) at a final concentration of 10 µg/mL, diluted from a stock solution in dimethyl sulfoxide (DMSO). The treatment duration was set for 24 h to model septic stress. Cells in the control group received an equivalent volume of vehicle (DMSO) only.
Mouse model of sepsis-induced cardiac injury
An in vivo model of sepsis was established in 8–10-week-old male C57BL/6 mice. Systemic inflammation and subsequent cardiac injury were induced by a single intraperitoneal injection of LPS (20 mg/kg, dissolved in sterile saline). The control group received an equal volume of saline. Mice were monitored closely for 12 h postinjection. To maintain normothermia and prevent hypothermia, a common comorbidity in murine sepsis models, animals were kept on a heating pad set to maintain a body temperature of 37°C ± 0.5°C. After the 12-h period, mice were humanely euthanized via an overdose of sodium pentobarbital (300 mg/kg, intraperitoneal (i.p.)), and cardiac tissues along with blood samples were collected for subsequent analysis. All animal procedures were conducted in strict accordance with the Guide for the Care and Use of Laboratory Animals (National Institutes of Health (NIH), 8th edition) and were approved by the Institutional Animal Care and Use Committee of Tianjin Medical University General Hospital (Approval ID: IRB2025-DW-94).
RNA isolation and quantitative real-time polymerase chain reaction (qRT-PCR)
Total RNA was extracted from harvested H9c2 cells and mouse cardiac tissue using TRIzol reagent (Invitrogen; USA) following the manufacturer’s protocol. RNA purity and concentration were determined spectrophotometrically. Complementary DNA (cDNA) was synthesized from 1 µg of total RNA using a reverse transcription kit (Takara; Japan). Quantitative PCR was performed on an Applied Biosystems ABI7500 Real-Time PCR System using SYBR® Green Premix Pro Taq HS (Takara; Japan). The thermocycling conditions were as follows: initial denaturation at 95°C for 30 s, followed by 40 cycles of 95°C for 5 s and 60°C for 34 s. The expression levels of target genes (ABLIM1, BCL9L, SMAD3, and DHRS3) were normalized to the endogenous control β-actin, and relative quantification was calculated using the 2−ΔΔCT method. Primer sequences used are listed in Supplementary Table S1 and Supplementary Table S2. All primer sets were validated for amplification efficiency prior to use.
Statistical analysis
All statistical analyses were performed using R software (version 4.2.2) and IBM Statistical Package for Social Sciences SPSS; version 24.0) software. For transcriptomic data, DEGs were identified using the limma R package with thresholds of |log2FC| >1 and adjusted p-value of <0.05 (Benjamini–Hochberg FDR correction). Continuous variables with normal distribution were compared using an unpaired Student’s t-test (for two groups) or one-way analysis of variance (ANOVA) with post hoc Tukey test (for multiple groups). Non-normally distributed data were analyzed using the Wilcoxon rank-sum test (Mann–Whitney U test). Correlation analyses between hub gene expression and immune cell infiltration levels were conducted using Spearman’s rank correlation. Survival differences between risk groups were assessed using Kaplan–Meier curves and the log-rank test. Model performance was evaluated using ROC curves and AUC. For ML models, 10-fold cross-validation was applied to ensure robustness. A two-tailed p-value of <0.05 was considered statistically significant.
Results
Overall experimental design
This study first characterized the cellular composition and metabolic features of the tissue microenvironment in SICM. Subclustering of tissue-infiltrating macrophages and analysis of macrophage–cardiomyocyte communication were performed. Using expression matrices from the GEO database, communication-related genes were screened and compared between sepsis and normal samples. ML algorithms and WGCNA were applied to identify diagnostic biomarkers, followed by functional enrichment analysis, clinical correlation studies, and immune infiltration profiling. Molecular subtyping was conducted based on key genes. Key findings were validated using in vitro and in vivo experiments.
Single-cell analysis of cellular composition and metabolic features
Single-cell transcriptomic data were analyzed to reveal the diversity of cell types in SICM. Quality control was performed, and t-distributed stochastic neighbor embedding (t-SNE) identified eight major cell clusters (Figure 1(a) and (b)). Cell types were annotated using SingleR combined with manual marker-based identification, including adipocytes, fibroblasts, macrophage subsets (Mac1 and Mac2), monocytes, cardiomyocyte subsets (CM1 and CM2), and neutrophils. Metabolic activity across cell clusters was assessed by evaluating gene sets associated with glycolysis (Figure 1(c)), fatty acid metabolism (Figure 1(d)), aspartate metabolism (Figure 1(e)), and lactate metabolism (Figure 1(f)). High glycolytic, aspartate, and lactate metabolic activity was observed, whereas lipid metabolism–related genes were downregulated. Macrophages exhibited elevated lactate metabolism, fibroblasts showed high glycolysis and aspartate metabolism, and cardiomyocytes displayed robust glycolysis and aspartate metabolism.

Landscape analysis of the microenvironment in SICM. (a) Dot plot showing marker gene expression across cell clusters; (b) t-SNE plot displaying eight distinct cell clusters; (c) scatter plot illustrating overall expression patterns of glycolysis-related genes; (d) scatter plot showing expression patterns of fatty acid metabolism–related genes; (e) scatter plot depicting aspartate metabolism–related gene expression; and (f) scatter plot highlighting lactate metabolism–related gene expression. SICM: sepsis-induced cardiomyopathy; t-SNE: t-distributed stochastic neighbor embedding.
Characterization of macrophage subsets and intercellular communication
Tissue-infiltrating macrophages were further subdivided into two distinct subsets (Figure 2(a)). Pseudotime trajectory analysis revealed a hierarchical differentiation continuum between these subsets, with Mac2 representing terminally differentiated macrophages (Figure 2(b)). A heatmap of differentiation trajectory expression profiles demonstrated significantly reduced expression of macrophage markers CD163 and CSF1R in Mac2 (Figure 2(c)). Conversely, heatmaps incorporating senescence-associated markers confirmed elevated expression of senescence-related genes in Mac2 (Figure 2(d) to (g)). Functional enrichment of DEGs classified Mac1 as “functional macrophages,” enriched in pathways including positive regulation of response to external stimulus, cytokine production, negative regulation of intracellular signal transduction, and immune effector processes (Figure 2(h)). In contrast, Mac2 was designated as “senescent macrophages,” showing enrichment in cell migration, regulation of the mitogen-activated protein kinase (MAPK) cascade, apoptotic signaling, vasculature development, and programmed cell death (Figure 2(i)). To investigate macrophage–cardiomyocyte crosstalk, NicheNet analysis predicted ligand–receptor pairs regulating cardiomyocytes (Figure 3(a)). The top 20 macrophage-derived ligands included CEACAM1, EFNA1, FAT1, CXCL1, EFNB2, CCL2, IL34, CXCL9, TGFB3, CCL3, CXCL12, ADAM17, BMP4, SERPING1, PLXNB2, LAMB2, GAS6, TGFB1, COL4A1, and COL5A3. Notably, TGFB1 exhibited the strongest regulatory influence (Figure 3(b)). A total of 339 macrophage–cardiomyocyte communication-related genes (MCCGs) were identified, forming a critical gene set for exploring molecular mechanisms in SICM. CellChat analysis further delineated cytokine interactions and signaling pathways between macrophage subsets and cardiomyocytes. Mac1 showed prominent involvement in transforming growth factor beta (TGF-β) signaling with cardiomyocytes (Figure 3(c)), underscoring its role in immunometabolic modulation within the cardiac microenvironment.
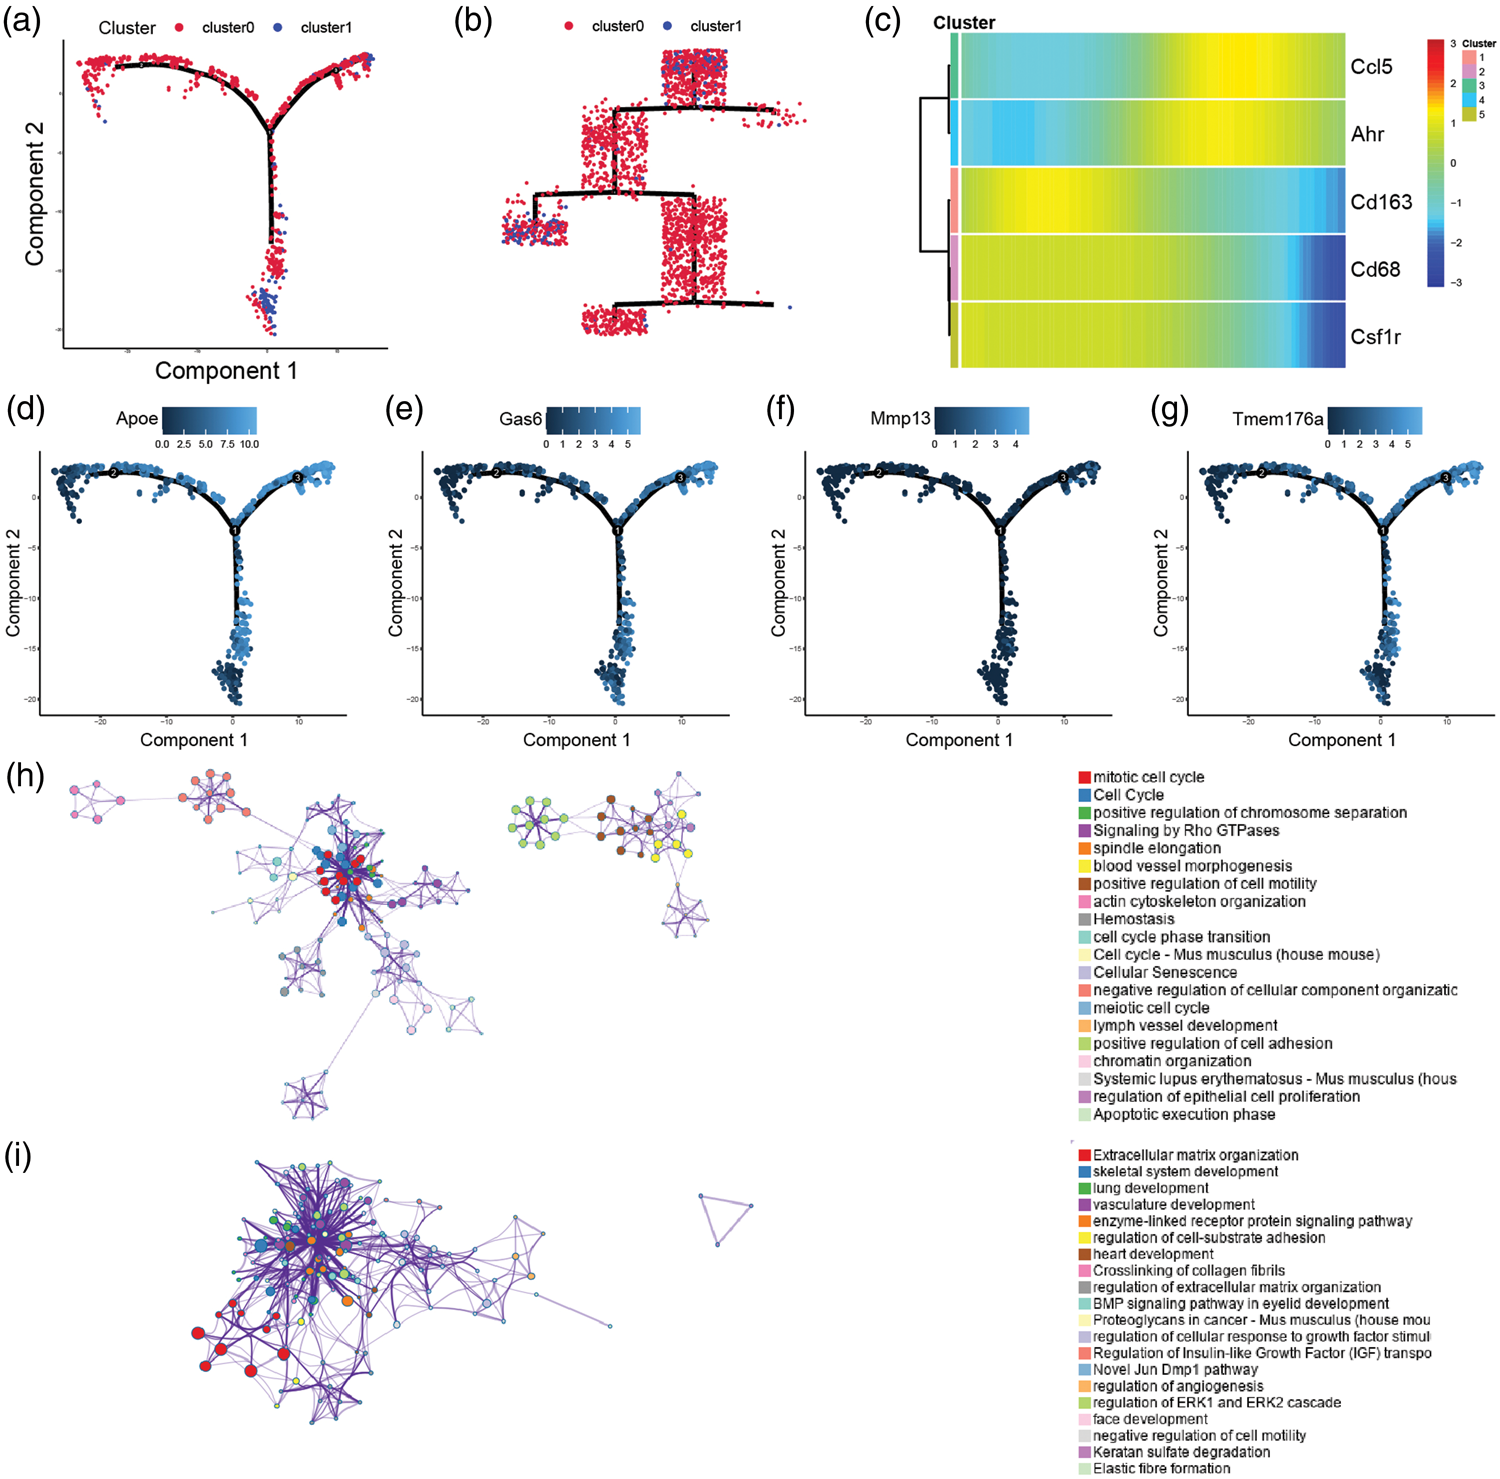
Differentiation characteristics of macrophage subsets. (a–b) Pseudotime trajectory scatter plot showing differentiation states of macrophage subsets; (c) heatmap displaying expression patterns of macrophage marker genes along the pseudotime trajectory; (d–g) pseudotime trajectory scatter plots showing senescence-associated gene expression patterns; (h) GO functional enrichment of marker genes in Cluster 1 (“functional macrophages”); and (i) GO functional enrichment of marker genes in Cluster 2 (“senescent macrophages.”) GO: Gene Ontology.

Macrophage–cardiomyocyte communication analysis. (a) Dot plot of ligand–receptor interactions predicted by NicheNet; (b) regulatory network analysis of top 20 ligands influencing cardiomyocytes; and (c) CellChat-derived signaling pathway analysis, highlighting TGF-β signaling between macrophage subset 1 and cardiomyocytes. TGF-β: transforming growth factor beta.
Expression profiling of communication-related genes in sepsis
Differential expression analysis identified 1455 genes significantly dysregulated in sepsis (478 upregulated and 977 downregulated; |logFC| > 1, p < 0.05), including 93 highly upregulated genes (|logFC| > 2, p < 0.05). To evaluate the impact of communication-related genes, we specifically analyzed their expression patterns. Among these, 53 communication-related genes exhibited significant dysregulation in sepsis, with 23 upregulated and 30 downregulated (|logFC| > 1, p < 0.05; Figure 4(a) and (b)). A co-expression network revealed correlations among these DEGs (Figure 4(c)). Functional enrichment analysis of these genes via GO highlighted the following terms (p < 0.05; Figure 4(d)): BP. Ribosomal RNA (rRNA) metabolic process, noncoding RNA (ncRNA) processing, ribosome biogenesis, rRNA processing, translational initiation, viral gene expression, RNA catabolic process, nuclear-transcribed messenger RNA (mRNA) catabolic process, nonsense-mediated decay, cytoplasmic translation, and signal recognition particle (SRP)-dependent cotranslational protein targeting to membrane; CC. Ribosome, ribosomal subunit, eukaryotic 48S preinitiation complex, cytosolic ribosome, eukaryotic translation initiation factor 3 complex, eukaryotic 43S preinitiation complex, translation preinitiation complex, nucleolar part, large ribosomal subunit, and cytosolic part; MF. Translation factor activity, RNA binding, translation initiation factor activity, structural constituent of ribosome, single-stranded RNA binding, catalytic activity acting on RNA, small nucleolar RNA (snoRNA) binding, telomeric DNA binding, phosphatidylethanolamine binding, ribonuclease activity, and cadherin binding. KEGG pathway analysis further implicated these genes in transcriptional misregulation in cancer and the TGF- β signaling pathway (Figure 4(e)), suggesting their involvement in sepsis-induced immune–metabolic dysregulation and cardiac injury.
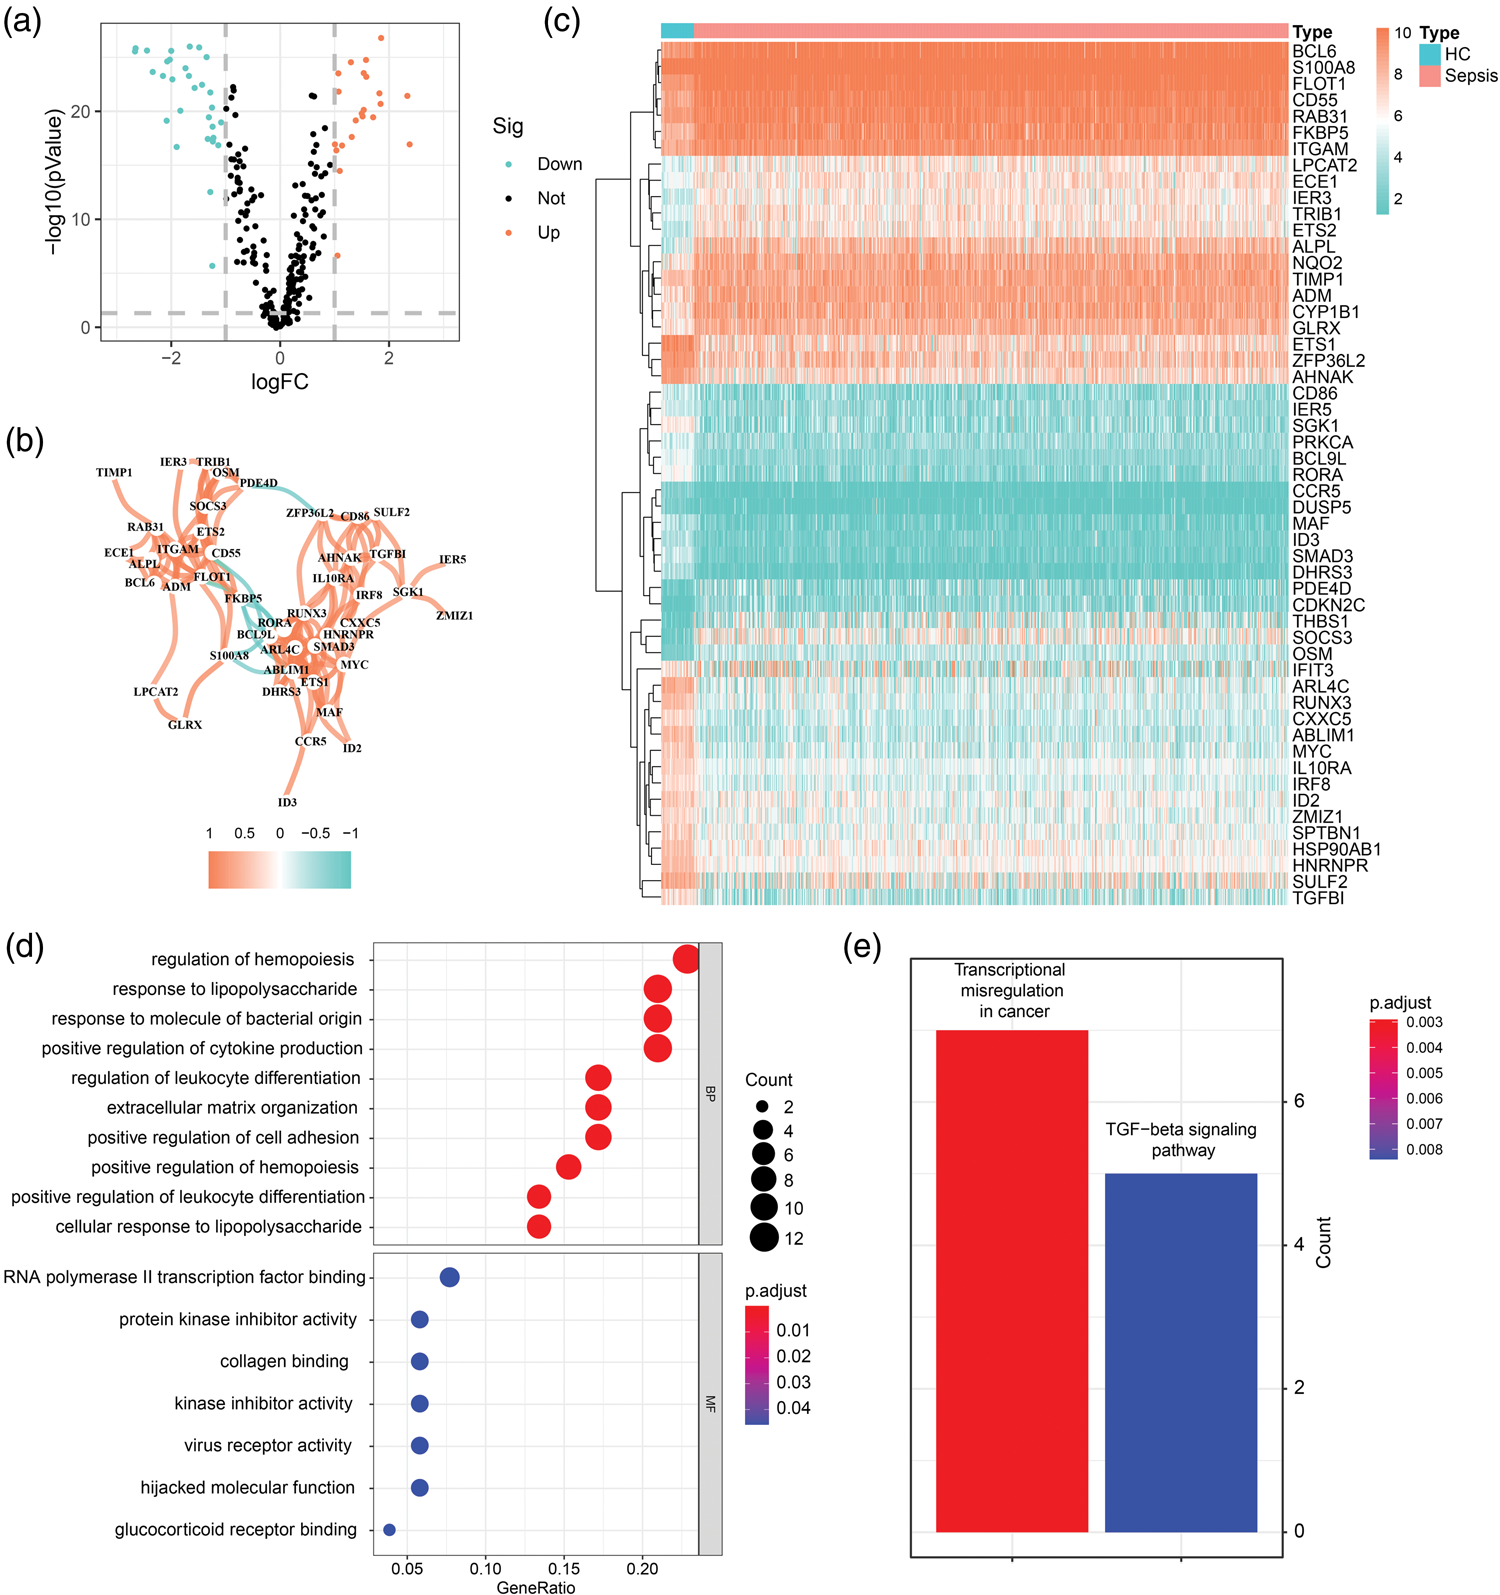
Differential expression and functional enrichment of communication-related genes. (a) Volcano plot of DEGs (|logFC| > 1, p < 0.05); (b) co-expression network of communication-related DEGs (Pearson’s r > 0.4); (c) heatmap of DEGs in sepsis; (d) GO functional enrichment of DEGs (biological processes, cellular components, and molecular functions); and (e) KEGG pathway enrichment of DEGs. DEGs: differentially expressed genes; GO: Gene Ontology; KEGG: Kyoto Encyclopedia of Genes and Genomes; logFC: log2 fold change.
Screening of communication-related genes via ML and WGCNA
To further identify sepsis-associated genes, WGCNA was performed on merged GEO expression profiles. Initial hierarchical clustering generated 18 gene modules (Figure 5(a)), which were reduced to 13 modules after dynamic tree cutting (Figure 5(b)). Module–trait association analysis revealed that the MEblack module exhibited the strongest negative correlations with communication-related gene scores (cor = −0.91, p = 4e − 307) and sepsis status (cor = −0.57, p = 4e − 69) (Figure 5(c)). Consequently, the MEblack module was selected for further investigation. Within this module, 224 hub genes meeting thresholds of GS (>0.6) and MM (>0.8) were identified (Figure 5(d)). Functional enrichment of MEblack module genes highlighted pathways related to ribosome biogenesis, RNA metabolism, and immune regulation (Figure 5(e) and (f)). Consensus clustering was then applied to stratify sepsis patients into communication-related subtypes. At k = 2, matrix heatmaps showed clear separation between subtypes (Figure 5(g)), supported by minimal cumulative distribution function (CDF) curve slopes (Figure 5(h)). Analysis of delta area scores for k = 2–9 indicated stabilization of cluster stability beyond k = 5; however, heatmap resolution and CDF slopes deteriorated, favoring k = 2 as optimal (Figure 5(i)). Accordingly, sepsis patients were classified into two distinct subtypes: Subtype 1 (n = 324) and Subtype 2 (n = 478). PCA confirmed robust separation between subtypes (Figure 5(j)), validating the biological relevance of the communication-related gene clusters.

WGCNA and molecular subtyping based on communication-related genes. (a) Average hierarchical clustering of gene modules; (b) dynamic tree cut to refine modules; (c) module–trait correlations between gene modules, sepsis status, and communication-related gene scores; (d) hub gene screening (GS > 0.6, MM > 0.8) in the MEblack module; (e–f) functional enrichment of MEblack module genes; (g) consensus clustering matrix heatmap (k = 2); (h) CDF curve for cluster stability; (i) delta area score analysis for optimal cluster number determination; and (j) PCA validation of molecular subtyping. WGCNA: weighted gene co-expression network analysis; GS: gene significance; MM: module membership; CDF: cumulative distribution function; PCA: principal component analysis.
Construction of a prognostic model based on communication-related genes
Univariate Cox regression analysis of communication-related gene expression identified genes significantly associated with prognosis (p < 0.05) (Figure 6(a)). LASSO regression further refined the prognostic gene signature, selecting 11 key genes: ITGAM, NQO2, LPCAT2, RUNX3, ABLIM1, THBS1, TGFBI, BCL9L, CDKN2C, SMAD3, and DHRS3 (Figure 6(b) and (c)). A risk score for each patient was calculated using the prognostic significance index (PSI) values of these genes. Patients were stratified into high-risk (score > 0.081, median cutoff) and low-risk groups. ROC curve analysis confirmed the model’s diagnostic efficacy for sepsis (AUC = 0.724; Figure 6(d)). Clinical correlation analysis revealed significant associations between LASSO-derived risk scores and age, sex, and disease stage (Figure 6(e) to (g)). Kaplan–Meier survival curves demonstrated markedly worse survival outcomes in the high-risk group than in the low-risk group (Figure 6(h)). A heatmap illustrated the differential expression patterns of the 11 prognostic genes across risk subgroups (Figure 6(i)), whereas risk curves (Figure 6(j)) and scatter plots (Figure 6(k)) highlighted the cumulative impact of these genes on overall survival. Elevated risk scores correlated with higher mortality rates, consistent with the Kaplan–Meier results. To further validate the predictive power of communication-related genes, sepsis prediction models were constructed using RF and SVM-RFE algorithms (Figure 7(a)). Model stability was achieved when the number of trees reached 500, with an error rate of 0.10, indicating accurate classification of samples by the RF algorithm. A predictive model for differentially expressed communication-related genes was established using RF, as shown in Figure 7(b). This model employed the Gini coefficient to prioritize key risk genes. In sepsis, the top risk genes derived from differentially expressed communication-related genes, ranked in descending order of importance as follows: S100A8, HNRNPR, BCL9L, ABLIM1, ETS1, ARL4C, SMAD3, CD55, SGK1, IL10RA, DHRS3, FLOT1, ZFP36L2, OSM, RUNX3, SOCS3, ZMIZ1, RAB31, TGFBI, BCL6, CCR5, CXXC5, SULF2, ID3, GLRX, ITGAM, MYC, IER5, CYP1B1, and IRF8. Among these, S100A8, HNRNPR, BCL9L, and ABLIM1 genes exhibited Gini coefficients exceeding 4 and were identified as primary candidates (Figure 7(b)). SVM-RFE minimized the cross-validation error rate to 0.0495, narrowing down 37 communication-related genes to a refined subset (Figure 7(b)). Intersection of genes selected by RF, SVM-RFE, univariate Cox regression (20 genes), and LASSO regression (11 genes) yielded 4 hub genes: ABLIM1, BCL9L, SMAD3, and DHRS3 (Figure 7(c)). A nomogram integrating these genes was developed to predict sepsis risk (Figure 7(d)). Calibration curves confirmed strong agreement between predicted and observed outcomes (Figure 7(e)), whereas clinical impact curves demonstrated the model’s utility in identifying high-risk patients (Figure 7(f)). DCA further validated the nomogram’s superior clinical predictive performance over traditional metrics (Figure 7(g)). Differential expression analysis confirmed significant upregulation or downregulation of ABLIM1, BCL9L, SMAD3, and DHRS3 genes between sepsis and control groups (Figure 8(a) to (d)). Collectively, these findings establish ABLIM1, BCL9L, SMAD3, and DHRS3 genes as pivotal biomarkers for SICM, with robust diagnostic and prognostic relevance.

Prognostic analysis of communication-related genes. (a) Univariate Cox regression analysis of prognostic genes (p < 0.05); (b) LASSO coefficient profiles; (c) cross-validation (cvfit) for optimal λ selection; (d) ROC curve evaluating diagnostic accuracy (AUC = 0.724); (e–g) clinical correlations of risk scores with age, sex, and disease stage; (h) Kaplan–Meier survival curves for high- vs. low-risk groups; (i) heatmap of prognostic gene expression across risk groups; (j) risk score distribution curve; and (k) survival status scatter plot. LASSO: Least Absolute Shrinkage and Selection Operator; ROC: receiver operating characteristic; AUC: area under the curve.

Machine learning-based identification of hub communication-related genes. (a) RF-based ranking of key genes by Gini coefficient; (b) SVM-RFE cross-validation analysis (minimal error rate = 0.0495); (c) venn diagram intersecting genes from RF, SVM-RFE, Cox, and LASSO analyses; (d) nomogram model integrating hub genes (ABLIM1, BCL9L, SMAD3, and DHRS3); (e) calibration curve for nomogram validation; (f) clinical impact curve; and (g) DCA of the nomogram. RF: random forest; SVM-RFE: Support Vector Machine Recursive Feature Elimination; LASSO: Least Absolute Shrinkage and Selection Operator; DCA: decision curve analysis.

Prognostic value and expression validation of hub genes. (a) ROC curve assessing diagnostic performance of hub genes; (b) Kaplan–Meier survival analysis based on hub gene risk scores; (c) boxplots showing differential expression of hub genes between sepsis and controls; (d) relative expression of hub genes (ABLIM1, BCL9L, SMAD3, and DHRS3) in control and LPS-induced H9c2 cells, determined by qRT-PCR. Results are from three independent biological replicates (n = 3), each assayed in triplicate. ****p < 0.0001 vs. control; and (e) relative expression of hub genes (ABLIM1, BCL9L, SMAD3, and DHRS3) in a murine model of sepsis-induced cardiac injury, as determined by qRT-PCR. Results are from six individual mice per group (n = 6), each assayed in triplicate. ****p < 0.0001 vs. control. ROC: receiver operating characteristic; qRT-PCR: quantitative real-time polymerase chain reaction; LPS: lipopolysaccharide.
Validation of hub genes in prognostic modeling
Risk scores for each patient were calculated based on the expression levels of the key genes. Patients with risk scores above the median were assigned to the high-risk group, whereas the remaining patients were classified into the low-risk group. The ROC curve (Figure 8(a)) confirmed the model’s robust discriminative capacity in sepsis. Kaplan–Meier survival analysis revealed significantly higher survival rates in the low-risk group compared with the high-risk group (Figure 8(b)). Boxplots illustrated distinct expression patterns of key genes across risk subgroups (Figure 8(c)). qRT-PCR analysis of hub genes in cardiomyocytes and cardiac tissue showed that, compared with the control group, the expression of ABLIM1, BCL9L, SMAD3, and DHRS3 genes was significantly decreased in the experimental group (p < 0.0001; Figure 8(d) and (e)). Finally, drug sensitivity analysis identified potential small-molecule therapeutics targeting these key regulatory genes (Supplementary Figure S1).
Immune infiltration features and correlation with SICM hub genes
Analysis of immune cell infiltration revealed significantly elevated levels of monocytes, M0 macrophages, M1 macrophages, and neutrophils in sepsis patients compared with those in controls (Figure 9(a)). Correlation analysis further identified significant negative associations between M1 and M2 macrophage populations and the four hub genes, ABLIM1, BCL9L, SMAD3, and DHRS3 (Figure 9(b)).

Immune infiltration features and correlations with SICM hub genes. (a) Bar plot comparing immune cell infiltration between SICM and control samples and (b) lollipop plot illustrating correlations between hub genes and immune cell subsets (e.g. macrophages and T cells). SICM: sepsis-induced cardiomyopathy.
Discussion
SICM represents a critical complication of sepsis, characterized by acute cardiac dysfunction and high mortality. Despite advances in understanding systemic inflammation and mitochondrial dysfunction in sepsis, the interplay between immune cell dynamics, metabolic reprogramming, and myocardial injury remains poorly defined. In this study, we integrated single-cell transcriptomics, bulk RNA-seq, ML, and systems biology to elucidate the immune–metabolic landscape of SICM, identifying macrophage heterogeneity, dysregulated intercellular communication, and hub genes that drive disease progression.
Previous studies 15 primarily focused on sepsis itself, aiming to identify hub genes related to sepsis diagnosis and prognosis using bioinformatics approaches. In contrast, our study specifically investigates SICM, providing an organ-focused perspective. Single-cell analysis revealed two functionally distinct macrophage subsets within the SICM microenvironment: functional macrophages (Mac1) and senescent macrophages (Mac2). Pseudotime trajectory and senescence marker analysis positioned Mac2 as a terminally differentiated population with diminished canonical macrophage markers and elevated senescence-associated secretory phenotype (SASP) factors. This observation aligns with recent studies implicating macrophage senescence in chronic inflammatory diseases, where SASP factors such as interleukin-6 (IL-6) and TGF-β perpetuate tissue damage. 16 In SICM, Mac2’s enrichment in apoptotic signaling (regulation of programmed cell death) and migratory pathways (positive regulation of cell migration) suggests a dual role: promoting fibrosis via fibroblast activation while impairing reparative immune responses. Conversely, Mac1’s association with cytokine production (positive regulation of cytokine production) and immune effector processes (regulation of immune effector process) underscores its contribution to early hyperinflammation, a hallmark of septic shock.
Previous studies have demonstrated that in SICM, macrophages promote cardiomyocyte apoptosis and oxidative stress responses via the Toll-like receptor 9 (TLR9) pathway. 17 Macrophages also contribute to cardiac remodeling and dysfunction by secreting inflammatory cytokines and promoting fibrosis. 18 Notably, metabolic profiling revealed elevated lactate and aspartate metabolism in macrophages and cardiomyocytes. 19 Lactate, traditionally considered a metabolic waste product, may act as a signaling molecule in SICM. Macrophage-derived lactate, transported via monocarboxylate transporters (MCTs), could inhibit cardiomyocyte histone deacetylases (HDACs), thereby altering epigenetic landscapes to favor proinflammatory gene expression. 20 Similarly, aspartate metabolism, essential for the malate–aspartate shuttle, may be co-opted to sustain nicotinamide adenine dinucleotide (NAD+) regeneration in energy-deprived cardiomyocytes. 21 These findings align with emerging paradigms of immunometabolism, where metabolic intermediates function as rheostats of immune cell function and tissue repair. Our findings on immune–cardiomyocyte crosstalk in SICM provide a distinct perspective from recent studies. 22 Although previous work has offered a broad, system-level analysis of immune dysregulation in sepsis, primarily linking cuproptosis genes to T-cell function and general immune cell infiltration in peripheral blood mononuclear cells (PBMCs), our study presents a targeted, cardiac-specific investigation. 22 We specifically delineate a novel, senescence-centric axis of crosstalk mediated by a unique subset of cardiac macrophages (Mac2). These senescent macrophages exert detrimental effects not through the cuproptosis pathway or acute inflammatory signaling but through DHRS3-mediated metabolic dysregulation, which likely disrupts metabolic support and paracrine signaling critical for cardiomyocyte survival and function in the stressed heart. This shift from systemic immune–metabolic changes in sepsis to a local mechanism of senescence-associated metabolic dysfunction within the cardiac microenvironment highlights a previously underappreciated pathway driving SICM progression.
The septic myocardium exists in a state of bioenergetic crisis, compounded by macrophage-derived signals that disrupt cardiomyocyte homeostasis. Our results demonstrate that cardiomyocytes in SICM exhibit heightened glycolytic flux and aspartate metabolism, representing a compensatory response to mitochondrial dysfunction. Although glycolysis provides rapid adenosine triphosphate (ATP) generation, its increased reliance exacerbates intracellular acidosis, impairing calcium handling and contractility. 23 This metabolic shift is likely driven by macrophage-secreted ligands, such as CXCL12 and CCL2, which not only recruit neutrophils but also activate cardiomyocyte stress pathways via phosphatidylinositol 3-kinase/protein kinase B (PI3K/Akt) and MAPK signaling. 24
TGF-β signaling emerged as a key disruptor of cardiomyocyte metabolism. 25 Activation of the TGF-β pathway stimulates fibroblasts, promotes their proliferation, and induces noncanonical signaling, contributing to cardiac fibrosis. 26 Inhibition of TGF-β in cardiomyocytes prevents maladaptive remodeling, affecting pathological hypertrophy or dysfunction. 27 Targeting TGF-β signaling therefore holds promise as an antifibrotic therapeutic strategy. 28 During chronic inflammation and fibrosis, M2 macrophages serve as a primary source of TGF-β1, with this cell type closely linked to tissue repair and fibrogenesis.29,30 TGF-β-induced macrophage phenotypes increase expression of coagulation factors, enhancing thrombosis and correlating with reduced survival in sepsis. 31 Although TGF-β promotes glycolysis, it simultaneously suppresses proinflammatory cytokine production and drives macrophage polarization toward an M2-like phenotype, thereby reducing inflammation and enhancing phagocytic activity. 32 Our study identified a subpopulation of nonsenescent functional macrophages that primarily communicates with cardiomyocytes via TGF-β1, potentially regulating the expression of disease-related genes ABLIM1, BCL9L, SMAD3, and DHRS3 in cardiomyocytes and thereby contributing to the exacerbation of SICM. Notably, GO enrichment of communication-related genes revealed upregulation of ribosome biogenesis and translational initiation in SICM. Although increased protein translation may initially support cellular stress adaptation, prolonged activation likely induces endoplasmic reticulum (ER) stress. ER stress not only triggers apoptosis but also amplifies inflammation through inositol-requiring enzyme 1-alpha (IRE1α)-dependent c-Jun N-terminal kinase (JNK) activation. This mechanism may account for the elevated expression of proapoptotic genes, including BAX and caspase-3 (CASP3), observed in high-risk patients in our prognostic model.
Integrative analysis using ML and WGCNA prioritized four hub genes, including ABLIM1, BCL9L, SMAD3, and DHRS3, as central drivers of SICM pathogenesis. Each gene intersects distinct but complementary pathways. ABLIM1 (actin-binding LIM 1) is a LIM domain protein that binds to actin, regulates the cytoskeleton, and participates in diverse BP. 33 BCL9L is a transcriptional coactivator primarily involved in the Wnt/β-catenin signaling pathway, with critical roles in multiple cellular processes and diseases. Inhibition of BCL9L has been shown to prevent macrophage polarization from M0 to M2 phenotypes. 34 Pathway analysis revealed enrichment of fatty acid oxidation (FAO) in the low BCL9L expression group, suggesting that BCL9L deficiency may promote macrophage polarization toward a proinflammatory phenotype. DHRS3 (dehydrogenase/reductase 3) regulates retinoic acid synthesis and metabolism, with established roles in lipid droplet formation and accumulation. 35 This enzyme catalyzes the reduction of retinaldehyde to retinol, thereby finely controlling intracellular retinoic acid levels.36,37 Retinoic acid is a potent signaling molecule that plays a key role in immune regulation and cell differentiation.36,37 In the context of immunometabolism, DHRS3 directly links metabolic enzyme activity to the regulation of immune signaling, making it a representative immunometabolism-associated gene. Our study found that DHRS3 is dysregulated in SICM, suggesting that sepsis disrupts retinoic acid metabolic homeostasis in the local cardiac microenvironment, thereby affecting the function of macrophages and cardiomyocytes. This provides a novel metabolic perspective on SICM pathogenesis, which has not been thoroughly explored in previous studies. SMAD3 is a central intracellular signal transducer in the TGF-β pathway. 38 It transmits TGF-β signals from the cell surface to the nucleus, regulating specific gene activities and influencing diverse cellular functions. SMAD3 critically modulates macrophage function by mediating acquisition of a phagocytic phenotype and promoting anti-inflammatory polarization, thereby protecting the infarcted heart from maladaptive remodeling. 39 Our single-cell communication analysis (CellChat) revealed that functional macrophages (Mac1) primarily communicate with cardiomyocytes via the TGF-β signaling pathway. This suggests that macrophage-derived TGF-β ligands, such as TGFB1, may directly modulate cardiomyocyte metabolism, apoptosis, and fibrosis by activating SMAD3 signaling within cardiomyocytes, thereby contributing to cardiac injury and dysfunction in SICM. SMAD3 serves as a key mediator linking immune cell activation to intrinsic pathological changes in cardiomyocytes, representing a novel and specific target for understanding SICM mechanisms.
TGF-β1 suppresses macrophage activation via SMAD3, and SMAD3 signaling is closely associated with macrophage phagocytic capacity, as deficiency of SMAD3 impairs phagocytosis. SMAD3 also promotes cardiomyocyte apoptosis and exacerbates dilated remodeling following myocardial infarction. 40 Additionally, TGF-β1 positively influences rat cardiomyocyte hypertrophy, with SMAD3 potentially mediating the pathological progression of hypertrophy. 40 In this study, we integrated four ML algorithms with myocardial-specific datasets to identify SMAD3 and DHRS3 as novel biomarkers of SICM. Our findings shift the paradigm of SICM from a purely inflammatory disorder to a maladaptive interplay between immune senescence, metabolic reprogramming, and fibrotic signaling.
Moreover, the metabolic vulnerabilities identified in this study, particularly lactate and aspartate dysregulation, present potential targets for intervention. Dichloroacetate, a pyruvate dehydrogenase kinase inhibitor, may enhance mitochondrial glucose oxidation in cardiomyocytes, whereas aspartate supplementation could restore NAD+ homeostasis. 41 Such strategies, combined with immunomodulatory approaches, may address the multifactorial pathophysiology of SICM.
This study has several limitations. First, reliance on transcriptomic data from heterogeneous sepsis cohorts may obscure stage-specific mechanisms. Second, the primary bulk transcriptomic dataset was derived from PBMCs rather than cardiac tissue, and the single-cell data, although from myocardial tissue, originated from a murine model. Currently, sufficient human cardiac single-cell or bulk RNA-seq data from sepsis and healthy controls are unavailable. Finally, spatial transcriptomics could provide subcellular resolution of macrophage–cardiomyocyte interactions, clarifying niche-specific signaling pathways.
Conclusion
This study establishes a macrophage-centric paradigm of SICM pathogenesis, in which metabolic reprogramming, immune senescence, and TGF-β-mediated crosstalk collectively impair cardiac function. The hub genes ABLIM1, BCL9L, SMAD3, and DHRS3 act as biomarkers and potential therapeutic targets, providing a precision medicine framework for SICM. Future research should validate these targets in preclinical models and investigate combinatorial strategies to concurrently modulate immune senescence and metabolic dysfunction in the septic heart. Additionally, these hub genes may inform the development of diagnostic panels for early SICM detection and facilitate testing of immune–metabolic-targeted interventions to improve clinical outcomes.
Supplemental Material
sj-pdf-1-imr-10.1177_03000605251395584 - Supplemental material for Identification of immunometabolism-associated genes and immune infiltration in sepsis-induced cardiomyopathy using integrated bioinformatics and machine learning approaches
Supplemental material, sj-pdf-1-imr-10.1177_03000605251395584 for Identification of immunometabolism-associated genes and immune infiltration in sepsis-induced cardiomyopathy using integrated bioinformatics and machine learning approaches by Chongzhe Pei, Hongmei Zheng, Kuan Yang and Ningning Song in Journal of International Medical Research
Supplemental Material
sj-pdf-2-imr-10.1177_03000605251395584 - Supplemental material for Identification of immunometabolism-associated genes and immune infiltration in sepsis-induced cardiomyopathy using integrated bioinformatics and machine learning approaches
Supplemental material, sj-pdf-2-imr-10.1177_03000605251395584 for Identification of immunometabolism-associated genes and immune infiltration in sepsis-induced cardiomyopathy using integrated bioinformatics and machine learning approaches by Chongzhe Pei, Hongmei Zheng, Kuan Yang and Ningning Song in Journal of International Medical Research
Footnotes
Acknowledgments
We acknowledge the GEO database for providing their platforms and contributors for uploading their meaningful datasets. We express appreciation to the participants in this study for their support and cooperation. We additionally value the valuable insights and suggestions from the editors and reviewers.
Author contributions
CZP: Supervision, conceptualization, methodology, and writing (original draft). KY: Formal analysis and validation (in vitro experiments). NNS: Data curation and visualization. HMZ: Supervision, funding acquisition, and writing (review and editing). All authors have read and approved the final manuscript.
Data availability statement
All datasets used in this study are publicly available in the Gene Expression Omnibus (GEO) database: GSE190856 (link: https://www.ncbi.nlm.nih.gov/geo/query/acc.cgi?acc=GSE190856)
42
and GSE65682 (link: ![]() ).
43
The code for bioinformatics analysis is available on GitHub. The raw data of in vivo and in vitro experiments are available from the corresponding author upon reasonable request.
).
43
The code for bioinformatics analysis is available on GitHub. The raw data of in vivo and in vitro experiments are available from the corresponding author upon reasonable request.
Declaration of conflicting interests
The authors declare no potential conflicts of interest with respect to the research, authorship, and/or publication of this article.
Ethics approval statements
Protocols for animal experiments were approved by the Institutional Animal Care and Use Committee of Tianjin Medical University General Hospital (Approval ID: IRB2025-DW-94) and conducted in compliance with the National Institutes of Health guidelines for the care and use of laboratory animals (8th edition).
Funding
The National Natural Science Foundation of China (Grant No. 82100352 and 82202212), the Tianjin Medical University General Hospital “New Century Talents” Cultivation Project (Grant No. XSJ-2021-02), and the Tianjin Medical University General Hospital Young and Middle-Aged Scientific Research Cultivation Fund (Grant No. 303078100501) funded this research.
Supplementary material
Supplemental material for this article is available online.
References
Supplementary Material
Please find the following supplemental material available below.
For Open Access articles published under a Creative Commons License, all supplemental material carries the same license as the article it is associated with.
For non-Open Access articles published, all supplemental material carries a non-exclusive license, and permission requests for re-use of supplemental material or any part of supplemental material shall be sent directly to the copyright owner as specified in the copyright notice associated with the article.