
Abstract
Objective
This study compared the pharmacokinetic/pharmacodynamic properties of extended infusion and continuous infusion of imipenem at equivalent daily doses in a real-world setting.
Methods
In this prospective observational study, physicians adjusted imipenem doses empirically based on renal function and infection severity. Plasma concentrations were quantified via liquid chromatography–mass spectrometry, and pharmacokinetic parameters were calculated. Pharmacokinetic/pharmacodynamic targets were defined as 100% of the dosing interval with free drug concentrations above the minimum inhibitory concentration (MIC) and four times above the MIC, with MICs set at 1, 2, 4, 8, and 16 mg/L.
Results
The analysis included 20 patients with extended infusion (0.5 g q6h/q8h or 1 g q8h) and 20 with continuous infusion (matched doses). Continuous infusion showed lower trough concentration variability (coefficient of variation: 25.5% vs. 67.3%) and significantly higher area under the curve and minimum plasma concentration values at all doses (padj ≤ 0.002). Continuous infusion achieved superior target attainment: for 100% fT > MIC, significant differences were observed at MICs ≥4 mg/L (p = 0.01). For 100% fT > 4× MIC, continuous infusion outperformed extended infusion starting from MICs ≥1 mg/L (p < 0.01), with 3.0 g/day continuous infusion achieving 100% attainment at an MIC of 4 mg/L.
Conclusions
Continuous infusion demonstrated superior pharmacokinetic/pharmacodynamic target attainment than extended infusion at equivalent doses, particularly for pathogens with an MIC ≥4 mg/L or cases requiring aggressive targets. Continuous infusion may benefit patients with elevated creatinine clearance, those with infections caused by pathogens with high MIC, and those requiring aggressive pharmacodynamic target attainment.
Keywords
Introduction
Imipenem, a broad-spectrum carbapenem antibiotic, demonstrates potent antimicrobial activity with high stability against β-lactamases. It exhibits strong efficacy against most gram-positive and gram-negative bacteria. 1 In critically ill patients, imipenem is commonly administered for both empirical and targeted treatment of complex mixed infections and multidrug-resistant bacterial infections.2,3 As a water-soluble compound, imipenem demonstrates approximately 20% protein binding, with approximately 70% of the unchanged drug eliminated renally. 4 Critically ill patients exhibit complex pathophysiological changes, including increased apparent volume of distribution (Vd) due to capillary leakage, changes in protein binding caused by hypoalbuminemia, and modifications in hepatic and renal functions, as well as the use of extracorporeal life-support devices. 5 These factors collectively contribute to substantial variability in imipenem’s pharmacokinetics (PK).
The clinical efficacy of imipenem, a time-dependent antibiotic, is strongly correlated with the percentage of time for which free plasma concentrations exceed the minimum inhibitory concentration (MIC) (%fT >MIC). 6 Typically, when %fT > MIC reaches 40%–70%, imipenem exhibits bactericidal effects. 7 However, recent evidence suggests that critically ill patients may require 100% fT > 1–4× MIC for optimal efficacy. 3 Compared with the general population, critically ill patients exhibit greater variability in imipenem PK and more frequent infections with drug-resistant bacteria. The conventional dosing regimen provided in the drug label is based on PK data from healthy volunteers. Therefore, administering standard doses to critically ill patients may fail to achieve the target PK/pharmacodynamic (PD) thresholds. The development of more precise imipenem treatment regimens for critically ill patients has long been a focal point of clinical research.
Current guidelines8,9 and clinical studies 10 recommend prolonged β-lactam infusion (either extended infusion (EI) or continuous infusion (CI)) in critically ill patients to optimize PK/PD target attainment and improve clinical outcomes. Existing research 11 has employed Monte Carlo models to simulate the target attainment probability of imipenem CI and intermittent infusion under various dosing regimens against different pathogens. Compared with intermittent infusion of 4 g/day (d), CI of 3 g/d showed better probability of target attainment (PTA) for 100% fT > MIC, although patients with high MIC values may fail to reach PK/PD targets. However, due to concerns about imipenem’s stability at room temperature, clinical practice often favors EI over CI. No studies have yet evaluated whether the PK performance of imipenem CI in critically ill patients aligns with model simulation results. Furthermore, no direct comparisons exist between CI and EI strategies under equivalent daily doses to determine the superior approach in terms of PK/PD target attainment in critically ill patients.
This study aimed to compare CI and EI strategies at equivalent daily doses and evaluate their effects on imipenem PK in critically ill patients to identify the optimal administration method based on PK/PD principles.
Materials and methods
Study design and settings
The study was conducted in accordance with the ethical principles of the Declaration of Helsinki of 1975, as revised in 2024. This single-center, prospective observational study enrolled adult critically ill patients who received intravenous imipenem/cilastatin in the intensive care unit (ICU) between March 2024 and November 2024. Informed consent was obtained from all participants or their legally authorized representatives. All patient data were deidentified to ensure confidentiality, and the study reporting followed the Strengthening the Reporting of Observational Studies in Epidemiology (STROBE) guidelines. 12
The inclusion criteria were as follows: (a) empirical or targeted use of imipenem/cilastatin for treatment; (b) consideration of 2-h EI or CI of imipenem/cilastatin therapy; and (c) age ≥18 years, with no restrictions on sex, weight, or primary disease. The exclusion criteria were as follows: (a) known history of allergy to carbapenems; (b) plasma concentration of imipenem failed to reach steady state or discontinuation of medication before the last blood sample collection (EI < 4 doses, CI < 48 h); (c) changes in creatinine clearance rate (CLCr) >30 mL/min/1.73 m2 during blood sample collection or ongoing intermittent blood purification or peritoneal dialysis; (d) daily imipenem dose of <1500 mg (all dosing in this study is expressed in terms of imipenem dose); (e) dosing regimens not conforming to the included regimens in this study (Table 1); (f) pregnant or lactating women; and (g) history of epilepsy or central nervous system diseases.
Dosage regimen of imipenem.

Dosage regimen
Physicians determined the imipenem dosage and administration method for each patient based on renal function and infection severity. Researchers limited their role to sample collection and did not influence clinical treatment decisions. All patients received imipenem through central venous catheters using automated high-precision infusion pumps. The reconstituted imipenem solution was maintained at 21°C (ICU room temperature) during infusion. Detailed dosing regimens for different daily doses and administration methods are presented in Table 1.
Blood sample collection and measurement
In the EI group, 2 mL of peripheral blood was collected before the fifth administration and at 1.0, 2.0, 2.5, 4.0, and 6.0/8.0 h after administration (trough concentrations were obtained before the next dose according to the dosing interval). In the CI group, 2 mL of peripheral blood was collected before CI and at 2, 5, 16, 24, 40, and 48 h after continuous infusion. All blood samples were collected in 2-mL ethylenediaminetetraacetic acid (EDTA) anticoagulant tubes. Within 1 h of sampling, the samples were centrifuged at 3000 r/min for 10 min to separate the plasma, which was then diluted in a 1:1 ratio with 0.2 mol/L 3-(N-morpholino)propanesulfonic acid buffer (pH 6.8) and stored at −80°C until analysis. The PK analysis focused exclusively on imipenem because cilastatin lacks direct antimicrobial activity. Prior to the clinical study, a specifically validated liquid chromatography–tandem mass spectrometry (LC–MS/MS) method 13 was used to determine imipenem concentrations to ensure the accuracy and precision of drug concentration measurements in this matrix.
Clinical data collection
Demographic, clinical, pharmacological, and laboratory data were collected from the patients’ medical records. The Acute Physiology and Chronic Health Evaluation (APACHE) II score and Sequential Organ Failure Assessment (SOFA) score were calculated for each patient to assess the disease severity. These evaluations were performed within 24 h of the patients’ admission to the ICU.
Data processing
All statistical analyses were performed using SPSS (version 26.0; IBM Corp.). The normality of continuous data was assessed using the Kolmogorov–Smirnov test. Normally distributed data were expressed as mean ± standard deviation (SD) and compared between multiple groups using one-way analysis of variance (ANOVA). If the ANOVA results indicated a significant intergroup difference, post-hoc pairwise comparisons were conducted with Bonferroni correction. Non-normally distributed data were presented as median (25th and 75th percentiles) values and were analyzed using the Kruskal–Wallis H test. Categorical variables were expressed as numbers (percentages) and compared using the chi-square test or Fisher’s exact test, as appropriate. A two-sided p value <0.05 was considered statistically significant.
The PK modeling used in our study employed both mono- and bi-compartmental models available in Phoenix WinNonlin, version 8.1 (Certara, Princeton, NJ, USA). Model selection and discrimination were conducted by evaluating the Akaike Information Criterion (AIC), with the model exhibiting the lowest AIC value being considered the best fit for the data. The software was utilized to calculate relevant PK parameters.
For critically ill patients, the recommended PK/PD target for imipenem is 100% ƒT > 1–4× MIC. 6 Based on the Clinical and Laboratory Standards Institute (CLSI) guidelines, 14 the MIC breakpoints for Enterobacteriaceae were set at ≤1 mg/L, while those for Pseudomonas aeruginosa and Acinetobacter baumannii were set at ≤2 mg/L. In this study, 42.5% of patients received empirical treatment without MIC determination. Therefore, we referred to the method suggested in the literature and used MIC values of 1, 2, 4, 8, and 16 µg/mL to calculate the PK/PD indices. The plasma protein-binding rate of imipenem is approximately ≤20%. 4 As a conservative approach, we assumed a fixed protein binding of 20% in our study. The PTA was simulated using individual patient PK data to account for interindividual variability.
Results
Study population characteristics
During the study period, 64 patients were evaluated for imipenem EI; however, 24 were excluded because they did not meet the inclusion criteria. Physicians empirically determined the daily imipenem dose based on renal function and infection severity. Ultimately, 20 patients each were enrolled in the EI and CI groups (Figure 1). All CI group patients had received ≥3 intermittent doses at the same daily dose before transitioning to CI. In contrast, the EI group included patients who had either switched from intermittent infusion to EI or had initiated EI directly. According to the daily dosing regimen, the EI group comprised patients receiving imipenem at doses of 1.5 g/d (0.5 g every 8 h) (n = 5), 2.0 g/d (0.5 g every 6 h) (n = 8), and 3.0 g/d (1 g every 8 h) (n = 7), while the CI group included patients receiving imipenem at doses of 1.5 g/d (n = 5), 2.0 g/d (n = 8), and 3.0 g/d (n = 7). The demographic characteristics of the study population are presented in Table 2. No statistically significant differences were observed between groups with the same daily dose. Significant differences in CLCr were observed among the various daily dose groups: the mean CLCr was 35.4 ± 12.4 mL/min in the 1.5 g/d group, 82.2 ± 27.2 mL/min in the 2.0 g/d group, and 101.6 ± 36.2 mL/min in the 3.0 g/d group (p < 0.01). Notably, three patients with CLCr >130 mL/min (all receiving 3.0 g/d) were included—one in the CI group and two in the EI group.
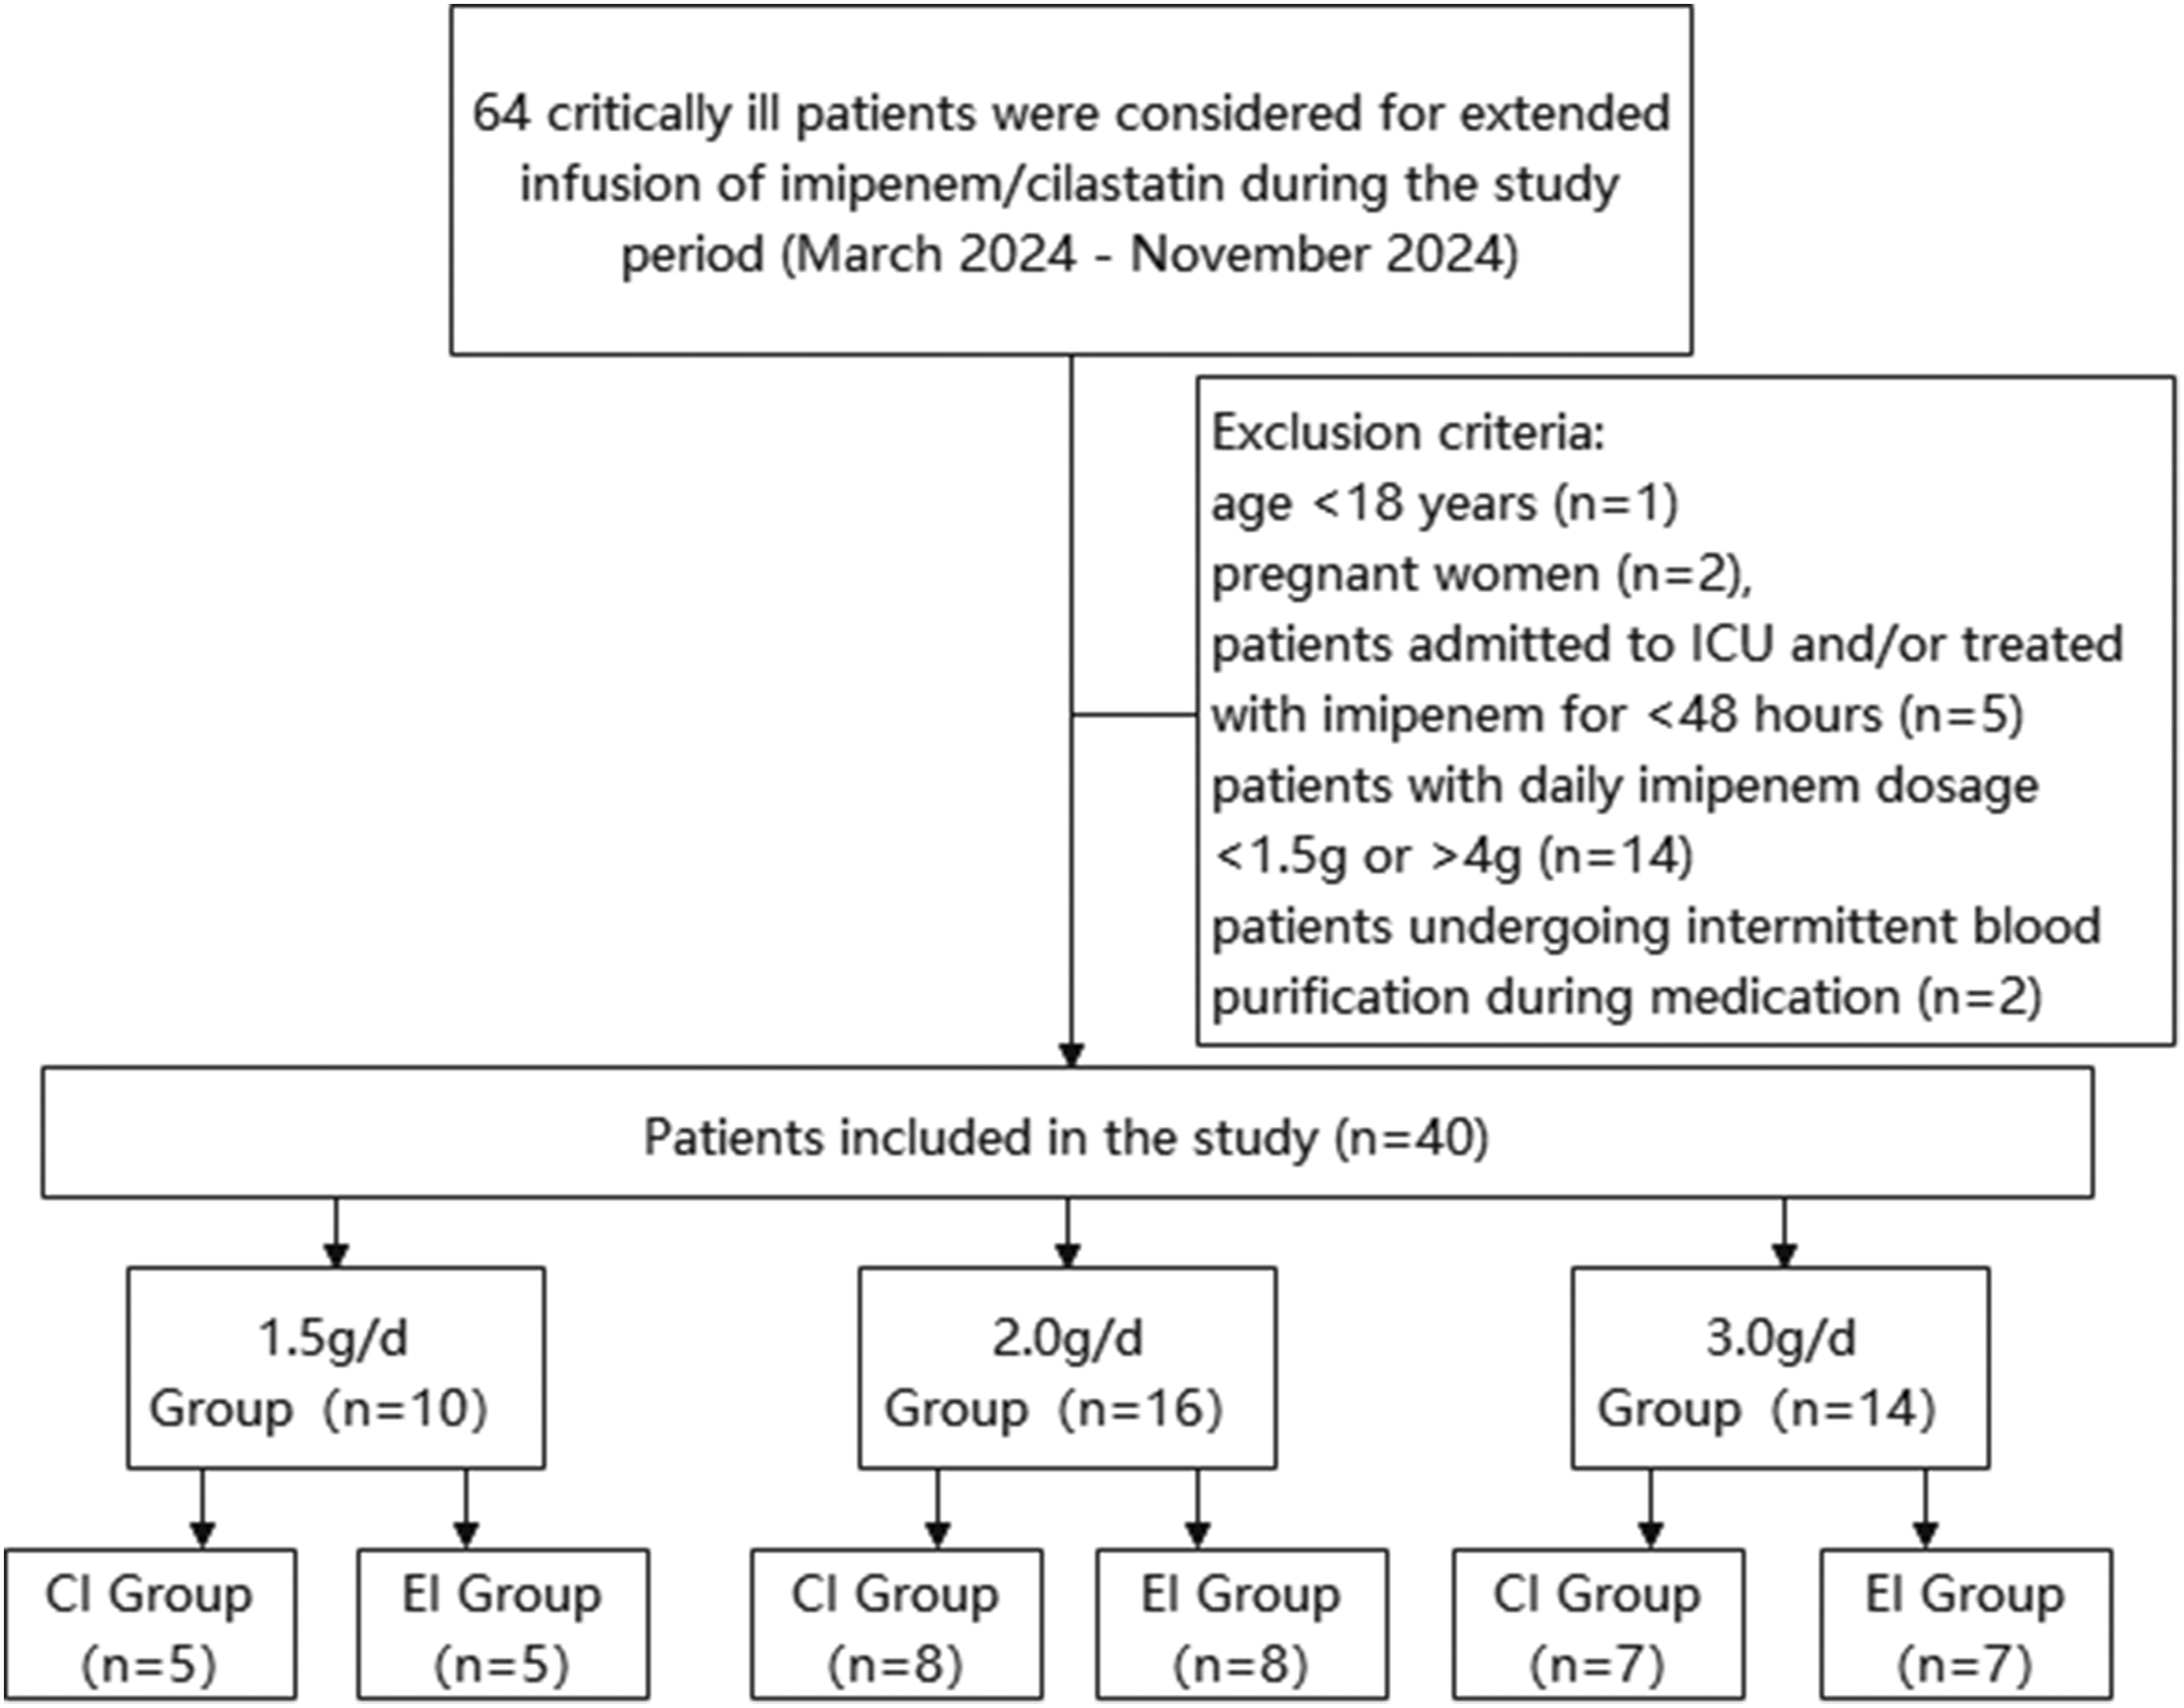
Flowchart of participant selection.
Demographic and clinical characteristics of the study population.

BMI: body mass index; CLCr: creatinine clearance rate; ALB: albumin; SOFA: Sequential Organ Failure Assessment; APACHE II: Acute Physiology and Chronic Health Evaluation.
PK
PK analysis was conducted using WinNonlin® Phoenix 8.1. The one-compartment model demonstrated superior goodness-of-fit compared with the two-compartment model, as evidenced by lower Akaike and Bayesian information criterion values. Consequently, this model was used to calculate all PK parameters (Table 3). The corresponding concentration–time profiles are presented in Figure 2.
Pharmacokinetic parameters of each group.

p < 0.05 after Bonferroni adjustment for multiple comparisons
t1/2: elimination half-life; AUC: area under the curve; Cmax: maximum plasma concentration; MRT: mean residence time; CL: clearance; Vd: volume of distribution; Cmin: minimum plasma concentration.

Mean (SD) plasma concentration–time profile for imipenem. Plasma profiles of the (a) imipenem CI group and (b) imipenem EI group. CI: continuous infusion; EI: extended infusion.
Substantial interindividual variability was observed in imipenem concentrations, with coefficients of variation (CV%) ranging from 13.1% to 47.3% in the CI group and 23.3% to 82.3% in the EI group. Furthermore, no evident linear relationship was noted between the dose and drug exposure. This lack of correlation is likely attributable to significant variation in CLCrs among the dose groups.
One-way ANOVA with Bonferroni post-hoc correction for multiple comparisons was used to assess differences across dose and administration groups. No significant differences were observed in the area under the curve (AUC), maximum plasma concentration (Cmax), or minimum plasma concentration (Cmin) between the 1.5 g/d and 2.0 g/d regimens across both infusion groups (all padj > 0.05). However, the 3.0 g/d regimen yielded the highest plasma concentrations in both groups, with effects differing by infusion method. Specifically, CI resulted in significantly higher AUC and Cmin at a dose of 3.0 g/d than at both lower doses (AUC: padj = 0.012 vs. 1.5 g/d, padj = 0.005 vs. 2.0 g/d; Cmin: padj = 0.034 vs. 1.5 g/d, padj = 0.022 vs. 2.0 g/d). In contrast, EI showed significantly higher Cmax at a dose of 3.0 g/d versus lower doses (padj < 0.001) but showed no differences in AUC or Cmin.
The apparent Vd remained consistent across all groups (15.1 ± 3.2 L). In contrast, clearance (CL) increased dose-dependently (4.7 ± 1.5 L/h), while the elimination half-life (t1/2) decreased significantly with dose escalation (2.36 ± 0.56 h). These PK shifts were correlated with significantly higher CLCrs in patients receiving higher doses.
Across all dose levels (1.5–3.0 g/d), CI demonstrated significantly higher drug exposure (AUC) and Cmin than EI (all padj < 0.001 for 1.5–2.0 g/day; padj = 0.002 for 3.0 g/day). In contrast, EI showed consistently higher Cmax, reaching statistical significance at 3.0 g/d (padj < 0.001). No other PK parameters differed significantly between the infusion methods.
PK/PD parameters
The PTAs for specific MICs, including 100% fT > MIC, 100% fT > 4× MIC, and 50% fT > MIC, are shown in Figure 3.

Target attainment probabilities for imipenem administered as CI (solid line) and EI (dashed line) at different PK/PD targets: (a) 100% fT > MIC, (b) 100% fT > 4× MIC, and (c) 50% fT > MIC. CI: continuous infusion; EI: extended infusion; PK/PD: pharmacokinetic/pharmacodynamic; MIC: minimum inhibitory concentration. Statistical comparisons between the CI and EI groups at equivalent dosages were performed using Fisher’s exact test (*p < 0.05, **p < 0.01).
When the PK/PD target was set at 100% fT > MIC, the EI group demonstrated lower target attainment rates than the CI group across the same dosing regimens. At MIC ≤2 mg/L, no significant differences were observed between the CI and EI groups. However, at MICs ≥4 mg/L, a statistically significant difference emerged (p = 0.01). As MIC increased further, the EI group exhibited a marked decline in target attainment. Specifically, at an MIC of 8 mg/L, the CI group maintained a 100% attainment rate, while the EI group achieved only 15%. At an MIC of 16 mg/L, no EI cases met the target, while the CI group’s attainment rate dropped to 45%. Subgroup analysis by dosing regimen revealed that the EI group’s attainment rates remained consistently low across doses, with marginally worse performance at higher doses. In contrast, the CI group achieved optimal results at 3.0 g/d, maintaining 100% target attainment even at an MIC of 16 mg/L.
For the more stringent PK/PD target of 100% fT > 4× MIC, the EI group achieved an attainment probability of 43%–63% at an MIC of 1 mg/L, which dropped below 15% at an MIC of 2 mg/L. In contrast, the CI group demonstrated significantly higher attainment probabilities (p < 0.01) at MICs ≤4 mg/L, with the 3.0 g/d regimen maintaining 100% attainment even at an MIC of 4 mg/L. However, when the MIC was ≥8 mg/L, neither group achieved the target value.
According to clinical guidelines, 8 carbapenems should achieve a minimum PK/PD target of 50% fT > MIC. Due to the higher peak concentrations in the EI group, we evaluated whether this regimen demonstrated superior target attainment at 50% fT > MIC for MIC values of 8 mg/L and 16 mg/L, compared with that using CI. The results revealed that the EI group consistently showed lower attainment probabilities than the CI group. At MICs ≤ 8 mg/L, both groups maintained attainment rates >80%. However, when the MIC increased to 16 mg/L, both groups exhibited significantly reduced attainment rates. Notably, although the CI group maintained higher overall attainment than the EI group, this difference did not reach statistical significance.
Discussion
Only a few PK studies have systematically evaluated imipenem in ICU patients, particularly regarding CI regimens. In this prospective noninterventional study, we employed LC–MS to measure the plasma imipenem concentrations and compare the PK profiles between CI and EI at various dosages. Our results demonstrated that imipenem’s Vd was comparable to that of healthy populations (CV% = 21.0%). However, CL was significantly reduced and t1/2 prolonged, consistent with previous reports in critically ill patients.15,16 Comparative analysis revealed substantial interstudy variability in Vd and CL values, which may be attributed to differences in the enrolled patient populations and inconsistencies in the calculation methods of PK parameters.17–19
In this study, physicians empirically determined imipenem dosages based on creatinine levels and infection severity. Despite standardized dosing within administration groups, we observed substantial interindividual variability in trough plasma concentrations (overall CV% = 75.4%). The CI group demonstrated significantly less variability (CV% = 25.5%) than the EI group (CV% = 67.3%). This study demonstrates the necessity of therapeutic drug monitoring for imipenem in ICU patients, particularly during noncontinuous administration, as continuous administration can reduce interindividual variability.
Imipenem exhibits time-dependent bactericidal activity. Current evidence 20 demonstrates that conventional intermittent infusion (1 g q8h) at an MIC of 4 mg/L achieves target attainment rates of 60% for 100% fT > MIC and only 27% for 100% fT > 4× MIC in critically ill patients. Consequently, researchers have investigated CI and EI regimens to optimize imipenem’s PK/PD target attainment.6,7,10,11 Monte Carlo simulations 11 revealed that among ICU patients, both 3-h EI and CI regimens significantly improved the PTA for both 40% fT > MIC and 100% fT > MIC targets compared with traditional 0.5-h infusions. Specifically, CI demonstrates superior drug exposure for achieving 100% fT > MIC. However, in case of elevated MICs (≥8 mg/L), approximately 70% of patients receiving CI fail to attain even the minimal 20% fT > MIC target. These findings strongly support the adoption of EI strategies for treating infections caused by pathogens with high MICs. However, when MIC values are elevated, the CI regimen presents a substantial risk of complete PK/PD target nonattainment.
In this study, a conservative 2-h EI protocol was employed to ensure imipenem stability. The results demonstrated that CI achieved significantly higher PTAs than 2-h EI for both 100% fT > MIC (MICs ≤16 mg/L) and the more aggressive 100% fT > 4× MIC (MICs ≤ 4 mg/L). However, for the target of 100% fT > MIC, a statistically significant advantage of CI over EI was observed only at MICs ≥4 mg/L. Furthermore, for the target of 100% fT > 4× MIC, CI demonstrated superior attainment compared with 2-h EI across the MIC range of 1–4 mg/L (p < 0.01).
Therefore, for infections caused by susceptible pathogens (MIC ≤ 2 mg/L), a 2-h EI provides target attainment statistically comparable to that of CI, suggesting that a 3-h EI could be equally effective. Conversely, for less susceptible pathogens (MIC ≥ 4 mg/L), CI demonstrates unequivocal superiority. The steady-state trough concentration achieved with CI was approximately threefold higher than that achieved with the 2-h EI regimen and substantially exceeded the mean trough concentration of ∼7.5 mg/L reported for a 3-h EI of 1 g q8h. 21 Furthermore, CI exhibited minimal interindividual variability, ensuring more predictable drug exposure.
Consequently, for critically ill patients, EI may be preferable when the MIC is <4 mg/L, as it reduces concentration-dependent adverse effects and decreases nursing workload. However, CI may be the preferred administration method for severe infections requiring aggressive PK/PD targets (e.g. 100% fT > 4× MIC) or when the pathogen’s MIC exceeds 4 mg/L.
We further assessed the PTA for 50% fT > MIC under both CI and EI regimens at elevated MIC values. The results demonstrated that the CI group maintained superior performance compared with the EI group, although both groups showed reduced attainment (∼50%) at an MIC of 16 mg/L. These findings contrast with earlier Monte Carlo simulation results, 11 a discrepancy likely attributable to differences between the PK parameters used in previous predictive models and those observed in our actual patient data. Our trial data indicated that CI yielded a mean trough concentration of 20.82 ± 5.43 mg/L. This concentration suggests that for pathogens with MICs of 8–16 mg/L, attainment of PK/PD targets ranging from 50% to 100% ƒT>MIC is feasible. Therefore, imipenem CI can serve as a potential treatment strategy for infections involving pathogens with MICs of 8–16 mg/L, which is consistent with previously reported meropenem data. 22
Subgroup analysis by dosing regimen revealed that in the EI group, even after dose adjustment for CLCr, patients receiving 3.0 g/d showed the lowest probability of achieving PK/PD targets. In contrast, patients in the CI group receiving the same dose demonstrated the highest PTA. These findings suggest that dose escalation via EI administration may be ineffective for improving target attainment in patients with high CLCr, where CI would be preferable. According to a previous study, 23 patients with estimated glomerular filtration rate (eGFR) <70 mL/min derive less benefit from CI meropenem therapy, likely because standard dosing already achieves high target attainment in this population, rendering CI unnecessary. Our analysis of imipenem in the EI group showed that at MIC = 1 mg/L, the eGFR <70 mL/min subgroup achieved higher target attainment than the eGFR ≥70 mL/min subgroup (100% vs. 66.7%, p = 0.117), although this difference was not statistically significant. This suggests that CI is particularly advantageous for patients with preserved renal function. However, due to the limited sample size, we could not establish a definitive CLCr threshold for switching to CI. Therefore, further investigation is required.
Imipenem demonstrates relatively poor stability. Existing research indicates that reconstituted imipenem remains stable for ≤4 h at 25°C. Accordingly, our CI protocol included solution reconstitution every 4 h. Results showed that trough concentrations consistently met clinical requirements for both PK/PD target attainment and intrapatient variability. Regarding CI safety, no definitive toxic concentration threshold has been established. 24 In our study, no patients experienced imipenem-related neurotoxicity or adverse reactions requiring treatment discontinuation. However, we may have underestimated adverse reaction incidence, as most patients were sedated. Nevertheless, our findings support the safety of imipenem CI in clinical practice.
This study has several limitations. First, its single-center design and small sample size limited the statistical power for subgroup analyses and may affect generalizability. The sample size was also insufficient for developing a robust population PK (PPK) model to quantify covariate effects (e.g. renal function and albumin). Second, total plasma concentrations were measured using a uniform protein-binding correction rather than direct free drug quantification. However, exploratory univariate analysis revealed no significant associations between trough concentrations and patient characteristics (age, sex, albumin, creatinine clearance, or BMI; Tables S1 to S3). However, the impact of CLCr may be underestimated due to protocol-based dose adjustments. Third, assumed MIC values were used due to high empirical therapy rates, precluding direct clinical efficacy comparisons. Notwithstanding these limitations, our findings align with published imipenem simulations and meropenem CI studies, providing foundational, real-world evidence for imipenem CI. Future prospective, multicenter studies with larger sample sizes are warranted to validate these findings, develop a comprehensive PPK model, and establish definitive clinical efficacy outcomes.
Conclusion
This study demonstrates that imipenem CI yields significantly higher and more predictable drug exposure than EI in critically ill patients, resulting in superior PK/PD target attainment. However, the limited sample size constrains the generalizability of these findings and necessitates validation through larger, multicenter trials. Notwithstanding these limitations, our data suggest that CI is a valuable optimization strategy for imipenem therapy, particularly for patients with elevated CLCr or infections involving less susceptible pathogens (MIC ≥ 4 mg/L).
Footnotes
Acknowledgments
The authors are grateful to all patients who participated in this study. We would like to express our deep gratitude to the National Key Clinical Specialty Construction Project and the Beijing Science and Technology Innovation Medical Development Foundation (grant number KC2025-ZZ-0050-1) for providing us with research funding.
Author contributions
Ruixia Zhang: Conceptualization, methodology, formal analysis, data curation, writing–original draft, writing–review and editing, project administration. Yi Qin: Formal analysis, investigation, data curation. Yayao Lv: Resources, validation. Yi Zhang: Conceptualization, funding acquisition, project administration, supervision.
Data availability statement
The original contributions presented in the study are included in the article; further data inquiries can be directed to the corresponding author.
Declaration of conflicting interests
The authors declare no conflicts of interest. The funders had no role in the design of the study; collection, analyses, or interpretation of data; writing of the manuscript; or decision to publish the results.
Institutional review board statement
The study was conducted in accordance with the Declaration of Helsinki and approved by the Institutional Review Board of Tianjin First Central Hospital (protocol code: KY20240124-1 and date of approval: 24 Jan 2024).