
Abstract
Objective
This retrospective case–control study aimed to explore the correlations of blood lipid levels, triglyceride–glucose index, systemic immune-inflammation index, and platelet-to-lymphocyte ratio with colorectal cancer and evaluate their potential value in early risk prediction.
Methods
A total of 120 patients admitted to Anqing First People’s Hospital between July 2022 and March 2025 were categorized into a control group (n = 60, normal colonoscopy) and an observation group (n = 60, colorectal cancer). Clinical and laboratory data, including sex, age, body mass index, lipid profile, blood glucose, and blood counts, were collected. Triglyceride–glucose index, systemic immune-inflammation index, and platelet-to-lymphocyte ratio were calculated accordingly.
Results
The observation group had significantly higher rates of drinking history, body mass index, triglyceride, total cholesterol, low-density lipoprotein cholesterol, triglyceride–glucose index, systemic immune-inflammation index, and platelet-to-lymphocyte ratio (P < 0.05). Triglyceride was strongly positively correlated with triglyceride–glucose index (r = 0.921) and negatively correlated with platelet-to-lymphocyte ratio (r = −0.189). Logistic regression identified drinking history (odds ratio = 5.015) and triglyceride–glucose index (odds ratio = 5.937) as independent risk factors. The receiver operating curve of triglyceride–glucose index showed an area under the curve of 0.713, with 78.3% specificity and 65% sensitivity.
Conclusion
Triglyceride–glucose index, along with blood lipid levels, systemic immune-inflammation index, and platelet-to-lymphocyte ratio, is closely associated with colorectal cancer. Triglyceride–glucose index may be a promising biomarker for early screening.
Keywords
Background
Colorectal cancer (CRC) is a gastrointestinal malignancy with high incidence and mortality rates. It was estimated that there were over 1.9 million new CRC cases worldwide in 2020, accounting for 10% of all diagnosed cancers and 935,000 deaths, representing 9.4% of all cancer-related mortalities. CRC ranks third in incidence and second in mortality among all cancers. 1 In 2022, an estimated 517,100 new CRC cases and 240,000 deaths were reported in China, ranking second after lung cancer. 2 Therefore, exploring effective early screening methods is crucial for improving the cure rate and prognosis of CRC.
Increasing evidence suggests that metabolic abnormalities are important drivers of colorectal carcinogenesis. Obesity is closely associated with insulin resistance (IR) and compensatory hyperinsulinemia, the latter of which may promote tumor initiation and progression through mitogenic and antiapoptotic signaling pathways. 3 Epidemiological studies have consistently demonstrated a positive association between IR and CRC risk. Although the hyperinsulinemic–euglycemic clamp is considered the gold standard for assessing insulin sensitivity, its high cost and complexity restrict its application in large-scale studies. The triglyceride–glucose (TyG) index, calculated from routine biochemical parameters, has been widely validated as a reliable surrogate marker of IR and shows strong concordance with clamp-derived measures.
In addition, the inflammatory microenvironment plays a crucial role in CRC development. Chronic low-grade inflammation contributes to genomic instability, enhances angiogenesis, and facilitates the malignant transformation of colonic epithelial cells. Tumor cells, in turn, actively remodel and interact with the inflammatory stroma, establishing a vicious cycle that accelerates disease progression. 4 Against this background, systemic inflammatory markers such as platelet-to-lymphocyte ratio (PLR) and systemic immune-inflammation index (SII) have attracted increasing attention, with accumulating evidence linking them to CRC occurrence and prognosis.
Taken together, these findings suggest that metabolic dysregulation and systemic inflammation are key components of CRC pathogenesis. Indicators such as the TyG index, PLR, and SII may therefore offer valuable insights into CRC risk prediction, which is the primary focus of the present study.
Materials and methods
Participants
This was a single-center, retrospective case–control study. A total of 120 patients who visited the Anqing First People’s Hospital between July 2022 and March 2025 were enrolled and categorized into a control group and an observation group. The control group consisted of 60 patients with normal colonoscopy results, whereas the observation group included 60 patients diagnosed with CRC via colonoscopy.
Inclusion criteria
The inclusion criteria were as follows: 1. Patients in the observation group were pathologically diagnosed with CRC via colonoscopy and were undergoing their first diagnosis with no history of surgery, chemotherapy, radiotherapy, or targeted therapy. 2. Patients in the control group underwent colonoscopy during the same period, and no abnormalities were observed. 3. Complete clinical data of the patients were recorded in the hospital information system (HIS), including age, sex, height, weight, smoking history (defined as smoking ≥1 cigarette per day for more than 1 year), drinking history (defined as drinking ≥1 time per week for more than 1 year), total cholesterol (TC, mmol/L), triglyceride (TG, mmol/L), high-density lipoprotein cholesterol (HDL-C, mmol/L), low-density lipoprotein cholesterol (LDL-C, mmol/L), fasting blood glucose (FBG, mmol/L), platelet count (×109/L), absolute neutrophil count (×109/L), and absolute lymphocyte count (×109/L). 4. Participants aged 18–80 years were included in the study.
Exclusion criteria
The exclusion criteria were as follows: (a) history of malignant tumors other than CRC; (b) patients with diabetes; (c) patients with inflammation- or immunity-related diseases, including autoimmune diseases (e.g. rheumatoid arthritis and systemic lupus erythematosus), active infections (e.g. pneumonia and urinary tract infection), and inflammatory bowel diseases (Crohn’s disease and ulcerative colitis); (d) use of medications such as glucocorticoids, immunosuppressants, long-term use (>1 week) of nonsteroidal anti-inflammatory drugs (NSAIDs), lipid-lowering drugs (e.g. statins and fibrates), and antidiabetic drugs (e.g. insulin and metformin) within the past 3 months; (e) abnormal organ function, including severe hepatic or renal insufficiency and hematological diseases (e.g. leukemia and myelodysplastic syndrome); and (f) other interfering factors, such as pregnancy or lactation, history of major surgery or trauma within the past 3 months, or missing clinical data.
All patients who underwent colonoscopy provided written informed consent forms for gastroscopy and colonoscopy. This study was approved by the Medical Ethics Committee of the Anqing First People’s Hospital. All patient data were de-identified prior to analysis to ensure anonymity and confidentiality. Findings were reported in accordance with the Strengthening the Reporting of Observational Studies in Epidemiology (STROBE) guidelines. 5 The study was conducted in accordance with the principles of the Declaration of Helsinki (1975), as revised in 2024.
Methods
Patients diagnosed with CRC via colonoscopy and pathological examination who met the inclusion criteria were selected as the observation group through the HIS of Anqing First People’s Hospital. Patients with no intestinal lesions observed on colonoscopy during the same period were selected as the control group. Clinical data from both groups, including sex, age, height, weight, smoking history, and drinking history, were collected. Pretreatment blood routine and biochemical results were also collected, including TC, TG, HDL-C, LDL-C, FBG, platelet count, absolute neutrophil count, and absolute lymphocyte count.
All biochemical parameters were measured in the Clinical Laboratory Department of Anqing First People’s Hospital. Fasting venous blood samples were collected from each participant in the morning after at least 8 h of overnight fasting. TC, TG, HDL-C, LDL-C, and FBG levels were determined using an automated biochemical analyzer (Hitachi 7600, Hitachi High-Technologies, Tokyo, Japan) with standard enzymatic methods. Complete blood counts, including platelet, neutrophil, and lymphocyte counts, were obtained using an automated hematology analyzer (Sysmex XN-1000, Sysmex Corporation, Kobe, Japan). All assays were performed according to the manufacturer’s instructions, and internal quality controls were routinely applied to ensure accuracy and reproducibility.
Evaluation indicators


Lipid parameters were expressed in mmol/L. For the calculation of the TyG index, TG values were converted to mg/dL (1 mmol/L = 88.5 mg/dL) and FBG values to mg/dL (1 mmol/L = 18 mg/dL). Platelet, neutrophil, and lymphocyte counts are absolute peripheral blood values, expressed as 109/L.
Sample size calculation
The sample size was estimated using G*Power 3.1 for a two-sample t-test (comparison of group means), with a two-sided significance level of α = 0.05 and power (1-β) = 0.80. Although previous studies have indicated that the TyG index may be associated with relatively small effect sizes, the present study was designed to detect a moderate effect size of clinical relevance (Cohen’s d = 0.5), considering the number of eligible patients that could realistically be recruited at our center during the study period. The calculation indicated that 64 participants per group (128 in total) would be required. Ultimately, 120 participants were successfully enrolled (60 with CRC and 60 controls), which is close to the estimated requirement and provides sufficient power to detect effects of moderate magnitude.
Statistical methods
In this study, Statistical Package for Social Sciences (SPSS 25.0, IBM Corporation, Armonk, NY, USA) software was used to conduct statistical analyses of the research data, and the significance level was set as a two-sided test (α = 0.05). Qualitative data were expressed as rates and constituent ratios, and the chi-square (
Results
Comparison of general data between the two groups
According to the inclusion and exclusion criteria, a total of 120 patients were enrolled in the study. There were 60 patients in the observation group, including 35 males and 25 females, aged 29–76 (61.35 ± 8.87) years. There were 60 patients in the control group, comprising 29 males and 31 females, aged 41–80 (60.18 ± 9.59) years. There were no statistically significant differences in sex, age, and smoking history between the two groups (P > 0.05). However, the alcohol-consumption rate in the observation group was significantly higher than that in the control group (P < 0.05). Based on the nonparametric Mann–Whitney U test, the body mass index (BMI) in the observation group was significantly higher than that in the control group (P < 0.05), as presented in Table 1.
Comparison of general data between the observation group and the control group.
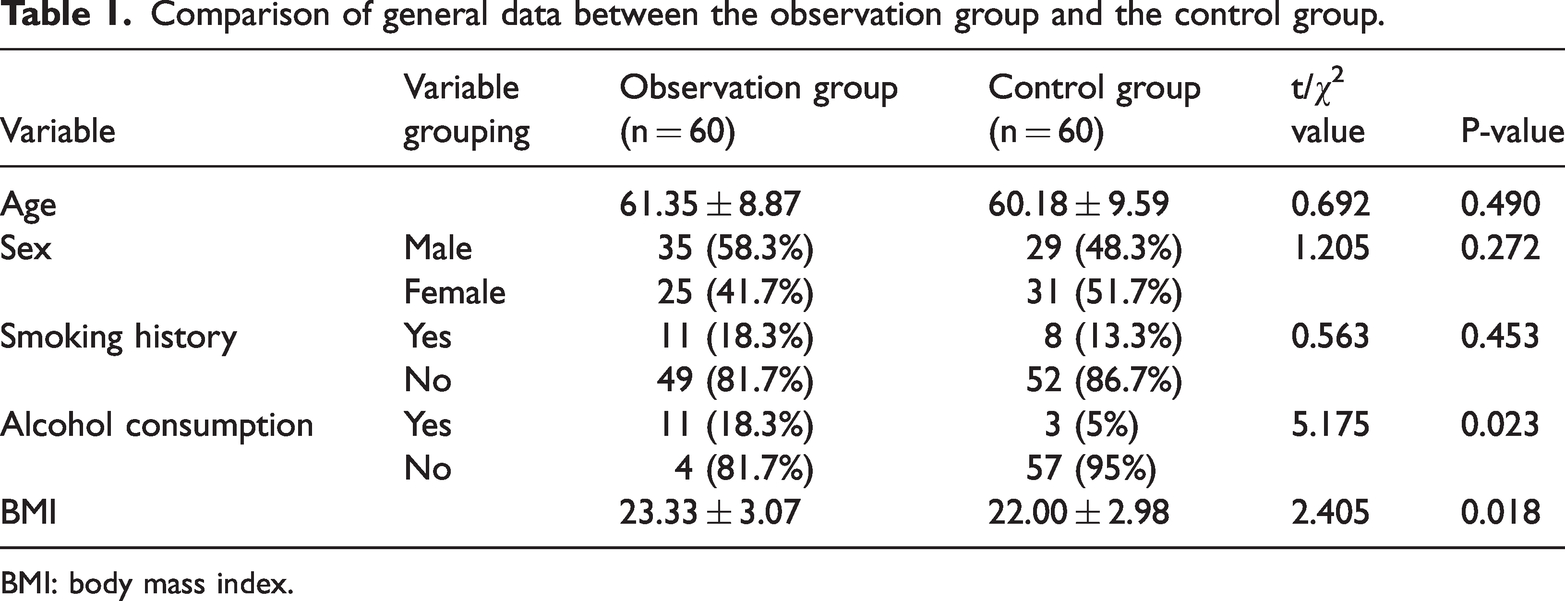
BMI: body mass index.
Comparison of blood lipid, TyG, SII, and PLR indicators between the observation and control groups
A normality test was performed for the blood lipid indicators (cholesterol, TG, HDL-C, and LDL-C), TyG, SII, and PLR. Cholesterol, HDL-C, LDL-C, and TyG followed a normal distribution, and a t-test was performed. The levels of cholesterol, LDL-C, and TyG in the observation group were significantly higher than those in the control group (P < 0.05). Although the HDL-C level was lower in the observation group, the difference was not statistically significant (P > 0.05). TG, SII, and PLR showed a skewed distribution, and a nonparametric Mann–Whitney U test was performed for comparison. The levels of TG, SII, and PLR in the observation group were significantly higher than those in the control group (P < 0.05), as presented in Table 2.
Comparison of blood lipid, TyG, SII, and PLR indicators between the observation group and the control group.
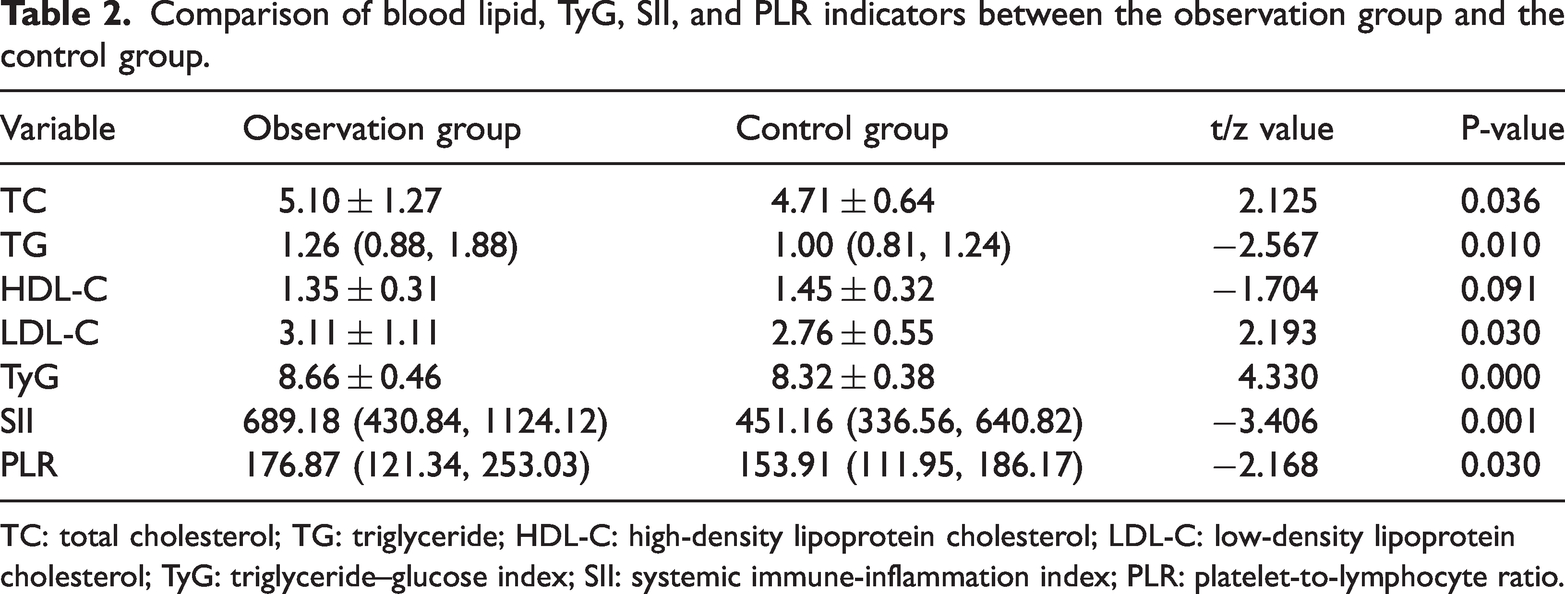
TC: total cholesterol; TG: triglyceride; HDL-C: high-density lipoprotein cholesterol; LDL-C: low-density lipoprotein cholesterol; TyG: triglyceride–glucose index; SII: systemic immune-inflammation index; PLR: platelet-to-lymphocyte ratio.
Correlation analysis of blood lipid levels with TyG, SII, and PLR
Spearman correlation analysis was performed to investigate the relationships between blood lipid levels and TyG, SII, and PLR. The results showed that TG was strongly positively correlated with TyG (r = 0.921, P = 0.000) and negatively correlated with PLR (r = −0.189, P = 0.039), whereas no significant correlations were observed for the other variables (P > 0.05), as shown in Table 3.
Correlation analysis of blood lipid levels with TyG, SII, and PLR.
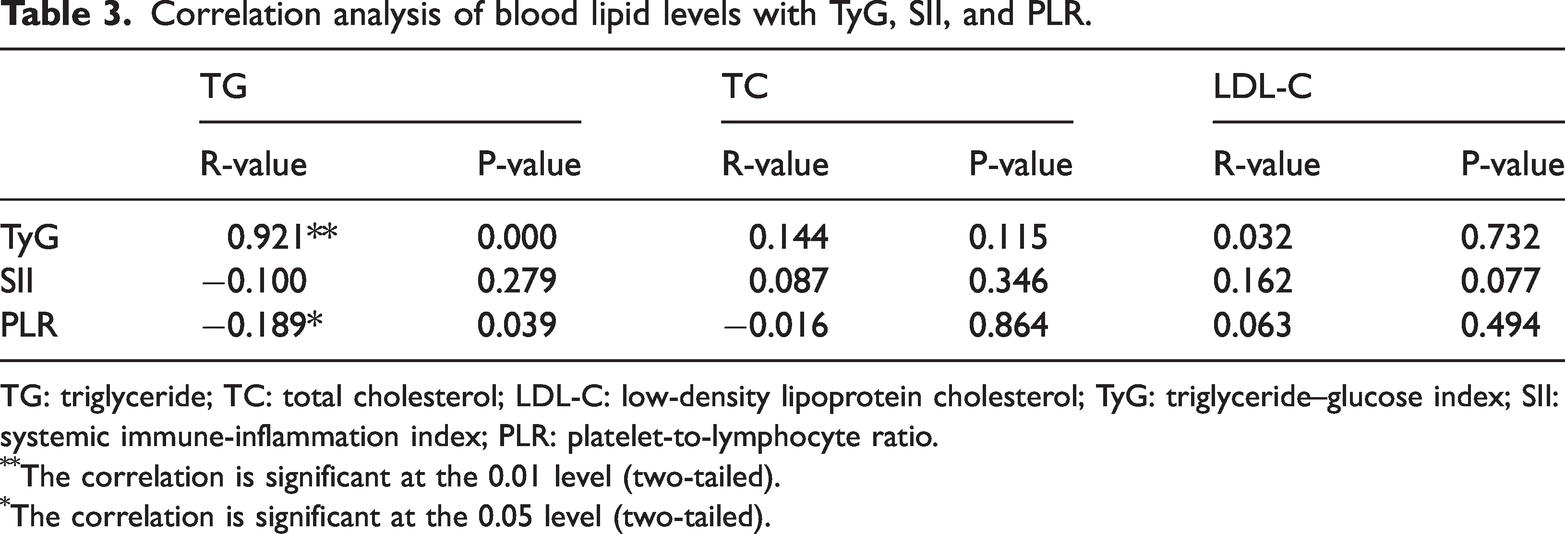
TG: triglyceride; TC: total cholesterol; LDL-C: low-density lipoprotein cholesterol; TyG: triglyceride–glucose index; SII: systemic immune-inflammation index; PLR: platelet-to-lymphocyte ratio.
The correlation is significant at the 0.01 level (two-tailed).
The correlation is significant at the 0.05 level (two-tailed).
Multivariate binary logistic regression analysis of factors associated with CRC occurrence
Spearman correlation analysis showed a strong positive correlation between TyG and TG (r = 0.921, P < 0.001), suggesting potential collinearity. As high collinearity (commonly defined as r > 0.7–0.8) may increase the variance of regression coefficients and compromise model stability and interpretability, only TyG was included in the multivariate logistic regression analysis. TyG was preferred over TG because it integrates FBG and TG levels, offering a more comprehensive measure of IR and greater clinical relevance than TG alone. The indicators with statistical significance in the univariate analysis (drinking history, BMI, cholesterol, LDL-C, TyG, SII, and PLR) were included in the logistic regression model for multivariate analysis. The OR and 95% CI were calculated, and the results were considered statistically significant when the two-sided test P value was <0.05. The results showed that all factors were positively correlated with the occurrence of CRC, among which drinking history and TyG were identified as independent risk factors (P < 0.05), as presented in Table 4 and Figure 1.
Binary logistic regression analysis of factors related to the occurrence of CRC.

CRC: colorectal cancer; B: regression coefficient; SE: standard error; OR: odds ratio; CI: confidence interval; BMI: body mass index; TC: total cholesterol; LDL-C: low-density lipoprotein cholesterol; TyG: triglyceride–glucose index; SII: systemic immune-inflammation index; PLR: platelet-to-lymphocyte ratio.

95% CI for OR. CI: confidence interval; OR: odds ratio.
Sensitivity analyses stratified by BMI
We further conducted BMI-stratified analyses (<24 vs. ≥24 kg/m2) to evaluate the robustness of the primary outcomes. TyG remained significantly associated with CRC risk in both subgroups, with a stronger association observed among participants with a BMI of ≥24 kg/m2 (OR = 30.264, 95% CI: 1.712–534.884, P < 0.05) than among those with a BMI of <24 kg/m2 (OR = 8.882, 95% CI: 1.804–43.735, P < 0.05). In contrast, SII, PLR, TC, and LDL-C did not show statistical significance in either subgroup (Table 5).
Multivariable logistic regression analysis of factors associated with CRC stratified by BMI.

CRC: colorectal cancer; BMI: body mass index; OR: odds ratio; CI: confidence interval; TC: total cholesterol; LDL-C: low-density lipoprotein cholesterol; TyG: triglyceride–glucose index; SII: systemic immune-inflammation index.
ROC curve analysis of the prediction model for CRC occurrence
ROC curve analysis was used to evaluate the predictive performance of the model. The results indicated that the AUC was 0.713 (95% CI: 0.620–0.805, P = 0.001). The Youden index was 0.433, with a specificity of 78.3% and a sensitivity of 65%, as presented in Table 6 and Figure 2.
Parameters of the prediction model.

AUC: area under the curve; CI: confidence interval.

ROC curve analysis of the predictive model for the occurrence of CRC. ROC: receiver operating characteristic; CRC: colorectal cancer.
Discussion
CRC, the third most common malignancy worldwide, exhibits marked geographical heterogeneity and population specificity in its epidemiological characteristics. According to 2023 data from the Global Cancer Observatory (GLOBOCAN) and the 2024 Global Burden of Disease study published in The Lancet, the age-standardized incidence rates in high-income countries (e.g. the United States and Australia) have declined, with an average annual decrease of 1.8%, largely attributed to the widespread use of colonoscopy screening (screening coverage rate in the United States reached 72.3% in 2025). In contrast, the incidence rates in low- and middle-income countries (e.g. China and Brazil) continue to increase. In 2024, China reported 635,000 new CRC cases, representing a 41% increase compared with that in 2015, and the proportion of early-onset CRC in patients under 50 years of age accounted for over 17% of cases. In the United States, the incidence rate of CRC among individuals aged 35–49 years has increased by 2.3% annually. The 5-year survival rate has reached up to 68% in developed countries (the highest in Japan, at 72.1%), whereas it remains below 30% in Africa. The uneven distribution of medical resources results in a 5.8-fold difference in the late-stage diagnosis rate. Currently, the fecal occult blood test (FOBT) and colonoscopy are the most commonly used methods for early detection and diagnosis of CRC. Although FOBT is simple and noninvasive, it has a relatively high false-positive rate and lacks sensitivity and specificity. Colonoscopy is considered the gold standard for CRC diagnosis; however, it is associated with several complications, resulting in low acceptance and tolerance among the general population. 6 Therefore, exploring biomarkers for the detection and diagnosis of CRC has become an important research focus. Existing studies have shown that metabolic disorders and chronic inflammation are closely associated with the occurrence of CRC. 7 Abnormal changes in lipid metabolism, such as altered levels of TG, TC, HDL-C, and LDL-C, are considered important risk factors for CRC. 8 Additionally, with the ongoing exploration of novel metabolism- and inflammation-related biomarkers, indices such as the TyG index, SII, and PLR have attracted considerable attention in the academic community. Previous studies have demonstrated that SII and PLR are often elevated in patients with CRC and closely associated with adverse clinicopathological features, including poor differentiation, larger tumor size, and unfavorable survival outcomes.9,10 Similarly, TyG, a well-established surrogate marker of IR, has also gained prominence in epidemiological research. Several prospective cohort and retrospective studies have consistently reported that higher TyG levels are not only associated with an increased risk of CRC but also significantly correlated with the occurrence and recurrence of colorectal adenomas.11,12 In the present study, the levels of TG, TC, LDL-C, and the TyG index in the observation group were significantly higher than those in the control group, suggesting that abnormal lipid metabolism may contribute to the occurrence of CRC through multiple mechanisms. The TyG index, a surrogate marker for IR, was elevated (OR = 5.937), indicating that IR may be the core driving factor. IR promotes the proliferation of tumor cells by activating the PI3K/AKT/mTOR pathway. Hyperinsulinemia can upregulate vascular endothelial growth factor (VEGF), thereby accelerating tumor angiogenesis. 13 Additionally, hypertriglyceridemia may activate the TLR4/NF-κB inflammatory signaling axis through the release of free fatty acids, resulting in the formation of a chronic inflammatory microenvironment in the intestine. 14 Notably, there was a negative correlation between TG and PLR (r = −0.189), which may indicate the complex interaction between lipid metabolism and the inflammatory response. Elevated TG levels may disrupt PLR balance by inhibiting lymphocyte activity (e.g. reducing the proportion of CD4+ T cells) or promoting platelet aggregation.15,16 This nonlinear relationship suggests that further investigation is warranted to elucidate the effects of lipid components on the immune microenvironment.
Given the observed differences in BMI between groups, we further examined the associations within BMI strata. TyG remained a significant predictor of CRC in both subgroups, with a stronger association observed among participants with a BMI of ≥24 kg/m2. In contrast, SII and PLR did not retain independent predictive value after stratification. These findings indicate that the association between TyG and CRC is not solely attributable to BMI imbalance and may be particularly relevant among overweight or obese individuals. 17 However, the broad CI, particularly in the higher BMI subgroup, reflect the limited sample size; therefore, the results should be interpreted with caution.
A history of alcohol consumption was identified as an independent risk factor (OR = 5.015), and its carcinogenic mechanisms may involve the following: (a) metabolites of acetaldehyde directly damage the deoxyribonucleic acid (DNA) of the intestinal mucosa and inhibit mismatch repair; (b) alcohol induces gut microbiota dysbiosis, promoting the proliferation of procarcinogenic flora such as Fusobacterium nucleatum; and (c) acetaldehyde accumulation resulting from polymorphism in the alcohol dehydrogenase (ADH) gene. 18 The coexistence of alcohol consumption and elevated BMI in this study suggests that alcohol may exacerbate metabolic syndrome by affecting leptin sensitivity, forming a synergistic carcinogenic loop of “alcohol–obesity–inflammation.” Although univariate analysis revealed significant differences in SII and PLR between the two groups, neither variable emerged as independent predictor in the multivariate model. This may be explained by the following: 1. SII (neutrophils × platelets/lymphocytes) integrates multiple inflammatory signals, and its predictive value is attenuated after adjusting for the TyG index. 2. PLR is significantly affected by treatment-related factors (e.g. chemotherapy-induced lymphocytopenia). 3. Collinearity exists between inflammatory and metabolic indicators, warranting path analysis to clarify the causal relationships. The AUC of the TyG-based prediction model reached 0.713, which was superior to that of traditional tumor markers such as carcinoembryonic antigen (CEA) (typically AUC is <0.65). The 65% sensitivity corresponding to its optimal cutoff value suggests the following: 1. As a primary screening tool, the TyG index should be combined with colonoscopy to improve the detection rates. 2. A dynamic monitoring algorithm (e.g. incorporating the slope of TyG change within 3 years) may be developed. This study has several limitations: 1. Its cross-sectional design fails to establish a clear causal relationship; 2. Subgroup analysis of therapeutic interventions (e.g. use of statins) were not performed. In the future, multicenter prospective cohort studies should be conducted, integrating single-cell sequencing technology to elucidate the transcriptomic characteristics of intestinal epithelial cells in individuals with high TyG. This study demonstrated that the TyG index and a history of alcohol consumption are independent risk factors for CRC, highlighting the pivotal role of metabolism–inflammation interactions in carcinogenesis. Therefore, it is recommended to incorporate TyG into the CRC risk stratification system and implement intensified screening for individuals with high TyG levels and a history of alcohol consumption (e.g. advancing the age for colonoscopy screening from 50 to 45 years). Meanwhile, clinical trials investigating lifestyle interventions should be conducted to explore novel; strategies for the prevention and treatment of metabolism-related tumors.
Supplemental Material
sj-pdf-1-imr-10.1177_03000605251392443 - Supplemental material for Association of serum lipid levels, triglyceride–glucose index, systemic immune-inflammation index, and platelet-to-lymphocyte ratio with colorectal cancer: A retrospective study from China
Supplemental material, sj-pdf-1-imr-10.1177_03000605251392443 for Association of serum lipid levels, triglyceride–glucose index, systemic immune-inflammation index, and platelet-to-lymphocyte ratio with colorectal cancer: A retrospective study from China by Zhiwei Wang, Fanglai Zhu and Lu Dai in Journal of International Medical Research
Footnotes
Acknowledgments
Not applicable.
Author contributions
ZWW and FLZ conceptualized the study. ZWW collected and analyzed the data and drafted the manuscript. FLZ and LD supervised the study and critically revised the manuscript for important intellectual content. All authors have read and approved the final manuscript.
Data availability statement
The datasets generated and/or analyzed during the current study are not publicly available due to patient confidentiality but are available from the corresponding author upon reasonable request.
Declaration of conflicting interests
The authors declare that there are no conflicts of interest regarding this work.
Funding
None.
References
Supplementary Material
Please find the following supplemental material available below.
For Open Access articles published under a Creative Commons License, all supplemental material carries the same license as the article it is associated with.
For non-Open Access articles published, all supplemental material carries a non-exclusive license, and permission requests for re-use of supplemental material or any part of supplemental material shall be sent directly to the copyright owner as specified in the copyright notice associated with the article.