
Abstract
Objective
To investigate the functions and immunological implication of formin-like protein 1 in pancreatic cancer.
Methods
A multitude of public datasets and an in-house cohort were used to assess the clinical relevance and the immunological relevance of formin-like protein 1 in pancreatic cancer. Subsequently, in vitro assays were conducted to evaluate the biological roles of formin-like protein 1 in pancreatic cancer and its effects on immunity.
Results
The expression of formin-like protein 1 was elevated in pancreatic cancer tissues and linked to a poor prognosis in pancreatic cancer. In vitro assays showed that elevated expression of formin-like protein 1 promoted pancreatic cancer progression. Moreover, formin-like protein 1 was linked to an inflamed tumor microenvironment and mediated epithelial–mesenchymal transition and programmed cell death 1 ligand 1 expression in pancreatic cancer.
Conclusions
Formin-like protein 1 is a biomarker of an inflamed tumor microenvironment and positively modulates epithelial–mesenchymal transition and programmed cell death 1 ligand 1 expression in pancreatic cancer, which could be utilized as a novel target for antitumor immunity for more in-depth studies.
Keywords
Introduction
Pancreatic cancer (PC) is a highly aggressive human malignancy. PC constituted approximately 66,440 new cases and 51,750 mortalities in the United States in the year 2024. 1 This condition is usually detected at advanced stages—stages III or IV—thus reflecting a poor prognosis linked to the pancreas’s location in the deep abdominal cavity and the inconspicuous early symptoms of PC. Additionally, PC has a poor prognosis with an overall survival (OS) of approximately half a year and a 5-year survival rate projected to be less than 8%. 2 The above phenomena can be attributed to the absence of effective approaches for prompt diagnosis as well as a high probability of invasion and metastasis of PC. Thus, urgent exploration of the mechanisms underlying PC oncogenesis and strategies is important.
Formins, a highly conserved family of cytoskeletal remodeling proteins, are involved in a series of biological functions during cell polarization, division, adhesion, movement, and migration. 3 Formin-like protein 1 (FMNL1), a member of the formin family, functions in organizing actin filaments to form bundles to control the actin dynamics, participating in the stability of the Golgi complex, podosome dynamics, and phagocytosis. 4 A substantial number of studies have shown that FMNL1 plays a role in cancer proliferation, invasion, metastasis, and apoptosis, including T cell non–Hodgkin’s lymphomas, glioblastoma, and nasopharyngeal carcinoma.5–7 However, the functions of FMNL1 in PC remain unclear. Thus, to the best of our knowledge, our research was the first to report the dysregulated expression, functional mechanisms, and immunogenic values of FMNL1 in PC.
Materials and methods
Acquisition of public data
A multitude of public datasets were used in the current study, including Gene Expression Profiling Interactive Analysis (GEPIA), The Cancer Genome Atlas (TCGA), Clinical Proteomic Tumor Analysis Consortium (CPTAC), Gene Expression Omnibus (GEO), Kaplan–Meier Plotter, and Tumor Immune Estimation Resource (TIMER). Detailed information is demonstrated in Table S1.
Tissue array and ethics
Superbiotek (Shanghai, China) supplied the PC tissue microarray (TMA) section (PAC1401), which contained 80 PC tissue samples and corresponding paratumor specimens. All patients provided written informed consent. The study was approved by the ethics committee of Yancheng Third People’s Hospital (No. 202237). The study was conducted according to the 1975 Declaration of Helsinki, as revised in 2024. The basic clinicopathological features are summarized in Table 1.
Association between FMNL1 and clinicopathological features in PC.
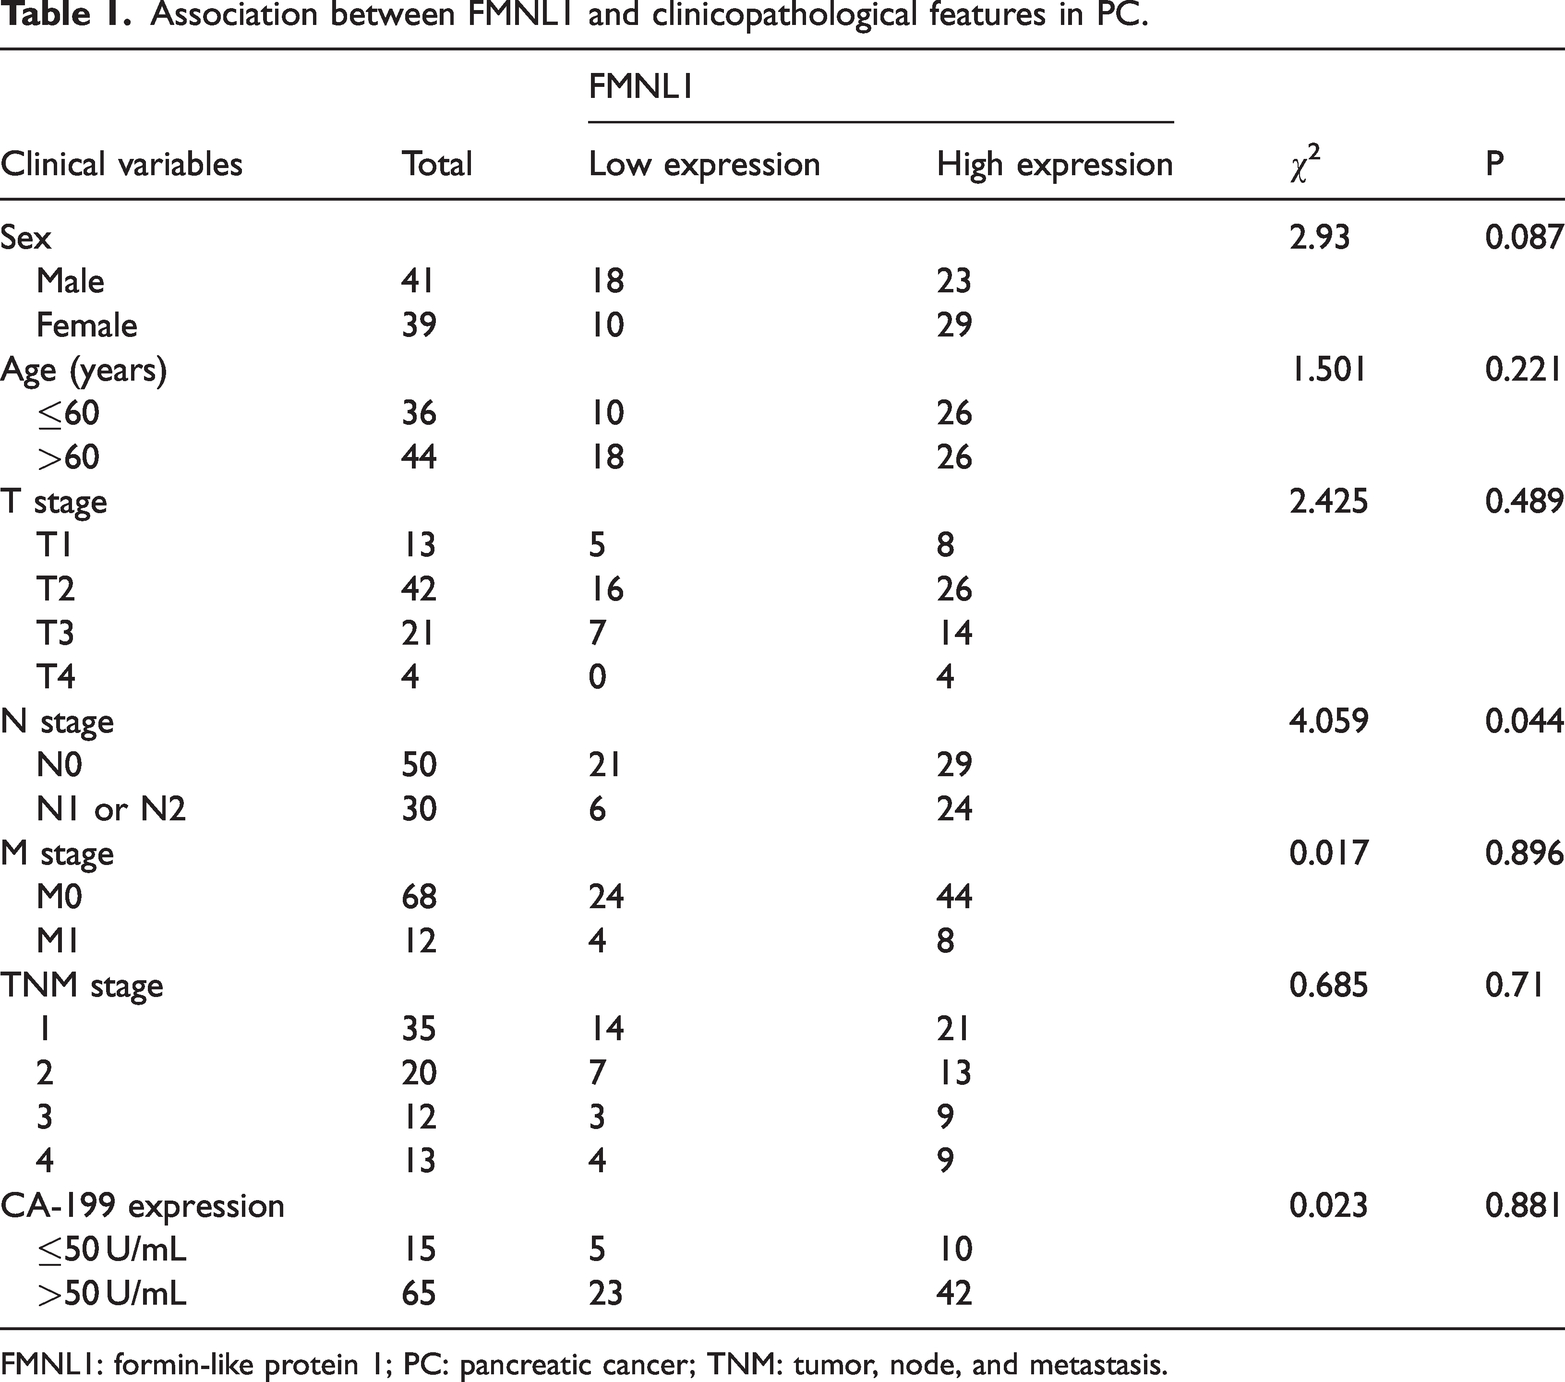
FMNL1: formin-like protein 1; PC: pancreatic cancer; TNM: tumor, node, and metastasis.
Immunohistochemistry
First, the TMA was deparaffinized at 55°C for 30 min. Then, the TMA was washed thrice using xylene and rehydrated in 100%, 90%, and 70% ethanol. To block endogenous peroxidase activity, hydrogen peroxidase (0.3%, ZSGB-Bio, Beijing, China) was applied to the section for 20 min. Subsequently, ethylenediamine tetraacetic acid (EDTA) was used to retrieve the TMA. The antibodies used on the TMA included anti-FMNL1 (1:100 dilution, Cat. 27834-1-AP, Proteintech, RRID: AB_2880987) and anti–programmed cell death 1 ligand 1 (PD-L1; Ready-to-use, Cat. GT2280, GeneTech, RRID: AB_2928127). The completed section was subjected to scanning using the Aperio Digital Pathology Slide Scanner. The semiquantitative assessment was executed on the basis of the 12-point criteria, and the outcome was demonstrated as an immunoreactivity score (IRS).
Cell lines and cell culture
Three PC cell lines (PANC-1, CFPAC-1, and Capan-1) were obtained from KeyGEN BioTECH (Jiangsu, China). The normal human pancreatic ductal cell line hTERT-HPNE was obtained from Yuchicell Biological Technology Co. Ltd. (Shanghai, China). PANC-1 and hTERT-HPNE cells were cultured in Dulbecco’s modified Eagle’s medium (DMEM, high glucose; KeyGEN BioTECH, Jiangsu, China) supplemented with 10% (v/v) fetal bovine serum (FBS; Gibico, Thermo Fisher Scientific, USA), 100 U/mL penicillin, and 100 mg/mL streptomycin (Thermo Fisher Scientific, USA). CFPAC-1 cells were cultured in Iscove’s Modified Dulbecco’s Medium (IMDM; KeyGEN BioTECH, Jiangsu, China) supplemented with 10% (v/v) FBS, 100 U/mL penicillin, and 100 mg/mL streptomycin. Capan-1 cells were cultured in DMEM with high glucose supplemented with 20% (v/v) FBS, 100 U/mL penicillin, and 100 mg/mL streptomycin. All cells were cultured at 37°C under 5% CO2. RRID: PANC-1 (CVCL_0480), CFPAC-1 (CVCL_1119), Capan-1 (CVCL_0237), and hTERT-HPNE (CVCL_C466).
Cell transfection
Double-stranded small-interfering RNA (siRNA) targeting human FMNL1 (siRNA-FMNL1) and negative control siRNA (siRNA-NC) were derived from RiboBio Co., Ltd. (Guangzhou, China). As per the manufacturer’s protocol, PANC-1 and CFPAC-1 cells were transfected together with siRNA-FMNL1 and siRNA-NC using Lipofectamine 3000 (Thermo Fisher Scientific, USA). After 24 h of transfection, phosphate-buffered saline (PBS) was used to rinse the cells, which were subsequently cultured in their respective medium. The sequences of siRNA-FMNL1 and siRNA-NC were as follows: siRNA-1: 5′-UGGAGGAGCUGGAGGAGAATT-3′, 3′-UUCUCCUCCAGCUCCUCCATT-5′; siRNA-2: 5′-CAUCAAGUCCUCUGACAAATT-3′, 3′-UUUGUCAGAGGACUUGAUGTT-5′; siRNA-3: 5′-CUGAAGAGCUAUGUGGAUATT-3′, 3′-UAUCCACAUAGCUCUUCAGTT-5′; siRNA-4: 5′-GAGCUAGACAUGAGUGAUUTT-3′, 3′-AAUCACUCAUGUCUAGCUCTT-5′; siRNA-5: 5′-CAUUAAGGCCUACAAGAAATT-3′, 3′-UUUCUUGUAGGCCUUAAUGTT-5′; siRNA-6: 5′-AGUAUGACAACGAGAAGAATT-3′, 3′-UUCUUCUCGUUGUCAUACUTT-5′; siRNA-NC: 5′-UUCUCCGAACGUGUCACGUTT-3′, 3′-ACGUGACACGUUCGGAGAATT-5′.
Construction of FMNL1-knockdown PC cells
According to FMNL1 expression in three PC cells, we selected PANC-1 and CFPAC-1 for subsequent experiments. First, we verified the knockdown efficiency of three siRNAs in PANC-1 cells. Quantitative polymerase chain reaction (qPCR) and western blot experiments verified that siRNA-1 (5′-UGGAGGAGCUGGAGGAGAATT-3′) could effectively achieve knockdown of FMNL1 expression in PANC-1 cells; however, it could not knockdown FMNL1 expression in CFPAC-1 cells. Therefore, we reselected three siRNAs to verify the knockdown efficiency in CFPAC-1 cells. qPCR and western blot experiments verified that siRNA-6 (5′-AGUAUGACAACGAGAAGAATT-3′) could silence FMNL1 in CFPAC-1 cells. Therefore, we selected siRNA-1 for PANC-1 cells and siRNA-6 for CFPAC-1 cells in subsequent experiments.
Quantitative reverse transcription PCR (qRT–PCR)
Total RNA from PC cells and normal human pancreatic ductal cells was extracted using Invitrogen’s Trizol reagent (Carlsbad, USA). First, the PrimeScriptTM RT reagent Kit containing genomic DNA (gDNA) Eraser (RR047A, Takara, Japan) was used to transcribe 1 μg of RNA into complementary DNA (cDNA). Second, 2 μg of the cDNA and TB Green Premix Ex Taq™ II (RR820A, Takara, Japan) were used to perform qRT–PCR assay. Finally, the 2−ΔΔCt method was used to compute the relative messenger RNA (mRNA) expression. The primers for FMNL1, PD-L1, and GAPDH were obtained from Sangon Biotech (Shanghai, China), and the sequences of primers were as follows: FMNL1: ACTTGGAGAGGCTTCGGCTCAC (forward), CAGCACAGCGTTCTTGGTCTCT (reverse); PD-L1:GCCGAAGTCATCTGGACAAGC (forward), TGATTCTCAGTGTGCTGGTCAC (reverse); and GAPDH: AGATCATCAGCAATGCCTCCT (forward), TGAGTCCTTCCACGATACCAA (reverse). All qRT–PCR experiments were performed in three technical replicates.
Western blot analysis
Total protein of PC cells as well as normal human pancreatic ductal cells was lysed with radio-immunoprecipitation assay (RIPA) lysis buffer mixed with Protease Inhibitor Cocktail (both reagents from CWBIO, Beijing, China). The total concentrations of proteins were evaluated using the bicinchoninic acid protein assay (Beyotime, Shanghai, China) as per the manufacturer’s specifications. Then, equivalent amounts of protein samples (25 μg) were separated with 5% concentrated gels and 8% separation gels and transferred to polyvinylidene fluoride membranes (Millipore, Billerica, Massachusetts, USA). Next, the QuickBlock™ Blocking Buffer (Beyotime, Shanghai, China) was used to block the membranes, followed by separate incubation with antibodies at 4°C overnight. The following primary antibodies were used: FMNL1 (1:2000 dilution, Cat. 27834-1-AP, Proteintech, RRID: AB_2880987), PD-L1 (1:2000 dilution, Cat. 66248-1-Ig, Proteintech, RRID: AB_2756526), GAPDH (1:5000 dilution, Cat. 60004-1-Ig, Proteintech, RRID: AB_2107436), E-cadherin (1:5000 dilution, Cat. 20874-1-AP, Proteintech, RRID: AB_10697811), N-cadherin (1:2000 dilution, Cat. 22018-1-AP, Proteintech, RRID: AB_2813891), and vimentin (1:5000 dilution, Cat. 10366-1-AP, Proteintech, RRID: AB_2273020). Following several washing steps, the membranes were incubated with Proteintech’s goat anti-rabbit (1:2000 dilution, Cat. SA00001-2, Proteintech, RRID: AB_2722564) or goat anti-mouse (1:2000 dilution, Cat. SA00001-1, Proteintech, RRID: AB_2722565) antibody for 2 h at room temperature. Ultimately, the membranes were visualized using the Immobilon ECL system (Millipore, SpA, Italy), and the densitometric evaluation of the bands was accomplished via ImageJ software. All western blot experiments were performed in three technical replicates.
Cell Counting Kit-8 (CCK-8) assay
A 0.25% trypsin solution was used to digest PANC-1, CFPAC-1, and hTERT-HPNE cells for 2 min. They were then resuspended with corresponding media supplemented with 10% FBS. The resuspended cells were seeded into a 96-well plate with the cell density adjusted to 5 × 10⁴ cells/mL (100 μL/well) and cultured at 37°C in a constant-temperature incubator under 5% CO2 for 48 h. Then, 10 μL of CCK-8 was introduced into each well, and the plate was placed in the incubator for 1 h. At 450 nm, the optical density value of each well was determined using a microplate reader. All CCK-8 assays were performed in three technical replicates.
Cell invasion assay
First, PANC-1 cells together with CFPAC-1 cells were seeded into six-well plates and transfected with siRNA-FMNL1 and siRNA-NC. Second, a linear scratch was created when the cells reached the confluency of 80%–90%. Finally, the cells were cultured in their respective medium in the absence of FBS for 24 h, and the scratch was observed. At 0 and 24 h following migration, the images were acquired using a microscope (magnification: 100×, OLYMPUS IX51). The distance of migration was analyzed according to the edge of the wound closure. All cell invasion assays were performed in three technical replicates.
Boyden chamber assay
First, equal amounts of PANC-1 and CFPAC-1 cells (3 × 10⁴ cells/well) transfected with siRNA-FMNL1 and siRNA-NC were seeded into the upper chamber of a 24-well Chemotaxis chamber (8 µm, Cat. 3422, Corning, New York, USA). Second, the medium premixed with 10% FBS was introduced into the lower chamber. The bottom chamber was fixed with 10% formalin and then stained using 0.2% crystal violet for 24 h. Finally, the bottom chamber cells were photographed using a microscope (magnification: 200×, OLYMPUS IX51). All cell Boyden chamber assays were performed in three technical replicates.
Cell apoptosis examination
The Annexin V apoptosis kit was used to evaluate apoptosis in line with the manufacturer’s specifications (Cat. 88-8007, eBioscience). After trypsinization, the cells were centrifuged at 1200 r/min for 5 min. Then, 1× binding buffer and 1× staining buffer were used for washing and resuspending cells to an appropriate concentration, respectively. Then, the cells were stained with 10 μL of Annexin V-APC and incubated in the dark at room temperature for 15 min. Finally, the cells were analyzed using a flow cytometer (Millipore, Billerica, Massachusetts, USA).
Immunofluorescence analysis
First, the cells were dried naturally and then infiltrated with 4% paraformaldehyde fixative for 30 min or overnight. Subsequently, the samples were washed thrice with PBS for 3 min. Next, two drops of 3% H2O2–methanol solution were added to each slice at room temperature (15°C–25°C) for 10 min and washed thrice with PBS. Then, 100 μL of ready-to-use goat serum was applied on the slice. Twenty minutes later, the primary antibody was introduced, and the slice was incubated for 2 h in a wet box and then washed thrice with PBS. Then, 100 μL of secondary antibody was placed on the slice. Next, the slice was incubated at 37°C for 1 h away from light and washed thrice with PBS. Then, we added 50–100 μL of 4′,6-diamidino-2-phenylindole dihydrochloride (DAPI) dye solution to each film, and the sample was placed away from light at room temperature for 5 min. Finally, the sample was sealed with anti-stripping sealing tablets. FMNL1 (1:100 dilution, Cat. 27834-1-AP, Proteintech, RRID: AB_2880987) and PD-L1 (1:100 dilution, Cat. 66248-1-Ig, Proteintech, RRID: AB_2756526) were the primary antibodies used. The stained samples were photographed using a fluorescence microscope (FV3000, Olympus).
Statistical analysis
Statistical Package for the Social Sciences (SPSS) 26.0 software (Chicago, Illinois, USA) was used for analyzing the data. The differences between two groups and among several groups were determined using Student’s t-test/nonparametric Mann–Whitney test and parametric one-way analysis of variance/nonparametric Kruskal–Wallis test, respectively. All data were presented as means ± SDs. The relationships between FMNL1 expression and clinicopathological features were examined using Pearson’s chi-squared test. Pearson’s test was used for correlation analysis between two variables. The log-rank test was used to examine the results of survival analysis. A P value ≤0.05 denoted statistical significance.
Results
Expression levels and prognostic values of FMNL1 in PC
We first explored the expression of FMNL1 in PC and normal pancreatic tissues using the GEPIA website (http://gepia.cancer-pku.cn/). As shown in Figure 1(a), FMNL1 expression levels in PC tissues were higher than those in normal pancreatic tissues (P < 0.05). The results from the CPTAC database demonstrated that the protein expression of FMNL1 was higher in PC tissues than in normal pancreatic tissues (Figure 1(b) and (c), P < 0.001). Next, we validated the protein expression of FMNL1 using immunohistochemical staining. Figure 1(d) shows a representative case of FMNL1 expression in PC tissues and paratumor tissues. Moreover, the protein levels of FMNL1 were summarized using a semiquantitative IRS, and the findings affirmed that FMNL1 expression was higher in PC tissues than in paratumor tissues (Figure 1(e), P < 0.001). We further authenticated the differential expression of FMNL1 in human PC cells and pancreatic ductal cells. The data suggested that the protein and mRNA expression levels of FMNL1 were remarkably higher in PC cells than in pancreatic ductal cells (Figure 1(f) and (g), P < 0.05). Kaplan–Meier analysis implied that elevated expression levels of FMNL1 were linked to a poor prognosis in PC (Figure 1(h)).

Expression levels and prognostic values of FMNL1 in PC. (a) Data obtained from the GEPIA dataset showed the difference in FMNL1 expression between tumor and paratumor tissues. (b) Data sourced from the CPTAC dataset showed the difference in FMNL1 protein expression between tumor and paratumor tissues. (c) Total protein expression levels of FMNL1 in individual stages of tumor. Data were obtained from the CPTAC dataset. (d) Typical images demonstrating FMNL1 expression in tumor and paratumor tissues using immunohistochemical staining. (e) The bar chart represents the expression levels of FMNL1 in the tumor as well as paratumor tissues using anti-FMNL1 staining in conjunction with semiquantitative analysis (P < 0.001). (f) Determination of FMNL1 expression levels in human PC cells and pancreatic ductal cells using qPCR (P < 0.05). (g) Determination of FMNL1 expression levels in human PC cells and pancreatic ductal cells using western blot analysis (P < 0.05) and (h) data obtained from the KM Plotter database demonstrated the prognostic values of FMNL1 in PC. FMNL1: formin-like protein 1; CPTAC: Clinical Proteomic Tumor Analysis Consortium; GEPIA: Gene Expression Profiling Interactive Analysis; KM: Kaplan–Meier; PC: pancreatic cancer; qPCR: quantitative polymerase chain reaction.
Examining the link between FMNL1 expression and the clinicopathological characteristics of PC patients
After a high expression level of FMNL1 was confirmed in PC, we speculated that the overexpression of FMNL1 may correlate with the advanced clinical stage of patients diagnosed with PC. Next, we examined the relationship between FMNL1 expression and the clinicopathological characteristics of PC, including sex, age, clinical stage, and CA-199 expression. The protein expression levels of FMNL1 were correlated with advanced N stage (Table 1). Nevertheless, there was no substantial correlation between FMNL1 expression and sex, age, T stage, M stage, and preoperative CA-199 expression level.
Suppression of FMNL1 expression impedes PC cell aggressiveness
To ascertain the involvement of FMNL1 in PC, we performed a series of cell function assays. We evaluated the correlations between FMNL1 expression and epithelial–mesenchymal transition (EMT) markers using the TCGA dataset. As shown in Figure 2(a), FMNL1 expression was positively correlated with N-cadherin, SNAI1, ZEB1, MMP9, MMP2, and vimentin expression and negatively correlated with E-cadherin expression. Our study have confirmed that FMNL1 was markedly expressed in PC cells. Thus, we performed cell function experiments on CFPAC-1 and PANC-1 cells. The knockdown efficiency of siRNA-FMNL1 in PANC-1 and CFPAC-1 cells was assessed via qRT–PCR and western blot analysis (Figure S1). Then, we investigated the impact of FMNL1 on the EMT process in PC cells. As shown in Figure 2(b), the knockdown of FMNL1 significantly amplified the expression of the epithelial marker E-cadherin and inhibited the expression levels of mesenchymal markers such as vimentin and N-cadherin in PANC-1 and CFPAC-1 cells, indicating that FMNL1 can promote the EMT process in PC (Figure 2(b)). Compared with the control groups, FMNL1-silenced PANC-1 and CFPAC-1 cells displayed lower proliferative capacity and improved apoptotic capacity (Figure 2(c)). Besides, the knockdown of FMNL1 suppressed the migratory and invasive capacities of PANC-1 and CFPAC-1 cells (Figure 2(d) and (e)). As shown in Figure 2(f), the knockdown of FMNL1 improved the apoptotic capacity of PANC-1 and CFPAC-1 cells. Taken together, FMNL1 silencing remarkably restrained PC malignancies in vitro.

Deletion of FMNL1 suppresses PC cell aggressiveness. (a) The heat map showed the aggressiveness of gene marker expression levels in PC. (b) Correlations between FMNL1 expression and markers of EMT in control and FMNL1-silenced PC cells using western blot analysis. (c) The proliferative capability of control and FMNL1-silenced PC cells was assessed using the CCK-8 assay. (d) The migratory capacity of control and FMNL1-silenced PC cells was evaluated via migration assay. (e) The invasive capacity of control as well as FMNL1-silenced PC cells was ascertained via Boyden chamber assay and (f) flow cytometry was used to evaluate the level of apoptosis in control and FMNL1-silenced PC cells. FMNL1: formin-like protein 1; EMT: epithelial–mesenchymal transition; PC: pancreatic cancer; CCK-8: Cell Counting Kit-8.
FMNL1 is linked to an inflamed TME in PC
In view of the association between formins and immune-linked processes, we subsequently examined the exact immunological function of FMNL1 in PC. A substantial number of immunostimulators, chemokines, and major histocompatibility complex molecules were elevated in the high FMNL1 expression group (Figure 3(a) to (c)). Additionally, FMNL1 was positively linked to numerous immune checkpoints, such as PD-L1, cytotoxic T lymphocyte-associated antigen-4 (CTLA-4), T cell immunoreceptor with Ig and ITIM domains (TIGIT), and lymphocyte activation gene-3 (LAG3) (Figure 3(d)). Besides, FMNL1 was substantially linked to immune cell infiltration estimated by gene set enrichment analysis (GSEA) calculators (Figure 3(e) and (g)). Then, the ESTIMATE method was used to compute the immune score, stromal score, and ESTIMATE score. Compared with the low FMNL1 expression group, the high FMNL1 expression group had an elevated immune score, stromal score, and ESTIMATE score (Figure 3(f), all P < 0.001). Altogether, FMNL1 promoted an inflamed TME in PC.

FMNL1 promotes an inflamed TME in PC. PC patients in the TCGA dataset were assigned into two groups as per their FMNL1 expression. (a) The expression levels of chemokines in PC between the high and low FMNL1 expression groups. (b) The expression levels of immunostimulators in PC between the two FMNL1 groups. (c) The expression levels of MHC molecules in PC between the two FMNL1 groups. (d) Relationship between FMNL1 expression and suppressive immune checkpoint expression. The Pearson correlation coefficients were labeled with different colors. (e) Distinction in the diverse steps of the malignant immunity cycle between the two FMNL1 groups. (f) Discrepancies in stromal score, immune score, and ESTIMATE score determined by the ESTIMATE algorithm between the two FMNL1 groups and (g) relationship between FMNL1 expression and immune cells across the cancer immunity cycle. The color revealed the P value. The size of the cycle revealed the Pearson correlation coefficient.
FMNL1 enhances PD-L1 expression
PD-L1, a key molecule of immune evasion, functions in the development, progression, and therapeutic resistance of malignant tumors. We explored the relationship between FMNL1 and PD-L1 in PC. First, we searched the TIMER website (http://timer.cistrome.org/), and the findings affirmed that FMNL1 expression was positively linked to PD-L1 expression in PC (Figure 4(a), P < 0.001, R = 0.496). Then, we divided the PC patients in the TCGA dataset into two groups based on their FMNL1 expression. The high FMNL1 expression group had increased PD-L1 expression compared with the low FMNL1 expression group (Figure 4(b), P < 0.001). The data from the GSE34153 dataset additionally support the findings (Figure 4(c), P < 0.05). Furthermore, immunohistochemical experiments were used to ascertain the expression of FMNL1 and PD-L1 in PC tissues. Figure 4(d) shows a representative case of FMNL1 and PD-L1 expression in PC tissues. Then, the protein levels of FMNL1 and PD-L1 were summarized using a semiquantitative IRS. The IRS revealed that FMNL1 expression was markedly correlated with PD-L1 expression in PC tissues (Figure 4(e) and (f), P < 0.001, R = 0.435). Then, western blot analysis, qPCR, and immunofluorescence staining were used to detect the relationship between FMNL1 and PD-L1. The findings affirmed that the transcriptional and protein expression levels of PD-L1 were substantially downregulated in FMNL1-silenced PANC-1 and CFPAC-1 cells (Figure 4(g)–(i)). Therefore, these results support the finding that FMNL1 positively regulates PD-L1 expression.

FMNL1 upregulates PD-L1 expression. (a) Relationship between FMNL1 and PD-L1 expression in PC tissues. Data were obtained from the TIMER dataset. (b) Data obtained from the TCGA dataset showed the variations in PD-L1 expression between the two FMNL1 groups. (c) Data obtained from the GEO dataset showed the discrepancies in PD-L1 expression between the two FMNL1 groups. (d) Typical images demonstrating the expression levels of PD-L1 and FMNL1 in PC tissues using immunohistochemical staining. (e) Variation in PD-L1 expression between the two FMNL1 groups using immunohistochemical Continued.staining and semiquantitative evaluations. (f) Correlation between FMNL1 and PD-L1 expression in PC tissues using immunohistochemical staining and semiquantitative analysis. (g, h) Transcriptional and protein expression levels of PD-L1 in control and FMNL1-silenced PC cells were quantified via qPCR and western blot analysis and (i) subcellular localization of PD-L1 in control and FMNL1-silenced PC cells was captured via immunofluorescence. FMNL1: formin-like protein 1; GEO: Gene Expression Omnibus; PC: pancreatic cancer; PD-L1: programmed cell death 1 ligand 1; qPCR: quantitative polymerase chain reaction; TCGA: The Cancer Genome Atlas; TIMER: Tumor Immune Estimation Resource.
Discussion
PC has been affirmed as one of the most prevalent malignant cancers with a 5-year OS rate of <8% (range: 2%–9%) worldwide. 8 The current therapy for PC patients is mainly chemotherapy. 9 The emergence of immunotherapy has been identified to have the capability of inducing durable inhibition of tumor growth.10–12 However, immunotherapy has limited efficacy in PC patients. 13 These drawbacks might be closely related to the robust immunosuppression induced by the TME, encouraging the study of the immunosuppression mechanism of PC. Zhang et al. 14 concluded that tumor necrosis factor receptor 2 (TNFR2) can block the mechanisms of effector T cells and that the combination therapy of anti-TNFR2 and anti-PD-L1 can impede PC by relieving tumor immunosuppression. Another study demonstrated that inhibition of histone deacetylase 5 can sensitize PC to immune checkpoint blockade therapy in a mouse model. 15 Although an increasing number of studies have focused on the immunosuppression mechanism of PC, immune checkpoint inhibitor therapy or combination therapy demonstrated unsatisfactory outcomes in PC.16–18 Therefore, a deeper understanding of the PD-L1 mechanism is urgently required, and the relief of tumor immunosuppression is of great importance in research.
The TME is a dynamic ecosystem mainly comprising tumor cells, immune cells, complex cytokines, stromal cells, and chemokines. 19 The major components in the TME, encompassing immune cells and stromal cells, are of paramount significance in not only the diagnosis but also the prognosis of tumors. 19 According to the classification of TME, cancer can be categorized into three phenotypes—excluded, inflamed, and desert immune phenotypes. 20 Immune-inflamed tumors, also named “hot” tumors, are characterized by high T cell infiltration, elevated PD-L1 expression, and enhanced tumor mutation burden and are sensitive to immunotherapy. 21 Another immune phenotype is “cold” tumors, including excluded and desert immune phenotypes, which are insensitive to immunotherapy. 21 PC constitutes one of these “cold” tumors and is thus insensitive to anti-PD-1/PD-L1 therapy. 22 Hence, elucidating the molecular biological mechanism of PC tumorigenesis as well as immune-related factors in the TME is central to improving the prognosis of patients with PC.
Formins exhibit evolutionary conservation and are responsible for mediating the biological functions of the cytoskeleton. 23 Although their various molecular mechanisms in tumors have been discovered, the relationship between formins and tumor immunity has not been established yet. The study revealed remarkable correlations between FMNL1 and immunofactors, encompassing immune checkpoints and tumor-infiltrating immune cells. Previous research has uncovered the link between EMT and immune suppression.24,25 Scholars have proposed that EMT-linked genes were markedly associated with PD-L1 expression in breast cancer and might predict the efficacy of immunotherapy. 3 Formin proteins were crucial for both tumor metastasis and EMT.26,27 Among a panel of transcriptional factors implicated in the EMT process, ZEB1 was found to be essential for PD-L1 expression as per a study by Noman et al. 28 We discovered that DIAPH1, another member of the formin family, acts as an upstream regulator of ZEB1-induced PD-L1 transcription. 3 In this study, we found that the inhibition of FMNL1 expression downregulated the expression of EMT-linked genes, indicating that FMNL1 expression is correlated with the EMT process. Therefore, we hypothesized that ZEB1 regulates PD-L1 expression by acting downstream of FMNL1.
Literature has proposed that FMNL1 participates in cell polarization, division, adhesion, movement, and migration. 29 Besides, FMNL1 expression is elevated in several cancers and has been proven to promote tumor malignancy.30,31 Elevated protein level of FMNL1 was linked to the American Joint Committee on Cancer stage in clear cell renal cell carcinoma. 32 Another study revealed that increased FMNL1 expression was correlated with later T grade. 30 Consistent with previous studies,30,32 FMNL1 expression was augmented in PC tissues, and elevated protein level of FMNL1 was substantially correlated with advanced N stage, indicating that FMNL1 is involved in tumor progression and metastasis. However, there was no substantial correlation between FMNL1 expression and clinical stage. Hence, a study with a large sample size and more clinical cases is needed in the future. Recently, another study reported that FMNL1 is markedly expressed in immune cells compared with that in hepatocellular carcinoma tumor cells, and augmented FMNL1 expression could predict better clinical outcome. 33 This study affirmed that FMNL1 stood out as a critical oncogene and substantial FMNL1 expression could prognosticate poor clinical outcome in PC. Previous studies have revealed that elevated FMNL1 expression enhanced the migration of T cells and macrophages, and FMNL1+ immune cells had robust migration capability.34,35 The study speculated that distinct prognostic characteristics in varied malignancies stemmed from the balance of FMNL1 expression in tumors and immune cells. 33
In conclusion, we report that FMNL1 expression is upregulated in PC and functions as a critical oncogene. Besides, FMNL1 is identified as an upstream regulator of PD-L1 expression. Overall, to the best of our knowledge, this study revealed for the first time that FMNL1 is associated with PD-L1, potentially providing key insights into FMNL1-mediated tumorigenesis and immune escape.
Supplemental Material
sj-pdf-1-imr-10.1177_03000605251365844 - Supplemental material for The role of formin-like protein 1 in pancreatic cancer and its specific effects on immunity
Supplemental material, sj-pdf-1-imr-10.1177_03000605251365844 for The role of formin-like protein 1 in pancreatic cancer and its specific effects on immunity by Jian Liu, Junli Ding, Liang Chen, Shoupeng Shao, Jie Mei and Xuejing Yang in Journal of International Medical Research
Footnotes
Acknowledgments
All authors appreciate the academic assistance provided by Professor Chaoying Liu.
Authors’ contributions
Jie Mei and Xuejing Yang designed the study and took charge of project coordination. Junli Ding and Liang Chen collected the public data and executed the bioinformatics analysis. Jian Liu and Shoupeng Shao performed in vitro assays and immunohistochemical staining. Jian Liu and Junli Ding wrote the draft. Jie Mei and Xuejing Yang revised the manuscript. All authors reviewed and approved the final edition.
Consent to publication
Not applicable.
Data availability statement
All data generated or analyzed during this study are included in this published article.
Declaration of conflicting interests
The authors declare no competing interests.
Ethics approval and consent to participate
The Clinical Research Ethics Committee of Yancheng Third People’s Hospital approved the study (No. 202237). All steps were conducted following the rules and regulations.
Funding
This work was supported by the College-local collaborative innovation research project of Jiangsu Medical College (No.20229122).
References
Supplementary Material
Please find the following supplemental material available below.
For Open Access articles published under a Creative Commons License, all supplemental material carries the same license as the article it is associated with.
For non-Open Access articles published, all supplemental material carries a non-exclusive license, and permission requests for re-use of supplemental material or any part of supplemental material shall be sent directly to the copyright owner as specified in the copyright notice associated with the article.