
Abstract
Objective
To conduct a metabolomics analysis in patients with spondyloarthritis (SpA) and compare results with those from healthy controls. The overall goal was to identify small-molecule substances that may have potential pathogenic and diagnostic significance in SpA.
Methods
This was an observational, cross-sectional, single-centre study that included patients with axial (ankylosing spondylitis [AS]), peripheral (psoriatic arthritis [PsA]) and healthy controls.
Results
The study included 50 patients with AS, 50 patients with PsA, and 164 controls. When compared with healthy controls, patients with SpA showed significant differences in 35 metabolites, primarily associated with amino acid and lipid metabolism. However, only two differences were found between the AS and PsA cohorts (glucose and glycerol).
Conclusions
Our data suggest that patients with SpA exhibit significant disruptions in amino acid and lipid metabolism. The large number of identified metabolites offers promising opportunities, both for discovering new SpA biomarkers and for gaining a deeper understanding of the pathophysiology of these chronic inflammatory diseases.
Introduction
The global prevalence of spondyloarthritis (SpA) or seronegative spondyloarthropathy has been estimated to be approximately 1%. 1 The disease includes several sub-types: ankylosing spondylitis (AS); psoriatic arthritis (PsA); reactive arthritis; enteropathic arthritis. In certain cases, a specific subtype of SpA might not be identified, yet characteristic features such as unilateral sacroiliitis may still be observed. In these instances, a diagnosis of undifferentiated SpA is appropriate. 2 Therapeutic decisions are crucially influenced by the main symptoms, which have led to the distinction between axial and peripheral types of SpA. Axial diseases can be further categorized as non-radiographic, or radiographic, with the latter displaying evidence of vertebral/sacroiliac involvement even in conventional X-ray examinations. 3 While classification criteria for axial and peripheral SpA were published more than a decade ago,4,5 therapeutic recommendations, such as the ASAS-EULAR recommendations for the management of axial spondyloarthritis, are regularly updated. 3 However, individual treatment responses are difficult to predict. The difficulty in predicting individual responses to a specific DMARD therapy is partly attributed to the limited understanding of the aetiology and pathogenesis of the disease. While concepts about the pathogenesis of conditions like AS and PsA have been established,6,7 many aspects remain unresolved. These mainly involve the intercellular microenvironment, irrespective of whether the onset of disease processes is likely due to the interaction between genetic and external factors.
The primary objective of the concept known as ‘omics’ is to understand patterns of cellular and tissue responses in a more integrated manner, both in normal and abnormal conditions. 8 The term ‘omics’ refers to datasets that involve the detection, quantification, and characterization of biological molecules. There are four main types of ‘omics’: genomics; transcriptomics; proteomics; metabolomics. 8 In particular, metabolomics provides new perspectives in the study of biomarkers for inflammatory rheumatic diseases because it involves the analysis of small molecules with a molecular weight under 1.5 kD in cells, particular tissue types, and biological fluids.
The main aim of this study was to conduct a metabolomics analysis in axial and peripheral SpA patients, and compare results with those from healthy controls. The overall goal was to identify small-molecule substances that may have potential pathogenic and diagnostic significance in SpA.
Methods
Participants
This was an observational, cross-sectional, single-centre study conducted at the healthcare centre of Brandenburg University Hospital from November 2022 to January 2023. The reporting of this study conforms to STROBE guidelines. 9 The study was approved by the ethics committee of Brandenburg Medical School (Approval No. E-01-20190911, approval date: 03/10/2020; approval of amendment: 01/20/2023). Written informed consent was obtained from patients and patient confidentiality was preserved throughout the study, with data anonymization procedures in place to protect personal information.
Patients were recruited from the rheumatology outpatient clinic. Eligible patients were aged between 18 and 90 years, with newly diagnosed or established SpA, and were receiving treatment with one or more conventional or biologic disease-modifying anti-rheumatic drugs (DMARDs), along with varying daily doses of non-steroidal anti-inflammatory drugs (NSAIDs), adjusted according to disease activity. A diagnosis of SpA was based on ASAS classification criteria for axial SpA 4 or a diagnosis of peripheral SpA according to the ASUS classification criteria for peripheral SpA and for SpA in general. 5 In this article, we refer to axial SpA as AS, and peripheral SpA as PsA (provided that the patients had a history or visible signs of psoriasis, or a positive family history of psoriasis or PsA). Exclusion criteria were as follows: uncontrolled psychiatric disorders; presence of additional autoimmune-mediated diseases; uncontrolled infectious diseases (i.e., human immunodeficiency virus [HIV], hepatitis B or C, or tuberculosis); drug or alcohol addiction; pregnancy.
Disease activity of SpA was assessed using a visual analogue scale (VAS), 10 BASDAI (Bath Ankylosing Spondylitis Disease Activity Index), 11 HFQ (Hannover Functional Questionnaire), 12 DAPSA (Disease Activity in PSoriatic Arthritis Score), 13 ASDAS (Ankylosing Spondylitis Disease Activity Score), 14 Ott’s sign, 15 Schober’s test, 16 and humoral inflammatory markers (erythrocyte sedimentation rate [ESR] and C-reactive protein [CRP]). Cardiovascular risk was assessed based on 20 parameters (i.e., sex; age; body mass index [BMI]; smoking history; alcohol history; stress history; exercise history; family history of atherosclerosis; hypertension; hyperlipidaemia; coronary artery disease [CAD]; obesity; diabetes mellitus; serum creatinine; proteinuria [albumin/creatinine ratio from spot urine sample]; total cholesterol; low density lipoproteins [LDL]; high density lipoproteins [HDL]; Lipoprotein (a) [Lp(a)]; N-Terminal prohormone of Brain Natriuretic Peptide [NT-proBNP]). Healthy individuals were selected as controls, matched for age and sex, and recruited from the staff at the University Hospital Brandenburg.
Nuclear Magnetic Resonance measurements
After thawing (i.e., approximately 3 h at room temperature), 350 µl of serum was taken and mixed with 350 µl of aqueous buffer. The buffer contained: H2O p.A.; 0.1 g/l NaN3; 0.067 mol/l Na2HPO4; 0.033 mol/l NaH2PO4 (pH: 7.15 ± 0.05); 5% D2O as field-lock substance; internal standard (6 mM pyrazine) for quantification. From this mixture, 600 µl was transferred into a 5 mm Bruker nuclear magnetic resonance (NMR) tube and it was sealed with barcode-labelled lid. The NMR measurement was performed on a Bruker AVANCE NEO 600 MHz (measuring method 1D 1H noesygppr1d_d20, NS = 16, 516 T = 310 K). The measuring time was 6.5 min per sample. All measured spectra passed the QC routine and were released for data analysis. Metabolomic profiling was conducted using a Bruker AVANCE NEO 600 MHz NMR spectrometer.
The spectra obtained were Fourier transformed using TopSpin software (version 4.0, Bruker Biospin, Germany). All spectra were automatically phased and subjected to baseline correction. Subsequently, the 264 spectra were analysed using the proprietary lifespin Profiler software (version 1.4_Blood) and a quantitative metabolite list was generated. All metabolites were quantified in mmol/L.
Statistical analysis
Statistical analysis was performed using R software. 17 Statistical significance was determined using the Wilcoxon-Mann-Whitney test. The resulting P-values were corrected for multiple testing (i.e., false discovery rate [FDR] correction) before translation into *-notation. A P-value <0.05 was considered to indicate statistical significance.
For effect sizes, fold change and Cohen’s d were determined. The fold change was calculated as the quotient of the mean values of both groups where a fold change of 1 implied that the mean values were the same and a fold change of 0.5 indicated that the mean value of group 2 was twice as large as the mean value of group 1. Cohen’s d was calculated by dividing the difference of the means of the respective groups by their pooled standard deviation (SD) and taking the absolute value where effects were interpreted as small (Cohen’s d ≤ 0.5), moderate (Cohen’s d 0.5–0.8) or large (Cohen’s d ≥ 0.8).
For the multivariate analysis, we conducted a Principal Component Analysis (PCA), which is a statistical technique used for dimensionality reduction, data compression, and exploratory data analysis. The analysis transforms a large set of variables into a smaller set of uncorrelated variables called principal components, which captures the most important information in the dataset. Principal components are linear combinations of the original variables, and typically capture the majority of the variance in the dataset. A scree plot illustrates the variance explained by each component, aiding in the decision of how many components to retain, while loadings show the contribution of each original variable to the components, and scores represent the coordinates of the data in the reduced-dimensional space.
In addition, we used a Partial Least Squares Discriminant Analysis (PLS-DA). This analysis is a supervised classification method that leverages class information to identify variables that maximize the separation between classes. This method determines a set of components where each successive component captures the highest possible covariance between the dataset X (measured data points) and its labels Y (group classifications). The quality of the PLS-DA model is evaluated using cross-validation parameters R2 (variance explained) and Q2 (predictive capability). R2X and R2Y represent the respective variance explained by the X and Y matrices, while Q2Y indicates predictive accuracy. An effective model is indicated by values of the cumulative parameters R2X, R2Y, and Q2Y close to 1. For any model building (PCA, PLS-DA), the nearZeroVar function in R was used to remove zero variance predictors (i.e., metabolites which have few unique values relative to the number of samples).
We did not rely on metabolomics databases (e.g., HMDB, KEGG, or METLIN) for metabolite identification. Metabolite identification and quantification were based on proprietary algorithms and software. During the development of these algorithms, each metabolite was directly measured as a pure substance in the relevant matrix to ensure accurate and dependable identification.
Results
Participants
In total, 100 patients (66 women, 34 men) participated in the study and the mean (SD) age was 54.2 ± 14.2 years (Table 1). The control group consisted of 164 individuals (107 [65%] women, 57 [35%] men) and the average age was slightly lower than the patient group (46.8 years [range 19 and 82 years]).
Patients’ characteristics.

Data are expressed as n, n (%) or mean ± standard deviation.
Abbreviations: HLA-B27, human leukocyte antigen B27; NMR, nuclear magnetic resonance; VAS, visual analogue scale; HFQ, Hannover Functional Questionnaire; BASDAI, Bath Ankylosing Spondylitis Disease Activity Index; ASDAS, Ankylosing Spondylitis Disease Activity Score ; cDMARDS, conventional disease-modifying antirheumatic drugs; MTX, methotrexate; SSZ, salazosulfapyridine; bDMARDS, biologic disease-modifying antirheumatic drugs; anti-TNF-α, anti tumour necrosis factor alpha; anti-IL, anti-interleukin; tsDMADS, targeted synthetic disease-modifying antirheumatic drugs; JAKi, Janus kinase inhibitors; PD4, phosphodiesterase 4; HbA1C, haemoglobin A1C; LDL, Low Density Lipoproteins’ NT-proBNP, N-terminal prohormone of brain natriuretic peptide; CRP, C-reactive protein; ESR, erythrocyte sedimentation rate, –, not available; ns, not statistically significant; F, female; M, male.
Of the 100 patients, 50 had AS and 50 had PsA. The average disease durations were 14.5 ± 10.6 years for AS and 9.7 ± 8.8 years for PsA, respectively. The HLA-B27 diagnostic test showed positive results in 88% of the AS cohort and 27% of the PsA cohort. Diagnosis of either unilateral or bilateral sacroiliitis was identified in 86% of the AS group and 14% of the PsA group.
Univariate comparison showed multiple significant differences (n = 35) in metabolite concentrations between SpA and healthy controls (Table 2). The identified substrates included amino acids (e.g., glycine, histidine, leucine, serine, tyrosine), alcoholic compounds (e.g., isopropanol, methanol, propanol), intermediates of lipid metabolism (e.g., myo-inositol), serum creatinine, and the purine metabolite hypoxanthine. Although most metabolites (n = 26) were lower in patients with SpA compared with controls, nine metabolites/intermediates were found to be elevated in SpA (i.e., pyruvic acid, acetoacetic acid, glycoprotein acetyls A, ascorbic acid, myo-inositol, glycoprotein acetyls B, mannose, lactic acid, and creatinine). Multi-variate analysis (i.e., PCA and PLS-DA) are provided in Figure 1 and Figure 2, respectively.
Metabolites with significantly different serum concentrations between patients with spondyloarthritis (SpA) and healthy controls.

***P ≤ 0.001; **P ≤ 0.01; *P ≤ 0.05.

Comparison of spondyloarthritis (SpA) and healthy controls using Principal component analysis (PCA). Coloured points represent individual samples. PCA-scores were 16% for component 1, and 10% for component 2.

Partial least squares-discriminant analysis (PLS-DA) of Spondyloarthritis (SpA) and healthy controls. Coloured points represent individual samples. Coloured ellipses represent 95% confidence intervals. PLS-DA Scores were 14% for component 1, and 8% for component 2.
Comparison of AS with PsA
Results from patients with AS and PsA were compared separately with results from healthy controls. Multiple metabolites varied between AS patients and controls, with the majority showing significantly lower concentrations in AS (Table 3). However, the following metabolites were significantly increased in AS patients: acetoacetic acid; pyruvic acid; glycoprotein acetyl A; ascorbic acid; myo-inositol, and creatinine. The PLS-DA score plot including the validation parameters is shown in Figure 3.
Metabolites with significantly different serum concentrations between patients with Ankylosing Spondylitis (AS) and healthy controls.

***P ≤ 0.001; **P ≤ 0.01; *P ≤ 0.05.

Comparison of Ankylosing spondylitis (AS) and healthy controls using (a) Principal component analysis (PCA) and (b) Partial least squares-discriminant analysis (PLS-DA). Coloured points represent individual samples. Coloured ellipses in b represent 95% confidence intervals. PLS-DA Scores were 15% for component 1, and 7% for component 2.
Comparative analysis of the metabolic profiles between controls and PsA patients showed 11 metabolites at lower concentrations in PsA, while 19 substances were significantly elevated in PsA (Table 4). The PLS-DA score plot including the validation parameters is shown in Figure 4.
Metabolites with significantly different serum concentrations between patients with Psoriatic Arthritis (PsA) and healthy controls

***P ≤ 0.001; **P ≤ 0.01; *P ≤ 0.05; ns, not statistically significant.

Comparison of psoriatic arthritis (PsA) and healthy controls using (a) Principal component analysis (PCA) and (b) Partial least squares-discriminant analysis (PLS-DA). Coloured points represent individual samples. Coloured ellipses in b represent 95% confidence intervals. PLS-DA Scores were 13% for component 1, and 9% for component 2.
Significant differences between AS and PsA were found for two metabolites, glucose (mean values 0.82 times lower in AS; Cohen’s d −0.48; P = 0.00027) and glycerol (mean value 0.75 times lower in AS; Cohen’s d −0.66; P = 0.00037). In a PCA, no clustering between these groups was visible.
Risk factors and phenotyping
To further characterize possible metabolic aberrations in SpA, various categories or morbidities were defined. These were: obesity (normal weight/pre-obesity/obesity grades 1–3); alcohol consumption (non-regular [<three times per week] /regular [at least three times a week]); hypertension (yes/no);diabetes mellitus (yes/no); osteoporosis (yes/no); smoking (yes/no); physical activity (not regular/regular); distress (yes/no); HLA-B27 (negative/positive); HFQ (<30/30–70/>70); VAS (0–3/4–7/8–10); Schober’s test (negative/≤4 cm/>4 cm);, Ott’s sign (negative/<2 cm/≥2 cm); ASDAS (AS only/not available/0–3/>3); BASDAI (AS only/not available/0–5/>5); positive sacroiliitis findings on MRI (yes/no); daily glucocorticoid dose (<5 mg/≥5 mg); regular NSAID intake (yes/no); NSAID dose (once daily/2–3 times daily/2–3 times weekly/2–3 times monthly); regular use of COX-2 inhibitors (yes/ no), COX-2 inhibitor dose (once daily/2–3 times daily/2–3 times weekly/2–3 times monthly); other analgesics on a regular basis (yes/ no); dose of other analgesics (once daily/2–3 times daily/2–3 times weekly/2–3 times monthly).
Categorical or morbidity-associated differences in the metabolic profile were separately determined for both entities (AS, PsA) by comparison with healthy controls. No significant differences in serum concentrations of any metabolites were found in patients with AS or those with PsA regardless of category or morbidity.
Finally, both entities were considered in combination. Compared to patients with grade 1 obesity, those with normal weight showed lower levels of valine, tyrosine, leucine, phenylalanine, acetone, glutamic acid, and triglycerides (Table 5). Furthermore, patients with SpA and arterial hypertension had higher serum levels of myo-inositol, glucose, urea, and tyrosine compared to normotensive patients, but lower levels of aspartic acid (Table 6).
Metabolites with significantly lower serum concentrations in normal weight compared with mildly overweight patients with spondyloarthritis (SpA).
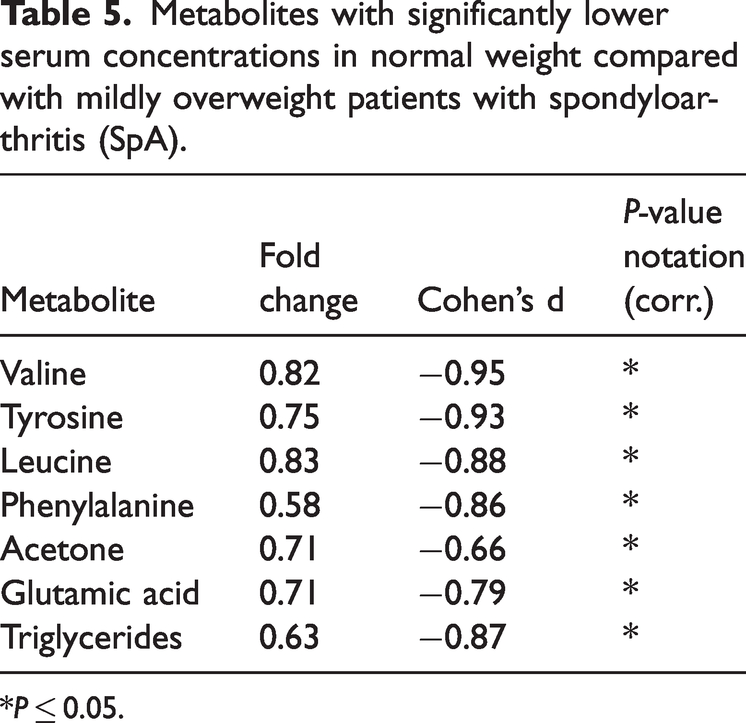
*P ≤ 0.05.
Metabolites with significantly different serum concentrations between hypertensive and normotensive individuals with spondyloarthritis (SpA).
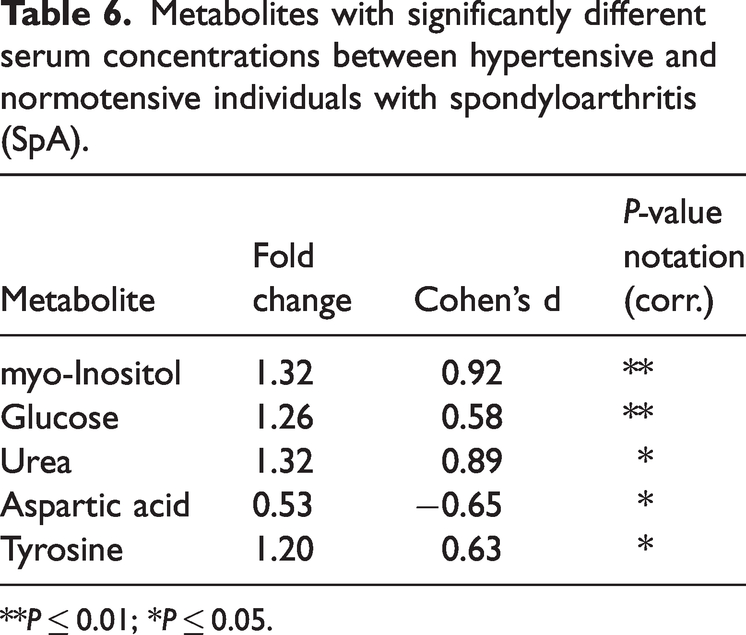
**P ≤ 0.01; *P ≤ 0.05.
Discussion
The objective of this study was to conduct a metabolomics analysis on patients with both axial and peripheral SpA, comparing them to each other and to healthy controls. The primary goal was to identify small-molecule substances that may have pathogenic and possibly also diagnostic relevance in these common autoimmune-mediated inflammatory syndromes. When compared to the control group, both the AS and PsA groups showed significant changes in serum levels of amino acids, lipid metabolism compounds/intermediates, and other surrogate markers. With regard to amino acid metabolism alone, the identified candidates showed either increased or decreased levels. However, patterns were not comparable between AS and PsA groups. The same observation also applied to lipid metabolites. Indeed, in both diseases, the metabolic profiles showed no variation in relation to predefined disease-related categories or specific morbidities. Distinct differences were noted between healthy controls and patients with SpA, both when AS and PsA patients were grouped together and when each condition was compared individually to the controls. However, significant differences between AS and PsA were found for only two metabolites (i.e., glucose and glycerol).
A comprehensive review of metabolomics in SpA, encompassing 31 studies drawn from more than 480 references, highlighted key common findings. 18 For example, in most studies SpA was associated with high levels of certain carbohydrate metabolites, including glucose, fumaric acid, and lactate. Abnormalities in polyunsaturated and short-chain fatty acids were also observed. In contrast, SpA was associated with reduced levels of tryptophan, arginine, asparagine, and glutamine. However, amino acids such as histidine, lysine, and glycine were typically found in high concentrations in affected individuals. Other studies of metabolomics and SpA have also explored whether specific SpA conditions, such as reactive arthritis, undifferentiated spondyloarthropathy, or PsA, differ from rheumatoid arthritis (RA) or osteoarthritis (OA) in terms of their metabolic profiles.19–23 Interestingly, the studies identified different metabolomic profiles in SpA and RA/OA.
In comparison to the metabolic profile patterns in SpA reported in the aforementioned systematic review, 18 our analyses showed some differing results. In another study that focused on patients with psoriasis that progressed to PsA, the authors found a suppression of bile acids and butyrate accompanied by high levels of pro-inflammatory lipid mediators. 24 Once again, our investigation did not show altered butyrate levels in PsA or AS. In contrast to the previous study that involved patients with de novo PsA, the mean disease duration of PsA in our study was 9.7 ± 8.8 years, suggesting that we predominantly included patients with established cases. A study that incorporated metabolomic profiling to identify marker panels predictive of activity in PsA considered three cohorts: one with low disease activity and two with moderate or high disease activity, based on the Psoriatic Arthritis Disease Activity Score (PASDAS). 25 A machine learning approach was used and lysophosphatidylcholine and sphingomyelin were identified as lipids of key interest. However, we observed differing phosphatidylcholine levels solely in the AS group.
Regardless of the reasons behind the apparent discrepancies between our data and findings from other metabolomics studies on SpA, it is evident that both AS and PsA are linked to notable metabolic abnormalities. These affect amino acid and lipid metabolism. Changes in lipid and amino acid metabolism have been suggested to arise from gut dysbiosis, a condition linked to imbalances in gut bacteria, which is considered a key factor in the development of SpA. 6 One study found a correlation between gut dysbiosis, disease activity, and HLA-B27 status in individuals with SpA. 26 The study examined the gut microbiome of 33 patients with SpA and found a reduction in the density of Faecalibacterium prausnitzii, a bacterium that produces butyrate. Additionally, the investigators showed butyrate therapy in SpA mice resulted in improved arthritis scores. These findings are consistent with the reduced levels of butyrate in individuals with de novo PsA as discussed earlier. 24
Although differences were observed in the overall SpA cohort when considering hypertension and obesity, our study did not identify any metabolomic differences linked to specific activity or morbidity categories. However, an important limitation of our study was the heterogeneity of the AS and PsA cohorts. This was reflected by the sex ratio, age, duration of disease and DMARD therapy. Additionally, the analysis could be considered somewhat of a snapshot. It provided limited opportunity for a thorough assessment of metabolic deviations in the context of factors such as changes in disease activity. Moreover, the sample size was small.
In conclusion, both AS and PsA are characterized by significant deviations in amino acid and lipid metabolism. These align with the currently accepted concept of gut dysbiosis as a contributing factor to the progression of SpA. However, a clear association of these deviations with pathogenetically relevant events or even the identification of metabolites with diagnostic significance remains challenging.
Footnotes
Acknowledgements
We would like to thank Mandy Voortmann for facilitating contact with lifespin GmbH. We also extend our gratitude to Sabine Bonk for the extensive assistance with the collection of samples. Lifespin were supported by its laboratory team Diana Drettwan, Ramona Mirke, Uwe Kloos and Christian Marquardt.
Declaration of conflicting interest
The authors declare there are no conflicts of interest. Selina Strathmeyer and Steffen Heelemann are employees of lifespin GmbH.
Funding
The study was supported the Ministry of Science, Research and Culture of the State of Brandenburg, Germany.