
Abstract
Objective
To evaluate correlations between ultrasonographic pupillary assessment (UPA) and automated UPA in neurocritical patients.
Methods
This was a prospective, observational study of 20 adult patients admitted to the intensive care unit with neurological pathology. Between UPA and automated UPA, 40 pupillary measurements were made. The time required to conduct UPA and automated UPA on a single patient was consistently < 3 minutes. Automated UPA required a markedly shorter operational time than UPA.
Results
There were strong positive associations between UPA and automated UPA measurements, with the following correlations: right eye at rest, r = 0.9973; left eye at rest, r = 0.9989; right eye post-pupillary light response, r = 0.9975; left eye post-pupillary light response, r = 0.9955. Bland–Altman analyses confirmed the strong agreement between the two methods under both conditions, with most measurements falling within the limits of agreement. Both the right and left pupillary diameters at rest demonstrated consistency, and the post-pupillary light response measurements for both eyes indicated good agreement, with a few outliers.
Conclusions
Automated UPA was strongly correlated with UPA in neurocritical patients. Automated UPA is a rapid, feasible, and noninvasive method that enables the precise evaluation of pupillary size and light response.
Keywords
Introduction
Careful pupillary assessment is a cornerstone of neurological examinations in critically ill patients, especially those with neurological complications. 1 Systematic evaluations of the pupils are routinely conducted in these settings to identify early indicators of neurological deterioration, which—in some instances—may be the sole clinically observable sign. Frequent pupil evaluation is therefore recommended as a fundamental component of the care protocol for monitoring all critically ill patients, including those with traumatic brain injury, ischemic stroke, and intracranial hemorrhage.2,3 Additionally, the monitoring of pupil dynamics is valuable for assessing the impacts of recreational drugs or medications such as analgesics, sedatives, and anesthetic agents.4,5 Typically, the clinical examination of pupillary function involves estimating the pupillary diameter (PD), testing the pupillary light response (PLR) with a penlight, and assessing the ciliospinal response by pinching the base of the neck. 6 However, bedside pupillary examinations are generally conducted without a standardized protocol or definitions, leading to substantial inter-examiner variability. 7 Moreover, even for experienced clinicians, subtle signs of pupillary dysfunction can pose diagnostic challenges. Therefore, alternative techniques have been proposed. 6
Currently, automated pupillary assessments are increasingly being adopted as a routine component of neurological examinations; this trend is supported by a growing body of literature that attests to their reliability, accuracy, and ease of use.8,9 Automated pupillometry facilitates a rapid, non-invasive, reliable, and quantifiable assessment of pupillary function, which can then expedite the diagnosis of intracranial pathologies, thus influencing clinical decision-making.10,11 However, this technique is rarely available outside of highly specialized centers and is not feasible in cases with severe eyelid swelling, which is common in traumatic injuries. By contrast, B-mode ultrasound is a simple and widely available non-invasive imaging technique. The first report of ocular ultrasound was made in 1956. 12 Currently, multipurpose ultrasound systems are widely available and can be used safely even with major eye trauma. 13 Moreover, technological advances in ultrasound devices have made it possible to implement ocular ultrasound for the evaluation of several ophthalmological pathologies, such as ocular trauma and intraocular foreign body identification.14,15 In this context, an ultrasonographic pupillary assessment (UPA) is particularly useful because it offers a simple yet accurate alternative to conventional pupil examinations that can be performed using small, portable devices at the point of care.16,17 Notably, however, when ultrasound equipment is used to detect the PLR, an assistant is needed to illuminate the pupil and the measurements must be taken quickly after freezing the image, which makes this technique relatively inconvenient to perform.
With the further development of ultrasound technology, specialized ultrasound sensors have been recently developed; they have integrated lighting equipment and can automatically capture pupil size and reaction time. To our knowledge, however, there is currently no published research on automated pupil detection using ultrasound. In the present study, we therefore aimed to evaluate the feasibility of automated UPA measurement by comparing it with manual UPA methods.
Methods
Study design and population
This investigation was designed as a prospective observational study in strict adherence to the Declaration of Helsinki and received approval from the institutional review board of the First People’s Hospital of Linhai on 20 October 2022 (ethical approval number: 2022009). We enrolled patients aged 18 years and over who were admitted to the Intensive Care Unit (ICU) of the First People’s Hospital of Linhai between 20 October 2022 and 20 March 2024. We rigorously excluded patients presenting with ophthalmological or periorbital conditions that might confound pupillary assessments, including atypical pupillary anatomy or compromised neurological baselines.
Informed consent and data collection
At the point of ICU admission, consent was systematically obtained from each patient’s next of kin. The severity of each patient’s condition was evaluated using the Glasgow Coma Scale. We also conducted a comprehensive review of the electronic medical records to collate demographic data including age, sex, and physiological metrics such as vital signs (heart rate, respiratory rate, blood pressure, and temperature) and available hemodynamic parameters. We have de-identified all patient details. The reporting of this study conforms to the Strengthening the Reporting of Observational Studies in Epidemiology (STROBE) guidelines. 18
UPA and automated UPA
Both UPA and automated UPA were conducted sequentially during the same patient visit using an EDAN AX8 system (EDAN Instruments, Inc., Shenzhen, China) equipped with a 7- to 17-MHz linear probe (L17-7EQ) (Figure 1). To maintain consistency in ambient lighting, all room lights were switched off and the windows were covered with curtains, thus ensuring uniform illumination within each patient’s room regardless of the time of day of the examination.

Ultrasound equipment and linear probe (L17-7EQ). (a) Probe under normal conditions. (b) Probe during the pupillary light response (PLR).
Because UPA requires the manual measurement of PD, we performed the UPA first, followed by the automated UPA. In this way, we reduced potential sources of observer bias. The time between the UPA and automated UPA was less than 3 minutes, during which there was no administration of new medications, physical maneuvers, or activities involving the patient. The UPA and automated UPA examinations were conducted at any point during the ICU stay by one of the three authors (MT, YLJ, and LHC), all of whom were experienced in both methods. The ultrasound devices and the data they provided were used as the standard of care; however, the devices themselves were not the subject of investigation.
The UPA encompassed the evaluation of bilateral PD and PLR. First, the ultrasound machine was set to the “ophthalmic” preset and the patient was positioned supine and semi-recumbent. Next, a linear 7- to 17-MHz transducer was carefully positioned over the lower edge of the closed eye for a trans-palpebral tangential view, and the probe marker was aligned toward the right side of the patient (Figure 2a). The probe was subsequently tilted until the pupil became visible. For each eye separately, a light stimulus was applied ipsilaterally over the closed eye and across the eyelid to assess the direct PLR using the ultrasonographic modality (Figure 2b and c).

Ultrasonographic pupillary assessment (UPA). (a) Probe starting position. (b) UPA at rest. (c) UPA post-pupillary light response (PLR). (d) Automated UPA at rest. (e) Automated UPA post-PLR.
Automated UPA is capable of capturing and analyzing images within less than 3 s. When positioned above the eyes, automated UPA activates light stimulation on the closed eyes to evaluate the PLR (Figure 2d and e).
The entire duration of the manual UPA per patient, covering both eyes, was under 3 minutes. Although the ultrasound machine is designed to minimize risk to users and patients, we meticulously documented all adverse events, such as eye discomfort, irritation, redness, or pain resulting from the superficial pressure of the transducer or contact with the sonographic gel.
Statistical analysis
Comparative assessments between UPA and automated UPA were conducted. We used Bland–Altman plots, dispersion graphs, and simple linear regression models to ascertain the alignment and agreement of measurements. The chi-squared test was used to evaluate the significance of categorical variables, with p < 0.05 denoting significance in accordance with established guidelines. 19 To validate the normality of the data distribution, the Shapiro–Wilk test was applied, and was complemented by quantile–quantile (Q–Q) plot analyses. All statistical computations were performed using Prism 9 for macOS (version 9.5.1; GraphPad Software, Boston, MA, USA) to ensure rigorous analytical standards and precision.
Results
Patient demographics and clinical characteristics
Our study included 20 patients with critical neurological pathology. The patients were predominantly male (60%), with an age distribution ranging from 18 to 88 years and a mean age of 56.5 years. The mean Glasgow Coma Score at the time of assessment was 8, and ranged from 3 to 15, indicating varied levels of consciousness. Each of the 20 patients underwent one session of UPA and automated UPA for each eye, resulting in 20 unique observations for the right eye and 20 unique observations for the left eye across all participants.
Linear regression analysis of pupillary measurements
Ultrasonographic assessment of PD was feasible in all subjects, and there was a strong positive correlation between UPA and automated UPA measurements. Specifically, for the right eye at rest, there was a correlation coefficient (r) of 0.9973 (95% CI 0.9930–0.9990, p < 0.0001), and for the left eye at rest, r = 0.9989 (95% CI 0.9973–0.9996, p < 0.0001). Post-PLR, r = 0.9975 for the right eye (95% CI 0.9937–0.9991, p < 0.0001) and r = 0.9955 for the left eye (95% CI 0.9885–0.9983, p < 0.0001). These results reinforce the clinical applicability of automated UPA.
Linear regression analyses corroborated the strong correlations between UPA and automated UPA measurements for PD both at rest and post-PLR. The right PD at rest displayed a regression equation of Y = 0.9796X + 0.0302 with an R2 value of 0.9946, suggesting excellent agreement (Figure 3a). The post-PLR regression equation showed a slight reduction in correlation for the right PD (Figure 3b), with an equation of Y = 0.9629X + 0.0971 (R2 = 0.9951). For the left PD at rest (Figure 3c), the equation was Y = 0.9740X + 0.0536 (R2 = 0.9979). The post-PLR regression equation for the left PD (Figure 3d) was Y = 0.9589X + 0.1550 (R2 = 0.9911).

Scatterplots showing the correlations between ultrasonographic pupillary assessment (UPA) and automated UPA. (a, b) Correlations between UPA and automated UPA for right pupillary diameter (PD) at rest (a) and post-pupillary light response (PLR; b). (c, d) Correlations between UPA and automated UPA for left PD at rest (c) and post-PLR.
Bland–Altman analysis of agreement between pupillary measurements
Bland–Altman analyses confirmed the high levels of agreement between the two methods under both conditions, with most measurements falling within the limits of agreement. The plots of the right PD at rest (Figure 4a) and post-PLR (Figure 4b) as well as the left PD at rest (Figure 4c) and post-PLR (Figure 4d) demonstrated good consistency, although the post-PLR measurements had a few outliers (Figure 4b and d).
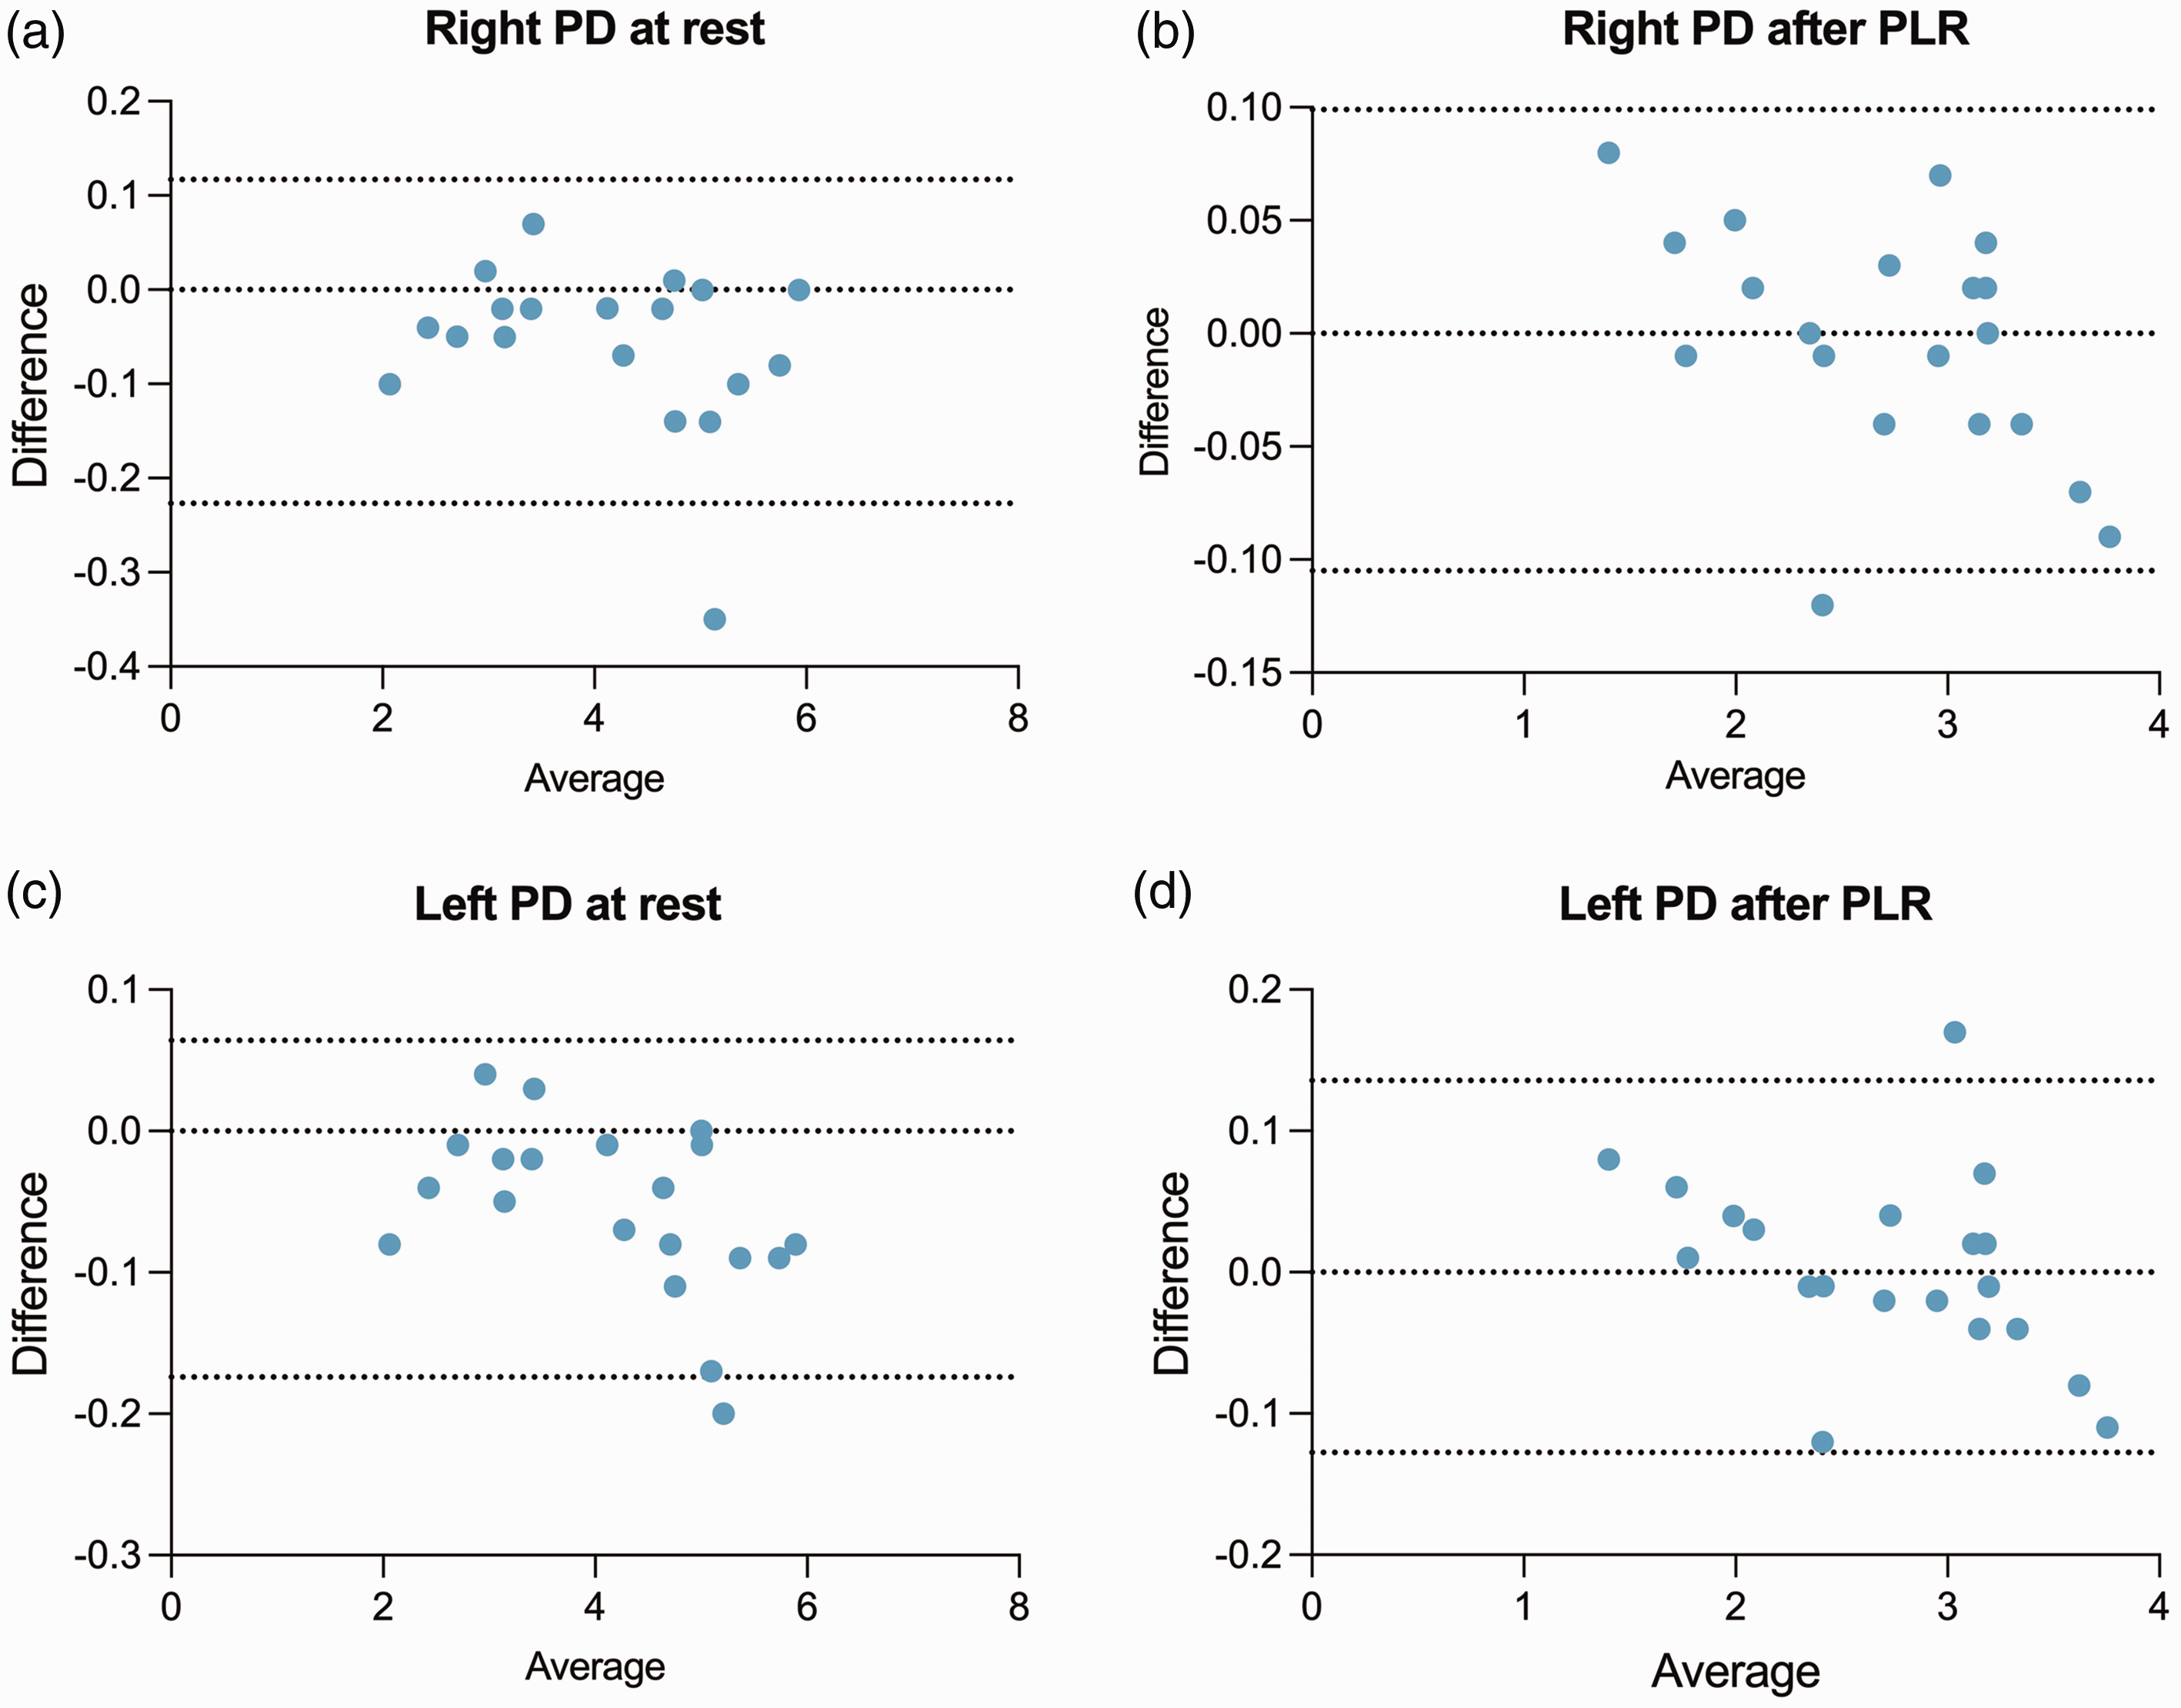
Bland–Altman graphs showing the agreement between ultrasonographic pupillary assessment (UPA) and automated UPA. (a, b) Graphs demonstrating the agreement between UPA and automated UPA for right pupillary diameter (PD) at rest (a) and post-pupillary light response (PLR; b). (c, d) Graphs demonstrating the agreement between automated UPA for left PD at rest (c) and post-PLR (d). Solid lines represent the averages of the differences; dashed lines indicate the limits of agreement (mean ± 1.96 × standard deviation).
The aggregated data from these analyses indicate that automated UPA measurements can reliably replicate UPA findings, with only minor deviations observed after PLR. These deviations, represented by a handful of outliers, will be subjected to further analysis to determine their clinical relevance.
Discussion
The present study revealed a strong correlation between UPA and automated UPA in critically ill patients, including those with neurological pathologies. Automated UPA may be used to evaluate the PD and PLR of critically ill patients who cannot open their eyes, and only requires one person for its operation. To our knowledge, this is the first study that compares UPA with automated UPA.
UPA is especially valuable in neurocritical patients because it eliminates the intra- and inter-observer variability that is inherent in direct visual examinations of the pupil (i.e., conventional pupillary physical exams). 20 Christian et al. 16 reported that UPA measurements are strongly correlated with those of infrared pupillary assessments in critically ill patients, including those with neurocritical conditions. The present findings demonstrate that automated UPA is a quick, non-invasive, practical method that provides reliable data compared with UPA; this is particularly true regarding PD and PLR, which are crucial for assessing intracranial hypertension. The most important application of automated UPA may be to provide accurate pupillary assessments in patients who are unable to open their eyes because of conditions such as periorbital soft tissue edema or significant eyelid edema, which commonly occurs in patients with extensive burn injuries. Moreover, for scenarios in which patients are at risk of or suspected to have critical neurological pathologies such as brain herniation present alongside periorbital edema (e.g., traumatic brain injury), automated UPA may be used while waiting for other imaging studies, such as computed tomography scans, in emergency departments, ICUs, and operating rooms. It may also be useful in pre-hospital emergency settings or underserved areas in which advanced imaging technologies (e.g., computed tomography or magnetic resonance imaging) are unavailable. 20
UPA is consistently reported to be a highly operator-dependent tool; the technical level of the operator directly affects the accuracy and reliability of the ultrasound examination. For example, although Farina et al. 21 reported a very high consistency between raters—demonstrating that ultrasound can be an extremely reliable diagnostic tool in professionally trained teams—the widespread application of ultrasound technology is limited by its need for relatively high technical expertise and operational experience. In response to this issue, we developed an automated ultrasound measurement tool whose use may further reduce the reliance of UPA on operator technical expertise. Through automation technology, we were able to simplify the operation process and reduce the uncertainty of the operation, thus likely improving the popularity and practicality of ultrasonographic testing. This automation tool can not only improve the efficiency of detection but also help to promote its use among non-professionals, especially in areas with limited resources or a shortage of trained medical personnel. In addition, the development of automated ultrasound technology may also improve image quality and resolution through algorithm optimization, thereby further enhancing the accuracy of diagnosis. The innovation of this technology may have a profound future impact on multiple fields such as emergency medicine, telemedicine, and battlefield medicine, ultimately making ultrasound examination a more powerful and flexible medical tool.
The development of automated ultrasound measurement tools not only innovates traditional ultrasound application methods, but also greatly expands their functions. The presently reported tool can perform complex data analysis, similar to an infrared pupillary assessment, which is not only limited to measuring PD and pupil contraction time but can also provide a detailed evaluation of PLR. 11 This includes analyzing the latency of the pupil, the speed of contraction and dilation, the dynamic acceleration of the pupil, and photoreceptor function, thus providing a more comprehensive perspective for diagnosis. 22 The advantage of this technology is that it can provide continuous and real-time data monitoring, which may help doctors to more accurately evaluate the neurological status of a patient, especially when monitoring critically ill neurological patients. 9 Automated tools can accurately capture and analyze every subtle change in pupil response, which will allow for the timely detection of potential neurological abnormalities—and their subsequent interventions—in the early stages of disease progression.
The use of automated ultrasound equipment may greatly reduce the burden on medical personnel, especially in busy clinical environments. By simplifying the testing process and improving data processing speed, healthcare professionals will be able to process more patients more efficiently while maintaining high-quality medical services. Automated ultrasound measurement tools will therefore not only improve diagnostic and treatment efficiency, but also promote overall improvements in medical service quality.
Limitations
The small patient population of the present study is its major limitation. Because of this limitation, comparisons between automated UPA and infrared pupillary assessment were not made. In the future, our research team will further compare multiple indicators between the two devices, such as the latency of the pupil, the speed of contraction and dilation, the dynamic acceleration of the pupil, and photoreceptor function. Pupillary changes can arise from various non-neurological factors, including medications, emotions, or systemic illnesses; this makes them relatively unspecific for trauma brain injury. Furthermore, pupillometry does not provide any direct insights into the underlying cause of PLR abnormalities. Additional assessments, testing, and clinical judgment are therefore essential for determining the root cause of any observed changes. In addition, because pupillometry captures data at a specific point in time, it may miss dynamic trends in neurological status unless the measurements are consistently repeated. Accurate measurements also ideally require controlled lighting conditions because fluctuations in ambient light levels can affect pupil size and reactivity, potentially leading to misleading results.23,24 Finally, the limited number of cases with anisocoria in our study restricted our ability to draw definitive conclusions about the role of UPA and automated UPA in this specific patient population. Further research with a larger cohort will be necessary to better understand the implications and effectiveness of these assessment methods in patients with anisocoria.
Conclusions
Automated UPA showed a strong correlation with UPA in neurocritically ill patients. Automated UPA is a rapid, feasible, and non-invasive method that enables the precise evaluations of PD and PLR, and will be particularly valuable in patients who require accurate pupillary measurements or cannot open their eyes.
Footnotes
Author contributions
Both the UPA and automated UPA examinations were performed by MT, YLJ, and LHC, who are experienced in UPA and automated UPA. JZL was responsible for the data collection. WTC performed the analysis of the results. WTC and XY were the main contributors to writing the manuscript. All authors read and approved the final manuscript.
Declaration of conflicting interest
The authors declare there is no conflict of interest.
Funding
This work was supported by the Taizhou Science and Technology Program Project (No. 24ywb134).