
Abstract
Objective
To investigate the relationship between plasma lipoprotein (a) (Lp[a]) and lipid profiles in patients with severe hypertriglyceridaemia (HTG).
Methods
This case–control study undertook a retrospective chart review of patients from the Lipid Genetics Clinic at London Health Sciences Centre in Ontario, Canada. Plasma Lp(a) was compared between patients with severe HTG and healthy normolipidaemic control subjects. Severe HTG was defined by plasma triglycerides (TG) ≥ 10 mmol/l. Pairwise correlations between Lp(a), TG, apolipoprotein B (apo B) and non-high-density lipoprotein cholesterol (non-HDL-C) were evaluated.
Results
This study reviewed 4400 patients and identified 154 patients with severe HTG, which were compared with 272 control subjects. The median Lp(a) was significantly lower in patients with severe HTG compared with control subjects (5.0 versus 10.2 mg/dl, respectively). No correlation was observed between Lp(a) and TG or non-HDL-C. Lp(a) and apo B were modestly correlated in patients with severe HTG (r = 0.235) and control subjects (r = 0.175). There were no significant differences between the genetic subgroups of patients with severe HTG.
Conclusions
Patients with severe HTG have lower plasma Lp(a) than normolipidaemic control subjects. The basis for this relationship is not immediately apparent but is hypothesis-generating and warrants further investigation.
Keywords
Introduction
Lipoprotein (a) (Lp[a]) is a plasma lipoprotein particle that is associated with increased risk of atherosclerotic cardiovascular disease (ASCVD) and aortic valve disease.1,2 Lp(a) is an amphipathic lipoprotein composed of a lipid core surrounded by an apolipoprotein (apo) and phospholipid shell, with apolipoprotein B (apo B) and apo(a) moieties being disulfide-linked.1,2 Recent society guidelines and position statements advocate the measurement of Lp(a) to help stratify patient risk.1,2 Despite decades of study, the metabolism of Lp(a) remains incompletely understood. 3 Plasma levels of Lp(a) are primarily determined by LPA genotype, including both copy number variation and single nucleotide polymorphisms (SNPs), with contributions from other genetic and non-genetic factors, some of which remain uncharacterized. 3
Severe hypertriglyceridaemia (HTG) is defined by a fasting plasma triglyceride (TG) concentration ≥10 mmol/l (≥880 mg/dl) and is observed in approximately 1 in 400 people in North America.4,5 It can be caused by a combination of genetic and secondary factors, such as poor diet, alcohol use, obesity and diabetes mellitus. 6 Genetic contributions to severe HTG include biallelic large-effect pathogenic variants in familial chylomicronaemia syndrome (FCS), and/or either a single large-effect pathogenic variant or many small-effect variants cumulatively creating polygenic susceptibility for severe HTG in multifactorial chylomicronaemia syndrome (MCS). 7 Medical risks of severe HTG include acute pancreatitis associated with chylomicronaemia with ASCVD risk being somewhat less consistently associated. 6
A few cohort studies from the 1990s suggested a possible inverse relationship between plasma Lp(a) and TG levels.8–11 This has not been revisited in the post-genomic era among individuals with molecularly characterized severe HTG. Therefore, this current case–control study evaluated the relationship between plasma Lp(a) and TG in a cohort of individuals with severe HTG, essentially MCS, who were all molecularly characterized.
Patients and methods
Study population
This case–control study was a retrospective chart review of consecutive patients with severe HTG referred between January 2012 and December 2022 to the Lipid Genetics Clinic at London Health Sciences Centre University Hospital in London, Ontario. Severe HTG was defined as a baseline TG level >10 mmol/l. Clinical and demographic data are routinely collected in all clinic patients. The inclusion criteria for the patients with severe HTG were as follows: (i) a baseline Lp(a) measurement was available; (ii) molecular characterization of severe HTG. Lipid profile and demographic data were also obtained from healthy control volunteers from Robarts Research Institute in London, Ontario. 12 The inclusion criteria for the healthy controls were as follows: (i) a baseline Lp(a) measurement was available; (ii) TG < 2 mmol/l. There were no other inclusion or exclusion criteria.
The study was conducted study in accordance with the Helsinki Declaration of 1975 as revised in 2013. All participants provided written informed consent to participate and the project was approved by the Western University Research Ethics Board (project number 0379). All patient details were de-identified. The reporting of this study conforms to STROBE guidelines. 13
Biochemical determinations
Baseline plasma levels of TG, total cholesterol, high-density lipoprotein cholesterol (HDL-C), non-HDL-C, apo B and Lp(a) were obtained from fasting blood samples using routine protocols as described. 12 Lp(a) was determined using immunoprecipitation and turbidimetric detection as described.14,15
Genetic sequencing and analysis
DNA from whole blood was extracted using methods described previously. 12 Each patient’s genotype was evaluated using the next-generation sequencing panel LipidSeq, targeting genes and SNPs associated with dyslipidaemia. 12 LipidSeq is run on the MiSeq DNA sequencer (Illumina, San Diego, CA, USA), using standard protocols of the London Regional Genomics Centre (www.lrgc.ca). Monogenic variants were identified in canonical FCS genes (i.e. LPL, APOC2, APOA5, GPIHBP1 and LMF1 genes). A weighted polygenic risk score (PRS) that evaluates the cumulative effect of 16 SNPs associated with TG levels was also determined.15,16 A PRS of ≥1.488, or ≥90th percentile, is considered high.17,18 The HTG cohort was also subdivided by genotype: monogenic variant positive or negative, and high or low PRS. Since monogenic status is independent of PRS, each subject was included in two groups: one based on their monogenic status and the other based on their PRS.
Statistical analyses
All statistical analyses were performed using GraphPad Prism version 8 (GraphPad Software Inc., San Diego, CA, USA) and Microsoft Excel for Windows 10 (Microsoft, Redmond, WA, USA). Pairwise correlations were determined between plasma levels of Lp(a) and TG, apo B and non-HDL-C in HTG and control cohorts. Correlation analyses were also performed for the monogenic and polygenic subgroups. Pearson correlation coefficients and two-tailed P-values were determined in Excel. Mann–Whitney U-tests were used when conducting a t-test between median values, as the test is suitable for the right-skewed distributions of Lp(a) and TG. A P-value ≤0.05 was considered statistically significant.
Results
This case–control study reviewed 4400 patients and identified 154 patients with severe HTG. A flowchart demonstrating the selection of patients with severe HTG is provided in Figure 1. Clinical and demographic data of the 154 patients with severe HTG and 272 healthy control subjects are shown in Table 1. All participants had baseline Lp(a), TG and non-HDL-C values available; and 142 patients with severe HTG and 257 healthy control subjects also had apo B values. Of the 154 patients with severe HTG, 16 had identified heterozygous monogenic variants in FCS-associated genes and 63 had a PRS ≥ 90th percentile. A total of 79 patients had MCS without either a heterozygous pathogenic variant or high PRS. Two participants did not have PRS scores available. No participant had FCS (i.e. no biallelic pathogenic variant[s]).
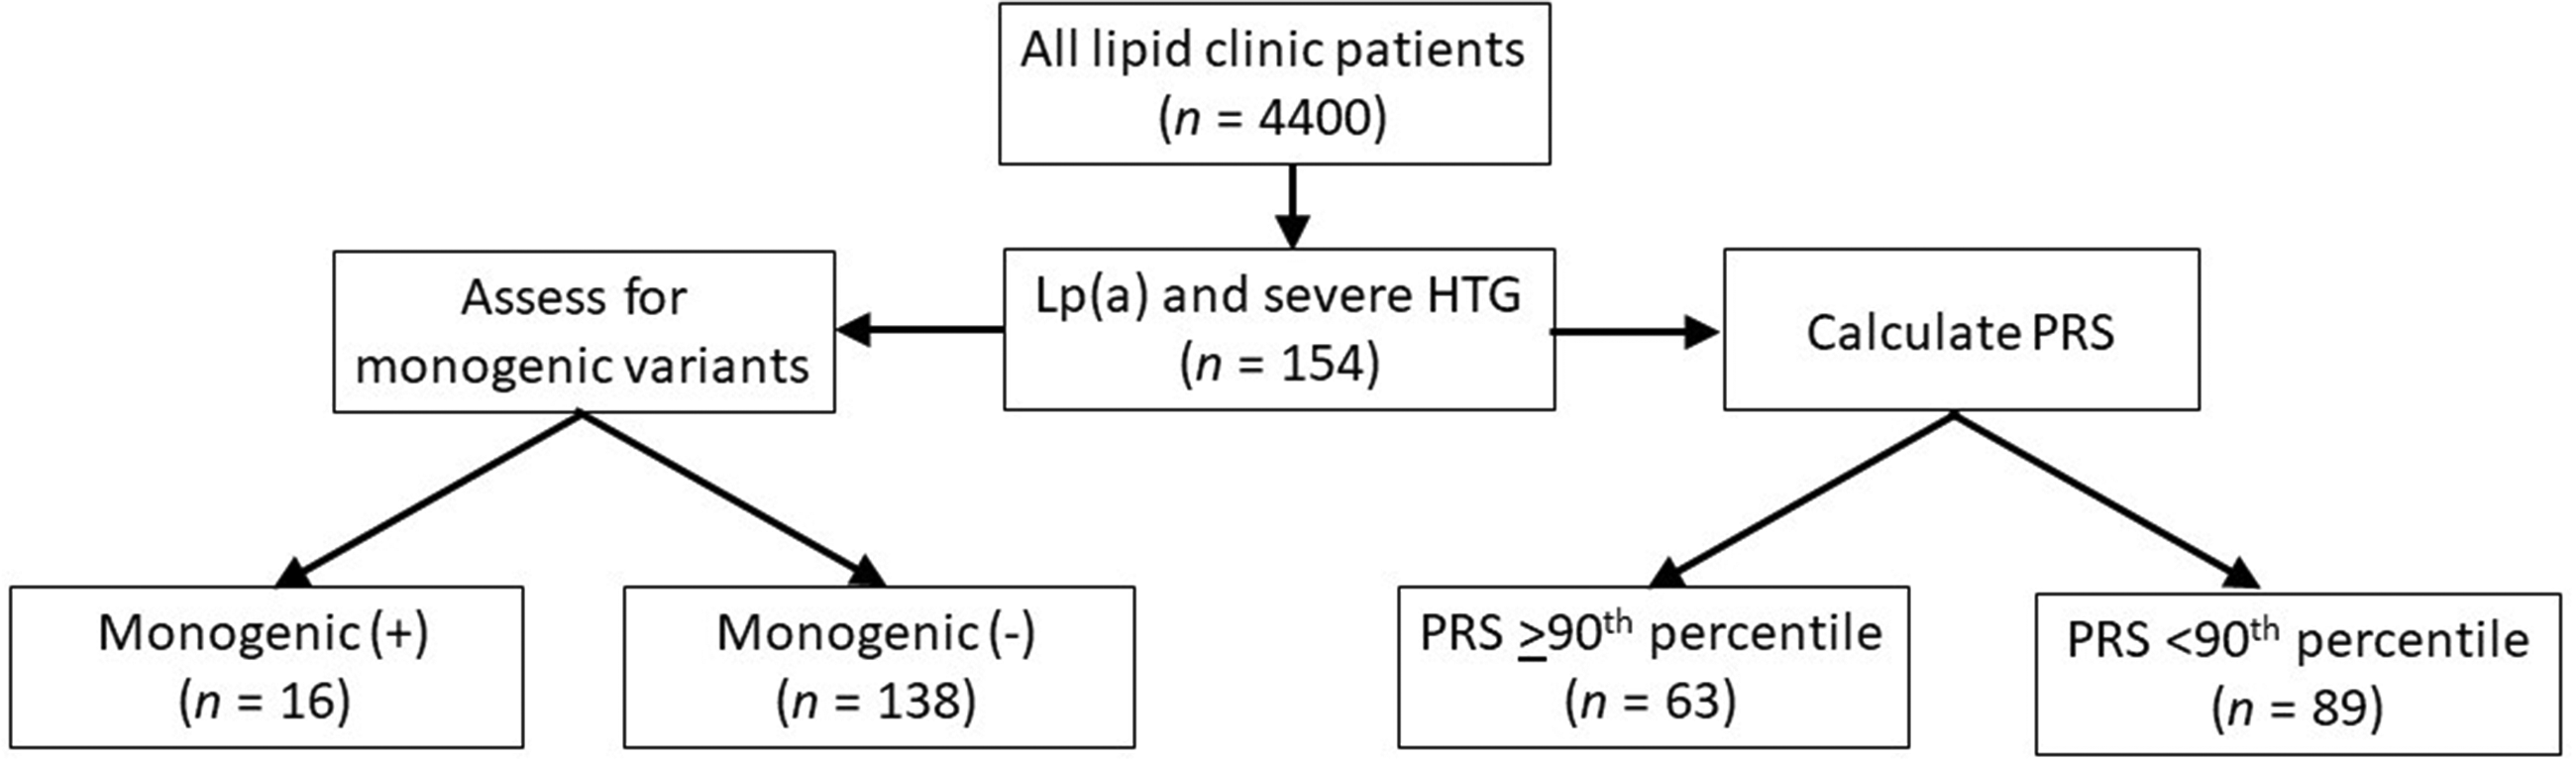
Flow chart showing patient selection and classification in a case–control study that evaluated the relationship between plasma lipoprotein (a) (Lp[a]) and triglyceride (TG) in a cohort of individuals with severe hypertriglyceridaemia (HTG) who were all molecularly characterized. The inclusion criteria consisted of available Lp(a) levels and a clinical diagnosis of severe HTG with TG >10 mmol/l. Each patient was assessed for monogenic variants and their polygenic risk score (PRS) was calculated. PRS was unavailable in two patients.
Clinical and demographic characteristics of study participants in a case–control study that evaluated the relationship between plasma lipoprotein (a) (Lp[a]) and triglyceride (TG) in a cohort of individuals with severe hypertriglyceridaemia (HTG) who were all molecularly characterized.

Data presented as n of participants (%), mean ± SD or median (interquartile range).
Between-group comparisons were obtained using two-tailed unpaired t-tests to compare sample means, Mann–Whitney U-tests to compare medians or χ2-test to compare categorical data; bn = 181 (control group); cn = 142 (severe HTG group) and n = 257 (control group); NS, no significant between-group difference (P > 0.05).
Non-HDL-C, non-high-density lipoprotein cholesterol; Apo B, apolipoprotein B.
Lipid and lipoprotein levels are reported in Table 1. Both mean and median Lp(a) levels were significantly lower in the patients with severe HTG compared with the control subjects (P = 1.4 × 10⁻¹⁶ and P < 1.0 × 10⁻⁵, respectively). As the distribution of Lp(a) is right skewed, this analysis was repeated with natural logarithm transformed Lp(a) values. The difference remained highly significant (P = 4.8 × 10⁻¹²). Lp(a) was also lower in patients with severe HTG compared with the control subjects when subdivided by genotype, although there were no differences between genotypes (see supplementary materials, Supplementary Table S1). The distributions of Lp(a) levels in the severe HTG and control cohorts were also compared: a higher proportion of patients with severe HTG had low Lp(a) compared with the control subjects (Figure 2): specifically, 95% of patients with severe HTG and 70% of control subjects had low or borderline Lp(a) levels, defined as <30 mg/dl (P = 1.7 × 10⁻¹²).

Distribution of transformed lipoprotein (a) (Lp[a]) levels in patients with severe hypertriglyceridaemia (HTG) (blue, n = 154) and healthy control subjects (green, n = 272). Data were transformed using the natural logarithm in order to visualize the two skewed distributions more clearly. Lp(a) levels are divided into groups of 5 mg/dl and the frequency of each group is displayed as a proportion of the total cohort. The colour version of this figure is available at: http://imr.sagepub.com.
No correlation was observed between plasma TG and Lp(a) in either patients with severe HTG (r = –0.072; P = 0.375) or control subjects (r = –0.038; P = 0.531) (Figure 3). The findings were similarly neutral when the HTG cohort was subdivided by genotype: monogenic variant positive (n = 16; r = 0.263; P = 0.325), monogenic variant negative (n = 138; r = –0.084; P = 0.324), high PRS (n = 63; r = 0.041; P = 0.752) and low PRS subgroups (n = 89; r = –0.104; P = 0.327) (see supplementary materials, Supplementary Figure S1).
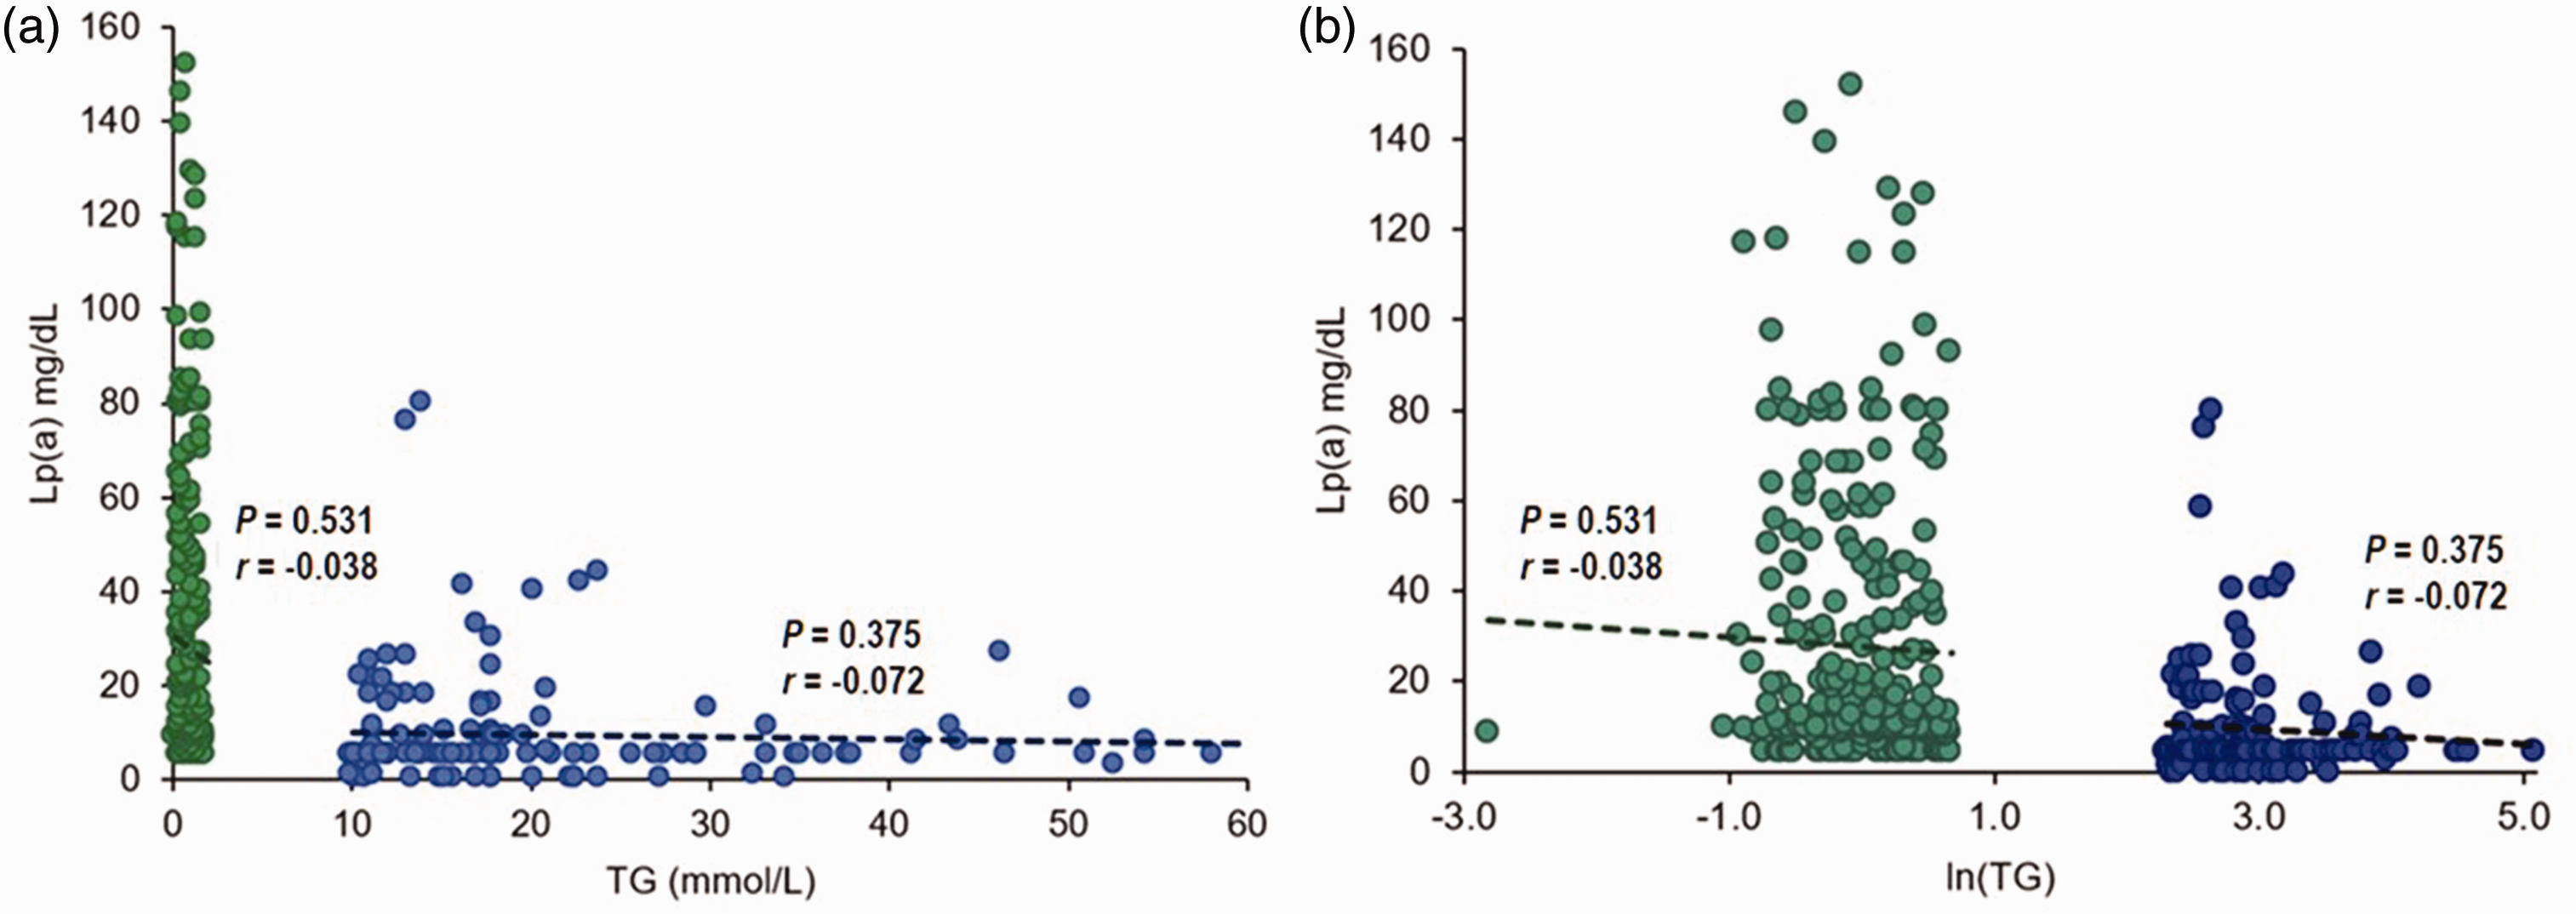
The relationship between lipoprotein (a) (Lp[a]) and triglyceride (TG) levels in patients with severe hypertriglyceridaemia (HTG) (blue, n = 154) and healthy control subjects (green, n = 267) was evaluated: (A) shows untransformed values; and (B) shows the same data with natural logarithmic transformation. For both figures, a linear trendline, Pearson correlation coefficient and correlational P-value are displayed above for the severe HTG (r = −0.072; P = 0.375) and control cohorts (r = −0.038; P = 0.531). TG were transformed using the natural logarithm to minimize the gap between cohorts and make the x-axis more accessible for viewing. Original TG levels are shown in mmol/l. The colour version of this figure is available at: http://imr.sagepub.com.
A weak positive correlation was observed between Lp(a) and apo B in the severe HTG (r = 0.235; P = 0.005) and control cohorts (r = 0.175; P = 0.005) (Figure 4). Similar modest correlations were observed when the severe HTG cohort was subdivided by genotype: monogenic variant negative (n = 126; r = 0.230; P = 0.009) and high PRS subgroups (n = 57; r = 0.427; P = 0.001), while no correlation was found in the monogenic variant positive (n = 16; r = –0.302; P = 0.255) and low PRS subgroups (n = 85; r = 0.147; P = 0.181) (see supplementary materials, Supplementary Figure S2).

The relationships between lipoprotein (a) (Lp[a]) and apolipoprotein B (apo B) and Lp(a) and non-high-density lipoprotein cholesterol (non-HDL-C) (B) levels in patients with severe hypertriglyceridaemia (HTG) and healthy control subjects: (A) the relationship between Lp(a) and apo B in patients with severe HTG (blue, n = 142) and control subjects (green, n = 257) was evaluated. A linear trendline, Pearson correlation coefficient and correlational P-value are displayed above the severe HTG (r = 0.235; P = 0.005) and control cohorts (r = 0.175; P = 0.005); (B) the relationship between Lp(a) and non-HDL-C in patients with severe HTG (blue, n = 154) and control subjects (green, n = 272) was evaluated. A linear trendline, Pearson correlation coefficient and correlational P-value are displayed above the severe HTG (r = −0.058; P = 0.473) and control cohorts (r = 0.064; P = 0.290). The colour version of this figure is available at: http://imr.sagepub.com.
No correlation was observed between Lp(a) and non HDL-C in either the severe HTG (r = −0.058; P = 0.473) or control cohorts (r = 0.064; P = 0.290) (Figure 4). The findings were similarly neutral when the severe HTG cohort was subdivided by genotype: monogenic variant positive (n = 16; r = 0.087; P = 0.747), monogenic mutation negative (n = 138; r = –0.065; P = 0.446), high PRS (n = 63; r = 0.043; P = 0.775) and low PRS (n = 89; r = −0.089; P = 0.400) (see supplementary materials, Supplementary Figure S3).
Discussion
The principal findings of this observational case–control study were: (i) median Lp(a) levels in patients with severe HTG were >50% lower than control subjects, i.e. 5.0 versus 10.2 mg/dl (P < 1.0 × 10⁻⁵), respectively; (ii) 95% of patients with severe HTG had Lp(a) levels <30 mg/dl compared with 70% of control subjects (P = 1.7 × 10⁻¹²); (iii) in both patients with severe HTG and control subjects, Lp(a) levels were not correlated with either TG or non-HDL-C levels, while only modest positive correlations with apo B levels were detected; (iv) no differences were seen in these relationships across the genetic subgroups of HTG individuals.
There is no direct mechanistic link between the metabolism of Lp(a) and TG-rich lipoproteins to explain why Lp(a) is lower in patients with severe HTG. 19 Nonetheless, the current findings echo those of similar studies conducted up to 30 years ago in clinical cohorts with non-molecularly characterized HTG.8–11 For example, it was noted that lipid clinic patients with severe HTG had significantly lower median Lp(a) levels than others; and that plasma concentrations of Lp(a) and TG were negatively correlated. 8 Another study found that the median Lp(a) level was 40% lower in patients with TG >4.5 mmol/l (>400 mg/dl) than in normolipidaemic controls (i.e. 13 versus 22 mg/dl). 9 The median Lp(a) was reported to be 47% lower in patients with HTG compared with control subjects (i.e. 9 versus 17 mg/dl) when controlling for apo(a) isoform size. 10 The median Lp(a) levels were 63% lower in those with TG > 2.3 mmol/l compared with those with TG < 2.3 mmol/l (i.e. 7 versus 19 mg/dl). 11 Another study noted an inverse relationship between TG and Lp(a) levels when HDL-C was included in their mathematical model. 20
A potential mechanistic link between elevated TG and reduced Lp(a) is unclear. This does not appear to be a laboratory artefact related to lipaemic plasma as has been reported for some other clinical analytes. 21 It is of possible interest that our laboratory could not determine Lp(a) from a single patient from our clinic with a TG concentration of 25 mmol/l and visible lipaemia (data not shown). However, aside from this single instance, Lp(a) quantitative measurements were reliably determined in all other samples, even those with much higher TG levels. Furthermore, prior reports noted the inverse relationship with mild-to-moderate HTG in the absence of lipaemia.8–11 Thus, technical artefact does not seem to be a satisfactory explanation.
Lipoprotein (a) has been shown to form stable complexes with TG-rich lipoproteins. 22 Could the catabolism of Lp(a) particles be accelerated in the presence of excessive TG-rich lipoproteins? Lipoprotein turnover studies showed that apo(a) located in the TG-rich fraction of subjects with postprandial HTG or endogenous HTG was not an integral component of plasma very low density lipoproteins or chylomicrons. 23 This observation makes the potential for increased catabolism of Lp(a) unlikely.
The current subgroup analyses indicated that Lp(a) was reduced regardless of the aetiology of severe HTG, i.e. MCS due to heterozygous pathogenic variants affecting lipolysis exclusively or MCS due to polygenic risk that affects both production and clearance of TG-rich lipoproteins, and also the MCS subgroup without any identified genetic cause. A previous study showed that individuals with heterozygous pathogenic variants in the LPL gene had similar Lp(a) levels as non-carriers. 24 Thus, in aggregate, these findings indicate that it is primarily the presence of severe HTG itself, irrespective of the precise underlying molecular mechanism that is the proximal feature associated with reduced Lp(a). Dynamic in vivo lipoprotein turnover studies simultaneously of both TG-rich lipoproteins and Lp(a) particles might help to clarify the underlying mechanism. It would also be of interest to measure Lp(a) in cohorts of individuals with molecularly characterized FCS and complete lipolytic deficiency.
This current study had several limitations. First, its descriptive nature, relatively small sample size and cross-sectional design were limitations. Given the relative infrequency of severe HTG, the sample size while reasonable, could preferably have been larger. Secondly, a slight male–female imbalance between cases and controls was present, but sex is not a major determinant of Lp(a) concentration.1,2 Thirdly, it would also be desirable to repeat the study in cohorts of non-European ancestries, given differences between ethnicities both in genetic susceptibility to HTG 25 and in Lp(a) distribution.1,2 Additional experiments measuring Lp(a) in graduated dilutions of plasma could be performed to confirm that reduced Lp(a) is indeed not due to a technical artefact. This was not performed as the samples were not available for repeat analysis. Finally, apo(a) size isoforms were not determined and thus could not be controlled for, as this information was unavailable but could be helpful to know.
In conclusion, these current findings indicate that severe HTG is associated with reduced Lp(a) levels and that this relationship appears to be independent of the molecular aetiology, i.e. heterozygous rare pathogenic variant, high polygenic risk or neither. The current findings also suggest a potential reason why patients with severe HTG may have inconsistent ASCVD risk (i.e. because of lower Lp(a) in some patients). If replicated and mechanistically clarified, these findings could advance our understanding of Lp(a) metabolism; and could possibly reveal novel factors that determine Lp(a) levels. It could also suggest new targets for Lp(a)-lowering clinical strategies.
Supplemental Material
sj-pdf-1-imr-10.1177_03000605241289294 - Supplemental material for Reduced lipoprotein (a) in patients with severe hypertriglyceridaemia
Supplemental material, sj-pdf-1-imr-10.1177_03000605241289294 for Reduced lipoprotein (a) in patients with severe hypertriglyceridaemia by Erin O. Jacob, Adam D. McIntyre, Jian Wang and Robert A. Hegele in Journal of International Medical Research
Supplemental Material
sj-pdf-2-imr-10.1177_03000605241289294 - Supplemental material for Reduced lipoprotein (a) in patients with severe hypertriglyceridaemia
Supplemental material, sj-pdf-2-imr-10.1177_03000605241289294 for Reduced lipoprotein (a) in patients with severe hypertriglyceridaemia by Erin O. Jacob, Adam D. McIntyre, Jian Wang and Robert A. Hegele in Journal of International Medical Research
Footnotes
Acknowledgements
We gratefully acknowledge the patients who participated in this study.
Author contributions
All authors contributed data and analysis to the manuscript. E.O.J. and R.A.H. drafted the manuscript and made revisions. All authors approved of the final version of the manuscript.
Data availability statement
The data that support the findings of this study can be provided by the corresponding author, R.A.H., upon reasonable request.
Declaration of conflicting interest
R.A.H. reports consulting fees from Acasti, Aegerion, Akcea/Ionis, Amgen, Arrowhead, Boston Heart, HLS Therapeutics, Pfizer, Novartis, Regeneron, Sanofi and Ultragenyx. The other authors have no conflicts to disclose.
Funding
R.A.H. is supported by the Jacob J. Wolfe Distinguished Medical Research Chair, the Edith Schulich Vinet Research Chair, and the Martha G. Blackburn Chair in Cardiovascular Research. R.A.H. holds operating grants from the Canadian Institutes of Health Research (Foundation award), the Heart and Stroke Foundation of Ontario (G-21-0031455) and the Academic Medical Association of Southwestern Ontario (INN21-011).
References
Supplementary Material
Please find the following supplemental material available below.
For Open Access articles published under a Creative Commons License, all supplemental material carries the same license as the article it is associated with.
For non-Open Access articles published, all supplemental material carries a non-exclusive license, and permission requests for re-use of supplemental material or any part of supplemental material shall be sent directly to the copyright owner as specified in the copyright notice associated with the article.