
Abstract
Objective
To investigate the possible association of periorbital melanosis (POM) with insulin resistance (IR) and vitamin D serum levels.
Methods
In this pilot, case-control study, we included 100 adult patients with POM and 100 age- and sex-matched healthy control subjects. Vitamin D levels and IR indices (i.e., homeostatic model assessment-insulin resistance [HOMA-IR], triglycerides/high-density lipoprotein cholesterol (TG/HDL-c) ratio, adiponectin/leptin (A/L) ratio) were compared between cases and controls.
Results
Compared with controls, POM cases had significantly higher values of HOMA-IR and TG/HDL-c ratio, and significantly lower values of A/L and vitamin D. HOMA-IR and TG/HDL-c ratio were statistically significantly positively correlated with POM severity while Vitamin D and A/L ratio were statistically significantly negatively correlated.
Conclusion
POM was associated with indices of IR and vitamin D deficiency. However, the exact causal link among POM, IR, and vitamin D needs to be established. However, the results of this pilot study suggest that POM may have potential as a cutaneous non-invasive marker of these metabolic disorders which would assist in detecting and treating them at an early stage.
Introduction
Skin can serve as a window to a patient’s overall health and its changes can occasionally indicate underlying disorders. 1 Periorbital melanosis (POM) is a common benign skin condition that can affect men and women of any age and is characterized by bilateral skin hyperpigmentation that can be periorbital or infraorbital. 2 POM can occur as a primary disorder independent of any systemic or local illness and in these cases is described as idiopathic cutaneous hyperchromia of the orbital region (ICHOR). 3 It can also occur secondary to genetic, constitutional, inflammatory, allergic, or vascular factors. 4 The degree of pigmentation changes with tiredness, menstrual cycle, and other physical and emotional stressors. 5
Insulin resistance (IR) is defined as an insufficient insulin response combined with impaired glucose uptake by target tissues (i.e., skeletal muscles, adipose tissue, and liver), that results in hyperinsulinemia, hyperglycaemia, hypertension, dyslipidaemia, visceral obesity, and endothelial dysfunction.6,7 Several skin disorders such as, acanthosis nigricans, hirsutism, and acne, have been linked with IR because hyperinsulinemia is associated with elevated levels of leptin, testosterone, and insulin-like growth factor-binding protein 3 (IGFBP3); these hormones play an important role in controlling gene expression essential for skin cell proliferation.8,9 Using cutaneous indicators as a marker of IR would certainly be a convenient, easier, and faster way of identifying the disorder than using standard IR indices such as homeostatic model assessment-insulin resistance (HOMA-IR), 4 triglycerides/high-density lipoprotein cholesterol (TG/HDL-c) ratio, 10 or the adiponectin/leptin (A/L) ratio. 11
Vitamin D is a fat-soluble steroid hormone synthesized in the skin by a photochemical reaction caused by exposure to the sun's ultraviolet B (UVB) wavelength. 12 It is responsible for calcium homeostasis as well as bone and mineral metabolism.13,14 Age, pigmented skin, use of sunscreen and clothes inhibit vitamin D production.15,16 Vitamin D deficiency is also linked to several conditions, including IR, cancer, and obesity.17,18 Importantly, several studies suggest that skin pigmentation is associated with low vitamin D levels. 19
The purpose of this study was to investigate the possible association of POM with three IR indices (i.e., HOMA-IR, TG/HDL-c ratio, and A/L ratio) and vitamin D serum levels in a sample of Egyptian patients with POM and compare the results with matched control subjects. Our aim was to discover a convenient and fast indicator for insulin status and vitamin D deficiency.
Methodology
Subjects
This pilot, case-control study was performed at Ain Shams University Hospital, Cairo, Egypt. A randomly selected sample of 100 adult patients with POM were recruited from the Dermatology Clinic at the hospital. A further 100 age- and sex-matched healthy control subjects were identified from the relatives of the patients attending the clinic. Subjects with overt diabetes or those using glucose-lowering medications or vitamin D supplementation were excluded from the study. The study was approved by the Research Ethics Committee (FMASU R327/2023), Faculty of Medicine, Ain Shams University, Cairo, Egypt. All patients provided written informed consent. All data were collected and retained anonymously. The reporting of this study conforms to STROBE guidelines. 20
Clinical evaluation
Detailed medical history was recorded for each participant, including age, family history of POM, history of allergy or atopy, anaemia, endocrine disorders, refraction error, eyestrain, and associated habits or lifestyle. POM diagnosis was made by a dermatologist [M.E.] and depended on the presence of bilateral periorbital round or semi-round homogenous brown pigmentation and skin discoloration compared with other facial skin areas. An eyelid stretch test confirmed POM diagnosis and excluded skin laxity and subdermal vascularity, and a gaze test excluded periorbital oedema.2,21 POM severity was determined by comparison with the surrounding skin and graded into five categories as follows: 0, no colour change from the rest of the face; I, faint pigmentation in the infraorbital fold; II, more pronounced pigmentation; III, deep dark pigmentation of all eyelid skin; IV, deep dark pigmentation beyond the infraorbital fold.2,22 The dermatologist also evaluated pigmentation in other areas of the face, such as presence of acanthosis nigricans. 23 Other clinical characteristics, including body mass index (BMI), 24 systolic and diastolic blood pressure (BP), 25 and waist/hip ratio (WHR), 24 were also recorded.
Laboratory investigations
All laboratory investigations were performed at the Central Laboratories of Ain Shams University Hospital according to standard methods. Following a 12 hour-fast, all participants had 5 ml venous blood withdrawn every morning at the same time into a serum separation vacutainer under complete aseptic conditions. Blood was allowed to clot completely before being centrifuged at 3500 rpm for 20 minutes. Separated sera were used immediately to measure the lipid profile (i.e., total cholesterol, triglycerides, and HDL-c), and fasting blood glucose (FBG) using AU680 Beckman Coulter autoanalyzer (Beckman Coulter, Inc., Brea, CA). Sera were stored at −80°C until further analysis. Of the following:
Serum 25-hydroxy vitamin D concentrations using a COBAS e411 electrochemiluminescence autoanalyzer (Roche Diagnostics, Switzerland), according to the manufacturer’s protocol. The detection limit was 4 ng/ml. Fasting insulin levels in sera using a human enzyme-linked immunosorbent assay (ELISA) kit (Cusabio, Houston, USA; CAT no.: CSB-E05069h) with a detection range of 10 µU/ml–160 µU/ml and a sensitivity of 2 µU/ml. Leptin levels in sera using a human ELISA kit (Cusabio, Houston, USA; CAT no.: CSB-E04649h), after being diluted by sample diluent (1:5), with a detection range of 0.156 ng/ml–10 ng/ml and a sensitivity of 0.060 ng/ml. Adiponectin levels in sera using a human ELISA kit (Cusabio, Houston, USA; CAT no.: CSB-E07270h), after being diluted by sample diluent (1:500), with a detection range of 1.562 ng/ml–100 ng/ml and a sensitivity of 1.102 ng/ml. Results were expressed in µg/ml after multiplying by the dilution factor. Low-density lipoprotein cholesterol (LDL-c) was calculated using the Friedewald formula (i.e., LDL-c mg/dl =Total cholesterol mg/dl – [HDL-c mg/dl + Triglycerides mg/dl/5) if triglyceride levels were <400 mg/dl.
26
HOMA-IR using the following formula: (fasting insulin in µU/ml × fasting glucose in mg/dl)/405.
27
TG/HDL-c ratio using values in units of mg/dl. High ratios indicate IR.
10
A/L ratio; adiponectin µg/ml divided by leptin ng/ml. Low ratios indicate IR.
11
Statistical analysis
Statistical analysis was performed using SPSS software (version 25.0 for Windows®; IBM Corp, Armonk, NY, USA). A P-value <0.5 was considered to indicate statistical significance. Continuous variables were presented as means ± SD and categorical variables were reported as numbers and percentages. Student’s t test was used to compare continuous variables and categorical variables were analysed using χ2 tests. Pearson correlation analysis was used to investigate the possible relationship between POM severity and four variables (i.e., IR indices [HOMA-IR; TG/HDL-c ratio; A/L ratio] and vitamin D levels). To investigate the possible predictors of POM severity, the aforementioned four variables were included in univariate and multivariate Cox proportional hazards regression analysis. The results were presented as odds ratio (OR) and 95% confidence intervals (CIs).
To find the most sensitive and specific cut-offs for discrimination of POM grade I from the grades II-IV, receiver operating characteristic (ROC) curves were used to calculate area under the curve (AUC) values to assess the predictive ability of HOMA-IR, A/L ratio, TG/HDL-c ratio and vitamin D, for grade I. Cutoff points were calculated by obtaining the best Youden index (sensitivity + specificity − 1). In addition, a multi-ROC was created to assess the efficacy of combined prediction of POM severity using A/L ratio (1.45) and Vitamin D levels (12 ng/ml).
Results
In total, 100 adult patients with POM and 100 healthy control subjects were included in the study. Details of the participants’ characteristics are shown in Table 1. Overall, there were 112 (52%) women and 88 (44%) men but there was no significant difference in the female-to-male ratio between POM cases and controls. There was also no difference between POM cases and controls in mean age (i.e., 39.6 ± 10.7 vs 38.6 ± 10.7 years). By contrast with control subjects, POM cases had statistically significantly higher values for BMI, WHR, systolic and diastolic BP, fasting insulin, total cholesterol, triglycerides, LDL-c, and leptin. Although there was no difference between groups in FBG, compared with controls, POM cases had statistically significantly higher values of HOMA-IR, and TG/HDL-c ratio than controls (P < 0.001). However, A/L ratio, vitamin D, HDL-c and adiponectin levels were statistically significantly lower in the POM cases compared with controls (P < 0.001).
Participants’ characteristics.
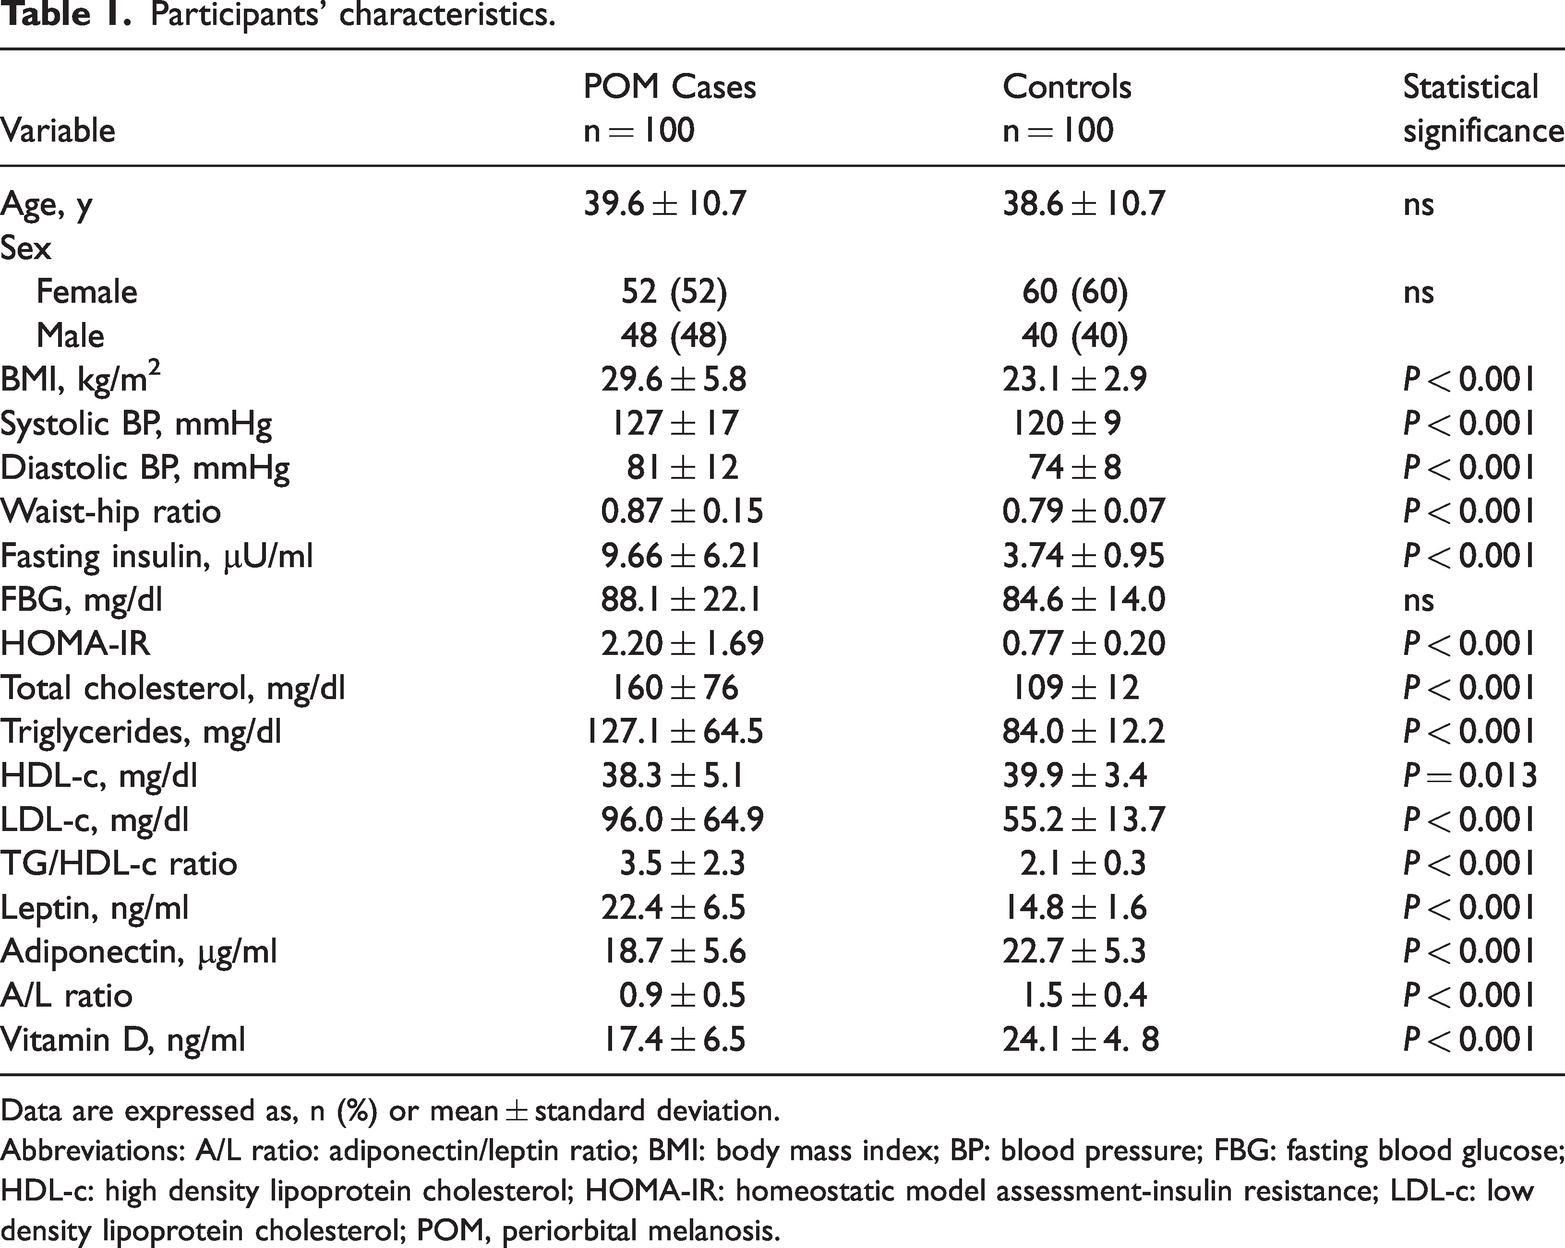
Data are expressed as, n (%) or mean ± standard deviation.
Abbreviations: A/L ratio: adiponectin/leptin ratio; BMI: body mass index; BP: blood pressure; FBG: fasting blood glucose; HDL-c: high density lipoprotein cholesterol; HOMA-IR: homeostatic model assessment-insulin resistance; LDL-c: low density lipoprotein cholesterol; POM, periorbital melanosis.
Most POM cases (65%) were of grade II severity (Figure 1). The next most common severity grade was grade I (26%), followed by grade IV (5%) and grade III (4%). The most commonly conditions noted in the POM cases were: positive family history of POM (78%); history of anaemia (52%); stress or anxiety (39%); inadequate sleep (39%); smoking (38%). We also noticed pigmentation in other face areas in 14% cases and acanthosis nigricans in 12% cases (Table 2).

Distribution of periorbital melanosis (POM) severity grades (I-IV) among cases (n = 100).
Conditions noted in POM cases.

Abbreviations: POM, periorbital melanosis.
Vitamin D (r: −0.745; P < 0.001) and A/L ratio (r: −0.635; P < 0.001) were statistically significantly negatively correlated with POM severity while HOMA-IR (r: 0.431; P < 0.001) and TG/HDL-c ratio (r: 0.363; P < 0.001) were statistically significantly positively correlated (Figure 2).

Correlation of three insulin resistance (IR) indices (i.e., homeostatic model assessment-insulin resistance [HOMA-IR], adiponectin/leptin ratio [A/L ratio], triglycerides high density lipoprotein cholesterol (TG/HDL-c) and vitamin D with POM severity (n = 100). Vitamin D and A/L ratio showed statistically significantly negative correlations with periorbital melanosis (POM) severity, while HOMA-IR and TG/HDL-c ratio showed statistically significant positive correlations (P < 0.001).
Multivariate regression analysis showed that only vitamin D serum level was a statistically significant (P = 0.007) independent risk factor for POM severity with an odds ratio (OR) of 3.99 and 95% CIs 1.46–10.89 (Table 3). A diagnostic validity test showed that the highest efficacies were for A/L ratio and vitamin D (95% and 90%, respectively). The multi-ROC of their combination (i.e., A/L ratio 1.45 and vitamin D 12 ng/ml) gave a final efficacy of 98%, a diagnostic sensitivity of 95%, a diagnostic specificity of 95%, a negative predictive value of 82% and a positive predictive value 99% (Figure 3).
Regression analyses for predictors of POM severity.

Abbreviations: OR, odds ratio; CI, confidence interval; A/L ratio: adiponectin/leptin ratio; HDL-c: high density lipoprotein cholesterol; HOMA-IR: homeostatic model assessment-insulin resistance; POM, periorbital melanosis; TG: triglycerides.

Receiver operating characteristic (ROC) curve analysis showing the predictive ability of vitamin D levels and insulin resistance (IR) indices (i.e., HOMA-IR, TG/HDL-c ratio, and A/L ratio) for discriminating grades (I vs II-IV) of periorbital melanosis (POM) patients. Abbreviations: A/L ratio: adiponectin/leptin ratio; HDL-c: high density lipoprotein cholesterol; HOMA-IR: homeostatic model assessment-insulin resistance; NDL: non-diagnostic line; Sn: Sensitivity; Sp: Specificity; TG: triglycerides.
Receiver operating characteristic (ROC) curve analysis to assess the predictive ability of variables for grade I POM

Abbreviations: A/L ratio: adiponectin/leptin ratio; AUC: Area under curve; CI: confidence interval; Eff: Efficacy; HDL-c: high density lipoprotein cholesterol; HOMA-IR: homeostatic model assessment-insulin resistance; PN: Negative predictive value; PP: Positive predictive value; SN: Sensitivity; SP: Specificity; POM, periorbital melanosis; TG: triglycerides.
Discussion
POM is a prevalent cosmetic dermatological condition and a complex disorder which is thought to occur as a consequence of several factors including genetic, lifestyle and medical. 28 Its use as a cutaneous marker of IR is uncertain. IR is considered an early subclinical stage in the progression of impaired glucose tolerance and diabetes. Identifying people with IR using an easy, rapid, and non-invasive indicator such as a cutaneous marker, will undoubtedly facilitate early intervention and prevention of diabetes and metabolic syndrome. 4 Therefore, the aim of the current study was to investigate if an association between POM severity and three IR indices (i.e., HOMA-IR, TG/HDL-c ratio, and A/L ratio) existed. In addition, we investigated the possible interaction between POM severity and vitamin D levels. For this study we used 100 patients with POM and 100 healthy age- and sex-matched control subjects.
Unlike two previous studies that found POM was most common in young female adults,28,29 the mean age of our patients was 39.6 years and there was no significant difference in female-to-male ratio of cases. However, similar to a previous study most of our patients (65%) had grade II POM. 28 Consistent with previous findings, we found that the most commonly associated conditions with POM were positive family history of POM and history of anaemia.2,30,31
Our study showed that POM severity was significantly positively correlated with the IR indices, HOMA-IR and TG/HDL-c ratio, and significantly negatively correlated with the A/L ratio. In addition, our POM patients had higher BMI, BP, WHR, total cholesterol LDL-c, fasting insulin, FBG and leptin levels, than the matched control subjects. These results are similar to those from a previous study, also in 100 POM patients and 100 healthy matched controls, that reported serum levels of leptin, FBG, fasting insulin, HOMA-IR, and A/L ratio were higher in POM patients than in controls.
It has been suggested that POM is a proinflammatory disorder linked to post-inflammatory conditions such as atopic and allergic contact dermatitis. 2 Interestingly, several studies have linked IR to inflammation; proinflammatory cytokines can disrupt insulin signalling in target tissues, decreasing glucose uptake and utilization in response to normal insulin levels resulting in compensatory hyperinsulinemia and hyperglycaemia as well as metabolic syndrome.6,7,32–34 Previously, studies have linked increased levels of leptin to both BMI and IR; leptin is a proinflammatory cytokine that promotes inflammation by trigging interleukin-6 (IL-6) and C-reactive protein (CRP) generation.35–38
We found that vitamin D serum levels were significantly lower among POM patients than controls and were significantly negatively correlated with POM severity. Consistent with our findings, several studies have reported that skin pigmentation was associated with low vitamin D levels.19,39 Another explanation for the decreased vitamin D levels among our POM patients is that they had a higher BMI and WHR than controls. Vitamin D is fat-soluble and easily retained in adipose tissue, suggesting that it may be sequestered in excess body fat in obese people. 40 To our knowledge, there are no previous studies investigating vitamin D levels and their significance in POM cases. However, we identified various publications that linked vitamin D with other skin pigmentation disorders, such as, acanthosis nigricans and vitiligo.41,42 We found that vitamin D serum levels and the A/L ratio were the best predictors of POM severity; their combination in a multi-ROC raised the diagnostic efficacy to 98%.
The study had several limitations including its single-centre design and a relatively small sample size. In addition, although we observed associations among the parameters, we did not establish a causal link. Future controlled investigations involving a large, multicentre population are required to confirm out results.
In conclusion, our study showed that POM, IR, and vitamin D deficiency were strongly associated. However, vitamin D deficiency is thought to be involved in several cardiometabolic disorders, including IR and diabetes.43–49 Therefore, the exact causal link among POM, IR, and vitamin D needs to be established. However, the results of this pilot study suggest that POM may have potential as a cutaneous non-invasive marker of these metabolic disorders which would assist in detecting and treating them at an early stage.