
Abstract
Objectives
To enhance the accuracy of forecasting future coronavirus disease 2019 (COVID-19) cases and trends by identifying and analyzing correlations between the daily case counts of different countries reported between January 2020 and January 2023, to uncover significant links in COVID-19 patterns between nations, allowing for real-time, precise predictions of disease spread based on observed trends in correlated countries.
Methods
Daily COVID-19 cases for each country were tracked between January 2020 and January 2023 to identify correlations between nations. Current case data were obtained from reliable sources, such as Johns Hopkins University and the World Health Organization. Data were analyzed in Microsoft Excel using Pearson’s correlation coefficient to assess the strength of connections.
Results
Strong correlations (r > 0.80) were revealed between the daily reported COVID-19 case counts of numerous countries across various continents. Specifically, 62 nations showed significant correlations with at least one correlated (connected) country per nation. These correlations indicate a similarity in COVID-19 trends over the past 3 or more years.
Conclusion
This study addresses the gap in country-specific correlations within COVID-19 forecasting methodologies. The proposed method offers essential real-time insights to aid effective government and organizational planning in response to the pandemic.
Introduction
Background
Coronavirus disease 2019 (COVID-19), caused by severe acute respiratory syndrome coronavirus 2 (SARS-CoV-2), first emerged in the Chinese city of Wuhan. 1 While the first reported COVID-19 cases were detected in December, several countries began identifying outbreaks towards the end of January 2020. Due to limited knowledge and available information when it first emerged, the virus spread rapidly, and within a short time, the World Health Organization (WHO) declared that it had reached the pandemic level. People worldwide quickly became infected, resulting in many deaths. COVID-19 has impacted people of all ages, although the effects are higher on the elderly with at least one underlying condition or history of a respiratory condition. 2 The number of people becoming infected by COVID-19 has risen exponentially, which has placed a strain on medical systems, leading to deficits in medical equipment and healthcare workers in multiple nations due to an incredible demand for intensive care beds, ventilators, medical equipment, doctors, and additional healthcare professionals. Many countries continue to experience challenges in sourcing an adequate supply of medical equipment, and as the rise in COVID-19 cases persists, it is becoming increasingly important to predict the virus’s spread in advance. Accurate predictions would help governments and local authorities plan necessary actions, such as allocating medical resources and personnel.
Previous studies on COVID-19 forecasting
The relentless COVID-19 pandemic has emerged as a pervasive global health challenge since 2020, with the virus manifesting as diverse variants, including, but not limited to, Alpha, Delta, and Omicron, each characterized by distinct levels of transmissibility and severity. The dynamic nature of these variants poses intricate challenges for public health management. Foreseeing epidemiological trends in the prevalence and mortality of COVID-19 is paramount in guiding informed public health decisions and judicious allocation of resources. 3 As the virus continually evolves, the ability to anticipate its trajectory becomes an indispensable tool for healthcare strategists, policymakers, and communities worldwide, facilitating proactive measures to mitigate the impact of the ongoing pandemic.
Various methods and models have been employed in COVID-19 forecasting studies. Notably, a study that delved into the realm of time series forecasting methods for COVID-19 revealed a heightened sensitivity to parameter selection and a degradation in performance as the forecasting horizon extends. 4 In spatiotemporal modeling, another investigation harnessed machine learning techniques to predict the movement of COVID-19 and anticipate future pandemics. Within this study, diverse machine learning models were scrutinized, with promising outcomes observed for support vector machine and polynomial regression models, particularly in the realms of long-term and short-term predictions. 5
In a large-scale evaluation focused on the USA, researchers identified substantial variation in forecasting skill among individual models, with ensemble-based forecasts demonstrating superior performance. Notwithstanding, even the most accurate case forecasts exhibited unreliability in critical phases, underscoring the imperative for enhanced leading indicator forecasts. 6 Classical epidemic models, such as ‘Susceptible, Infectious’ (SI), ‘Susceptible, Infectious, Susceptible’ (SIS), and ‘Susceptible, Infectious, Recovered’ (SIR) models, found application in simulating the spread of COVID-19 and prognosticating its dynamics. 7 Expanding the scope, another study applied traditional predictive models to forecast the total number of COVID-19 cases and risk factors associated with the virus, emphasizing a multifaceted approach encompassing epidemiological dynamics and contextual risk factors. 8 These diverse studies underscore the need for a comprehensive and adaptable approach, incorporating insights from both conventional epidemiological models and advanced machine learning techniques, to enhance the accuracy and reliability of COVID-19 forecasts.
Mathematical models are based on assumptions and equations that describe disease transmission and recovery dynamics, and can be classified as deterministic, assuming fixed parameters and outcomes, or stochastic, incorporating randomness and uncertainty. Mathematical models can be compartmental, such as the susceptible-exposed-infectious-recovered (SEIR) model, or network-based, such as the contact network model. Statistical models analyze historical data and identify patterns and trends, and can be classified as parametric, assuming a specific data distribution and structure, or nonparametric, making no data assumptions. Examples include the linear regression model, and time-series models, such as the autoregressive integrated moving average (ARIMA) model. 9
Machine learning models use algorithms and data to learn and improve their predictions. They can be supervised models that use labeled data and feedback to train and test their performance, or unsupervised models that use unlabeled data and self-organization to discover hidden structures and clusters. Examples include artificial neural networks, such as the deep neural network, and clustering algorithms, such as the k-means algorithm. Hybrid models combine different methods and data sources to enhance the accuracy and robustness of predictions, and can be classified as sequential, which use the output of one method as the input of another method, or parallel, using the output of multiple methods simultaneously. Hybrid models include ensemble models, such as the weighted average model, and Bayesian models, such as the Bayesian network model.10,11
As discussed above, different methods exist for forecasting COVID-19 cases and trends, utilizing different types of data, such as COVID-19 cases, deaths, tests, hospitalizations, vaccinations, mobility, symptoms, and behavior, to predict the future outcomes of the pandemic.9–11 Ensemble-based forecasts have shown higher skill than other methods, having been evaluated for different periods and geographical scales, with larger jurisdictions performing better. However, even the most accurate case forecasts are unreliable during periods of rapid changes in reported cases. Support vector machine and linear regression algorithms have been used to predict the number of confirmed cases, recovered cases, and deaths caused by COVID-19. Additionally, two new methods have been proposed for modeling the number of people infected with COVID-19 over time. First, a dictionary-based approach that determines sub-populations’ weight, and secondly, a mixture of M fittable curves. These methods have shown promising performance in modeling and forecasting COVID-19 cases.12–14
In other research, methods for forecasting COVID-19 cases and trends have included manual fitting, where initial model parameters are chosen based on historical data, and automated fitting, where parameters are chosen based on candidate case trajectory simulations. 15
Polynomial regression, ARIMA, deep learning techniques, such as recurrent neural network (RNN), and generalized space-time (GST) ARIMA models have been used for COVID-19 forecasting. Polynomial regression has shown good performance in predicting the behavior of cases in India, 16 while ARIMA and RNN models have shown fidelity with actual numbers in South Korea, Italy, and the USA. 15 GSTARIMA models have been used to estimate and forecast cases in Sulawesi Island, although accuracy is limited to the short term. 17 Incorporating COVID-19 case data in forecasting models has shown small and inconsistent improvements in accuracy, particularly at longer horizons and during key moments in the pandemic. 18 Combining probabilistic forecasts from multiple teams using weighted combined methods has effectively generated accurate interval forecasts and predictions of probability distributions for COVID-19 mortality. 19
Optimized dynamic machine learning models may also provide a proficient approach to forecast COVID-19 spread by considering the time dependency in the COVID-19 data series via incorporation of lagged measurements. 20 Through the introduction of dynamic information, significant improvement in COVID-19 prediction may be obtained. 21 The gaussian process regression model, tuned using Bayesian optimization, has shown superior performance to other models, achieving an average mean absolute percentage error of around 0.1%. 22 Additionally, the random forest algorithm has been used to assess the contribution of incorporated features to COVID-19 prediction, 23 providing a promising and simple method for predicting COVID-19 spread.
Study aim
The aim of the present study was to employ simple and real-time near-future prediction to forecast the spread of COVID-19 by ascertaining cross-nation correlations regarding the daily number of reported COVID-19 cases. By identifying correlations between daily COVID-19 case counts across various nations, this research may provide a practical tool for anticipating future incidences and trends of the disease at national and international levels. To the best of the authors’ knowledge, no prior study has attempted to anticipate the distribution and pattern of COVID-19 infections by analyzing correlations across nations. Governments may be able to strategically target and monitor specific correlated countries to forecast COVID-19 instances, enabling proactive measures to mitigate potential outbreaks.
Materials and methods
In this retrospective observational study, data regarding the number of daily verified COVID-19 cases between January 2020 and January 2023 were monitored for each nation, to discover relationships between various countries over approximately 3 years using a correlation approach. Based on the observation that two or more considerably related countries display striking parallels in COVID-19 patterns during the previous three years, it was hypothesized that this relationship would persist in the near future. In order to accurately estimate COVID-19 instances and trends in the near future, select countries may easily monitor changes in their connected nation or nations. All future considerations, including coronavirus variants, will be included in this forecast.
Daily official COVID-19 case data for each country
Current COVID-19 case statistics were necessary to establish linkages between the countries under investigation. The Johns Hopkins University Center for Systems Science and Engineering, the WHO, and the Novel Coronavirus (COVID-19) Cases Data website were consulted for information on daily COVID-19 cases in all nations between January 2020 and January 2023, representing more than 250 countries (277 countries reported on the WHO database).24–26
The figures in the present study were gathered from the WHO COVID-19 Explorer website (https://worldhealthorg.shinyapps.io/covid/), 26 following the WHO’s global layout specifications. The website enables users to examine up-to-date information regarding daily COVID-19 cases in countries worldwide, and the ‘Overlay’ option lets users compare up to nine countries. It should be emphasized that no authorization is necessary from the WHO to utilize or download data from this source.
Statistical analyses
Data were assessed for simple linear correlations between countries, using Pearson’s correlation coefficient to display the strength and direction of each correlation. The correlation coefficients between more than 250 nations indicated in the WHO database between 22 January 2020 and 1 July 2021 were calculated using the Analysis ToolPak add-in for Microsoft Excel-2010. 27 A correlation coefficient (r) > 0.80 between two or more nations indicated a strong correlation and a significant association between the countries for the daily number of COVID-19 cases.
Current case data were sourced from the reputable institutions stated above, and all patient details, including names, addresses, and other identifying information, were systematically de-identified prior to analysis to ensure confidentiality and compliance with ethical standards regarding patient privacy.
New weekly confirmed COVID-19 cases per million persons over the research period were depicted for each country with smoothed curves. Case data were smoothed by applying a 7-day rolling average technique to daily reported cases to create weekly smoothed curves, which helped to reduce noise and highlight underlying data trends. For correlation analyses, smoothing helped mitigate the impact of daily fluctuations and irregularities in reporting, ensuring a more stable and accurate assessment of trends and relationships over time. Smoothing also provided a clearer and more comprehensible visual representation of the data for figures, making it easier to observe and compare trends between countries.
The present study was conducted and reported in alignment with the Strengthening the Reporting of Observational Studies in Epidemiology (STROBE) guidelines, 28 to ensure the clarity, transparency, and reproducibility of the present research. Key aspects of the STROBE checklist, including the study design, data collection, statistical analysis, and reporting of results, were applied.
Results
A total of 277 countries were analyzed in the study. As shown in Figure 1, coefficients for each country under consideration were generated using Excel. Out of 277 included countries, a total of 62 countries on different continents were identified that shared the same trends for daily COVID-19 official recorded cases (with high correlation, r > 0.8) for at least one correlated country (Table 1). It should be noted that the table only shows a correlation between Group A countries and associated countries shown in Group B, not correlations among Group B countries. In addition, it should be noted that these data were last updated in January 2023.

A screenshot showing a representative sample of the Pearson’s correlation coefficient results regarding the relationship of coronavirus disease 2019 case numbers between nations, calculated within Microsoft Excel.
List of linked (correlated) countries for each country in Group A.

The correlation coefficient between Italy and Austria was 0.90, indicating a high link between the COVID-19 case counts of the two countries. However, the correlation coefficient between Italy and India was 0.07, showing no association between the two countries’ COVID-19 case numbers. Figure 2 depicts the new weekly confirmed COVID-19 cases per million persons for both countries over the research period, with smoothed curves.

Figures showing smoothed data for new weekly coronavirus disease 2019 cases per 1 million of the population between: (a) Austria and Italy; and (b) Italy and India.
Analysis of the correlation between all countries with available daily data for COVID-19 cases from the end of January 2020 to the beginning of July 2021 revealed strong correlations (r > 0.8) for the following countries:
Europe: Albania, Austria, Azerbaijan, Belarus, Bosnia and Herzegovina, Bulgaria, Croatia, Czechia, Slovakia, Switzerland, Ukraine, Denmark, Latvia, Lithuania, Luxembourg, Malta, Moldova, Montenegro, Estonia, Finland, Georgia, Greece, Hungary, Italy Netherlands, North Macedonia, Poland, Romania, Serbia, and the United Kingdom. Asia and Oceania: Bahrain, Burma, Cambodia, Fiji, Indonesia, Iran, Iraq, Jordan, Kuwait, Lebanon, Malaysia, Maldives, Nepal, Occupied Palestinian Territory, Philippines, Sri Lanka, Thailand, and Timor-Leste. Africa: Morocco, Rwanda, and Zambia. America (North and South): Argentina, Colombia, Jamaica, US, Venezuela, Panama, Paraguay, Trinidad and Tobago, Suriname, and Uruguay.
A closer investigation of the relationship between each country and its correlated country/countries (r > 0.8 between two countries) revealed that, for instance, North Macedonia is correlated with the following countries: Ukraine, Romania, and Poland. It should be noted that the correlations are between North Macedonia and each of these countries and not between these countries themselves. Figure 3 illustrates the new weekly COVID-19 cases per one million population for the studied period. All these countries followed each other in COVID-19 cases over a period of 36 months, with a variation in peak cases within around 2 weeks, which would give the Austrians time to predict near future COVID-19 cases and trends, and prepare for any sudden spikes in cases, by closely monitoring its correlated countries (including North Macedonia, Ukraine, Romania, and Poland; Table 1).

Figure showing smoothed data for new weekly coronavirus disease 2019 cases per 1 million of the population between Ukraine, Romania, North Macedonia, and Poland.
Rwanda and Zambia, being neighboring countries in Africa, were shown to have a strong correlation in weekly case numbers (r = 0.88; Figure 4), and the neighboring countries of Russia and Belarus in Europe were observed to have a strong correlation in COVID-19 case numbers (r = 0.91; Figure 5).

Figure showing smoothed data for new weekly coronavirus disease 2019 cases per 1 million of the population between Rwanda and Zambia.
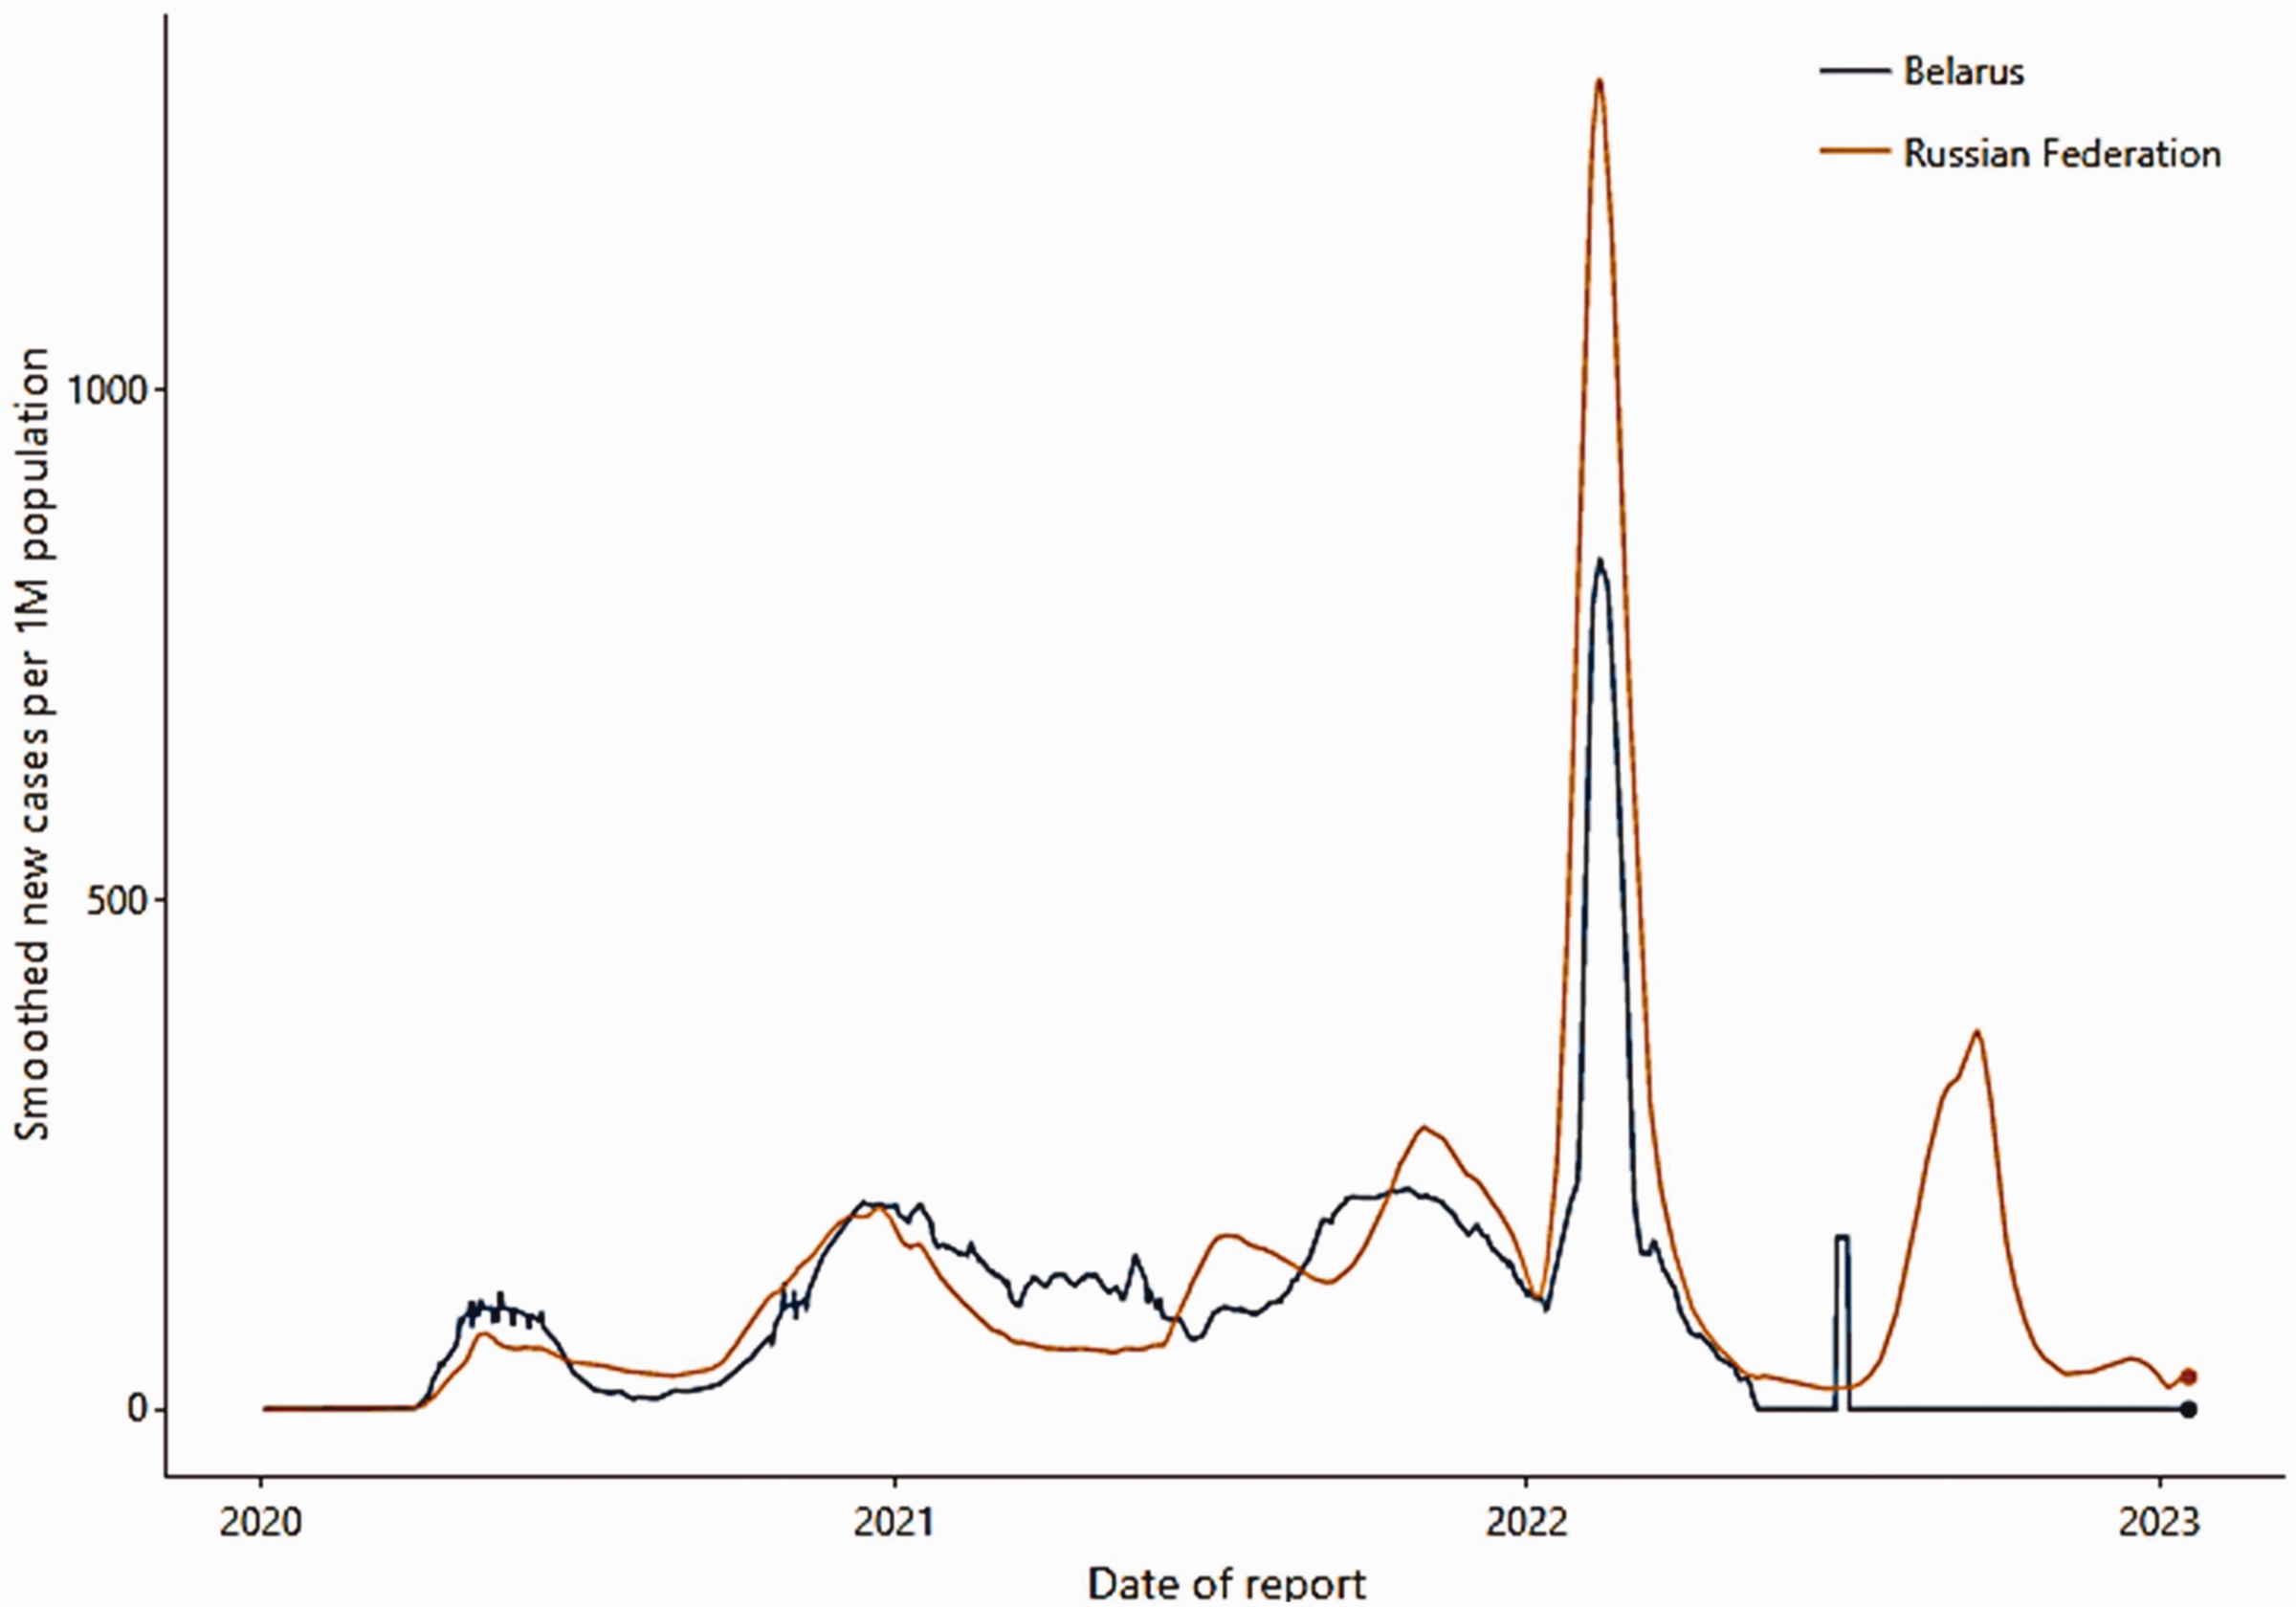
Figure showing smoothed data for new weekly coronavirus disease 2019 cases per 1 million of the population between Russia and Belarus.
Strong correlations were not only found between neighboring countries, but also between countries located far apart or even on different continents. For example, Jordan in West Asia was found to be correlated with various European countries, such as Hungary, Bulgaria, and Poland. There were also correlations between Indonesia in East Asia and Rwanda in Africa, Bahrain, and the Maldives in the Indian Ocean (r = 0.83; Figure 6).

Figure showing smoothed data for new weekly coronavirus disease 2019 cases per 1 million of the population between different non-neighboring countries: (a) Jordan, Hungary, Bulgaria, and Poland; (b) Indonesia and Rwanda; and (c) Bahrain and the Maldives.
In other cases, a strong correlation was found to exist between Serbia, the Occupied Palestinian Territory, and Hungary for almost 18 months of the pandemic period analyzed in the present study, with these countries situated on different continents (r = 0.89; Figure 7).
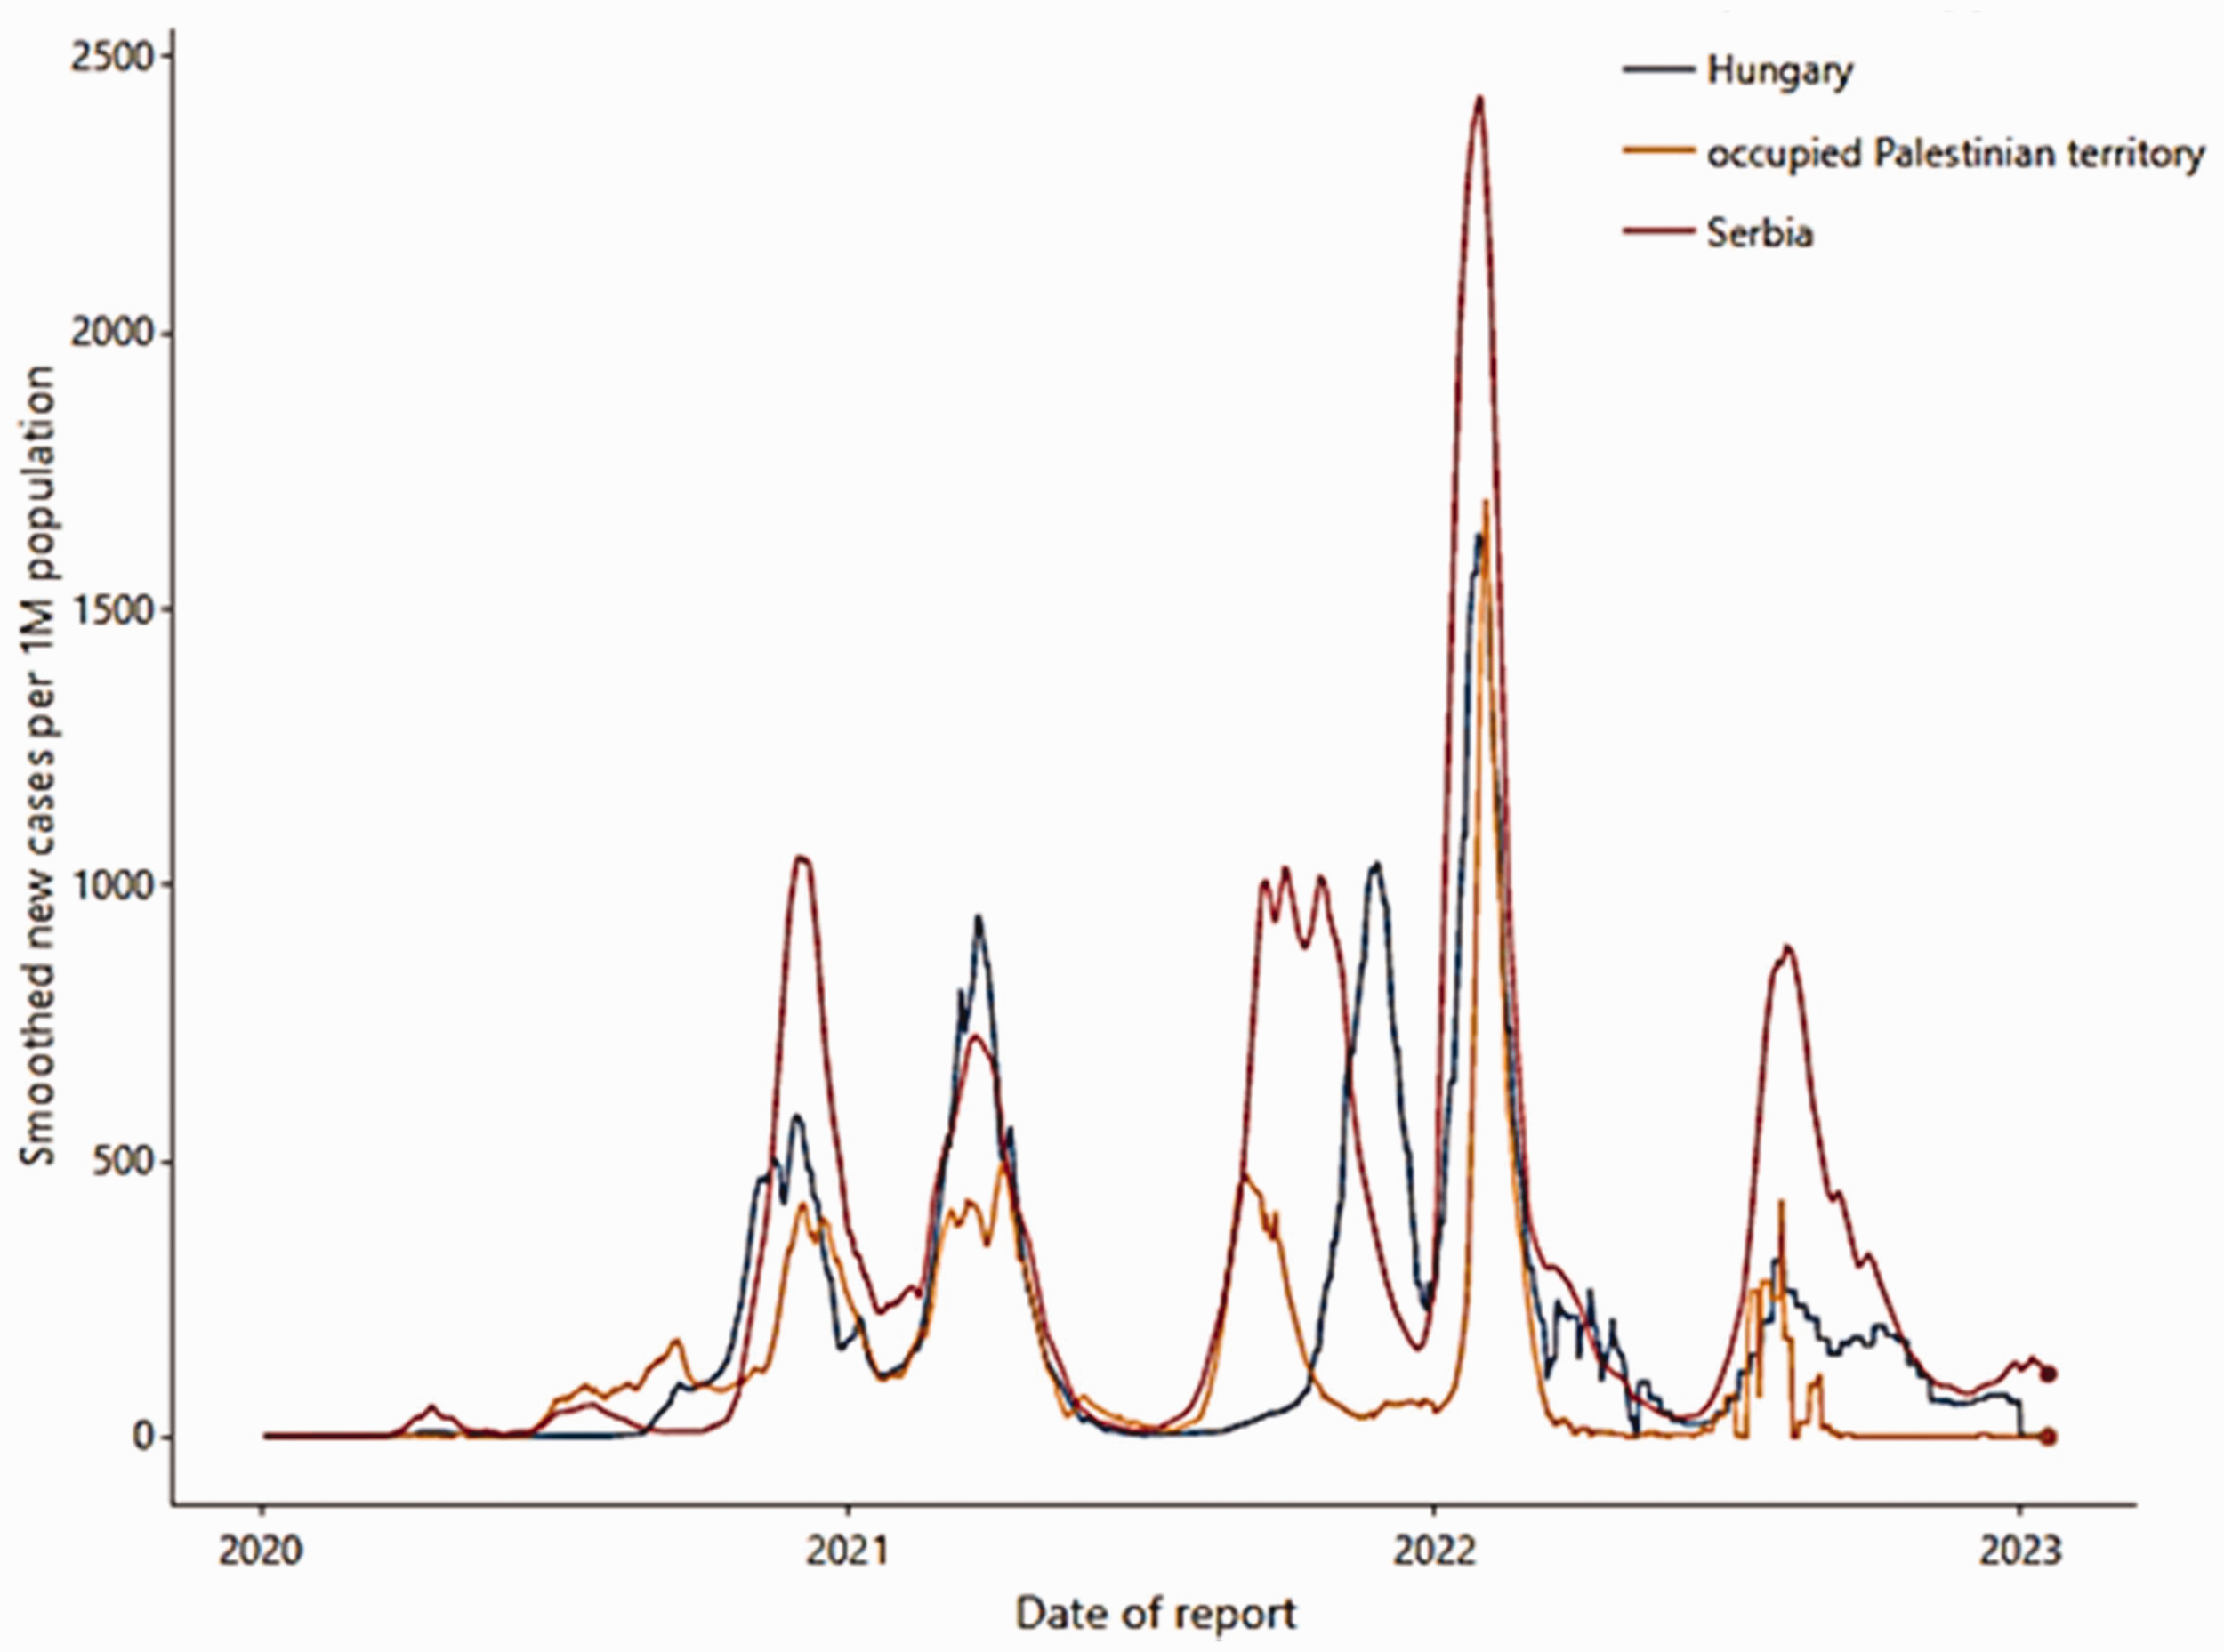
Figure showing smoothed data for new weekly coronavirus disease 2019 cases per 1 million of the population between three non-neighboring countries: Serbia with Occupied Palestinian Territory and Hungary.
Bulgaria was found to be correlated with Bosnia and Herzegovina, Jordan, North Macedonia, Poland, and Romania (r = 0.86; Figure 8). The peak COVID-19 cases in Bulgaria and the rest of these countries occurred within 2 weeks, and these 2 weeks would give a correlated country time to prepare for any case surge.

Figure showing smoothed data for new weekly coronavirus disease 2019 cases per 1 million of the population between Bulgaria, Bosnia and Herzegovina, Jordan, North Macedonia, Poland, and Romania.
The weekly COVID-19 cases in Colombia initially peaked in mid-August 2020, whereas in Argentina, the peak occurred in mid-October of the same year. There was an almost 10-day difference between the second peaks in both countries (10th of January 2021 in Argentina and 20th of January 2021 in Colombia). Furthermore, Argentina’s second peak occurred at the end of May 2021, one month behind Colombia (by the end of June 2021; Figure 9). The trend indicates that Colombia has lagged behind Argentina for some time, which would provide the Colombians time to prepare before any surge in COVID-19 cases by monitoring cases in Argentina.

Figure showing smoothed data for new weekly coronavirus disease 2019 case peaks per 1 million of the population in Argentina and Colombia.
When two countries are trending up or down together despite having different weekly COVID-19 cases numbers, correlation analysis will still show this as a significant relationship. For example, Albania and Montenegro (r = 0.82), Morocco and Myanmar (r = 0.81), and Czechia and Lebanon (r = 0.82) all displayed differences in terms of the total number of weekly COVID-19 cases, however, their trends still correlated (Figure 10).

Figure showing differences in smoothed data for new weekly coronavirus disease 2019 cases per 1 million of the population between different correlated countries: (a) Albania and Montenegro; (b) Morocco and Myanmar; and (c) Czechia and Lebanon.
Two countries that were found to correlate with another country did not necessarily correlate with each other. For instance, Azerbaijan displayed weak correlations in COVID-19 cases with Serbia, Croatia, and Georgia, but Serbia was not found to correlate with either Croatia or Georgia (Figure 11).

Figure showing smoothed data for new weekly coronavirus disease 2019 cases per 1 million of the population between Azerbaijan and Serbia, Croatia and Georgia.
The UK and USA were found to be correlated in terms of COVID-19 cases (r = 0.82; Figure 12), and the USA was also strongly correlated with Lithuania in terms of COVID-19 cases (Figure 13).

Figure showing smoothed data for surge in new weekly coronavirus disease 2019 cases per 1 million of the population in the UK that were not reflected in the USA.
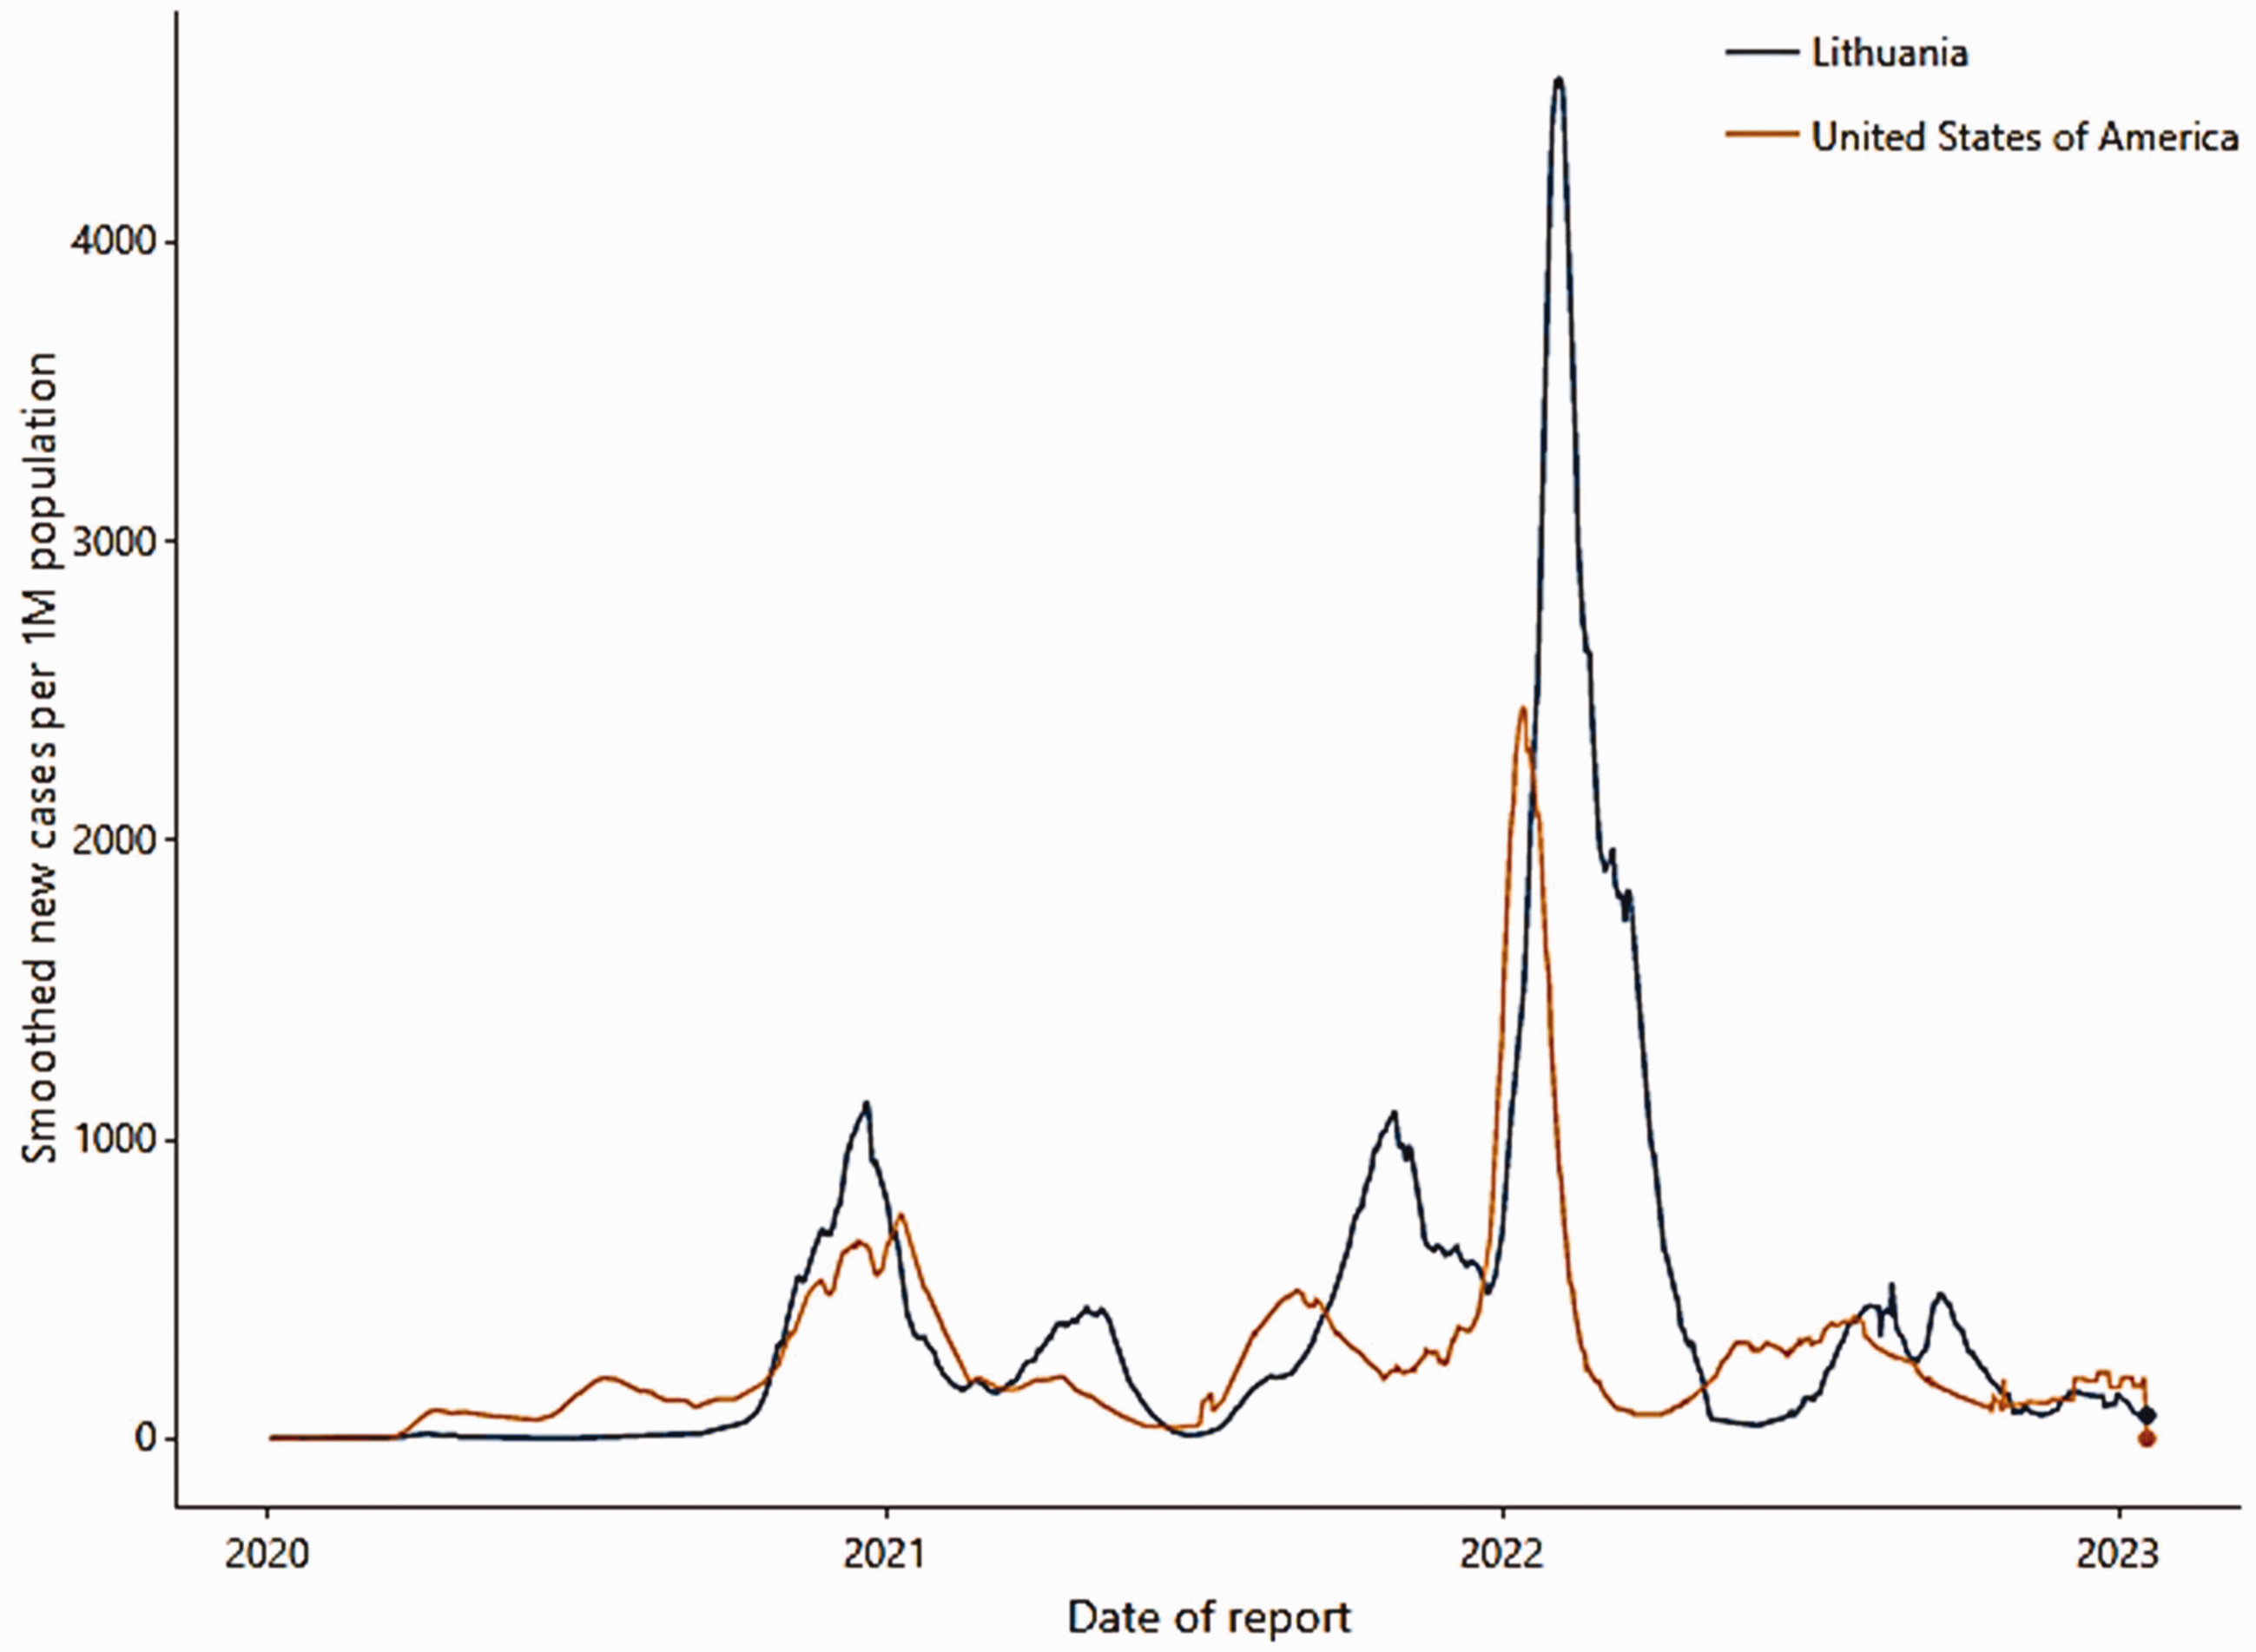
Figure showing smoothed data for new weekly coronavirus disease 2019 cases per 1 million of the population between the USA and Lithuania.
Discussion
In the present study, correlations were found between various countries regarding trends in COVID-19 case numbers, with few countries from Africa showing correlations. At the same time, the majority of the correlated countries were from Europe, possibly because the measurement and recording of daily COVID-19 cases in many African nations are not in line with the rest of the world. Thus, it may be assumed that data for daily COVID-19 cases should be treated with caution, given the wide variations in how countries record them, particularly as it is clear that most cases are not recorded.29,30 A recent study covers COVID-19 correlations for European countries only, and going back to this study shows the accuracy of this correlation approach. 31
Since the start of the COVID-19 outbreak, global efforts have focused on data collection to understand and control the epidemic. Using an ‘Open Innovation in Science’ approach, researchers aimed to provide policymakers with tools for optimal containment. The relationship between COVID-19 spread during its first wave and economic and socio-political factors across various countries has been studied previously. 32 Correlations were found using MATLAB and statistical software, particularly with economic growth forecasts and health spending. The findings suggest that understanding these links may improve pandemic forecasting and highlight societal vulnerabilities to enhance sustainability. 32 Data from Johns Hopkins University and the European Social Survey were used to analyze the relationship between reported COVID-19 case numbers and nine variables, which were reduced to three key factors for multiple regression analysis. 33 Social and economic factors were found to be strongly linked to the spread of COVID-19, while population density and cultural factors became more significant by April 2020. For future pandemics, it is suggested that early implementation of movement restrictions will be essential in densely populated and vibrant countries. 33
The correlation in weekly COVID-19 cases between neighboring countries may be influenced by various geographical, environmental, socio-cultural, and political factors. Understanding and identifying these correlations are crucial for effective planning and resource allocation of pandemic response. These factors contribute to a strong correlation in weekly COVID-19 cases among neighboring countries, as observed in the present study for Rwanda and Zambia in Africa and Russia and Belarus in Europe.
Geography: Neighboring countries often share similar geographical features, such as proximity to each other and similar topography, which may influence the movement of people and potentially contribute to the spread of the virus across borders.
Weather: Similar climate conditions, including temperature and humidity, may impact the transmission and survival of the virus. Countries with comparable weather patterns may experience similar trends in COVID-19 cases.
Population attitudes and behavior: Similar cultural practices and social behaviors among neighboring populations may influence the transmission dynamics. For instance, if neighboring countries share common cultural practices that involve close social interactions, it may contribute to the parallel spread of the virus.
Resources: Neighboring countries may have comparable healthcare infrastructure and resources, affecting their ability to detect, test, and respond to COVID-19 cases. Shared limitations or strengths in healthcare systems may lead to similar trends in case numbers.
Governmental measures - public health policies: Implementing governmental measures, such as lockdowns, travel restrictions, and vaccination campaigns, can impact the trajectory of COVID-19 cases. Neighboring countries may adopt similar policies due to shared challenges or coordinated responses.
Rwanda and Zambia, being neighboring countries in Africa, share geographical proximity and, to some extent, similar climate conditions. Additionally, cultural practices and social behaviors in these nations may contribute to analogous patterns in COVID-19 transmission. The effectiveness of both countries’ public health policies and healthcare infrastructure may further contribute to a strong correlation in weekly case numbers. The neighboring European countries of Russia and Belarus might experience similar weather patterns, especially in the northern regions. Commonalities in population attitudes, resource allocation, and governmental measures may lead to comparable trends in COVID-19 cases. The interdependence of these nations, both geographically and historically, may have further contributed to the observed correlation in the present study.
In general, neighboring countries with strong correlations in weekly COVID-19 cases are likely influenced by a combination of geographical, environmental, cultural, and political factors. Recognizing and analyzing these correlations can provide valuable insights for public health officials and policymakers to enhance regional collaboration and optimize strategies for pandemic management. However, there is not always a strong correlation between neighboring countries, and correlations may exist between countries located far apart or even on different continents. For example, in the present study, Jordan in West Asia was found to be correlated with various European countries, such as Hungary, Bulgaria, and Poland, and correlations were found between Indonesia in East Asia and Rwanda in Africa, Bahrain, and the Maldives in the Indian Ocean. In other cases, countries on two continents displayed correlations in COVID-19 cases for almost 18 months of the pandemic period, with strong correlations shown between Serbia, the Occupied Palestinian Territory, and Hungary.
A strong correlation between two or more countries is indicative of a very similar COVID-19 trend over the 3 years of the study period, and this correlation may be expected to continue for some time. This may provide some countries with an easy way of closely monitoring their interrelated countries to predict their own near future COVID-19 cases and trends. For instance, Bulgaria was found to be correlated with Bosnia and Herzegovina, Jordan, North Macedonia, Poland, and Romania, with the peak COVID-19 cases occurring within 2 weeks among these countries. By monitoring cases in correlated countries, these 2 weeks potentially provide a country with time to prepare for any case surge. A similar example was provided by the correlation between Columbia and Argentina, whereby COVID-19 cases in Columbia lagged behind Argentina’s cases for some time, potentially providing Columbia with time to prepare by monitoring cases in Argentina.
Even when countries have different numbers of weekly COVID-19 cases, trends in peaks and troughs may still reveal correlations, as shown in the present study regarding Albania and Montenegro, Morocco and Myanmar, and Czechia and Lebanon.
Many factors may affect the number of COVID-19 cases, such as the number of weekly tests, governmental measures, people’s behavior, and vaccine rate and type. For instance, the correlation observed between the UK and USA in the present study may be affected by different vaccines used in the two countries, and also by other factors. COVID-19 vaccines are not 100% effective or protective, and they need to be combined with other public health measures, such as social distancing, mask-wearing, testing, tracing, and isolating, to prevent and control the spread of the virus. The vaccines are also not equally available or accessible to everyone, and there may be disparities or barriers in vaccine uptake and coverage among different groups or regions. Vaccines are a powerful tool for fighting the pandemic but are not a silver bullet.
Many potential factors may contribute to the high correlations observed in the present study, and it is important to consider these factors to distinguish genuine interconnections from spurious correlations driven by chance. Several potential factors that may have influenced the present correlations are highlighted below:
Geographical proximity: Proximity between countries may play a significant role in the similarity of COVID-19 trends. Neighboring nations may share common borders, transportation networks, and cultural ties, all of which may facilitate cross-border spread of the virus. The spatial distribution of cases may lead to correlated patterns, especially in regions with open borders. Similar healthcare systems: Countries with similar healthcare systems may respond to the pandemic similarly. Shared healthcare infrastructure, policies, and practices can lead to similar testing rates, treatment protocols, and public health measures. This alignment in healthcare systems may contribute to correlated COVID-19 trends. Shared epidemiological characteristics: Countries with similar demographic profiles, population density, age distributions, and other epidemiological characteristics may experience similar COVID-19 dynamics. These shared attributes may affect the virus’s transmission dynamics and the severity of outbreaks, leading to correlated trends. International travel and trade: Countries with strong international travel and trade connections may experience synchronized COVID-19 patterns due to the movement of people and goods. High levels of international interactions may facilitate cross-border spread of the virus, resulting in correlated cases. Climate and seasonality: Climate and seasonal factors may influence the transmission of respiratory viruses, including COVID-19. Countries with similar climate patterns may experience seasonal variations in cases, leading to correlations in the timing of outbreaks. Policy responses: The effectiveness and timing of public health interventions, such as lockdowns, mask mandates, and vaccination campaigns, may impact the trajectory of COVID-19 cases. Countries implementing similar policies may exhibit correlated trends in response to these measures. Data reporting practices: Variations in data reporting practices, including testing frequency, accuracy, and transparency, may influence the observed correlations. Differences in data quality and reporting standards should be considered when interpreting the results.
In addition, the ongoing evolution of SARS-CoV-2 has characterized the COVID-19 pandemic, highlighting the importance of understanding mutations and their potential impact on various aspects of the pandemic. Different mutations have been observed in SARS-CoV-2, including point mutations, such as deletions and insertions, giving rise to well-known variants, for example, Alpha, Beta, Gamma, and Delta. Mutations may influence the transmission dynamics of the virus and may increase transmissibility, disease severity, and may impact the immune response to the virus. Vaccine effectiveness, potential immune evasion by variants, and the risk of reinfections have been discussed elsewhere. Coronavirus mutations may affect the accuracy and reliability of COVID-19 predictive models, underscoring the importance of ongoing research and surveillance to adapt predictive models and public health strategies.
Identifying correlated countries with a time lag of 2 or more weeks between COVID-19 case spikes may hold immense value in predicting near-future case spikes and providing authorities with crucial time to prepare for any impending waves. This lag allows for observing patterns in one country that may be mirrored in correlated nations after a delay. By leveraging this insight, authorities may proactively implement measures to mitigate the impact of potential waves, such as reinforcing healthcare systems, implementing public health interventions, and mobilizing resources effectively. This approach may enhance preparedness and response capabilities, ultimately contributing to better pandemic management.
Conclusion
Rapidly increasing infection rates necessitate precise projections of the spread of COVID-19 to aid governments and local authorities in preparing vital steps, such as allocating medical and human resources. The spread of COVID-19 is affected by vaccination rates and types, age, sex, treatment for malaria, transmission and death rates, public behavior, and government initiatives. Challenges and limitations associated with predicting future COVID-19 cases, such as virus mutations, human behavior, vaccine efficacy, public health measures, global connectivity, data quality, herd immunity, and asymptomatic cases, contribute to the complexity of making accurate predictions. While epidemiological models and statistical analyses offer valuable insights, they cannot provide absolute certainty due to the dynamic nature of the pandemic. Predicting COVID-19’s future course remains complex and evolving, influenced by numerous variables and uncertainties.
The present work used related nations to anticipate future COVID-19 incidences and trends. By discovering connections in daily COVID-19 case counts between nations, precise and real-time estimates of future COVID-19 spread may be constructed. Using Pearson’s correlation coefficient, each country’s daily numbers of officially reported COVID-19 cases from January 2020 to January 2023 were assessed to detect links between nations. Strong correlations between two or more nations imply that their COVID-19 patterns during the previous 3 years were reasonably comparable, and if they persist, the correlations may continue for a considerable time.
More than 60 nations on various continents were observed to display correlated trends in daily COVID-19 official recorded cases with at least one other country, with a high degree of correlation (r > 0.80). This will allow each nation to target and monitor a particular connected country with the aim of forecasting COVID-19 cases.
To the best of our knowledge, this is the first study to apply a correlated country technique to estimate the future distribution and trend of COVID-19 cases. In the future, the proposed approach may be readily implemented, and may offer governments an efficient method of monitoring their interconnected countries to forecast the number of COVID-19 cases and future trends, allowing them to better prepare for the evolving dynamics of the COVID-19 pandemic.
Footnotes
Acknowledgments
We are very grateful to Johns Hopkins University and the WHO for making the COVID-19 data public and free of charge.
Author contributions
Both authors contributed equally to all aspects of this research.
Data availability statement
The data underlying the findings of this study are publicly available from the following sources: Johns Hopkins University Coronavirus Resource Center and World Health Organization (WHO) Coronavirus Disease (COVID-19) Dashboard. The data used or analyzed during the study are available from the corresponding author upon request.
Declaration of conflicting interest
The Authors declare that there is no conflict of interest.
Funding
This research received no specific grant from any funding agency in the public, commercial, or not-for-profit sectors.