
Abstract
Objective
To assess the association between pancreatic enzyme replacement therapy (PERT) and resource utilization among patients with chronic pancreatitis (CP) in a large Midwestern US healthcare system.
Methods
This retrospective cohort study used electronic medical record data. Eligible patients (N = 2445) were aged ≥18 years and diagnosed with non-cystic fibrosis CP between January 2005 and December 2018, with ≥6 months’ follow-up; study initiation was first encounter with the healthcare system. Patients in the PERT group were prescribed PERT at ≥1 encounter; patients in the non-PERT group were not prescribed PERT at any encounter.
Results
In total, 62,899 encounters were reviewed (PERT, n = 22,935; non-PERT, n = 39,964). More patients in the PERT group were younger, male, White, married/partnered and with private insurance than those in the non-PERT group. They also received longer care and had more overall encounters, fewer outpatient and day surgery/24-hour observation encounters, and more inpatient encounters. Emergency room encounters were similar between groups. Average cost by encounter was similar between groups ($225 and $213, respectively).
Conclusions
Despite similar average costs per encounter, the groups had very different encounter types. More inferential research on PERT use among patients with CP is needed, particularly regarding resource utilization and long-term outcomes.
Keywords
Introduction
Whitcomb et al. define chronic pancreatitis (CP) as a pancreatic pathologic and fibro-inflammatory syndrome in individuals with genetic, environmental or other risk factors. 1 Prevalence of CP is estimated at 35 to 50 per 100,000 adults, with an incidence rate of 5 per 100,000 patient years. 2 CP progression levels range from “at-risk CP” to “early CP,” “established CP,” and finally “end-stage CP.” 1 Substantial heterogeneity exists among patients with CP, as different risk factors may be linked with abnormal responses in different relevant cell types at different times and under diverse conditions. 1
Clinical dysfunctions in end-stage CP may include complications such as malnutrition, including exocrine pancreatic insufficiency (EPI) with resultant vitamin and micronutrient deficiencies.1,3–6 Malnutrition in CP is more challenging than in other chronic illnesses because the pathology occurs within the structures involved in nutrient digestion, absorption and assimilation. 7 EPI occurs if there is a reduction in pancreatic enzyme quantity or activity to a level below the threshold required to maintain normal digestion. 8 EPI causes maldigestion and malabsorption, leading to poor nutritional status and overall negative clinical outcomes.2,9
The probability of developing EPI increases with time after diagnosis of CP; there is a 28%, 50% and 70% chance of developing EPI at 5, 12 and 20 years, respectively, after CP onset.10,11 The most effective treatment for EPI in CP consists of oral administration of a combination of pancreatic enzymes during meals to reduce symptoms and optimize nutrient absorption.12,13 This pancreatic enzyme replacement therapy (PERT) comprises a combination of porcine-derived lipases, proteases and amylases and is indicated for the treatment of EPI due to conditions such as CP, cystic fibrosis (CF) and pancreatic surgery (dependent on individual PERT label).
The overall medical management of CP requires tight surveillance and a multidisciplinary approach to provide high-quality care for patients. It involves a team consisting of specialists in anesthesia (pain control), gastroenterology and nutrition, surgery, endocrinology and psychiatry. Centers of Excellence for pancreatic diseases are located throughout the USA to treat the whole patient, with a focus on the best possible outcomes and improved quality of life. 14
Given the resources and monitoring required for optimal care of patients with CP, a closer examination of clinical and economic (resource) utilization of services, indications and outcomes is essential, particularly among patients prescribed PERT. The objective of this cross-sectional study, which assessed data across 14 years of patient care, was to describe patient demographics, complexity of this patient population and overall resource utilization in a sample of patients with CP treated with or without PERT in a large Midwestern US healthcare system. These findings will provide insights into the treatment of patients with CP in clinical practice.
Methods
This retrospective, descriptive cohort study used data abstracted from electronic medical records in a large Midwestern US healthcare system, including 10 acute care hospitals, two children’s hospitals, a specialty hospital for extended care needs, three large medical groups, and comprehensive home health and hospice services that serve the greater metropolitan area of a populous Midwestern US city. Prior to study initiation, the study was approved by the Advocate Health Care Institutional Review Board (IRB #22.615E), Downers Grove, IL, USA, on 6 June 2019. The IRB granted a waiver of the requirement to obtain informed consent for this retrospective study. The reporting of this study conforms to STROBE guidelines. 15
Participants
Electronic medical record data were obtained from a total sample of 2445 adult patients who were at least 18 years old; had at least one healthcare system encounter with an International Classification of Diseases (ICD) diagnosis code of non-CF CP between 1 January 2005 and 31 December 2018 and had at least one additional follow-up encounter at least 6 months later within the healthcare system. The ICD 9th revision (ICD-9) 16 diagnosis codes 577.1, 577.2, and 577.8 or the equivalent 10th revision (ICD-10) 17 codes K86.0-K86.3, K86.8, K86.81, K86.89, and K87 were used to define non-CF CP.
All eligible patients were placed into one of two groups, the PERT group or the non-PERT group. Each patient’s initial encounter with the healthcare system between 1 January 2005 and 31 December 2018 was defined as his or her index date. The PERT group included patients who also had at least one prescription of PERT documented on or after their index date. The non-PERT group included patients who did not have a prescription of PERT documented on or after their index date. Patient encounters occurring on or after patient index dates were reviewed for this study. All patient details were de-identified.
Procedures
To describe resource utilization, demographic factors, clinical diagnoses, encounter presentation and admission type, length of stay (LOS), revisits, and clinical care costs based on procedure codes among patients who were/were not prescribed PERT were examined. PERT prescription dosages among patients in the PERT group were also assessed. Resource utilization was explored for all encounters occurring between the patients’ index date and their last encounter in the healthcare system or the study end date (31 December 2018), whichever came first.
Variables
Baseline demographic factors included age, sex, race, ethnicity, marital status and insurance type at index date; prescription dosages among the PERT group represented prescriptions throughout all encounters. Numbers of clinical diagnoses are described as mean and median by patient and unique encounter. Encounter presentation types included day surgery/24-hour observation, emergency room, inpatient and outpatient. Encounter admission types included elective, emergency room, trauma center, urgent and outpatient. LOS is described as mean and median time (in hours) across encounter presentation and admission types. Revisits describe the number of inpatient and emergency room encounters within 72 hours and within 30 days of patients’ index date. Finally, cost data used current procedure terminology (CPT) codes, which were created by the American Medical Association to standardize reporting of medical, surgical and diagnostic services and procedures performed in inpatient and outpatient settings for reimbursement of rendered healthcare. 18 CPT codes were used to describe aggregated clinical care costs and were organized according to the main sections of the CPT Category I codes: evaluation and management, pathology and laboratory, surgery, medicine and radiology. 18
Statistical methods
Data management and descriptive analysis of the sample were conducted using SAS statistical software, version 9.4 (SAS Institute Inc., Cary, NC, USA).
Univariate analyses are reported as counts (%) or mean (standard deviation) and median (interquartile range [IQR]), as appropriate. Because this study explored resource utilization among individuals prescribed versus not prescribed PERT, column counts (%) are used to describe variable levels within each group. Bivariate analyses were conducted to compare variables between PERT groups (exposure). Corresponding p values were generated from Wilcoxon signed-rank tests for continuous variables and Pearson chi-square tests (or Fisher exact tests when any cell size was <5) to represent statistically significant differences between groups at p < 0.05. For variables with corresponding measures of association, the odds ratio (OR) represents the ratio of the odds of being in the PERT group relative to being in the non-PERT group at each variable level relative to the reference level of the same variable. These were calculated using logistic regression, with Wald chi-square values interpreted to indicate statistically significant differences at p < 0.05. In this study, any differences between groups represent factors associated with prescription of PERT and not necessarily factors causing or resulting from prescription of PERT.
Results
Demographics
Patient demographics at index date, overall and by group.
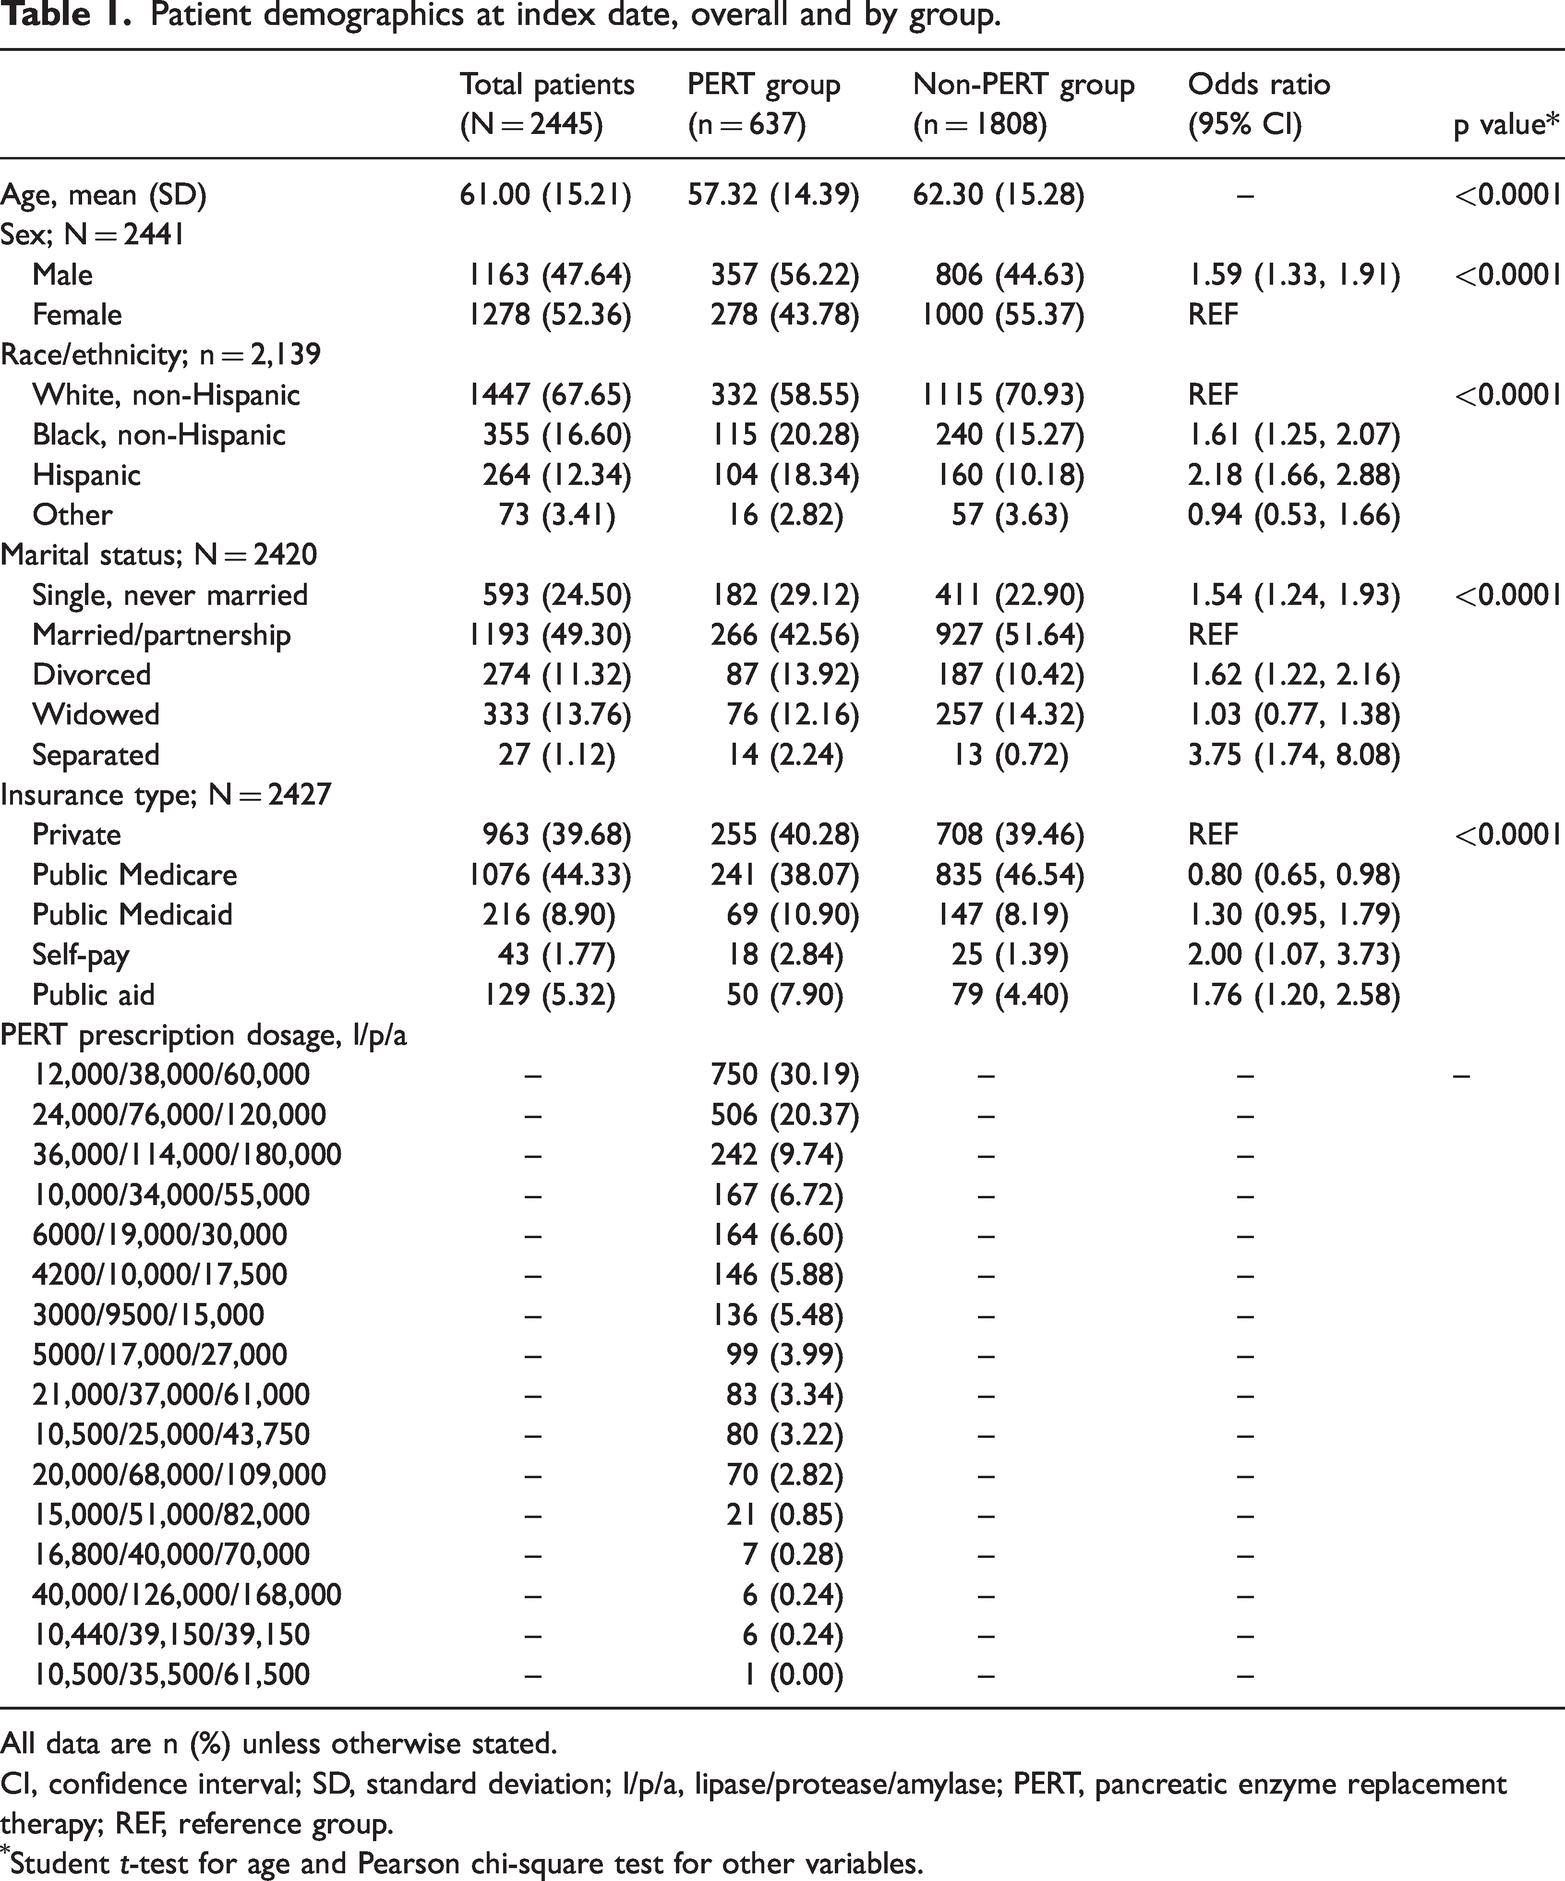
All data are n (%) unless otherwise stated.
CI, confidence interval; SD, standard deviation; l/p/a, lipase/protease/amylase; PERT, pancreatic enzyme replacement therapy; REF, reference group.
Student t-test for age and Pearson chi-square test for other variables.
Patients in the PERT group had a median of 21 total encounters (i.e., clinical visits in the health system) and those in the non-PERT group had a median of 13 total encounters (Table 2). Finally, although the medication pancrelipase is available in many doses, most of the pancrelipase dosages (N = 750; 30.19%) prescribed to the 637 patients in the PERT group were 12,000 United States Pharmacopeia (USP) units of lipase/38,000 USP units of protease/60,000 USP units of amylase. Table 1 shows patient demographics of the total sample and by group.
Patient clinical diagnoses, overall and by group.

IQR, interquartile range; PERT, pancreatic enzyme replacement therapy; SD, standard deviation.
Wilcoxon signed-rank tests.
Clinical diagnoses
Across all 62,899 encounters, patients had a median of 3 (IQR, 1–8) diagnoses per encounter. Patients in both the PERT and non-PERT groups had similar median diagnoses per encounter (3 [0–8] and 3 [1–7], respectively). To contextualize the diagnoses per encounter, an assessment of diagnoses and encounters showed that for the total sample of 2445 patients, there was a median of 84 (39–175) total diagnoses and 15 (7–31) encounters (Table 2).
There were statistically significant differences between the PERT and non-PERT groups. Specifically, compiling all diagnoses (including repeats) documented across all patient encounters, the PERT group had a median of 145 (IQR, 72–260) diagnoses per patient whereas the non-PERT group had 68 (31–142; p < 0.0001). Furthermore, the PERT group had a median of 21 (10–46) encounters per patient versus 13 (6–26) in the non-PERT group (p < 0.0001). Although both groups had similar numbers of diagnoses per encounter, patients in the PERT group had significantly more diagnoses and encounters throughout their overall care. Table 2 shows the number of clinical diagnoses across patients and encounters, overall and by group.
Encounter presentation and admission type
Analysis of patient encounter presentation types identified significant and non-significant proportion differences between the PERT and non-PERT groups in terms of day surgeries and/or 24-hour observation encounters (2.30% vs. 3.60%, respectively), emergency room encounters (14.23% vs. 13.81%, respectively), inpatient encounters (15.38% vs. 11.27%, respectively) and outpatient encounters (68.10% vs. 71.32%, respectively). Relative to patients in the non-PERT group, patients in the PERT group had 0.37 times lower odds of presenting for day surgeries and/or 24-hour observation visits (OR, 0.63 [95% CI: 0.57, 0.70]; p < 0.0001) and 0.14 times lower odds of presenting for outpatient visits (OR, 0.86 [0.83, 0.89]; p < 0.0001) but 1.43 times greater odds of presenting for inpatient visits (OR 1.43 [1.36, 1.50]; p < 0.0001). There were no significant differences in emergency room encounters between the PERT and non-PERT groups (OR, 1.03 [0.99, 1.08]). Table 3 shows all encounter data by presentation types between groups.
Patient encounter types by group.
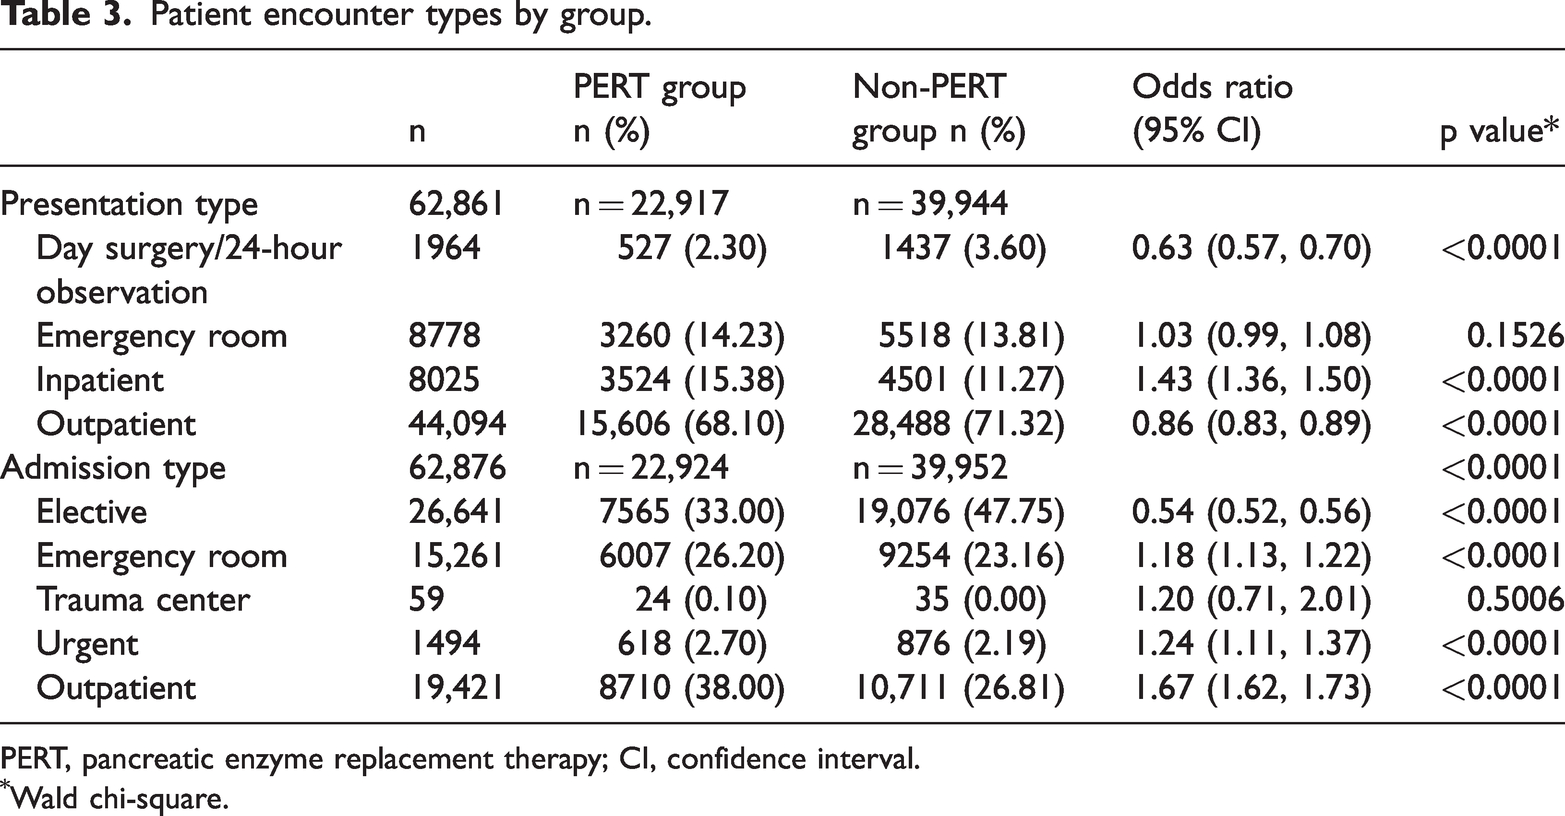
PERT, pancreatic enzyme replacement therapy; CI, confidence interval.
Wald chi-square.
Analysis of group differences in patient encounter admission types identified more non-elective admissions among the PERT group. Specifically, 33.0% of PERT group encounters and 47.75% of non-PERT group encounters were elective admissions, whereas, respectively, 26.20% and 23.16% were emergency room admissions; 0.10% and 0.00% were trauma center admissions; 2.70% and 2.19% were urgent admissions and 38.00% and 26.81% were outpatient admissions. Relative to patients in the non-PERT group, those in the PERT group had 0.46 times lower odds of elective admissions (OR, 0.54 [95% CI: 0.52, 0.56]; p < 0.0001) but 1.18 times greater odds of emergency room admissions (OR, 1.18 [1.13, 1.22]; p < 0.0001), 1.24 times greater odds of urgent admissions (OR, 1.24 [1.11, 1.37]; p < 0.0001), and 1.67 times greater odds of outpatient admissions (OR, 1.67 [1.62, 1.73]; p < 0.0001). There were no significant differences in trauma center admissions between the PERT and non-PERT groups (OR, 1.2 [0.71, 2.01]). Table 3 shows encounters by admission types between groups.
Patient encounter length of stay
Analysis of the number of hours spent in patient encounters by presentation type showed that the median LOS for day surgeries and/or 24-hour observation presentation types was 15 hours (IQR, 12–23) for the PERT group and 14 hours (12–18) for the non-PERT group; for emergency room presentations, 10 hours (4–23) and 9 hours (4–21), respectively (p < 0.0001); for inpatient presentations, 92 hours (52.5–150) and 83 hours (50–140, respectively; p < 0.0001); and for outpatient presentations, 22 hours (12–116) and 11 hours (12–23, respectively; p < 0.0001). Overall, median LOS was significantly greater for the PERT group across emergency room, inpatient and outpatient presentations (p < 0.0001). There were no significant between-group differences in median LOS for day surgeries and/or 24-hour observation presentation encounter types. Table 4 shows LOS by encounter presentation type.
Patient encounters (LOS, hours) by type and group.

IQR, interquartile range; LOS, length of stay; PERT, pancreatic enzyme replacement therapy; SD, standard deviation.
Wilcoxon signed-rank test.
PERT group, n = 6895; non-PERT group, n = 17,776.
Outpatient admission LOS data were not available.
PERT group, n = 7564; non-PERT group, n = 19,075.
Regarding the number of hours spent in patient encounters by admission type, median LOS for elective admissions was 22 hours (IQR, 12–124) for the PERT group and 16 hours (12–23) for the non-PERT group (p < 0.0001); for emergency room admissions, 29 hours (8–79) and 23 hours (7–66), respectively (p < 0.0001); for trauma admissions, 37 hours (15.5–101.5) and 63 hours (25–129), respectively; and for urgent admissions, 69.5 hours (22–138) and 38.5 hours (11–96.5, respectively; p < 0.0001). Overall, median LOS was greater in the PERT group across elective, emergency room and urgent admission encounter types (all p < 0.0001). There were no significant between-group differences in median LOS for trauma admission encounter types. Table 4 shows LOS by encounter admission type.
Revisits after index date
Patient encounters were reviewed in both groups to explore encounter visits as inpatient and emergency room presentations within 72 hours and 30 days of the patient’s index date. The PERT group had 2.50 times greater odds of presenting for inpatient encounters within 30 days of the index date (95% CI: 1.97, 3.17; p < 0.0001) and 1.43 times greater odds of presenting for emergency room encounters within 30 days of the index date (95% CI: 1.10, 1.87; p = 0.0080). There were no significant between-group differences for revisits for inpatient or emergency room encounters within 72 hours of the index date.
Clinical care costs
CPT codes across all 62,899 encounters were explored to aggregate clinical care costs by group. In the PERT group, 10,914 CPT codes were extracted across 8824 encounters; in the non-PERT group, 13,310 CPT codes were extracted across 10,818 encounters. As indicated by CPT codes, the PERT group had fewer procedures and encounters with procedures compared with the non-PERT group. Overall, the total procedure cost across all care received in the healthcare system was $1,981,600 for the PERT group and $2,300,500 for the non-PERT group, with an average encounter cost of $225 and $213, respectively. Although patients in the PERT group had a higher number of total encounters, they had fewer encounters requiring procedures, with an average similar care cost by encounter. Table 5 shows the aggregate procedure costs by group.
Aggregate procedure cost data by group.

PERT, pancreatic enzyme replacement therapy.
Discussion
This cross-sectional study examined data from a single, large US healthcare system and described significant differences between patients with CP who were prescribed PERT and those who were not. It explored encounter data across 14 years of patient care and may have identified a gap in the literature by describing differences in demographic and healthcare resource utilization components between these two groups. This was an exploratory and descriptive study; the design did not permit conclusions to be drawn about cause-and-effect relationships.
Because patients with CP have many complex care needs, progression is observed by tracking the patient’s position on the CP spectrum; for example, patients may transition from an “at-risk” to an “end-stage” state over time. Although the PERT group showed high resource utilization, with significantly higher rates of diagnoses and encounters overall (presenting more often for inpatient encounters, as well as more emergency room, urgent and outpatient admissions), data that could determine patients’ CP severity were not available. Usually, patients transitioning to “established” or “end-stage” CP begin to exhibit serious complications and require tighter medical surveillance (with possibly longer inpatient admissions) compared with patients who do not exhibit these symptoms and are not prescribed PERT. Serious complications, including pain and anatomic changes, and complications from malnutrition, such as vitamin deficiencies, metabolic bone disease, EPI and pancreatogenic diabetes, may be reasons for increased resource utilization.
Perhaps surprisingly, this study identified demographic differences by group, suggesting that patients who qualify for and/or receive PERT differ from those who do not. Patients in the PERT group were younger, perhaps because younger patients may benefit more, in terms of years with quality of life, by initiation of PERT or perhaps because they are more able to tolerate PERT compared with their older counterparts. More patients in the PERT group were men, which may reflect the greater proportion of EPI in men. More patients in the PERT group were single, divorced or separated, rather than married or widowed, and more often had public Medicaid, public aid or no health insurance (self-pay) compared with private insurance. These findings suggest that social support, in the form of a caregiver or a job with coworkers, or other additional resources, such as money and the stability associated with financial resources, may offset some EPI symptoms and reduce the need for PERT. Perhaps patients without such resources experience more severe symptoms, leading to receipt of PERT. Finally, Black and Hispanic patients were more likely to be in the PERT group, although the reasons for this finding are not well understood.
The ability to identify patients at risk for EPI is important in the treatment of patients with CP in clinical practice. Although CP guidelines for pain, diabetes and EPI are available, the lack of an “ideal” diagnostic test and standardized clinical care pathways for treating these patients within the healthcare landscape negatively affects patient care. 19 Consequently, knowledge gaps in EPI diagnosis in high-risk patient populations and PERT management may lead to unfavorable outcomes.
There were several study limitations. First, the study design did not permit the drawing of conclusions about cause-and-effect relationships; thus, any between-group differences could have been a cause or effect of PERT, or a combination of both. In addition, the data did not contain specific PERT dosing information, so the issue of appropriate dosing, particularly underdosing, could not be addressed. Specifically, although PERT prescription dosages and corresponding number of pills vary, the data source contained only dosage information, not associated number of pills per day. Adult patients with CP were grouped according to whether they were prescribed PERT; patient encounters before and after PERT prescription were not separately explored. As patients who received PERT had more encounters and more diagnoses per encounter, the PERT group showed significantly more diagnoses, which may indicate that they had more severe EPI. However, this cannot be confirmed.
As noted above, differences in resource utilization could explain the decision of healthcare providers to prescribe or not prescribe PERT, and could clarify the effect of PERT as a therapy component. However, no definitive conclusions about the effect of PERT can be made based solely on the present findings. More inferential research is needed to target factors that contribute to and result from PERT prescriptions.
Supplemental Material
sj-pdf-1-imr-10.1177_03000605241261332 - Supplemental material for Pancreatic enzyme replacement therapy and resource utilization in patients with chronic pancreatitis in a US healthcare system: a retrospective study
Supplemental material, sj-pdf-1-imr-10.1177_03000605241261332 for Pancreatic enzyme replacement therapy and resource utilization in patients with chronic pancreatitis in a US healthcare system: a retrospective study by Anne Rivelli, Jamie B Vora, Debra Diaz and Veronica Fitzpatrick in Journal of International Medical Research
Supplemental Material
sj-pdf-2-imr-10.1177_03000605241261332 - Supplemental material for Pancreatic enzyme replacement therapy and resource utilization in patients with chronic pancreatitis in a US healthcare system: a retrospective study
Supplemental material, sj-pdf-2-imr-10.1177_03000605241261332 for Pancreatic enzyme replacement therapy and resource utilization in patients with chronic pancreatitis in a US healthcare system: a retrospective study by Anne Rivelli, Jamie B Vora, Debra Diaz and Veronica Fitzpatrick in Journal of International Medical Research
Supplemental Material
sj-pdf-3-imr-10.1177_03000605241261332 - Supplemental material for Pancreatic enzyme replacement therapy and resource utilization in patients with chronic pancreatitis in a US healthcare system: a retrospective study
Supplemental material, sj-pdf-3-imr-10.1177_03000605241261332 for Pancreatic enzyme replacement therapy and resource utilization in patients with chronic pancreatitis in a US healthcare system: a retrospective study by Anne Rivelli, Jamie B Vora, Debra Diaz and Veronica Fitzpatrick in Journal of International Medical Research
Footnotes
Acknowledgements
Editorial support was provided by Maryann T. Travaglini, PharmD, and Janet E. Matsuura, PhD, of ICON (Blue Bell, PA, USA) and was funded by AbbVie.
Author contributions
All authors participated in the conception and design of the study, the analysis and interpretation of the data, and drafted the paper. All authors critically reviewed and approved the final manuscript. All authors are accountable for all aspects of the work.
Declaration of conflicting interest
AR and VF report no conflicts of interest. JV and DD are full-time salaried employees of AbbVie.
Funding
This study was funded by AbbVie. The authors received no direct financial support for the research, authorship, and/or publication of this article.
Supplementary material
Supplemental material for this article is available online.
References
Supplementary Material
Please find the following supplemental material available below.
For Open Access articles published under a Creative Commons License, all supplemental material carries the same license as the article it is associated with.
For non-Open Access articles published, all supplemental material carries a non-exclusive license, and permission requests for re-use of supplemental material or any part of supplemental material shall be sent directly to the copyright owner as specified in the copyright notice associated with the article.