
Abstract
Objective
To identify patients with type 2 diabetes mellitus (T2DM) with no history of fracture or osteoporosis treatment who are at risk of bone complications through the assessment of bone quality and quantity.
Methods
Of the outpatients attending our clinic during 2021 to 2022, we retrospectively enrolled 137 (men/women: 85/52, median age: 65 years) consecutive patients aged ≥40 years who had T2DM but no history of fracture or osteoporosis treatment. The lumbar spine and femoral neck bone mineral density and the trabecular bone score were determined using dual-energy X-ray absorptiometry. Independent factors associated with bone disease were identified using logistic regression analysis, and odds ratios (ORs) were calculated.
Results
Age and female sex were significantly associated with high ORs for development of bone disease. The integrated risk of bone complications was nearly 40-fold higher in older (≥65 years) women than in younger (<65 years) men. This difference remained after adjustment for the duration of T2DM, body mass index, and HbA1c level.
Conclusions
Older women have the highest risk of osteopenia and osteoporosis among patients with T2DM who have no history of fracture or osteoporosis treatment. These patients should undergo intensive monitoring for bone fragility from an early stage of their disease.
Keywords
Introduction
Osteoporotic fracture is a major public health problem worldwide.1–3 The incidence of osteoporotic fracture has significantly increased in men and women over the past 40 years (1980 to 2020) in Japan. 4 Type 2 diabetes mellitus (T2DM) is a major cause of secondary osteoporosis, and osteoporosis-related diseases are considered to be major complications of T2DM.5,6 Fractures impose considerable financial and social burdens when they develop in patients with T2DM. 7 Thus, surveillance for bone lesions in all patients with T2DM is desirable. However, this is impractical from a health economics perspective, because the number of patients with T2DM is rapidly increasing. 8 At present, treatment is likely to be provided for most patients who have experienced fragility fracture, because previous fracture is associated with a high risk of recurrent fracture.9,10 Therefore, the early detection of bone fragility is crucial to reduce the incidence of osteoporotic fracture in patients with T2DM. However, there are currently no simple and rapid methods to identify patients who are at high risk in routine clinical practice.
Although patients with T2DM are at a high risk of bone complications, many studies have shown that such patients have higher bone mineral density (BMD), assessed using dual-energy X-ray absorptiometry (DXA), than individuals who did not have diabetes,11–14 which implies that BMD does not accurately reflect differences in bone strength. These findings highlight the importance of evaluating bone strength using methods other than BMD, such as trabecular bone score (TBS).15–18 Although TBS is an indicator of bone quality, the values obtained from DXA scans of the lumbar spine are closely associated with the quality of the bone microarchitecture and provide additional information to BMD.19–21 Indeed, low TBS has been shown to be associated with fracture in patients with T2DM.22–24
Therefore, in the present study, we aimed to identify patients with T2DM with no history of osteoporotic fracture or osteoporosis treatment who are at risk of bone complications by assessing their bone quality and quantity.
Methods
Study design and participants
We performed a retrospective single-center study at St. Marianna University Yokohama Seibu Hospital, Yokohama, Japan. The participants were patients who consecutively participated in T2DM education programs between April 2021 and September 2022. We de-identified all the details of the participants. The inclusion criteria were as follows: 1) presence of T2DM, 2) age ≥40 years, and 3) DXA performed within the 60 days prior to and subsequent to hospitalization. The exclusion criteria were as follows: 1) acute metabolic complications, such as diabetic ketoacidosis and a hyperglycemic hyperosmolar state, 2) a diagnosis of osteoporosis and the commencement of treatment before admission, 3) the presence of bone fracture on X-ray or computed tomography examination, 4) a history of oral steroid administration for the treatment of another disease, 5) the administration of pioglitazone hydrochloride at the time of admission, and 6) a body mass index (BMI) <15 or >37 kg/m2. 25 Patients with a history of fracture or osteoporosis treatment were excluded because fractures may affect BMD, 26 and the treatment of osteoporosis affects both BMD and the TBS. 27 In addition, previous fracture is associated with a high risk of recurrent fracture.9,10 Most physicians are aware of the need to identify and treat bone complications in such patients, but in the present study, we aimed to identify subpopulations of patients with T2DM who are at high risk of a first fracture.
The Clinical Research Ethics Committee of the St. Marianna University School of Medicine approved the study protocol (approval no. 5859) and it complied with the revised version of the guidelines in the Declaration of Helsinki. An opt-out option on the website of St. Marianna University Yokohama Seibu Hospital was used to obtain consent. The reporting of the study conforms to the STROBE guidelines. 28
Laboratory measurements
We collected data regarding sex, age, duration of diabetes, height, body mass, BMI, hemoglobin A1c (HbA1c), fasting plasma glucose (FPG), urinary C-peptide immunoreactivity (U-CPR), estimated glomerular filtration rate (eGFR), presence or absence of diabetic microangiopathy (neuropathy, retinopathy, or nephropathy), treatment for diabetes before admission, use of insulin before admission, treatment for hypertension, and treatment for dyslipidemia. BMI was calculated as body mass in kilograms divided by height in meters, squared, on admission. We collected a blood sample from each participant in the morning after overnight fasting. HbA1c level was determined using high-performance liquid chromatography (Adams A1c HA-8190V, Arkray, Inc. Kyoto, Japan). FPG was measured using the hexokinase-glucose-6-phosphate dehydrogenase method (Quick Auto Neo GLU-HK, Shino-Test Co., Tokyo, Japan). U-CPR was measured using a chemiluminescence-based immunoassay (Architect® C-Peptide, Abbot Japan LLC, Tokyo, Japan). Serum creatinine (mmol/L) was measured using an enzymatic method (IatroLQ CRE II, LSI Medience Co., Tokyo, Japan), and eGFR was calculated using the Modification of Diet in Renal Disease Study equation, modified for use in Japanese people by the Japanese Society of Nephrology for each sex, as shown below.
29


Dual X-ray absorptiometry and trabecular bone score
DXA was used to determine the BMD and TBS, indices of bone quality, to assess bone complications. The BMD (g/cm2) at the lumbar spine (LS-BMD) and right femoral neck (FN-BMD) were measured by DXA using a Horizon® machine (Hologic Inc., Marlborough, MA, USA). The percentage coefficient of variation in BMD for the DXA machine used in the present study was 1.0%. We defined the values obtained for LS-BMD and FN-BMD as indicating osteoporosis or osteopenia, or being normal. Osteoporosis was defined using a T-score ≤−2.5 SD, osteopenia was defined using −2.5 SD < T-score < −1.0 SD, and normal was defined using a T-score ≥−1.0 SD, according to the World Health Organization (WHO) criteria. 30 The TBS was calculated using the pixel variations within the LS DXA images in TBS iNsight™ software, version 3.0.3 (Medimaps Group, Geneva, Switzerland). The TBS was classified as indicating degraded, partially degraded, or normal microarchitecture. Degraded microarchitecture was defined using TBS ≤1.230, partially degraded microarchitecture was defined using 1.230 < TBS < 1.310, and normal microarchitecture was defined as TBS ≥1.310. 31 Raw TBS values may be underestimated if there are excessive deposits of adipose tissue in the abdominal region, where one of the areas of interest is located. To mitigate this artifact, the TBS values were adjusted according to the participant’s BMI, as long as this was within the range of 15 to 37 kg/m2. 25 We defined a T-score ≤−1.0 SD as indicating bone mass loss (BML) and a TBS <1.310 as indicating a deterioration of bone quality (DBQ). We further defined LS-BML or DBQ as indicating LS bone disease (LS-BD) and LS-BML, FN-BML, or DBQ as indicating bone disease (BD).
Statistical analysis
The normality of the datasets was checked using the Shapiro–Wilk test. Accordingly, continuous data are accordingly reported as median [interquartile range (IQR)], and categorical data are reported as numbers and percentages. Continuous and categorical datasets were compared using the Mann–Whitney U and Fisher’s exact tests, respectively. After identifying factors that influenced BD using univariate analysis, multiple logistic regression analysis with a backward stepwise selection procedure was performed to identify factors independently associated with BD. Odds ratios (ORs) and 95% confidence intervals (CIs) for the associations were calculated using logistic regression. Statistical significance was accepted when P < 0.05 and statistical analyses were performed using SPSS version 26 (IBM Corp., Armonk, NY, USA).
Results
Clinical and laboratory characteristics of the participants
After the application of the inclusion and exclusion criteria, 137 patients remained for analysis (Figure 1). Multiple logistic regression analysis showed that age and female sex significantly increased the odds of developing BD (Table S1). Therefore, the participants were placed into four groups, based on their age (≥65 years or <65 years) and sex (men or women). Table 1 shows the clinical and laboratory characteristics of the participants, categorized according to sex and age. The TBS, LS T-score, and FN T-score were significantly lower in women than in men. Women aged <65 years were the heaviest group, and therefore had significantly higher BMIs. The HbA1c, FPG, and U-CPR of all the groups were comparable, but the eGFR was lower in men aged ≥65 years than in men aged <65 years or women aged <65 years. There were no differences in the prevalence of a history of insulin use. The TBS, LS T-score, and FN T-score were significantly lower in women aged ≥65 years than in the other groups. The FN T-score was also lower in men aged ≥65 years than in men aged <65 years.

Flow diagram of the patient enrollment process. BMI, body mass index; DXA, dual-energy X-ray absorptiometry; N, number of patients.
Clinical and laboratory characteristics of the participants after stratification by sex and age.

Data are expressed as median (interquartile range) for continuous datasets (analyzed using the Mann–Whitney U test) or number (%) for categorical datasets (analyzed using Fisher’s exact text). FN, femoral neck; LS, lumbar spine; N, number of patients; TBS, trabecular bone score. * P < 0.05 versus men aged <65 years; ** P < 0.05 versus men aged ≥65 years; *** P < 0.05 versus women aged <65 years.
Prevalence of bone complications
The prevalence of bone complications, in the form of DBQ, LS-BML, FN-BML, LS-BD, and BD, was higher in women than in men. The prevalences of DBQ and LS-BML were 21% (10/47) and 26% (12/47), respectively, in men aged <65 years; 32% (12/38) and 16% (6/38), respectively, in men aged ≥65 years; 43% (9/21) and 33% (7/21), respectively, in women aged <65 years; and 77% (24/31) and 55% (17/31), respectively, in women aged ≥65 years (Figure 2). Assessment of the TBS and BMD at the LS showed a higher prevalence of DBQ than of BML in all of the groups. The prevalence of DBQ [40% (55/137)] was significantly higher than that of LS-BML [31% (42/137)] in the participants as a whole and in women specifically (63% versus 46%). The prevalence of LS-BD, including DBQ and/or LS-BML, was significantly higher in women aged ≥65 years than in the other groups. The prevalence of FN-BML was 23% (11/47) in men aged <65 years, 53% (20/38) in men aged ≥65 years, 43% (9/21) in women aged <65 years, and 90% (28/31) in women aged ≥65 years. The prevalence of FN-BML was higher in men aged ≥65 years than in men aged <65 years and was higher in women aged ≥65 years than in the other groups. The prevalence of BD, including DBQ and/or BML, was 1.5-fold to 2.3-fold higher in women aged ≥65 years than in the other groups. There were no significant differences in the prevalences of indices of bone complications, except for FN-BML, among the other groups.

Prevalences of bone complications in the participants placed into four groups according to their age and sex. BD, bone disease; BML, bone mass loss; DBQ, deterioration of bone quality; FN, femoral neck; LS, lumbar spine; M, men; W, women. *P < 0.05 versus men aged <65 years; **P < 0.05 versus men aged ≥65 years; ***P < 0.05 versus women aged <65 years.
Prevalences of bone complications in the four groups
Table 2 shows a comparison of the bone complications experienced by men aged <65 years, compared with the other groups, after adjustment for the duration of diabetes, BMI, and HbA1c level. The risk of bone complications did not differ between men aged <65 years and women aged <65 years, or between men aged <65 years and men aged ≥65 years, with respect to all of the bone complications, except FN-BML. However, the risk for women aged ≥65 years was much higher than that for men aged <65 years with respect to all of the bone complications, except LS-BML. A comparison of the crude risks is shown in Table S2 and Figure S1. There were no significant differences in the unadjusted or adjusted ORs for all of the bone complications between women aged <65 years and men aged ≥65 years.
Risks of bone complications for the four groups, calculated using logistic regression, after adjustment for the duration of diabetes, body mass index, and hemoglobin A1c level.

BD, bone disease; BML, bone mass loss; CI, confidence interval; DBQ, deterioration of bone quality; FN, femoral neck; LS, lumbar spine; OR, odds ratio; Ref., reference.
Utility of DXA for the assessment of LS and FN
A Venn diagram (Figure 3) was drawn to demonstrate the differences in the prevalence of bone complications, according to data for the LS and FN, obtained using DXA. First, when the LS-BMD and TBS were determined using the WHO criteria for BMD, we identified 70 participants who had either DBQ or BML (Figure 3a). When only the TBS obtained via DXA was considered, we identified 28 participants (40%) who had DBQ alone. When FN-BMD was used in addition to LS-BMD and TBS, 89 participants were found to have any BD. The identified prevalence of BD increased by 14%, from 51% to 65%, when both the LS and FN data collected using DXA were considered (Figure 3b). Of those evaluated for bone complications, 34 showed abnormalities in any one of the three DXA parameters. Next, we changed the definition of osteoporosis to that suggested by Schwartz et al., using 0.4 SD for men and 0.6 SD for women, because BMD values are often overestimated in patients with T2DM. 14 Subsequently, we reviewed the ability of the DXA indices to identify bone complications at both sites. We identified 79 participants with complications when both the LS-BMD and TBS were considered, but only 15 had DBQ alone (Figure 3c). Thus, even when the criteria for BML were relaxed, the additional assessment of bone quality was found to be useful. The addition of FN-BMD to LS-BMD and the TBS increased the number of participants thought to have bone complications to 100. Thus, similar to the situation with respect to the WHO criteria, the prevalence of bone complications increased by 15%, from 58% to 73%, when the LS and FN were considered (Figure 3d). Of the participants who were diagnosed with bone complications using these novel criteria, 28 had one of the three bone abnormalities.
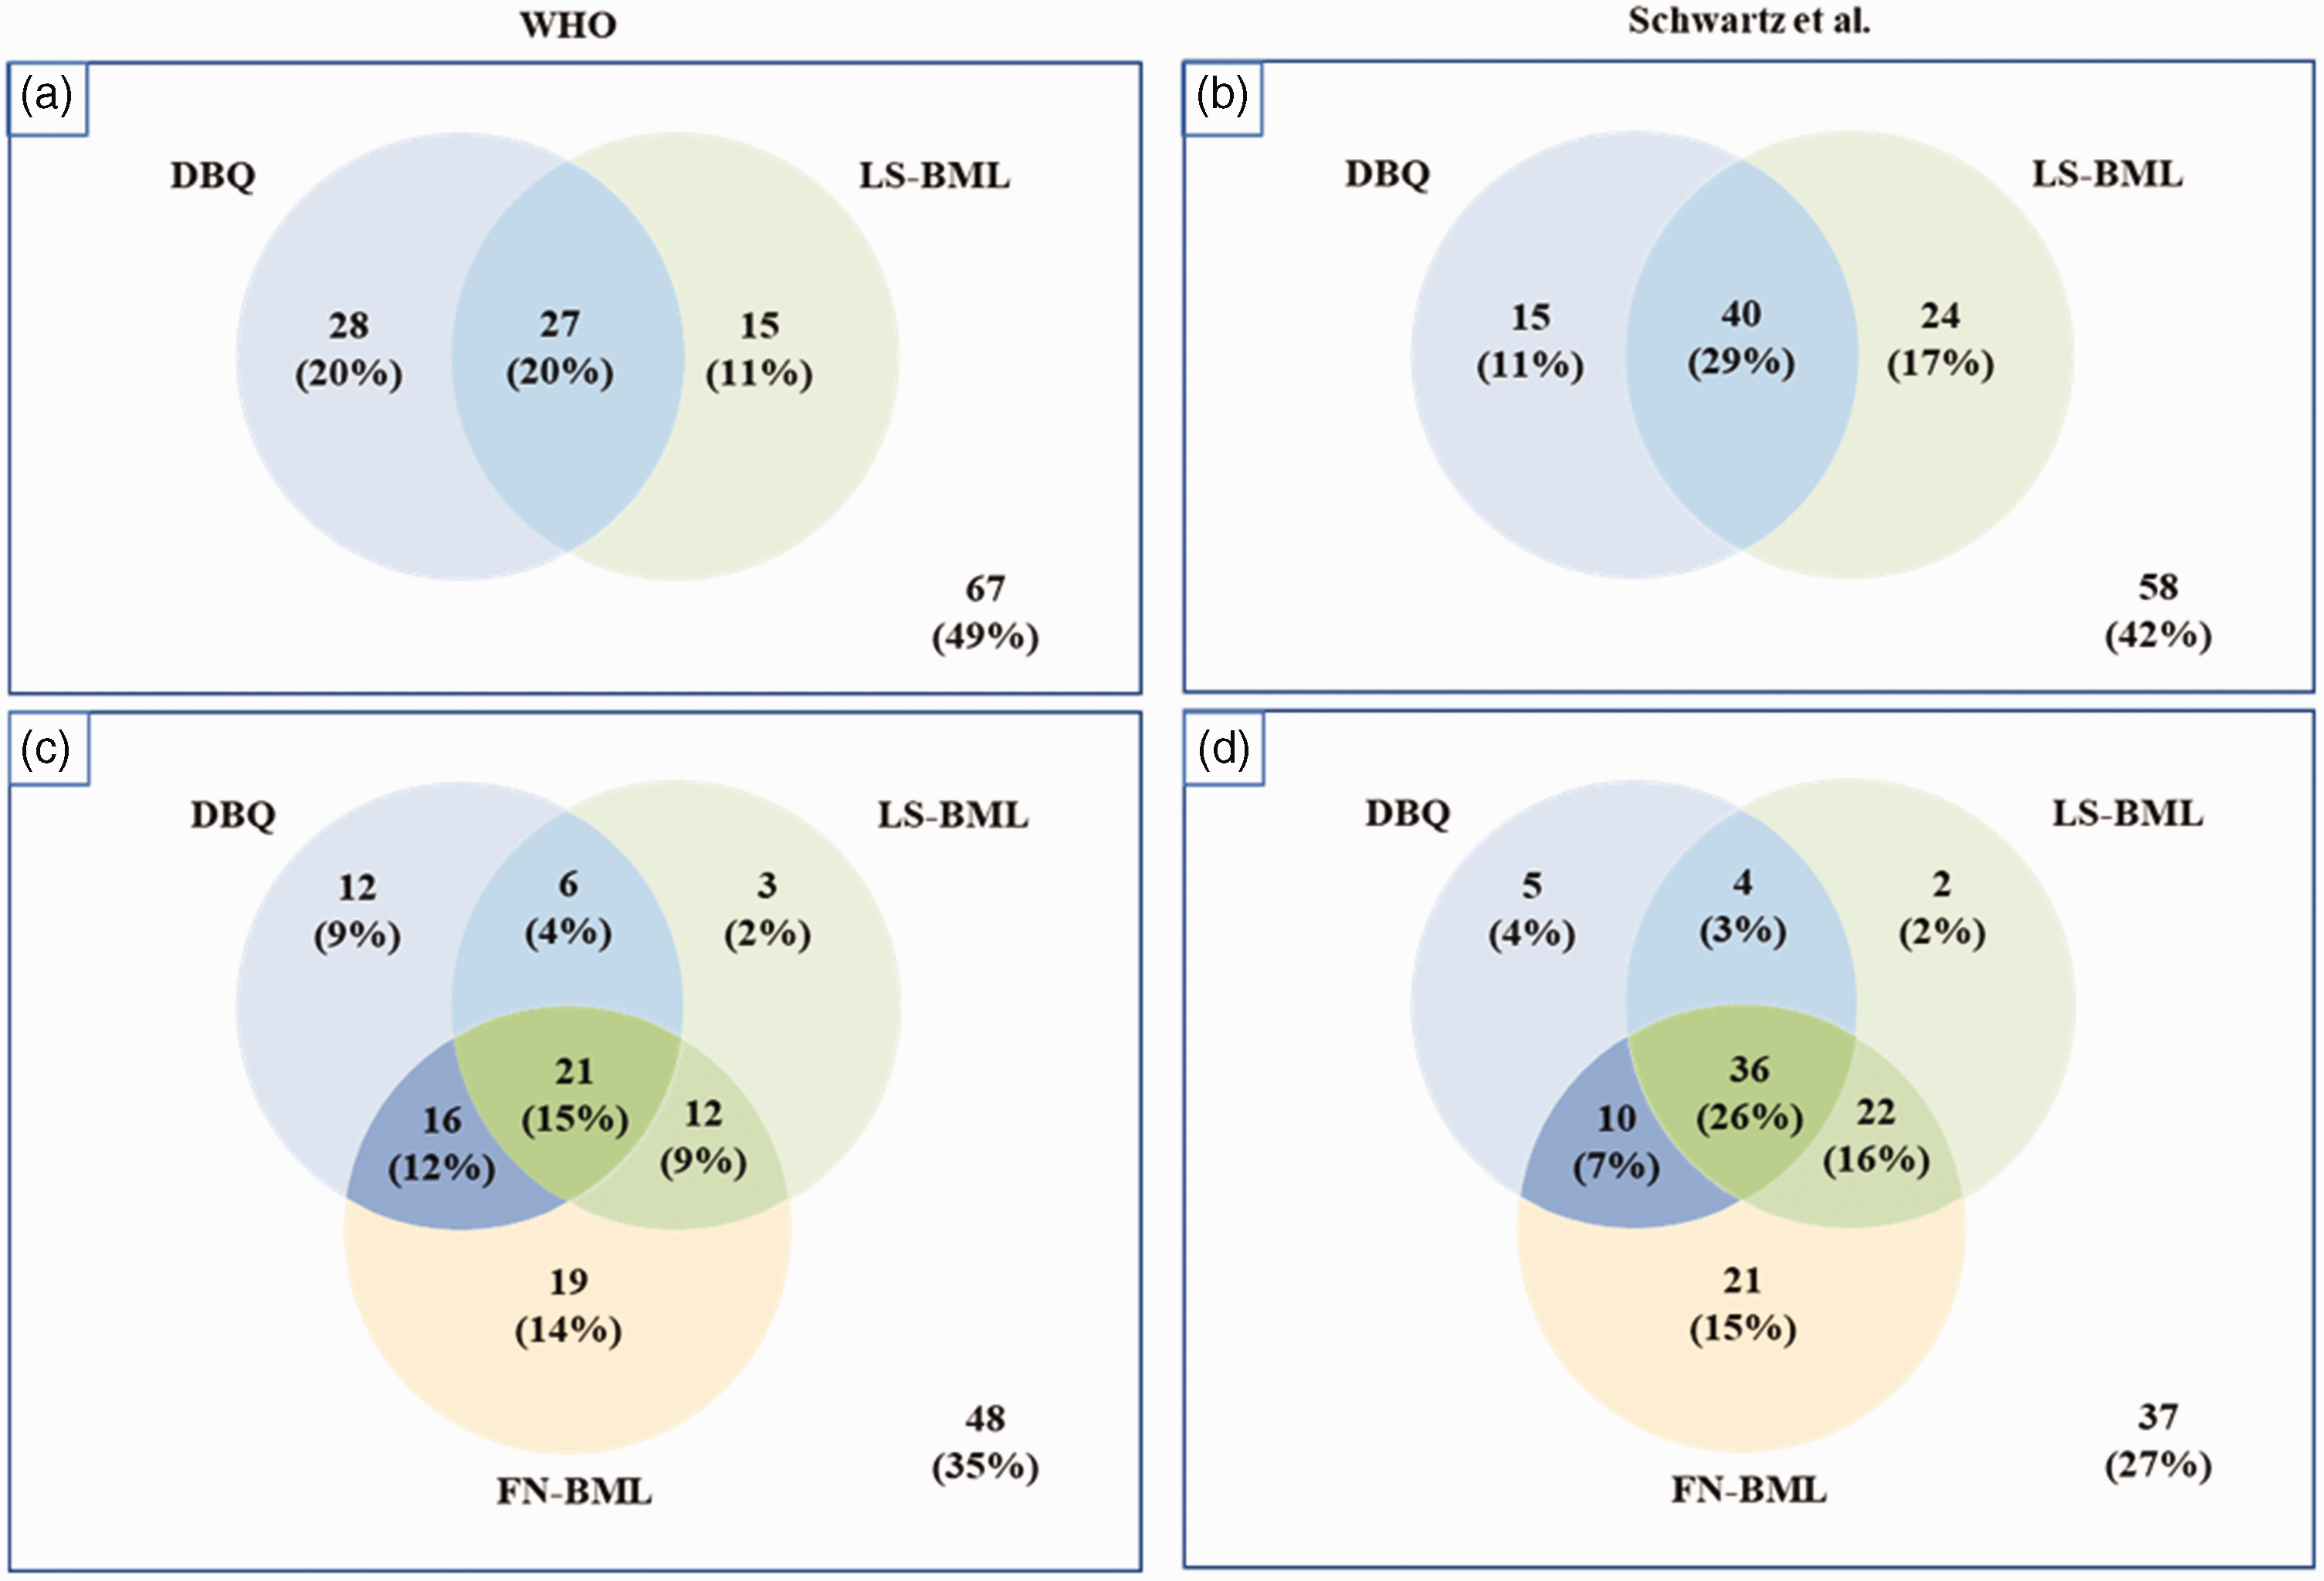
Number (percentage) of participants who showed bone fragility on dual-energy X-ray absorptiometry at one or more of the two sites of interest. The bone complications identified using each test were defined using the World Health Organization criteria (left two Venn diagrams; a, c) or the criteria proposed by Schwartz et al. (right two Venn diagrams; b, d). BML, bone mass loss; DBQ, deterioration of bone quality; FN, femoral neck; LS, lumbar spine.
Discussion
Growing evidence suggests that patients with T2DM are at risk of developing osteoporosis and subsequent fracture.32,33 A previous fracture is a risk factor for future fractures.9,10 Furthermore, the risk of non-vertebral fractures is higher in individuals with both T2DM and vertebral fractures than in those with T2DM alone. 34 The present findings indicate that bone risk assessments in patients T2DM are important for the prevention of bone fractures. Therefore, we aimed to identify patients with T2DM without a history of fracture or osteoporosis treatment who were at risk of bone complications by assessing their bone quality and quantity.
In the present study, the overall prevalence of bone complications in a group of Japanese patients with T2DM was found to be 65%. Because the multivariate analysis showed that age (≥65 or <65 years) and sex were associated with the prevalence of BD, we placed the study participants into four groups on the basis of these two variables. The integrated risk of having bone complications in older women (≥65 years) was nearly 40-fold higher than that in younger men (<65 years). Many previous epidemiologic studies have shown that being older and female are independent risk factors for osteoporosis.35,36 Here, we have shown that older women with T2DM are the priority group for monitoring for the development of bone complications in the absence of bone fractures and a history of osteoporosis treatment. To the best of our knowledge, there have been no similar studies of this specific issue. In addition to age and sex, various other factors, including diabetes, 37 BMI, 38 glycemic control, 39 nutritional status, 40 renal function, 41 and nerve conduction velocity 42 have been shown to contribute to the development of bone fragility in patients with T2DM. Owing to the relatively small sample size in the present study, various known risk factors for bone deterioration could not be adjusted for. However, with the exception of LS-BML, significant differences in the risk of bone outcomes between older women and younger men remained after adjustment for the duration of diabetes, BMI, and HbA1c. In addition, the prevalences of neuropathy, low eGFR, and insulin use did not differ significantly between these two groups. Larger-scale studies should be performed to clarify the effects of age and sex on the prevalence of bone complications in patients with T2DM after adjustment for other factors that may influence this outcome.
Because fractures and the treatment of osteoporosis could affect the BMD and TBS values,26,27 we excluded patients with a history of fracture or the treatment of osteoporosis (N = 68). However, the ORs for bone complications, including the two specific diseases, for each group, may also represent important information for clinicians. When the patients with a history of fracture or osteoporosis treatment were added to the study participants (total N = 205), the adjusted ORs for bone complications were 5.5 (95% confidence interval: 1.9–15.5) in women aged <65 years, 3.2 (1.3 to 8.0) in men aged ≥65 years, and 71.9 (8.7 to 596.0) in women aged ≥65 years, compared with men aged <65 years. These results indicated that there is a higher risk of bone fragility in older men and younger women than in younger men, but the risk is much higher in older women.
Despite the susceptibility of patients with T2DM to bone complications, many previous studies have shown that patients with T2DM have higher BMDs than individuals who do not have diabetes,11–13 which implies that the measurement of BMD alone is insufficient to assess changes in bone strength. This could be explained by the poor bone quality that characterizes T2DM.43,44 However, some previous studies have shown an association between the BMD T-score and fracture risk in older adults with T2DM. 14 Compared with patients with T2DM who have not experienced fracture, those with T2DM who have experienced fracture have lower BMD values, albeit that these are within the normal range.45,46 Therefore, we assessed the bone fragility of patients with T2DM using BMD in combination with the TBS. Consistent with previous findings, DBQ was found to be more prevalent than BML at the LS (40% versus 30%) in the present study.36,47,48 The numbers of participants with DBQ and BML alone were 28 and 15, respectively. When the measurement of FN was added to the assessment of bone quantity, another 19 participants (14%) were diagnosed as having BD. Furthermore, the higher risks of bone fragility in older men and younger women were only identified when FN-BMD was considered. Therefore, the addition of FN-BMD to LS-BMD and LS-TBS might enable the identification of more patients with T2DM who have no history of fracture or osteoporosis treatment. As expected, the use of the novel criteria for the diagnosis of BML proposed by Schwartz et al. resulted in a higher prevalence of DBQ than that obtained using the current WHO criteria (69% versus 56%). 14 However, 28 participants were diagnosed with osteopenia or osteoporosis on the basis of only one of the three tests (LS-TBS, LS-BMD, and FN-BND), which implies that the relationships among the three tests remains, even when the newly proposed criteria are used.
On the basis of a retrospective database analysis, Taguchi et al. estimated that the annual total medical costs (costs of treating fractures and comorbidities) of any fracture were ≥1000 US dollars (USD) (at 1 USD = 140 JPN). 49 Notably, the medical bills for patients who experienced hip fracture were significantly higher (approximately 15,000 USD) than those for patients with fractures at other sites. Moreover, in older people in particular, fractures reduce or prevent physical activity, resulting in sarcopenia, frailty, and falls. Hence, fractures impose an additional economic burden. In Japan, the current cost of a DXA examination is 25.7 USD for one site, but because the difference in cost between assessing one or two sites is only 6.4 USD, the use of this technique to assess two sites in a subgroup at risk might represent a cost-effective strategy for the early detection of bone fragility in patients with T2DM. Nayak et al. also reported that multiple osteoporosis screening strategies are cost-effective for postmenopausal women. 50 However, further studies are needed to verify the clinical utility of the present approach.
The main limitations of the present study are the relatively small number of enrolled patients and events and its retrospective cross-sectional design. However, we used strict enrollment criteria that led to the exclusion of patients with a history of osteoporosis treatment or bone fracture, those who had taken drugs that can affect bone metabolism, and those with severe obesity that could lead to an underestimation of BMD. Second, the study was performed in Japan. Therefore, it is unknown whether the identified risk factors for bone complications apply to all patients with T2DM who do not have a history of fracture or osteoporosis treatment. Therefore, further studies are needed to confirm these findings in other countries.
In conclusion, the present findings provide further evidence that older women have the highest risk of bone complications among patients with T2DM who do not have a history of osteoporotic bone fracture or treatment. These patients should undergo early and intensive monitoring for bone fragility. The use of complementary assessments of FN-BMD, LS-BMD, and LS-TBS might be a cost-effective means of identifying bone complications in this population.
Supplemental Material
sj-pdf-1-imr-10.1177_03000605241246743 - Supplemental material for Age and sex are excellent predictors of bone complications in patients with type 2 diabetes with no history of osteoporotic fracture or treatment for osteoporosis
Supplemental material, sj-pdf-1-imr-10.1177_03000605241246743 for Age and sex are excellent predictors of bone complications in patients with type 2 diabetes with no history of osteoporotic fracture or treatment for osteoporosis by Yutaro Yamamoto, Ren Matsuba, Tomoyuki Nagasaka, Sachi Shimizu, Kensuke Sakai, Masakatsu Sone and Takuyuki Katabami in Journal of International Medical Research
Supplemental Material
sj-pdf-2-imr-10.1177_03000605241246743 - Supplemental material for Age and sex are excellent predictors of bone complications in patients with type 2 diabetes with no history of osteoporotic fracture or treatment for osteoporosis
Supplemental material, sj-pdf-2-imr-10.1177_03000605241246743 for Age and sex are excellent predictors of bone complications in patients with type 2 diabetes with no history of osteoporotic fracture or treatment for osteoporosis by Yutaro Yamamoto, Ren Matsuba, Tomoyuki Nagasaka, Sachi Shimizu, Kensuke Sakai, Masakatsu Sone and Takuyuki Katabami in Journal of International Medical Research
Supplemental Material
sj-pdf-3-imr-10.1177_03000605241246743 - Supplemental material for Age and sex are excellent predictors of bone complications in patients with type 2 diabetes with no history of osteoporotic fracture or treatment for osteoporosis
Supplemental material, sj-pdf-3-imr-10.1177_03000605241246743 for Age and sex are excellent predictors of bone complications in patients with type 2 diabetes with no history of osteoporotic fracture or treatment for osteoporosis by Yutaro Yamamoto, Ren Matsuba, Tomoyuki Nagasaka, Sachi Shimizu, Kensuke Sakai, Masakatsu Sone and Takuyuki Katabami in Journal of International Medical Research
Footnotes
Acknowledgement
The authors are indebted to Mariko Yoko for her expert assistance with this study.
Author Contributions
Y.Y. and T.K. designed the experiments and wrote the manuscript. Y.Y., R.M., T.N., and S.S. participated in the data collection. Y.Y., R.M., S.K., M.S., and T.K. interpreted the data. All the authors reviewed the manuscript, provided feedback, and approved the final version.
Declaration of conflicting interest
The authors declare that there is no conflict of interest.
Funding
This research received no specific grant from funding agencies in the public, commercial, or not-for-profit sectors.
Supplementary material
Supplemental material for this article is available online.
References
Supplementary Material
Please find the following supplemental material available below.
For Open Access articles published under a Creative Commons License, all supplemental material carries the same license as the article it is associated with.
For non-Open Access articles published, all supplemental material carries a non-exclusive license, and permission requests for re-use of supplemental material or any part of supplemental material shall be sent directly to the copyright owner as specified in the copyright notice associated with the article.