
Abstract
Objective
To determine the distribution of ABO and Rh (D) blood group phenotypes among blood donors.
Methods
This retrospective cross-sectional study enrolled blood donors whose socio-demographic and blood group phenotype data were collected from blood bank donor records. Descriptive statistics were used to summarise the number and percentage distribution of categorical variables. To determine if the distributions of the ABO and Rh phenotypes differed, a chi-square test was employed.
Results
Of 14,887 blood donors with a median age of 20 years (interquartile range = 18–30 years), 72.8% were males, and young donors (age range = 18–24 years) accounted for 61.7%. Group O (45.6%) was the most prevalent ABO blood phenotype, followed by A (29.5%), B (20.2%), and AB (4.7%). The dominant blood group was O positive (42.4%), followed by A positive (27.4%), B positive (18.9%), AB positive (4.3%), O negative (3.2%), A negative (2.1%), B negative (1.3%), and AB negative (0.4%). The overall Rh (D)-negative distribution rate was 7.0%.
Conclusion
This study showed that blood group O was the most common ABO phenotype, followed by A, B, and AB. Overall, 93.0% of the donors were Rh (D)-positive. These findings may help guide blood transfusion programmes.
Introduction
Blood is a specialised tissue that has vital functions in the human body 1 and consists of a fluid part (named plasma) and cells including leukocytes, erythrocytes, and thrombocytes. The membrane of erythrocytes is complex and contains antigens that are carried by glycoproteins and glycolipids. 2 To date, over 45 blood group systems and up to 360 blood group antigens have been recognised by the International Society of Blood Transfusion, 3 the ABO and rhesus (Rh) blood group systems appear to be the most clinically relevant.4–6
The concept of ‘blood group’ refers to the overall blood group system, which consists of erythrocyte antigens whose expression is driven by several genes that determine the blood group’s specificity. These genes can be allelic or closely linked on the same chromosome.7,8
The ABO system consists of four main blood group types (A, B, AB, and O). Human blood plasma contains reverse antibodies that are specific to ABO antigens 5 given that the ABO blood group antibody does not need prior exposure to red cells to appear and is therefore considered a naturally occurring antibody. 9
The Rh blood group system is currently the most polymorphic blood group system in humans and includes two genes (RHD and RHCE), which encode a total of 56 antigens. The genes RHD and RHCE encode the RhD and RhCE proteins, respectively. 10 More specifically, the D antigen, which is the most clinically significant, is carried by Rh (D), 11 thus defining the D-positive (D+) phenotype. In contrast, the lack of a D antigen characterises the D-negative (D−) phenotype.6,9
The ABO and Rh blood groups of a person are commonly tested for the transfusion of blood and its components and for organ transplantation and genetic studies.9,12 The most frequently utilised blood group antigens in the clinical environment are ABO and Rh, which are used for preventing transfusion reactions and maternal mortality.4,5 In vivo haemolysis can be caused by ABO antibodies. 13 Similarly, haemolytic transfusion reactions and haemolytic disease of the foetus and newborn may occur when an alloimmunised D-negative patient, i.e., a patient who produces an alloantibody directed against the D antigen, is transfused with D-positive red blood cells or when an alloimmunised D-negative pregnant woman carries a D-positive foetus—with potentially fatal outcomes. 9
The phenotypic and gene distribution frequencies of ABO and Rh vary significantly across racial and geographic boundaries.6,14–16 Even within the same region, the distribution and frequency of the ABO and Rh blood groups vary by ethnicity. The O blood group is most prevalent across Ethiopia, followed by the A, B, and AB blood groups.17–25 Between 7.0% and 19.37% of the Ethiopian population is Rh (D)-negative, 26 with the Gambella region of Ethiopia having the highest percentage of people who are Rh (D)-negative. 17
For a blood bank to effectively manage its inventory and support quick and safe blood transfusion services with an adequate supply of blood, knowledge of the distribution pattern of the ABO and Rh (D) blood groups in particular populations is essential.16,24,27 Therefore, this study aimed to determine the distribution pattern of ABO and Rh blood group phenotypes among voluntary blood donors at the Nekemte Blood Bank, Oromia, West Ethiopia.
Material and methods
Study design, setting, and period
A retrospective cross-sectional study was conducted at the Nekemte Blood Bank to investigate the distribution patterns of ABO and Rh blood groups among first-time blood donors from January 2017 to January 2023. The blood bank is situated in Nekemte Town, East Wallaga Zone, which is located 331 km to the west of Addis Ababa (Finfinne), the capital city of both the Oromia region and the Ethiopian state. The blood bank was established in 2012.
Blood was collected through a mobile campaign and at the blood bank from voluntary, non-remunerated donors and was transported to the blood bank by maintaining the cold chain at 2–10°C using a cold box. When the blood arrived at the blood bank, it was arranged by blood unit number and stored in a blood bank refrigerator (2–6°C). Currently, the bank serves more than 22 hospitals that are located in the four Wallaga zones and nearby zones in Western Ethiopia. Although whole blood is the only type of blood that is collected and distributed by the blood bank, most of the blood is used for obstetric, gynaecological, and surgical emergencies.
Study population
A total of 14,887 first-time blood donors with complete demographic information and ABO and Rh blood group results were included in the study. Data regarding age, sex, occupation, place of residence, and ABO and Rh blood group phenotypes were retrospectively recorded from the paper-based registration logbooks of blood donors at the blood bank.
Recruitment of blood donors
All individuals who visited the blood bank centre or those who visited campaign sites to donate blood were first registered and then counselled by trained donor counsellors. The donors were required to be between the ages of 18 and 65 years and in good health and to have haemoglobin (Hb) levels greater than 12 g/dL and 13 g/dL for women and men, respectively, to rule out anaemia. The donors were required to weigh at least 45 kg and 50 kg for donations of 350 mm and 450 mm units, respectively. Donors should also be free of any sexually transmitted diseases such as the human immune virus, hepatitis B, hepatitis C, and syphilis and have normal vital signs (temperature 37°C, diastolic blood pressure 70–90 mmHg, and systolic blood pressure 100–150 mmHg).
The study was conducted in accordance with the Helsinki Declaration after a support letter was obtained from the ethical review board of the Institute of Health Sciences, Wallaga University. Permission was also obtained from the Nekemte Blood Bank head before data collection. All of the data were secured, protected, and accessed only by the investigators. Given that the study was a retrospective review of blood donor records, informed consent was not sought from the study participants.
Laboratory tests
Forward ABO blood phenotyping was performed using the slide method with known commercial antisera anti-A and anti-B (Mediclone, Mediclone Biotech, Chennai, India), and reverse blood grouping was performed with known 5% A and B cell suspensions that were prepared in the laboratory. The Rh group was determined using the test tube method by using anti-D reagents, and the Coombs test was performed to detect weak D antigens (Mediclone, Mediclone Biotech, Chennai, India). The ABO and Rh phenotypes of the blood donors were registered into the paper-based blood donor data management system.
Data collection procedure
Trained data collectors utilised a data collection sheet that was designed to collect the necessary data from the blood bank registration logbook that was kept at the blood bank centre. The donors’ age, sex, occupation, place of residence, and type of ABO and Rh blood groups were among the data obtained.
Data quality assurance
Data quality was assured by following standard operating procedures including double entry. Furthermore, a known blood sample was run to verify the quality of the reagents that were used for blood group phenotyping.
Statistical analyses
The data were checked for completeness, entered into EpiData version 4.6 (EpiData Association, Odense, Denmark), and exported to SPSS version 25 (IBM Corp., Armonk, NY, USA) for analysis. A descriptive statistical analysis was performed to determine the number and percentage distribution of categorical variables. Age was summarised as the median (interquartile range). A chi-square test was conducted to test for differences in ABO and Rh blood group phenotype distributions by age, sex, and residence of donors. A P-value less than 0.05 was considered statistically significant.
All blood donor details were de-identified in the analyses and the reports of the study findings. The reporting of this study conforms to strengthening the reporting of observational studies in epidemiology guidelines. 28
Results
A total of 14,887 study participants were included in the study. The median age of the study participants was 20 years (interquartile range = 18–30 years), with an age range between 18 and 65 years. Occupation-wise, 8,326 (55.9%), 5,098 (34.2%), 840 (5.6%), and 623 (4.3%) were students, civil servants, private workers, and others, respectively. Among the study participants, 9,191 (61.7%), 10,832 (72.8%), 9,126 (61.3%), and 8,326 (55.9%) were aged 18 to 24 years, males, East Wallaga zone residents, and students, respectively (Table 1).
Frequency and distribution pattern of ABO and Rh blood group phenotypes based on age, sex, and zone of residence (N = 14,887).
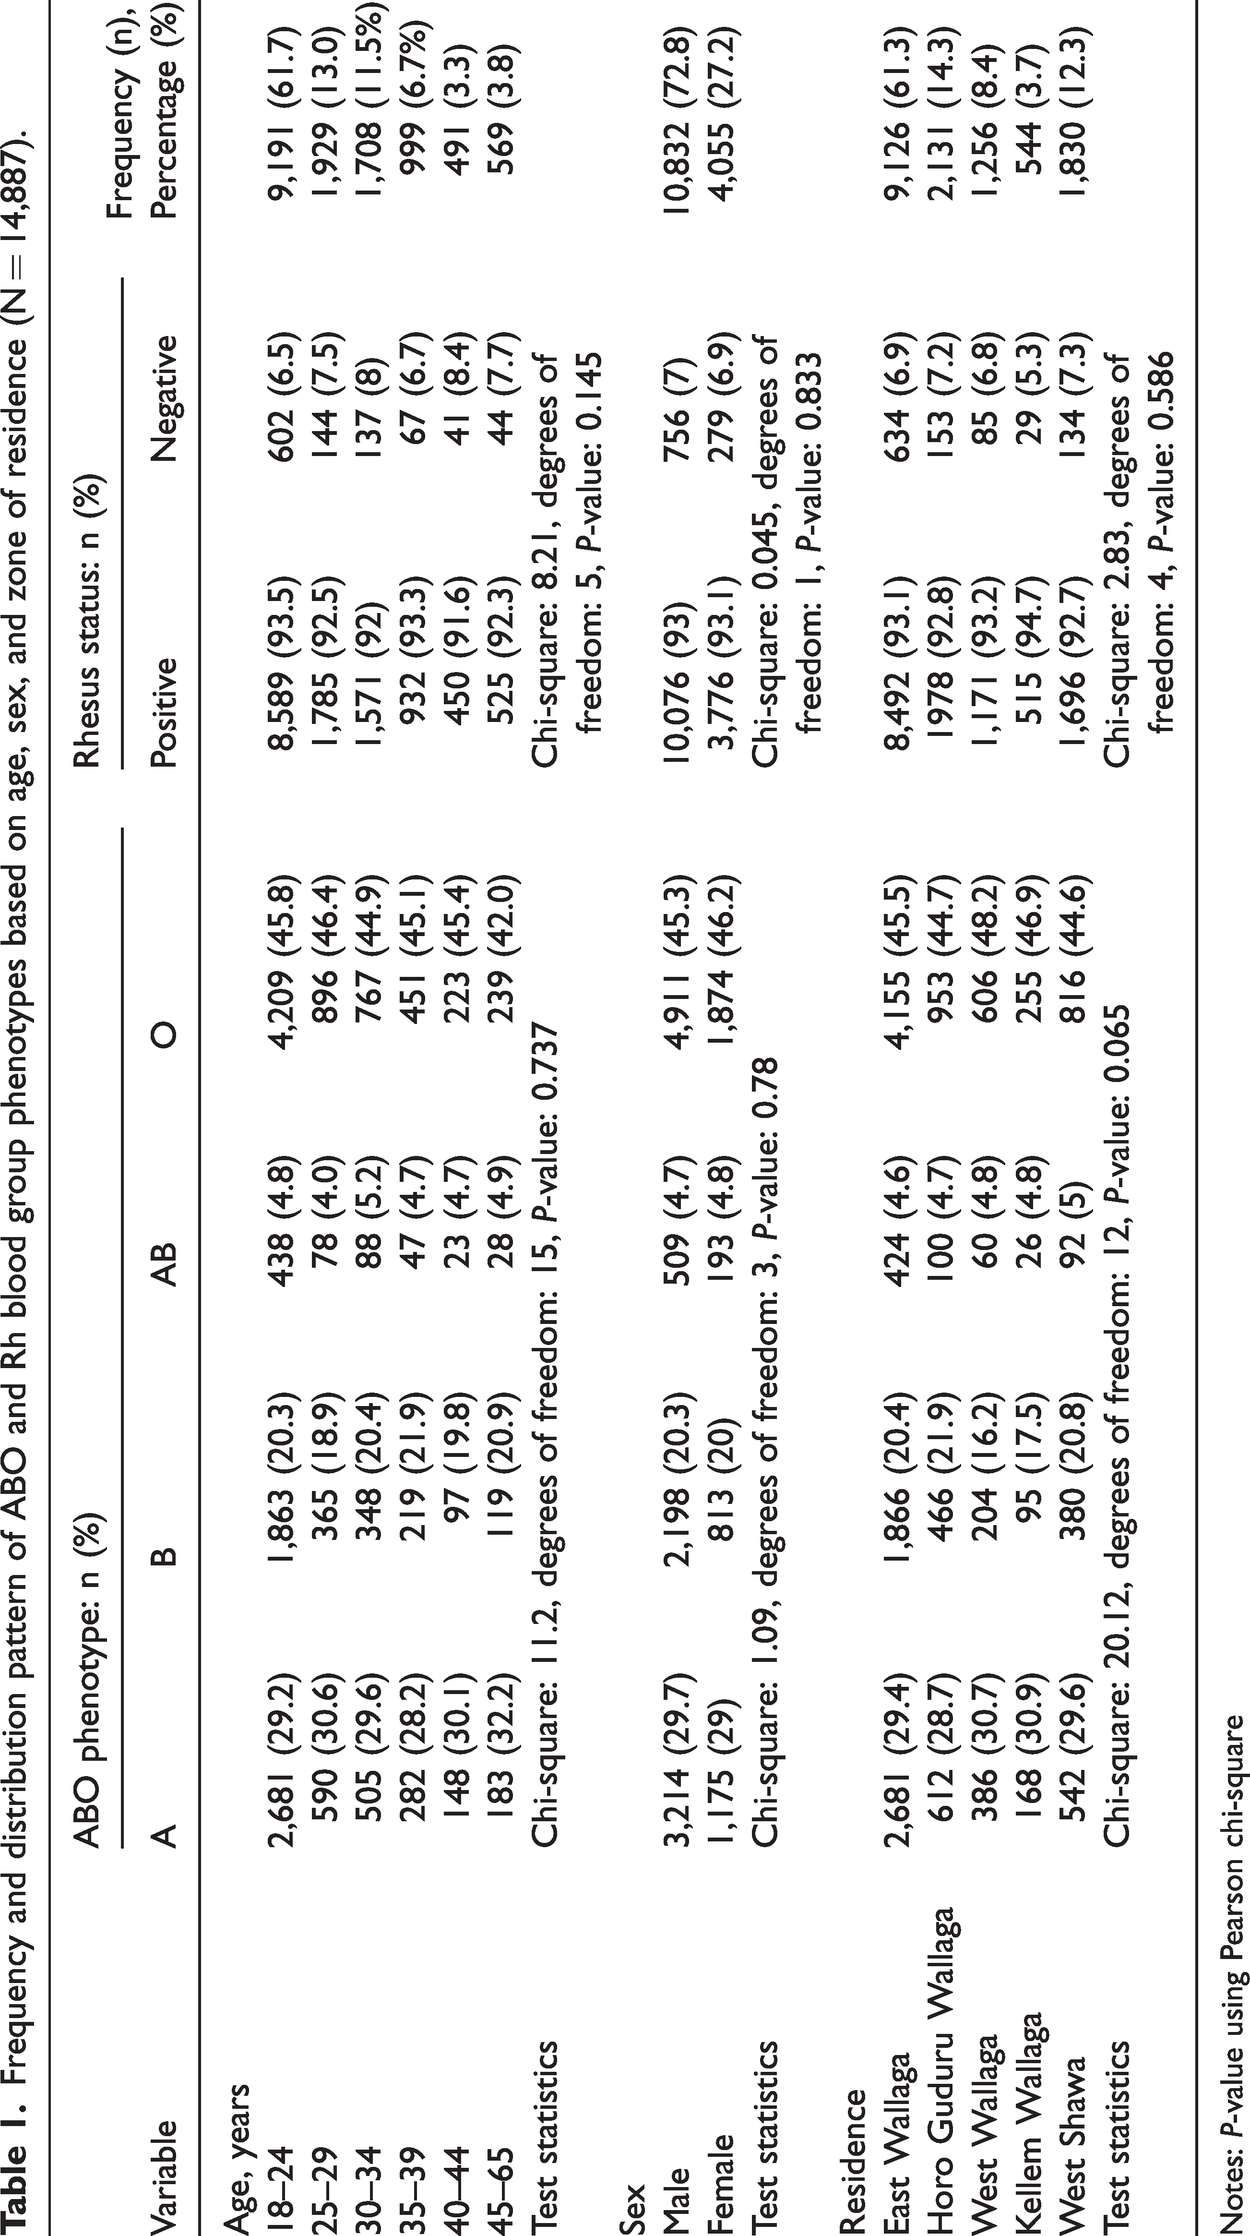
Notes: P-value using Pearson chi-square
Distribution of ABO and Rh (D) blood group phenotypes
Among the donors, no significant difference in ABO phenotype distribution was observed by age (chi-square [15, N = 14,887] = 11.2, P-value = 0.737), sex (chi-square [3, N = 14,887] = 1.09, P-value = 0.78), or residence (chi-square [12, N = 14,887] = 20.12, P-value = 0.065). Moreover, the distribution of the Rh phenotype did not differ statistically with age (chi-square [5, N = 14,887] = 8.21, P-value = 0.145), sex (chi-square [1, N =14,887] = 0.045, P-value = 0.833), or place of residence (chi-square [4, N = 14,887] = 2.83, P-value = 0.586; Table 1).
Among the study participants, 45.6%, 29.5%, 20.2%, and 4.7% had O, A, B, and AB phenotypes, respectively. Moreover, 93.0% and 7.0% were Rh (D)-positive and Rh (D)-negative, respectively. When ABO and Rh blood group phenotypes were combined, O positive (42.4%) was the dominant blood group, followed by A positive (27.4%), B positive (18.9%), AB positive (4.3%), O negative (3.2%), A negative (2.1%), B negative (1.3%), and AB negative (0.4%; Table 2).
Overall distribution of Rh (D) antigen per ABO blood group phenotype among study participants (N = 14,887).

Discussion
For the blood bank to effectively manage its inventory and support quick and safe blood transfusion services with an adequate supply of blood, knowledge of the distribution pattern of the ABO and Rh (D) blood groups in particular populations is essential.16,24,27 Therefore, this study aimed to determine the distribution pattern of ABO and Rh (D) blood group phenotypes among voluntary blood donors at the Nekemte Blood Bank, Oromia, West Ethiopia to provide baseline data for the transfusion community in the area.
This study showed that most of the donors (92.9%) belonged to younger age groups (< 40 years old). This finding is consistent with those of numerous studies conducted in Ethiopia,19,21,22 Uganda, 29 Tanzania,30,31 Madagascar, 32 and Saudi Arabia. 33 The motivation to donate blood among younger people has been linked to their physical fitness, mobility, and awareness level. 34 The fact that students represented the majority of the donors (55.7%) in this study suggests that this group was more likely to give blood. The fewest donors were in the > 45-year-old age group, possibly because older adults defer more frequently than young people. Chronic diseases are more common in older adults, which may explain why fewer older people donate blood. 34 Studies have indicated that deferral substantially increases as age increases because of abnormal blood pressure.35,36
In the current study, most of the blood donors were males (72.8%), consistent with the findings of studies that have been conducted in Ethiopia,19,21,22 Tanzania,30,31 Madagascar, 32 and India.37–39 During the donor selection process, the frequent failure of women to meet the required cut-off point of 12 gm/dL Hb for blood donation has been linked to the low percentage of female blood donors, and this failure is more common in countries of low socioeconomic status. 40 Several factors that contribute to these low Hb levels include the menstrual cycle, menorrhagia, prenatal iron deficiency anaemia, and postnatal blood loss.41,42 The other possible reason is the difference in blood donation practices between males and females. A battery of studies have claimed that women have poor blood donation practices compared with males.43–46
In the current study, the O blood group (45.6%) was the dominant ABO blood group, followed by the A, B, and AB blood groups (29.5%, 20.2%, and 4.7%, respectively), making the order of blood group prevalence O > A > B > AB. Similarly, findings within and outside Ethiopia support that the O blood group is the most dominant blood group phenotype, with the order O > A > B > AB; however, variations in the proportions of the various ABO phenotypes have been observed.18,19,21–25,31,47–50 Interestingly, a recent systematic review and meta-analysis that examined the possibility that a woman’s ABO status may influence her risk of developing pre-eclampsia found that women with the O blood type have a lower risk of the condition than those with non-O blood types. 51
Additionally, this investigation demonstrated that 7.0% and 93.0% of blood donors were Rh (D)-negative and Rh (D)-positive, respectively. This finding is consistent with those of studies in several parts of Ethiopia (Jigjiga, Addis Ababa, Gondar, Jimma, Arba Minch, Bahir Dar, and Debre Tabor) which showed a prevalence of the Rh (D)-negative phenotype between 4.4% and 8.5%.19,21,22,24,25,52,53 Golassa et al. reported a relatively increased (19.37%) Rh (D)-negative phenotype in the Gambella region of Ethiopia. 17 A study from Egypt, another African country, indicated that the prevalence of Rh (D)-negativity was roughly twice as high as in our study (14.4% vs. 7%). 54 According to a recent meta-analysis conducted in Ethiopia, the prevalence of the Rh (D)-negative blood group among pregnant women was 10.8%. 26
Strengths and limitations
In this study, many donors were analysed retrospectively, and only first-time blood donors were included—an important consideration for continuing to encourage blood donation by individuals. However, we were unable to further explore the ABO blood group subtypes.
Conclusion
This study revealed that blood group O was the most common ABO phenotype, followed by A, B, and AB. The vast majority (93.0%) of the donors were Rh (D)-positive, and a considerable share of the donations were from males and young donors. Therefore, further awareness creation and the establishment of donor recruitment and retention strategies are needed to help increase the amount of blood collected. These findings may help blood banks with blood transfusion programmes in their management of local blood transfusion services.
Footnotes
Acknowledgement
We are grateful to the staff of the Nekemte Blood Bank for their support during the data collection process.
Author contributions
Each author significantly contributed to the conception, design, execution, data collection, analysis, or interpretation of this published work. The final say on whether to submit the work for publication rests with the corresponding author, who had complete access to all of the study data.
Data availability statement
All of the data that were used or generated in this study are included in this article and are available from the corresponding author upon reasonable request.
Declaration of conflicting interests
The authors report no conflicts of interest regarding the publication of this paper.
Funding
This research received no specific grant from a funding agency in the public, commercial, or not-for-profit sectors.