
Abstract
Objectives
Hypertrophic cardiomyopathy (HCM), a leading cause of heart failure and sudden death, requires early diagnosis and treatment. This study investigated the underlying pathogenesis and explored potential diagnostic gene biomarkers for HCM.
Methods
Transcriptional profiles of myocardial tissues from patients with HCM (dataset GSE36961) were downloaded from the Gene Expression Omnibus database and subjected to bioinformatics analyses, including differentially expressed gene (DEG) identification, enrichment analyses, and protein–protein interaction (PPI) network analysis. Least absolute shrinkage and selection operator (LASSO) regression and support vector machine recursive feature elimination were performed to identify candidate diagnostic gene biomarkers. mRNA expression levels of candidate biomarkers were tested in an external dataset (GSE141910); area under the receiver operating characteristic curve (AUC) values were obtained to validate diagnostic efficacy.
Results
Overall, 156 DEGs (109 downregulated, 47 upregulated) were identified. Enrichment and PPI network analyses indicated that the DEGs were involved in biological functions and molecular pathways including inflammatory response, platelet activity, complement and coagulation cascades, extracellular matrix organization, phagosome, apoptosis, and VEGFA–VEGFR2 signaling. RASD1, CDC42EP4, MYH6, and FCN3 were identified as diagnostic biomarkers for HCM.
Conclusions
RASD1, CDC42EP4, MYH6, and FCN3 might be diagnostic gene biomarkers for HCM and can provide insights concerning HCM pathogenesis.
Keywords
Introduction
Hypertrophic cardiomyopathy (HCM) is a common monogenic hereditary disorder of the cardiac muscle primarily caused by mutations in genes encoding sarcomere proteins,1,2 with a prevalence of approximately 1 in 500 among the general population. 3 Multiple lines of evidence suggest that HCM onset and progression result from variants in β-myosin heavy chain (MYH7) and myosin-binding protein C (MYBPC3), 1 along with other risk factors. HCM is pathophysiologically characterized by excessive left ventricular hypertrophy, cardiac myocyte disorganization, and interstitial fibrosis; it can lead to multiple comorbidities, including diastolic dysfunction, left ventricular outflow obstruction, myocardial ischemia, malignant arrhythmias, mitral valve insufficiency, and sudden death, all of which have negative impacts on quality of life and socioeconomic status.4,5 Currently, HCM is a leading cause of heart failure and sudden death 6 ; thus, there is a need for early diagnosis and treatment, along with elucidation of the underlying mechanism. However, the complex genetic and microenvironmental factors underlying the pathogenesis of HCM remain unclear.
In this study, we integrated bioinformatics analyses and machine learning-based mining of public datasets to clarify the underlying pathogenesis and explore potential diagnostic gene biomarkers for HCM. We downloaded HCM microarray datasets from the Gene Expression Omnibus database, identified differentially expressed genes (DEGs), conducted enrichment and protein–protein interaction (PPI) network analyses, constructed least absolute shrinkage and selection operator (LASSO) and support vector machine recursive feature elimination (SVM-RFE) models to identify candidate diagnostic gene biomarkers, and validated their diagnostic efficacies by plotting receiver operating characteristic (ROC) curves and calculating the corresponding areas under the curve (AUCs) in an external dataset. To our knowledge, this is the first report to use machine learning-based comprehensive analyses of HCM in the identification of novel diagnostic biomarkers.
Methods
Dataset collection
Two datasets (GSE36961 and GSE141910) containing the transcriptome profiles of cardiac tissues from patients with HCM and control donors were downloaded from the Gene Expression Omnibus database (www.ncbi.nlm.nih.gov/geo).7,8 Such datasets have been used to analyze various cardiac diseases, such as calcified aortic valvular disease, idiopathic pulmonary arterial hypertension, and dilated cardiomyopathy.9–11 Example datasets for these diseases include GPL15389 (Illumina HumanHT-12 V3.0 expression beadchip platform) and GPL16791 (Illumina HiSeq 2500 platform, Homo sapiens). The training dataset GSE36961 (https://www.ncbi.nlm.nih.gov/geo/query/acc.cgi?acc=GSE36961) contained 106 samples of hypertrophic myocardium from patients with HCM who underwent therapeutic surgical ventricular septal myectomy and 39 control tissues from donor hearts without suitable transplant recipients. The test dataset GSE141910 (https://www.ncbi.nlm.nih.gov/geo/query/acc.cgi?acc=GSE141910) contained 28 hypertrophic myocardium samples and 166 control tissues.
DEG identification
After quality control, standardization, and identity transformation for GSE36961, we used the limma package 12 in R software to identify DEGs between patient and control tissue samples via comparison of gene expression profiles. The cut-off criteria for statistical significance were adjusted P-value <0.05 and |log2fold change (FC) | ≥1. DEGs were visualized in a volcano plot (all DEGs) and a heat map (top 50 up-/downregulated DEGs) using the packages ggplot2 (https://cran.r-project.org/web/packages/ggplot2/) and pheatmap, respectively, in R software.
Enrichment analyses of DEGs
Gene Ontology (GO)13,14 and Kyoto Encyclopedia of Genes and Genomes (KEGG)15,16 pathway enrichment analyses of DEGs were performed using the clusterProfiler package (http://www.bioconductor.org/packages/release/bioc/html/clusterProfiler.html) 17 in R software. Enrichment analysis results of GO categories (biological process [BP], cellular component [CC], and molecular function [MF]) were used to elucidate the molecular activity, cellular role, and functional distribution of each gene within the cellular environment. 18 KEGG enrichment analyses were performed in parallel to explore the metabolic or signaling pathways in which DEGs may be involved. To corroborate the analysis results, DEGs were also subjected to integrative enrichment analysis using the online tool Metascape 19 (https://metascape.org/gp/index.html#/main/step1). The statistical significance threshold was regarded as adjusted P < 0.05.
PPI network analysis
All DEGs were subjected to PPI network analysis using the following databases: STRING, 20 BioGrid, 21 OmniPath, 22 and InWeb_IM. 22 The resulting network contained the subset of DEGs that exhibit physical interactions with at least one other DEG identified in the study. The molecular complex detection (MCODE) algorithm 23 was used to identify closely connected network components with the following selection criteria: K-core = 2, degree cut-off = 2, max depth = 100, and node score cut-off = 0.2.
Candidate diagnostic biomarker screening
Two machine learning algorithms were used to identify candidate diagnostic biomarkers for HCM. The LASSO algorithm, a regression analysis model capable of feature selection, has been used to identify biomarkers for various diseases.24,25 The LASSO regression algorithm was implemented using the glmnet package in R software to identify candidate diagnostic biomarkers for distinguishing HCM and control samples. SVM-RFE is a supervised machine learning algorithm that combines a support vector machine approach with recursive feature elimination. It is a backward search algorithm that reduces spatial dimensionality by eliminating unnecessary features, enabling the identification of genes with greatest discriminative power and the classification of appropriate features. 26 The SVM-RFE algorithm was implemented using the e1071 package in R software. Subsequently, genes identified by the two machine learning algorithms were combined into a single group of candidate diagnostic biomarkers and validated using the test dataset (GSE141910).
Diagnostic efficacies of candidate biomarkers in HCM
To assess the accuracy and reliability of the candidate biomarkers in identifying HCM, box plots were constructed comparing mRNA expression levels in myocardial tissue from 28 HCM samples and 166 control samples in dataset GSE141910. To determine the HCM-specific predictive values of the identified biomarkers, ROC curves were plotted for both datasets (GSE36961 and GSE141910). AUCs were used to validate the diagnostic efficacies of these biomarkers for distinguishing HCM and control samples.
Results
DEG identification
In the training dataset GSE36961, there were 156 DEGs: 47 upregulated and 109 downregulated. All DEGs were visualized in a volcano plot (Figure 1a); the top 50 up-/downregulated DEGs were visualized in a heat map (Figure 1b).

Identification of HCM-related DEGs in GSE36961. (a) Volcano plot of the distributions of all DEGs in HCM compared with healthy controls: 47 upregulated genes (red dots) and 109 downregulated genes (green dots). |Log2FC| >1 and adjusted P < 0.05 were the cut-off criteria. (b) Heat map of top 100 DEGs in HCM compared with healthy controls. Con, healthy control; HCM, hypertrophic cardiomyopathy; DEG, differentially expressed gene; FC, fold change; Sig, significance; Up, upregulation; Not, non-significant difference; Down, downregulation.
Enrichment analyses of DEGs
To investigate the HCM-specific biological functions and pathways in which the 156 DEGs were involved, we conducted GO and KEGG pathway enrichment analyses. The top 10 terms in each category (BP, CC, and MF) were visualized in bubble diagrams (Figure 2a). The results of KEGG analysis are shown in Figure 2b. Detailed results of GO and KEGG analyses are presented in Supplementary Table 1. The BP terms showed that DEGs were mainly involved in regulation of response to external stimulus, inflammatory response, extracellular structure organization, regulation of myeloid cell differentiation, and platelet degranulation. The CC terms showed that DEGs were mainly involved in collagen-containing extracellular matrix, whereas the MF terms showed that DEGs were mainly involved in enzyme inhibitor activity, integrin binding, and collagen binding. The DEGs demonstrated considerable involvement in multiple signaling pathways, including complement and coagulation cascades, phagosome, apoptosis, and extracellular matrix–receptor interactions. In addition to the abovementioned terms, integrative enrichment analysis via Metascape showed that DEGs were involved in cellular response to lipid, regulation of cell death, and regulation of cell activation (Figure 2c–d and Supplementary Table 2).

Enrichment analyses for DEGs. (a–b) Partial visualization of GO and KEGG pathway enrichment analyses for DEGs, respectively. (c–d) Visualization of integrative enrichment analyses for DEGs via Metascape Online; bar graph and network show distributions and relationships of the different functions
PPI network analysis
The PPI network contained the subset of DEGs that exhibit physical interactions with at least one other DEG identified in this study. The MCODE networks are shown in Figure 3. MCODE1 (red module) included tubulin alpha 3c (TUBA3C), nuclear factor kappa B inhibitor alpha (NFKBIA), mitogen-activated protein kinase kinase kinase 14 (MAP3K14), signal transducer and activator of transcription 3 (STAT3), transketolase (TKT), integrin beta 2 (ITGB2), tropomyosin 3 (TPM3), and integrin alpha 5 (ITGA5). MCODE2 (blue module) included tissue inhibitor of metalloproteinases 1 (TIMP1), thrombospondin 1 (THBS1), coagulation factor XIII A chain (F13A1), plasminogen activator inhibitor 1 (SERPINE1), serglycin (SRGN), protein S (PROS1), and complement factor D (CFD). MCODE3 (green module) included MAF bZIP transcription factor B (MAFB); monocyte chemoattractant protein 1 (CCL2); and Fos proto-oncogene, AP-1 transcription factor subunit (FOS). Enrichment analyses were independently applied to each MCODE component; the three best-scoring terms (according to p-value) were retained as functional descriptions of the corresponding components (shown in Supplementary Table 3). The red and blue modules mainly participated in the vascular endothelial growth factor alpha (VEGFA)–vascular endothelial growth factor receptor 2 (VEGFR2) signaling pathway, apoptosis, phagosomes, platelet degranulation, response to elevated platelet cytosolic Ca2+, platelet activation, signal transduction, and aggregation.

PPI sub-network and MCODE showing main modules in the DEG list.
Identification and validation of diagnostic gene biomarkers
In terms of candidate diagnostic biomarkers for HCM, the LASSO regression algorithm identified 14 (Figure 4a) and the SVM-RFE algorithm identified 34 (Figure 4b). Five potential diagnostic biomarkers (Ras-related dexamethasone-induced 1 [RASD1], CDC42 effector protein 4 [CDC42EP4], myosin heavy chain 6 [MYH6], ficolin 3 [FCN3] and Iroquois homeobox 2 [IRX2]) (Figure 4c) were identified by both algorithms.

Screening of candidate diagnostic biomarkers for HCM. (a) Biomarker screening via LASSO model. (b) Biomarker screening via SVM-RFE algorithm. (c) Venn diagram showing five diagnostic biomarkers shared by the above two algorithms. LASSO, least absolute shrinkage and selection operator; SVM-RFE, support vector machine recursive feature elimination; RMSE, root mean square error.
We compared the mRNA expression levels of these potential biomarkers between HCM and control samples in GSE141910 (test dataset) and GSE36961 (training dataset) to assess their accuracy and reliability. The myocardial expression levels of RASD1, CDC42EP4, MYH6, and FCN3 were significantly lower in HCM samples than in control samples (Figure 5a–d and 5f–i; all P < 0.05); these trends were consistent in both datasets. However, the expression level of IRX2 was downregulated in GSE141910 (Figure 5e; P < 0.05) and upregulated in GSE36961 (Figure 5j; P < 0.05). Thus, the four downregulated genes (RASD1, CDC42EP4, MYH6, and FCN3) were regarded as biomarkers to establish logistic regression-based diagnostic models using the datasets GSE36961 and GSE141910.
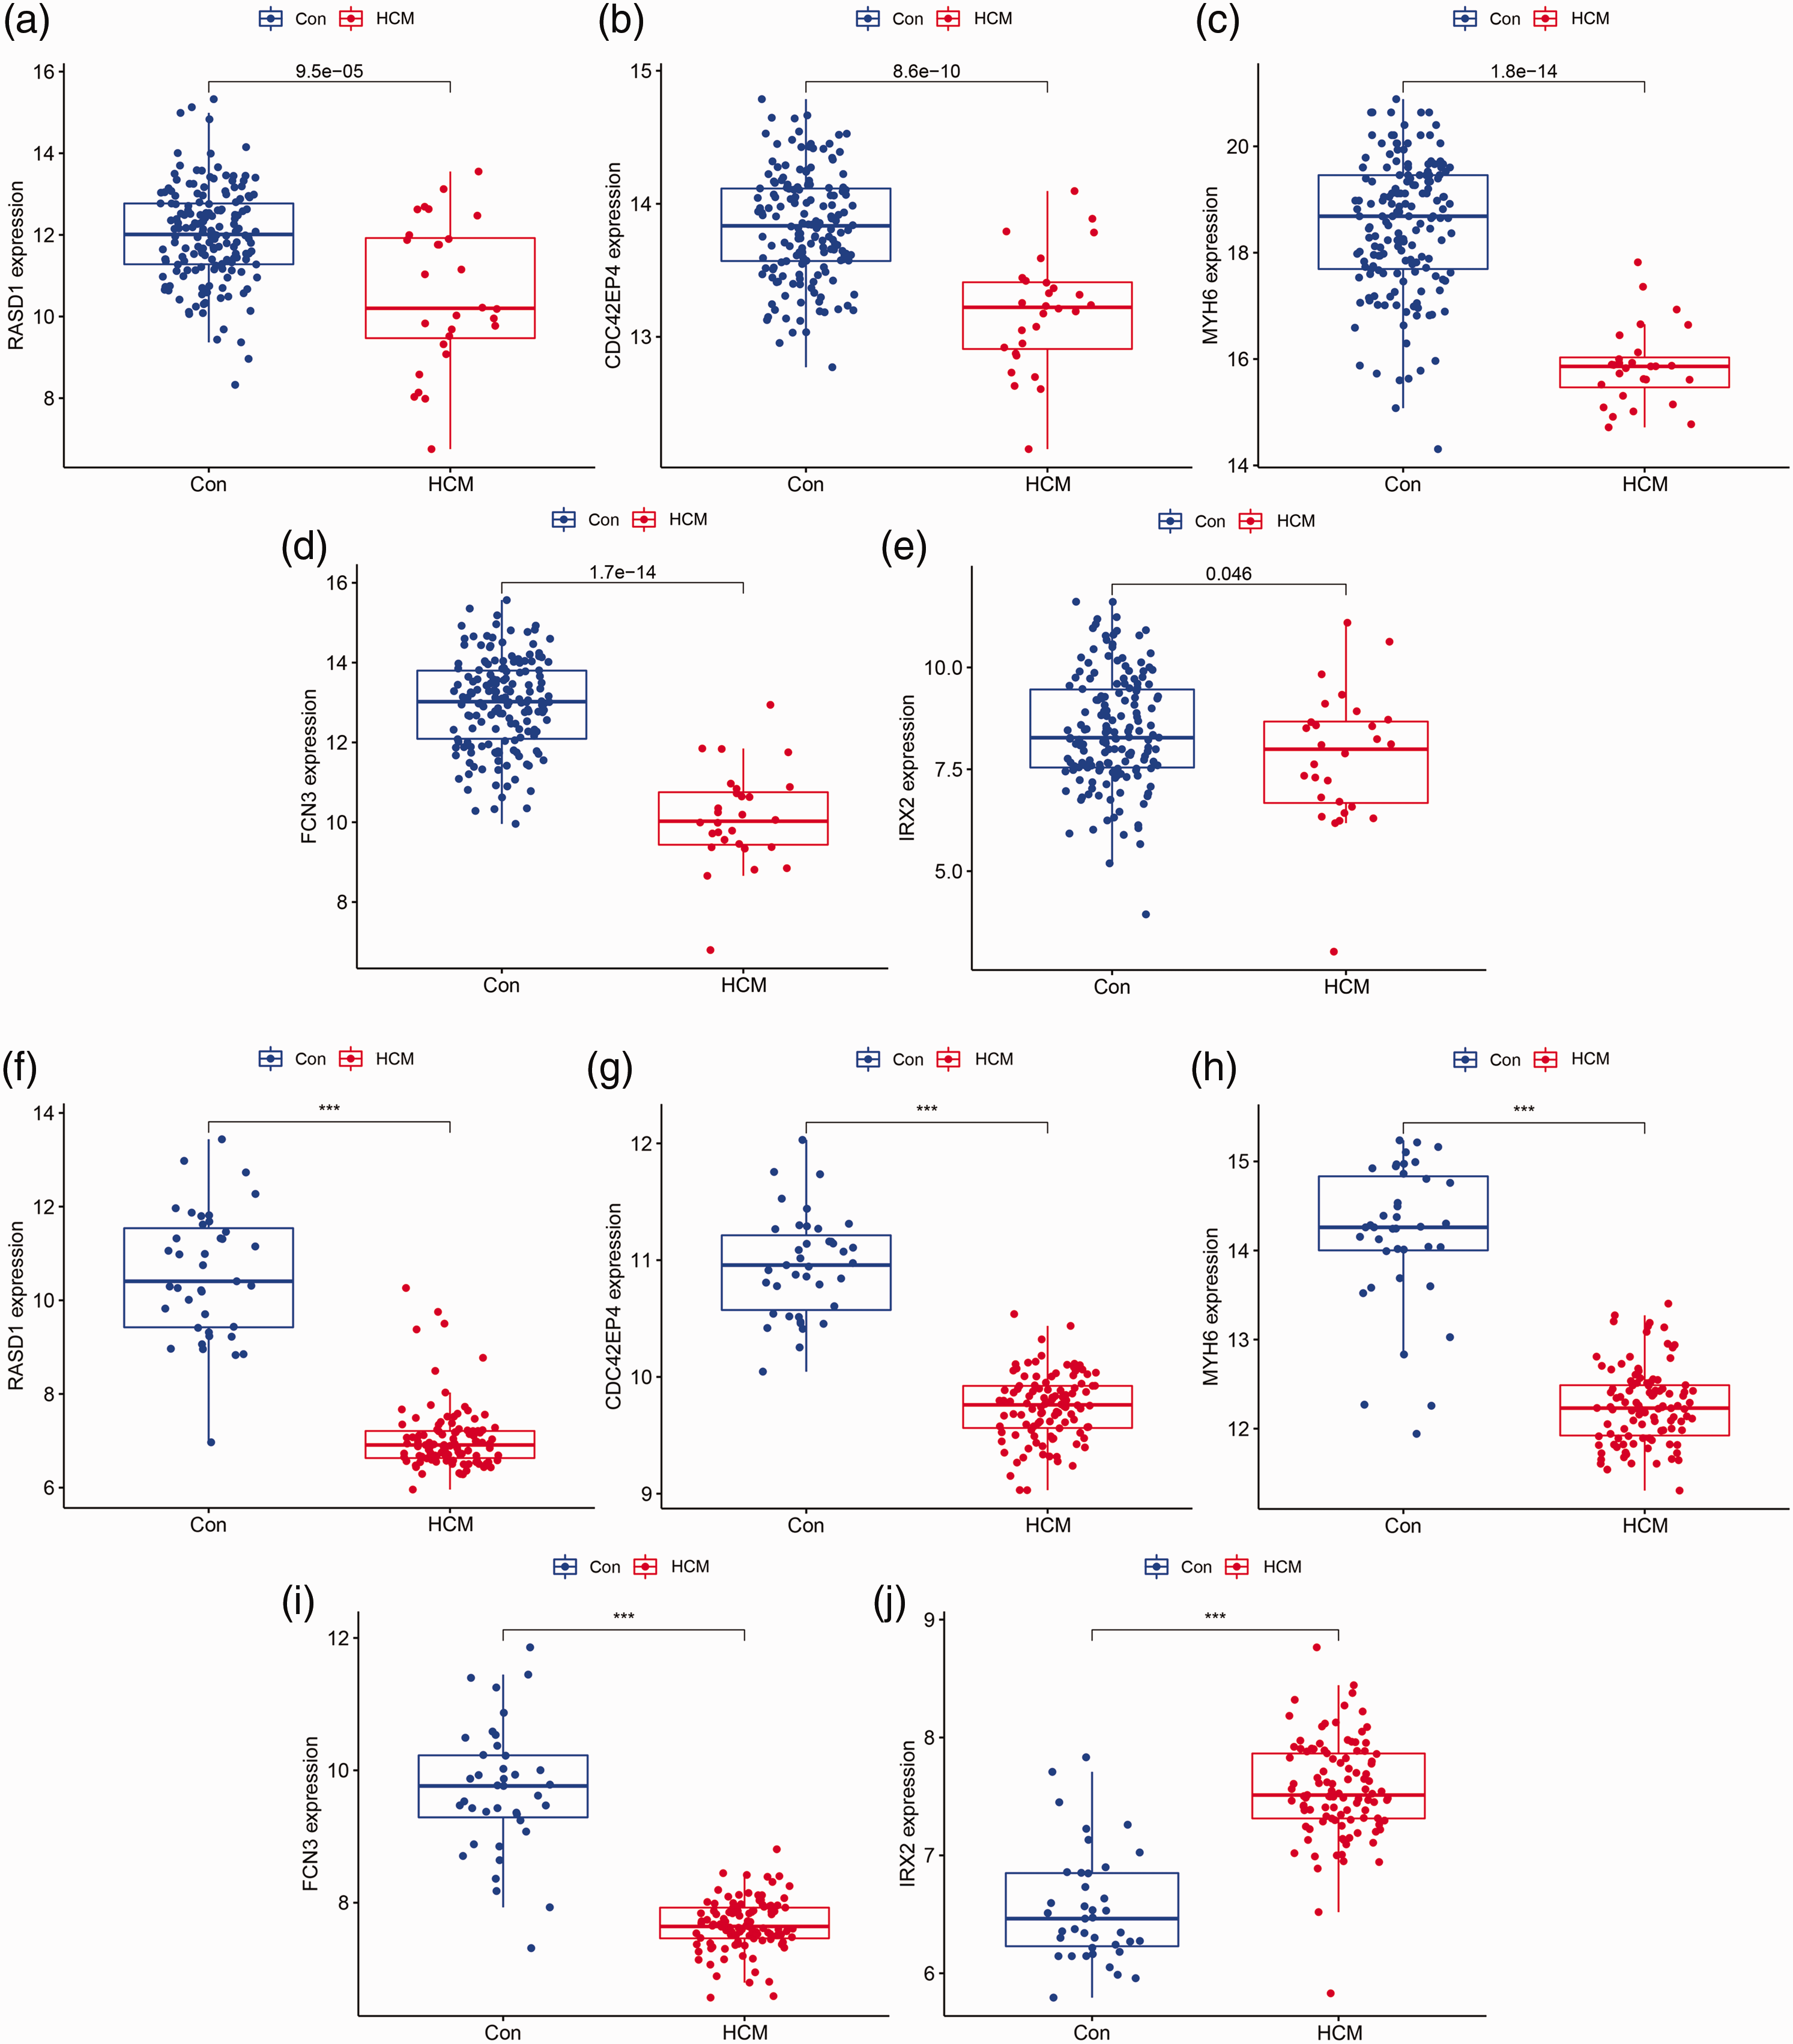
Validation of the expression patterns of five candidate diagnostic biomarkers in the GSE141910 and GSE36961 datasets. (a) RASD1 in GSE141910; (b) CDC42EP4 in GSE141910; (c) MYH6 in GSE141910; (d) FCN3 in GSE141910; (e) IRX2 in GSE141910; (f) RASD1 in GSE36961; (g) CDC42EP4 in GSE36961; (h) MYH6 in GSE36961; (i) FCN3 in GSE36961 and (j) IRX2 in GSE36961. Con, healthy control; HCM, hypertrophic cardiomyopathy; RASD1, Ras-related dexamethasone-induced 1; CDC42EP4, CDC42 effector protein 4; MYH6, myosin heavy chain 6; FCN3, ficolin 3; IRX2, Iroquois homeobox 2.
Diagnostic efficacies of candidate biomarkers in HCM
In the training dataset GSE36961, the diagnostic efficacies of the identified candidate biomarkers (RASD1, CDC42EP4, MYH6 and FCN3) for distinguishing HCM and control samples showed good predictive value with AUCs of 0.978 (95% CI 0.949–0.997) in RASD1, 0.993 (95% CI 0.982–1.000) in CDC42EP4, 0.954 (95% CI 0.902–0.994) in MYH6, and 0.968 (95% CI 0.913–0.999) in FCN3 (Figure 6a–d). In the test dataset GSE141910, the diagnostic efficacies also showed good predictive value with AUCs of 0.710 (95% CI 0.588–0.820) in RASD1, 0.828 (95% CI 0.721–0.910) in CDC42EP4, 0.920 (95% CI 0.838–0.975) in MYH6, and 0.922 (95% CI 0.845–0.978) in FCN3 (Figure 7a–d).

ROC curves of the diagnostic efficacies of the four diagnostic biomarkers in the GSE36961 dataset. (a) RASD1; (b) CDC42EP4; (c) MYH6 and (d) FCN3. ROC, receiver operating characteristic; RASD1, Ras-related dexamethasone-induced 1; CDC42EP4, CDC42 effector protein 4; MYH6, myosin heavy chain 6; FCN3, ficolin 3; IRX2, Iroquois homeobox 2.
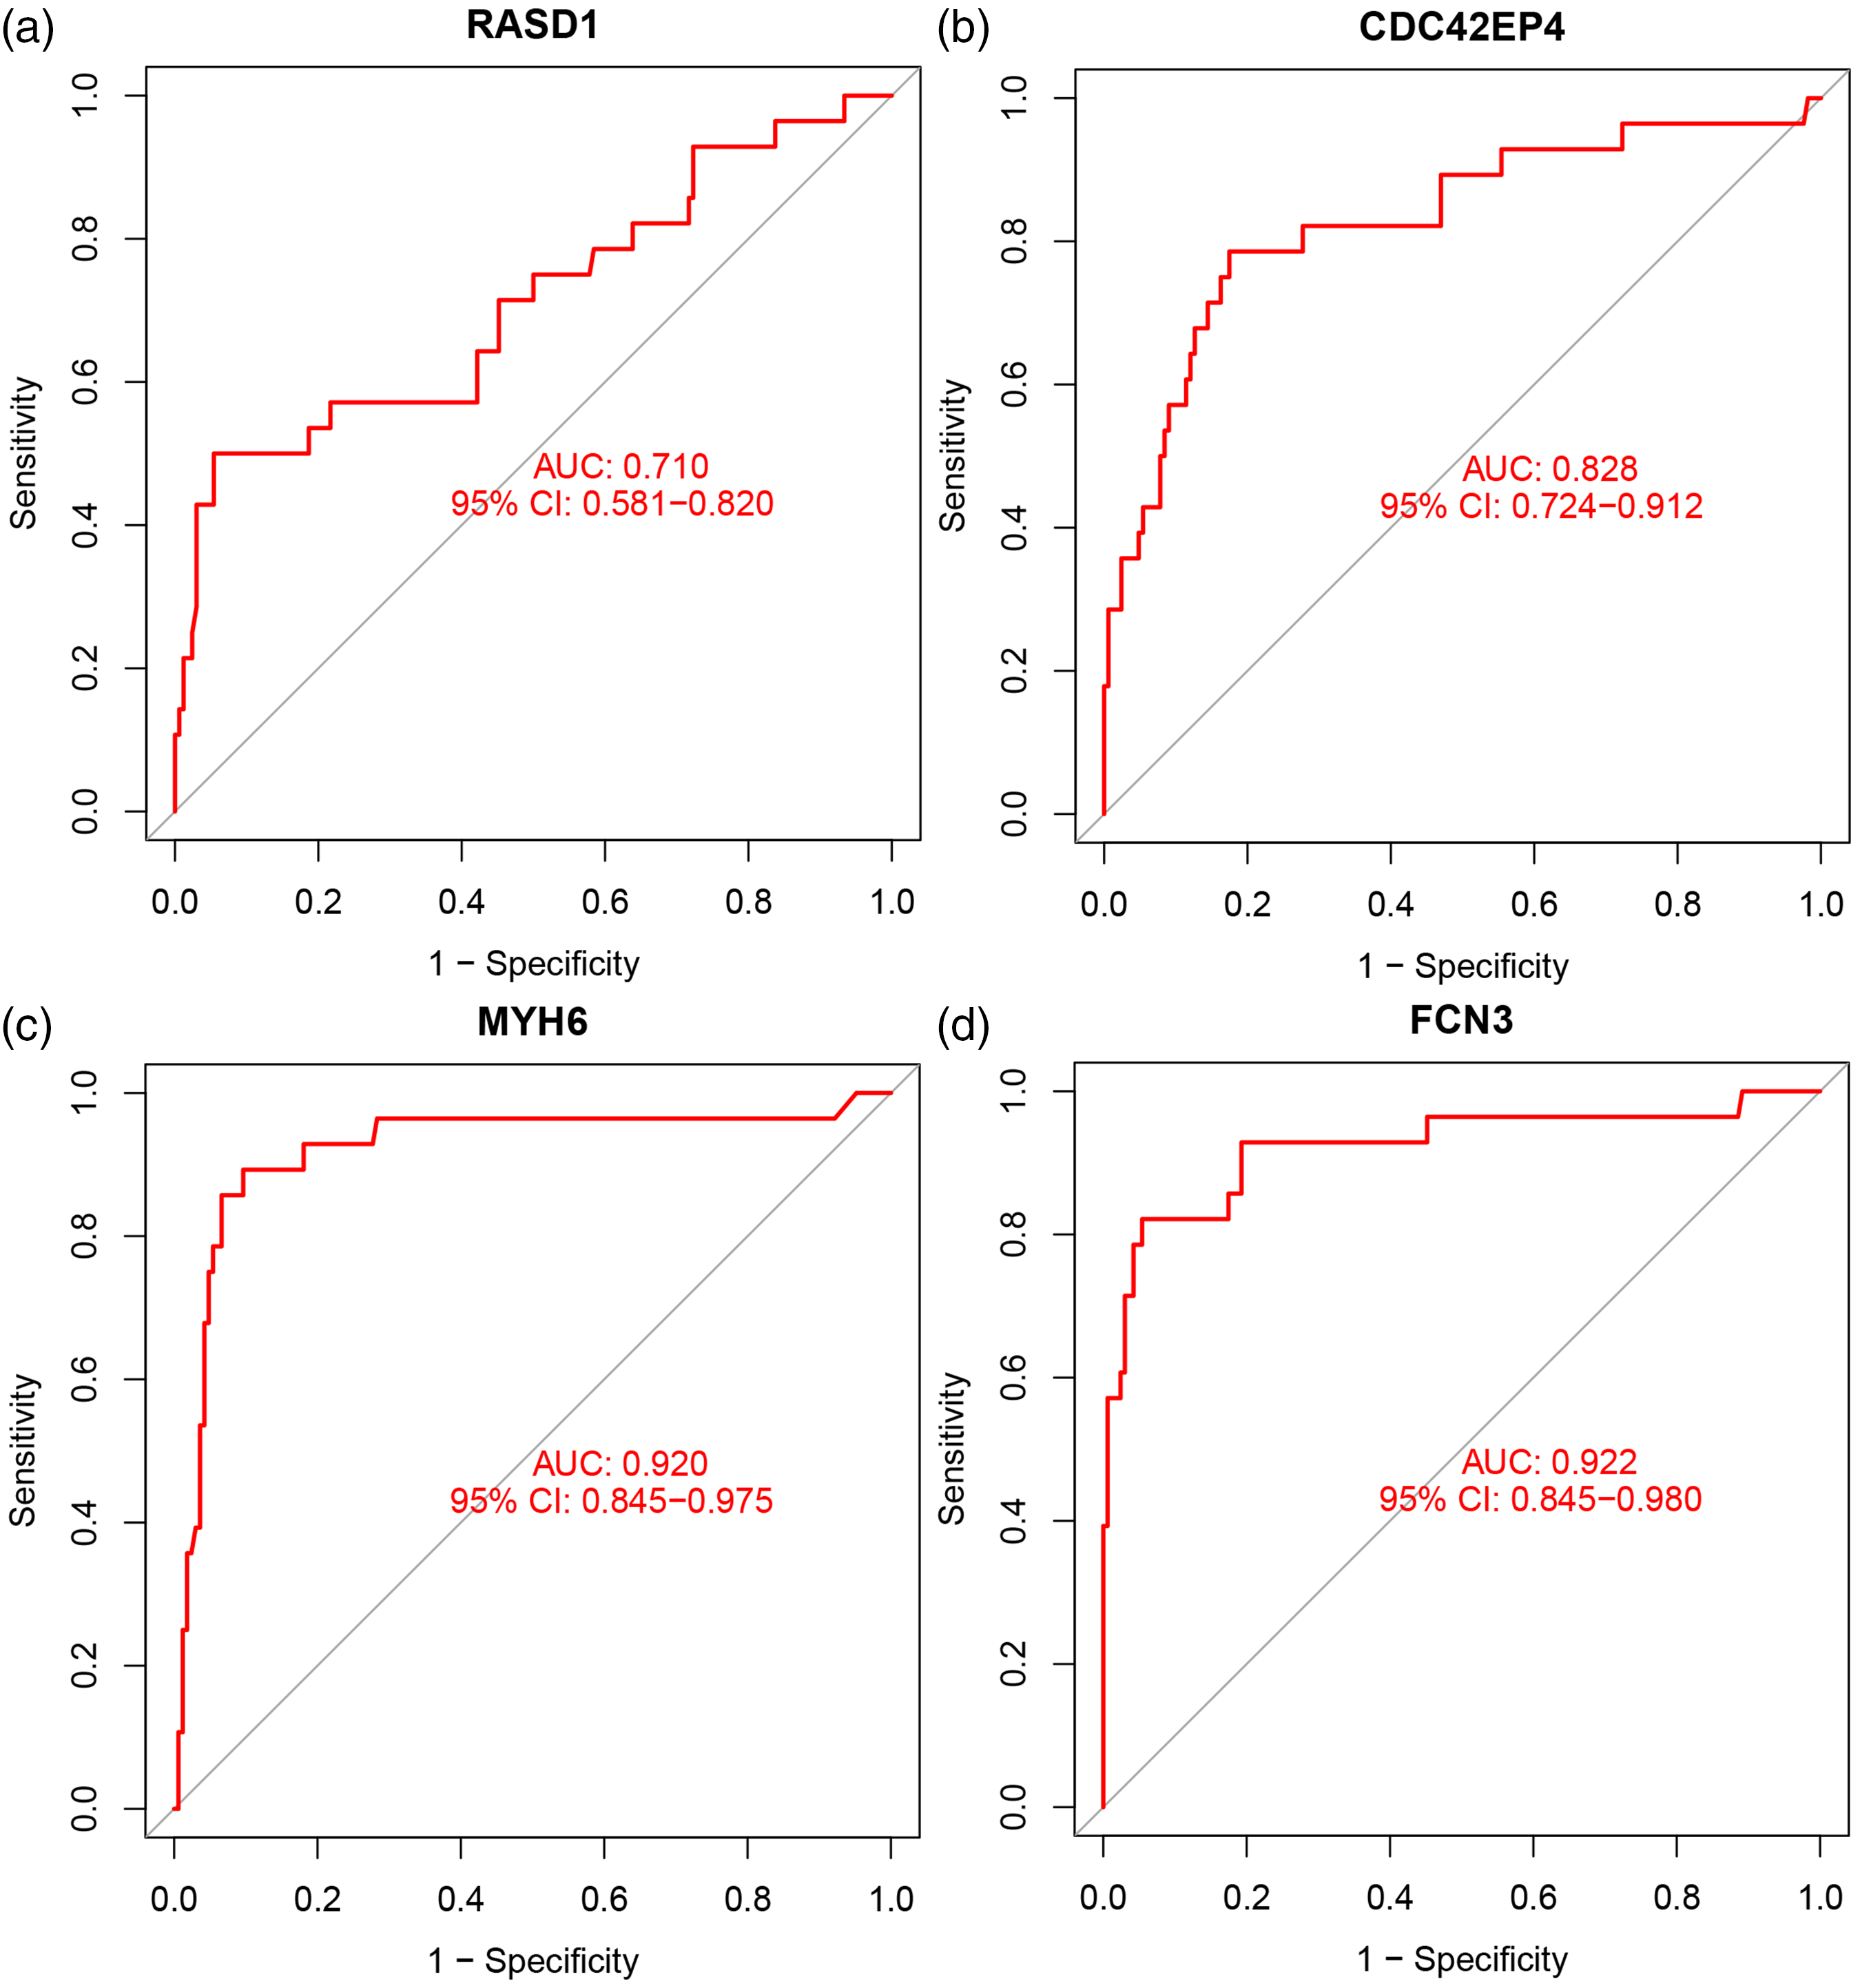
ROC curves of the diagnostic efficacies of the four diagnostic biomarkers in the GSE141910 dataset. (a) RASD1; (b) CDC42EP4; (c) MYH6; (d) FCN3. ROC, receiver operating characteristic; RASD1, Ras-related dexamethasone-induced 1; CDC42EP4, CDC42 effector protein 4; MYH6, myosin heavy chain 6; FCN3, ficolin 3; IRX2, Iroquois homeobox 2.
Discussion
HCM is a particularly complex and heterogeneous genetic disorder. 27 The results of previous studies have suggested that variants in myosin heavy chain 7 (MYH7) and cardiac myosin-binding protein C (MYBPC3) are the main causes of HCM, contributing to 60% to 70% of known cases. 28 The HCM phenotype is also influenced by variants in other sarcomere proteins, such as troponin T2, cardiac type (TNNT2); troponin I3, cardiac type (TNNI3); TPM1; myosin light chain 2 (MYL2); actin alpha cardiac muscle 1 (ACTC1); and troponin C1, slow skeletal and cardiac type (TNNC1). 27 There is increasing evidence that the immune system may play important roles in the onset or progression of HCM. 29 Overall, HCM is a complex disease mediated by genetic and environmental factors; there remains a lack of clarity concerning the specific factors that contribute to the pathogenesis of HCM. In this study, we integrated bioinformatics analyses and machine learning-based mining of public datasets to identify novel diagnostic gene biomarkers and explore their roles in HCM.
We identified HCM-specific DEGs for HCM and conducted enrichment analyses to elucidate their roles in the disease process. There is evidence that the immune system plays key roles in the development of various cardiovascular diseases (e.g., myocardial infarction, cardiomyopathy, and hypertension), which have been recognized as chronic inflammatory conditions. 30 The immune system participates in tissue repair and remodeling after myocardial injury; it also mediates or exacerbates potentially harmful inflammatory reactions. 31 Endomyocardial tissues from patients with HCM exhibit substantial inflammatory cell infiltration and myocardial fibrosis, with elevated levels of interleukins (ILs; IL-1β, IL-1RA, IL-6, IL-10) and high-sensitivity C-reactive protein, as well as activated nuclear factor kappa B signaling. 29 Tissue-level inflammation involving leukocyte-derived extracellular traps also contributes to phenotypic variability in HCM. 32 In the present study, HCM-related DEGs were extensively involved in biological processes including response to external stimuli, inflammatory response, and regulation of myeloid cell differentiation. These results are consistent with previous findings that immune responses participate in the pathogenesis of HCM. Low-grade inflammation and inflammatory cytokines (e.g., tumor necrosis factor-α and IL-6) can directly attenuate myocardial contractility and potentiate the progression of HCM, collagen deposition, and myocardial fibrosis. 33 Our enrichment analyses demonstrated that HCM-related DEGs involved cellular components (collagen-containing extracellular matrix), molecular functions (collagen binding), and extracellular matrix–receptor interactions, consistent with previous studies. In particular, one phenotype of HCM is characterized by increased thrombogenesis.34,35 Our enrichment and PPI network analyses indicated that HCM-related DEGs participated in platelet degranulation, response to elevated platelet cytosolic Ca2+, platelet activation, signal transduction, aggregation, and complement and coagulation cascades; these pathways might be essential for the activation of platelet, complement, and coagulation systems, as well as subsequent thromboembolic events. 36
Phagosomes are generated by various phagocytic processes, most prominently including autophagy; this lysosome-mediated degradation process plays an essential role in maintaining cellular homeostasis through the removal of cellular debris and damaged organelles. Notably, lysosomal dysfunction and enzymatic deficiency can cause lysosomal storage disorders, including cardiomyopathy. 37 Although several omics analyses have indicated that phagosomes have critical roles in the pathogenesis of HCM,38–40 few reports have investigated the underlying mechanisms. Inna et al. identified the Yes-associated protein (YAP)/transcription factor EB (TFEB) signaling pathway as a key regulator of autophagosomes, with potential therapeutic applications in lysosome-associated disorders. 37 The present study revealed that HCM-related DEGs were enriched in the phagosome and YAP–TFEB pathways; these findings merit further investigation. The autophagic lysosome system functions in tandem with the ubiquitin proteasome system (UPS) to remove aggregates of aberrant proteins and damaged organelles; these systems play pivotal roles in apoptosis.41–43 In cardiac hypertrophy, the increases in protein synthesis and ubiquitinated protein accumulation indicate dysregulation of the UPS. 44 There is evidence that the overexpression of UPS components can suppress cardiac hypertrophy.45,46 In the present study, apoptosis was one of the top signaling pathways mediated by HCM-related DEGs; enzymes involved in UPS could serve as therapeutic targets that enhance the degradation of harmful proteins in HCM.
In addition, integrative enrichment analysis showed that HCM-related DEGs are involved in the cellular response to lipids. HCM is reportedly associated with excessive lipid accumulation.47,48 Furthermore, decreased expression of adipose triglyceride lipase, an enzyme that catalyzes cardiac triacylglycerols, contributes to HCM by reducing peroxisome proliferator-activated receptor α (PPARα) activity and enhancing fatty acid oxidation. 49 Conversely, inhibition of a lipid kinase, FYVE-type zinc finger containing phosphoinositide kinase (PIKfyve), by the selective inhibitor apilimod could attenuate cardiac hypertrophy. 50 The above evidence suggests that improvements to lipid metabolism could be useful in the treatment of HCM.
We performed PPI network analysis to more fully elucidate the functions of HCM-related DEGs; most of the findings were consistent with the results of enrichment analyses via GO, KEGG, and Metascape. We found that the VEGFA–VEGFR2 signaling pathway was involved in HCM. VEGFA is associated with angiogenic invasion. 51 Alkon and colleagues reported that VEGFA downregulation was associated with more severe hypertrophy and worse diastolic function in HCM. 52 Pieles et al. also found that a risk allele in the VEGF pathway was associated with left ventricular regional myocardial deformation among patients with HCM. 53 These results would implied that VEGFA could be used as a genetic marker for risk prediction in HCM.
LASSO and SVM-RFE are commonly used machine learning algorithms that have been extensively applied to the selection of biomarkers for various cardiovascular diseases.54,55 Here, we used them to identify potential diagnostic biomarkers among HCM-related DEGs. Ultimately, we identified a set of genes that could serve as diagnostic biomarkers for HCM, based on consistent expression patterns in both training and test datasets: RASD1, CDC42EP4, MYH6, and FCN3. All four genes showed excellent diagnostic efficacies in HCM, according to ROC curve analysis. RASD1 is a monomeric protein expressed at low concentrations in cardiac tissue. 56 Notably, the level of RASD1 was significantly downregulated in volume-overloaded atria, and RASD1 knockdown in atrium-derived cells led to a substantial increase in atrial natriuretic factor expression.57,58 In the present work, we found that RASD1 was decreased in HCM. Thus far, few studies have investigated the relationship between RASD1 and HCM. However, patients with HCM exhibit progressive diastolic and systolic dysfunction, ultimately accompanied by volume overload. 59 Atrial natriuretic factor is an important complementary hormonal system, which is activated to reduce volume load during the development of heart failure. 60 These findings might explain the diagnostic efficacy of RASD1 in HCM; the underlying mechanisms should be further investigated in basic and clinical studies.
Among the three other diagnostic biomarkers, FCN3 is a potent activator of the lectin-based complement pathway. 61 Although there is limited literature regarding direct interactions between FCN3 and HCM, Li et al. reported that FCN3 was a reliable biomarker of heart failure. 62 Another study showed that a low FCN3 level was associated with advanced heart failure and prognosis, as well as increased complement activation. 63 Moreover, FCN3 has been identified as an ischemic cardiomyopathy-specific gene. 64 We found that FCN3 was downregulated in HCM; it also showed good diagnostic efficacy in HCM. The pathophysiology of heart failure and the HCM-specific immune–inflammatory mechanism may be the links between FCN3 and HCM. Concerning MYH6, specific mutations have been recognized as pathogenic variants in HCM.65–70 However, there has been limited evidence regarding their pathogenicity. Fang et al. reported that elevated levels of cyclic adenosine monophosphate mediated the pathogenicity of MYH6. 71 In an animal model of HCM, MYH6 was silenced by activation of the BRG1–G9a/glucagon-like peptide-1 (GLP)–DNA methyltransferase 3 (DNMT3) complex. 72 Conversely, the silencing of mutant MYH6 suppressed hypertrophy and myocardial fibrosis. 73 In the present study, MYH6 was downregulated and exhibited diagnostic efficacy in HCM. Some researchers have reported that indexes such as the MYH7/MYH6 ratio could be useful diagnostic approaches. 74 MYH6 merits further study and could serve as a therapeutic target. Finally, we found that CDC42EP4 was a good biomarker of HCM with a high AUC. However, CDC42EP4 is exclusively expressed in brain tissue. 75 Thus, considerable effort is needed to identify the link between CDC42EP4 and HCM.
A key objective of identifying predictive gene biomarkers for HCM is improved diagnostic efficacy. The four biomarkers in this study showed excellent diagnostic efficacies in HCM. Furthermore, advanced imaging analysis technology has been developed to increase diagnostic capacity, such as sub-voxel-level anatomical modeling and extraction of patient-specific parameters. The rate of accurate HCM diagnosis might be further improved by combining molecular and imaging methods.76,77 A related objective is the identification of HCM-specific therapeutic targets—the four biomarkers detected in this study could meet this criterion. Additionally, molecules such as RASD1 and FCN3 are associated with immunity and inflammation, suggesting that treatments based on immune–inflammatory mechanisms could improve HCM prognosis. 78
A particularly strength of the present study is that it determined the specific diagnostic efficacies of the novel biomarkers via ROC curve analysis. Although previous studies also showed differential expression patterns of key genes, those trends were not accurate. 79 In contrast, we reported the AUC of each biomarker, enhancing accuracy and reliability. Furthermore, most previous studies used a simple machine learning algorithm to identify biomarkers. The current study integrated the results of two methods, which is a more robust approach. To our knowledge, this type of analytical strategy has not been used in HCM research.
This study had some limitations. First, it solely relied on publicly available databases and did not include experimental validation of the identified biomarkers in clinical samples. Although it can be challenging to obtain HCM samples, we acknowledge the importance of future efforts to obtain clinical samples, which can be used for experimental validation to determine the true diagnostic efficacies of the identified biomarkers. However, biomarker tests are becoming easier through the rapid development of next-generation sequencing technologies and cardiovascular interventional treatments. 80 Second, the imbalance in number of positive cases between the training and test datasets may have influenced the performances of the identified biomarkers. The training dataset contained a larger proportion of positive cases (73%) compared with the test dataset, in which only 14% of cases were positive. This imbalance may have led to overfitting or differences in data distribution. Consequently, the high AUCs in the training dataset and substantially lower AUCs for RASD1 and CDC42EP4 in the test dataset could be related to this imbalance. Future studies should consider the limitations of data imbalances in the test dataset; alternative strategies (e.g., oversampling or undersampling techniques) and the use of additional independent test datasets could address these limitations and enhance the reliability of the findings. Finally, the candidate biomarker genes were selected based on the intersection of candidate genes identified by LASSO and SVM-RFE machine learning algorithms applied to DEGs. Although these algorithms are commonly used for feature selection, they are not exempt from false positive or false negative results. Therefore, further validation with additional independent datasets or functional studies is needed to confirm the roles of these genes in HCM.
Conclusions
RASD1, CDC42EP4, MYH6, and FCN3 can serve as diagnostic gene biomarkers for HCM and might yield new insights regarding its underlying pathogenesis.
Supplemental Material
sj-pdf-1-imr-10.1177_03000605231213781 - Supplemental material for Prediction of diagnostic gene biomarkers for hypertrophic cardiomyopathy by integrated machine learning
Supplemental material, sj-pdf-1-imr-10.1177_03000605231213781 for Prediction of diagnostic gene biomarkers for hypertrophic cardiomyopathy by integrated machine learning by Hongjun You and Mengya Dong in Journal of International Medical Research
Supplemental Material
sj-pdf-2-imr-10.1177_03000605231213781 - Supplemental material for Prediction of diagnostic gene biomarkers for hypertrophic cardiomyopathy by integrated machine learning
Supplemental material, sj-pdf-2-imr-10.1177_03000605231213781 for Prediction of diagnostic gene biomarkers for hypertrophic cardiomyopathy by integrated machine learning by Hongjun You and Mengya Dong in Journal of International Medical Research
Supplemental Material
sj-pdf-3-imr-10.1177_03000605231213781 - Supplemental material for Prediction of diagnostic gene biomarkers for hypertrophic cardiomyopathy by integrated machine learning
Supplemental material, sj-pdf-3-imr-10.1177_03000605231213781 for Prediction of diagnostic gene biomarkers for hypertrophic cardiomyopathy by integrated machine learning by Hongjun You and Mengya Dong in Journal of International Medical Research
Footnotes
Author contributions
(I) Conception and design: All authors; (II) Administrative support: All authors; (III) Provision of study materials or patients: All authors; (IV) Collection and assembly of data: All authors; (V) Data analysis and interpretation: All authors; (VI) Manuscript writing: All authors; (VII) Final approval of manuscript: All authors.
Data availability
The data are public and can be downloaded from the Gene Expression Omnibus database (GSE36961 and GSE141910).
Declaration of conflicting interests
The authors declare that there is no conflict of interest.
Funding
This research received no specific grant from any funding agency in the public, commercial, or not-for-profit sectors.
Supplementary Materials
References
Supplementary Material
Please find the following supplemental material available below.
For Open Access articles published under a Creative Commons License, all supplemental material carries the same license as the article it is associated with.
For non-Open Access articles published, all supplemental material carries a non-exclusive license, and permission requests for re-use of supplemental material or any part of supplemental material shall be sent directly to the copyright owner as specified in the copyright notice associated with the article.