
Abstract
Objective
To determine and compare the mean maternal serum leptin levels, the prevalence of high serum leptin levels and mean gestational weight gain at term among obese and non-obese pregnant women in Enugu, Nigeria.
Methods
This cross-sectional comparative study enrolled obese and non-obese pregnant women. The serum leptin levels of the women were determined using an enzyme-linked immunosorbent assay kit. Anthropometric and sociodemographic data were obtained and compared. Mean weight gain during pregnancy was determined.
Results
A total of 170 pregnant women were included in the study. The mean ± SD serum leptin level (99.39 ± 50.2 ng/ml) and the prevalence of hyperleptinaemia (81 of 85 patients; 95.3%) among the obese pregnant women at term were significantly higher than those of the non-obese pregnant women (48.98 ± 30.35 ng/ml/65 of 85 patients; 76.5%). The mean percentage weight gain was significantly higher in the non-obese women compared with the obese women at term. The predictors of high maternal serum leptin level at term among the participants were the employment status and levels of education of the participants.
Conclusion
Maternal serum leptin level, maternal weight gain and prevalence of hyperleptinaemia at term were significantly higher in the obese compared with the non-obese pregnant women.
Introduction
Non-communicable diseases are now becoming common among populations in many countries worldwide. 1 Overweight and obesity, which used to be diseases observed mainly in Western countries, are now becoming emerging diseases in medium and low-income countries. 2 Busy work schedules, the sedentary nature of some jobs, a lack of time and motivation for physical exercise and poor eating habits contribute greatly to the current prevalence of overweight and obesity among different populations globally.1,2
Obesity is an emerging disease in Africa and has affected the female population, especially those in the reproductive age group.3,4 The growing incidence of childhood obesity that progresses to obesity in the reproductive age has been on the rise in developing countries especially those in Africa.4,5 Obese women are now seen among reproductive-aged women in Africa and these women become pregnant. 4 Obesity in pregnancy is associated with morbidities and mortality globally; and it is now important among reproductive-aged women in developing countries.1,2
Obesity is defined as abnormal or excessive fat accumulation that may impair health. 5 Using the body mass index (BMI), obesity is defined as a BMI 30.0–39.9 kg/m2, while overweight is defined as a BMI 25.0–29.9 kg/m2.4,6 Obesity is essentially caused by an imbalance in calories consumed and those expended.7,8 The composition of the diet eaten by people determines the number of calories provided by the food. 9 Obesity and overweight are major risk factors for some non-communicable diseases such as diabetes mellitus, cardiovascular diseases (heart disease and stroke), musculoskeletal disorders (osteoarthritis) and some cancers (endometrial, breast cancer).
Maternal weight gain in pregnancy results from increasing fetal weight, increased secretion of amniotic fluid and increased weight of maternal organs; and at term, a woman of normal weight prior to pregnancy would have gained approximately 12 kg. 10 Excess weight gain may be due to lifestyle changes such as eating habits, sedentary nature or perhaps as a result of the hormone leptin. 11 Leptin is a 167-amino acid polypeptide hormone produced mainly by the adipocytes through the action of the human OB gene located on 7q32.1. 12 Leptin helps regulate appetite and hunger, which reduces fat storage in adipose tissues, by acting on the ventromedial and arcuate nuclei of the hypothalamus. 13 In obese women, there is decreased sensitivity to leptin resulting in an inability to detect satiety despite high energy stores and high levels of leptin. 14 This results in more accumulation of fat in the adipocytes. During pregnancy, leptin is also produced by the placenta and is crucial in regulating maternal energy metabolism.15–18 Leptin concentrations are three-to-four times higher in pregnant women compared with nonpregnant controls. 19 However, the regulation of maternal leptin during pregnancy is intricate and complex.17,20 Studies have reported that maternal serum leptin concentration increases progressively during the first two trimesters followed by a slight decline thereafter.21,22 This reported increase was significantly higher in the non-overweight pregnant women. 22 Maternal weight gain was reported to also increase progressively during pregnancy and the total weight gain was found to be noticeably larger in non-overweight pregnant women. 22 The greater increase in leptin levels in non-overweight pregnant women was said to be responsible for the higher percentage weight gain in the non-overweight pregnant women compared with the overweight/obese women. 22
The existence of cultural differences and foods eaten in a particular culture affect the prevalence of obesity among pregnant populations. 23 The prevalence of obesity and average weight gain in pregnancy also vary among different populations of women.24,25 Average leptin levels are also expected to vary across populations according to the type of diet and genetic make of the community in question. Although leptin levels may have been studied in other populations there is a strong need for such research to be replicated in the African environment to help expose the need for possible modulation of leptin levels in pregnant women to control their weight gain during pregnancy. A good understanding of the alteration of the levels of leptin in pregnancy may help initiate the production of agents that might regulate the levels of leptin and weight gain in pregnancy without causing adverse events during pregnancy.
Despite the overwhelming need for an in-depth look into the role of leptin in maternal weight gain and obesity in pregnancy among women in the southeast of Nigeria, studies have not been conducted. This current study aimed to determine the mean serum leptin levels of obese pregnant women compared with those of non-obese pregnant women at term. It also aimed to determine: (i) the prevalence of high serum leptin levels; (ii) the mean maternal weight gain at term; (iii) the correlation between mean serum leptin levels and mean maternal weight gain; (iv) the predictors of high maternal serum leptin levels among the obese and non-obese pregnant women in Enugu, Nigeria. It was hoped that the findings of this current study would serve as a baseline for the population of women of reproductive age in Enugu.
Patients and methods
Study design, setting and population
This cross-sectional observational study systematically enrolled pregnant women in tertiary, secondary and primary health facilities (public and private faith-based) in the Enugu metropolis, Nigeria between 1 January 2021 and 30 November 2021. Enugu metropolis represents the capital of Enugu state and it has three local governments (Enugu South, Enugu North and Enugu East) located in it. According to the last Nigeria census figures of 2006, the Enugu metropolis has a total population of 722 664 (males: 348 902; females: 468 223). Enugu State has Enugu as the capital. It is also called ‘The Coal City State’ and it is located in the Southeastern part of Nigeria.
The study participants were selected from one tertiary, one secondary, one faith-based and three primary healthcare facilities in the Enugu metropolis. Available data from the Department of Health Planning, Research and Statistics (DHPRS) of the Ministry of Health Enugu revealed that there are two public tertiary hospitals, one district hospital, five missionary hospitals/faith-based maternity hospitals, forty Primary Healthcare Centres, thirteen maternity homes and twenty-two private hospitals distributed in all of the three local governments of Enugu metropolis. Most of the pregnant mothers were seen at these listed hospitals. All pregnant women in the selected hospitals who gave their informed consent for this research were recruited to this study. The exclusion criteria were as follows: (i) pregnant mothers that were so ill that their mental capacity prevented them from easily understanding the questions in the questionnaire; (ii) patients with chronic diseases in pregnancy (hypertension, diabetes mellitus, human immunodeficiency virus); (iii) mothers < 18 years. The study group consisted of women with obesity who met the above study criteria while the control group consisted of normal weight pregnant women receiving antenatal care at the antenatal and booking clinics of the hospitals. The hospitals considered were the only ones that conduct maternity care services for pregnant women in the three local governments in the Enugu metropolis. Structured interviewer-administered questionnaires were administered to get the appropriate data from selected consenting participants.
Ethical approval was obtained from the Ethics Committee of Enugu State University of Science and Technology Teaching Hospital (no. ESUTHP/C-MAC/RA/034/VOL.2/90) and from the Ministry of Health Enugu (no. MH/MSD/REC21/188). Approval was also obtained from the heads of the other health facilities used for this research. Written informed consent was obtained from all participants at the point of recruitment to participate in the study. During the analysis and report of the findings of this study all patient details were de-identified. This study adhered to the STROBE guidelines for the reporting of observational studies. 26
Multistage sampling technique
A multistage sampling technique was utilized in the selection of the participants for this study. First, the hospitals in the Enugu metropolis were stratified into tertiary, secondary, faith-based and primary healthcare facilities. Out of these strata, one tertiary hospital, one secondary, one faith-based and three primary healthcare facilities were randomly selected from their respective clusters. At the first level, the selection was done to reflect the distribution of pregnant women in the Enugu metropolis. The number of participants was proportionately distributed depending on the number of pregnant mothers seen in the centres. An allocation of 35% of the questionnaires was given to patients in the one tertiary maternity institution, 20% in the one secondary healthcare facility, 20% in the one faith-based health facility and the remaining 25% in the three selected primary healthcare centres.
Secondly, a systematic sampling technique was utilized in choosing consenting participants after determining the number present in each antenatal clinic and developing a sampling frame. The sampling frame was generated from the number tally given to pregnant women before they start seeing their doctors and other healthcare personnel. Where such were not possible, every other consenting participant was selected from a particular healthcare facility until the number allotted to such facility was exhausted. No participant was sampled more than once.
Sample size estimation
The sample size (n) was determined using the formula: 27 n = (Z1 + Z2) 2 × 2(S)2/(µ2−µ1) 2 ; where, n = sample size for each group, Z1 = 1.96 i.e. Z score for α error of 5% (95% confidence level), Z2 = 0.84 i.e. Z score for estimated study power of 80%, S = standard deviation of the mean serum level of leptin, µ2-µ1 = minimum difference between means of study and control groups. This, in clinical studies, is equal to the effect size or target difference (E), which is = S × standardized effective size (assumed to be 0.4). In a previous study on the serum leptin levels in normal pregnancy and gestational diabetes, the standard deviation of the mean levels of leptin levels in normal pregnant women was 1.9 ng/ml. 28 Therefore, with S = 1.9, then E = 1.9 ×0.4 = 0.76, the calculated sample size for each group (n) = 75 and using a 10% (8) ‘attrition rate’ to accommodate for the loss of samples, spillage or dropouts of participants, the calculated minimum sample size for each of the two groups in the current study was 83 participants.
Anthropometric and sociodemographic data
The anthropometric and sociodemographic data were obtained by taking a medical history and conducting a simple physical examination of participants in both the study and control groups. Height was measured to the nearest centimetre using a stadiometer (RGZ-160; Jiangsu Yuanyan Medical Equipment Co., Ltd., Danyang, Jiangsu, China). The measurement was made against a flat, vertical surface with the participants standing as upright as possible on a firm platform on the stadiometer without raising the heels from the ground. The feet were kept together without shoes while the heels and the back were aligned with a ruled bar against a vertical surface. A sliding headpiece was brought to the vertex of the participant’s head and the reading at this level was taken to the nearest centimetre. Weight was measured using a Salter Doctor Style Mechanical Bathroom Scale (SKU: 145 BKDR; Salter, Manchester, UK) placed on a flat surface with the participant wearing light clothes and no shoes. The participant was asked to stand on the ‘zeroed’ scale and the reading was recorded to the nearest 0.5 kg.
Body mass index was calculated at the booking visit for antenatal care using weight (kg)/height squared (m2). Women were classified into different BMI groups as follows: <18.5 kg/m2 – underweight; 18.5–24.9 kg/m2 – healthy range; 25.0–29.9 kg/m2 – overweight; 30.0–39.9 kg/m2 – obesity; ≥40 kg/m2 – severe obesity.6,29,30 Only women that had at the time of the booking visit for antenatal care a BMI in the healthy range (18.5–24.9 kg/m2; non-obese group) or those that had a BMI classified as obesity (30.0–39.9 kg/m2; obese group) were recruited to this study.
Mean weight gain in pregnancy
This was recorded as the difference in the weight of the pregnant participant at term compared with the weight at booking (on or before 12 weeks of gestation). The normal mean weight gain in pregnancy was taken to be 12.00 kg. The Institute of Medicine has outlined different gestational weight gains for different BMI classes of women: 12.5–18 kg for underweight women; 11.5–16 kg for healthy range weight women; 7–11.5 kg for overweight women; and 5–9 kg for obese women. 29
Definitions
A ‘term’ pregnancy was a pregnancy that lasted between 37 completed weeks to 41 completed weeks. Leptin deficiency was defined as leptin levels that were below the lower border of the normal range (normal range: 2.5–21.8 ng/ml).31,32 A high level of leptin was defined as leptin levels above the upper border of the normal range (normal range: 2.5–21.8 ng/ml).31,32
The social classification of the study participants was defined as classes I, II, III, IV and V as previously reported. 33 Social class V being at the bottom of the social classification and social class I at the top. The details of this scoring system using the sum of scores of the husband’s occupation (A) and the woman’s education (B) is presented in Table 1. The social class of each participant was then determined by the sum of scores A and B.
The social classification system used for study participants based on the husband’s occupation and the wife’s educational level. 33

Measurement of serum leptin levels
Whole venous blood samples (5 ml) were collected from the cubital veins or any other prominent superficial vein from the participant’s preferred upper limb between 08:30 h–11:00 h to ensure uniformity in the timing as this affects the levels of leptin in the blood. Blood collection was undertaken in the sample collection room at the ante-natal clinics by the investigators and four other doctors trained for the study. Blood samples were immediately put in a rack to allow a stable clot to form at room temperature. After clotting of the blood, the serum was collected by centrifugation at 25 °C for 10 min at 1880 g using a Neuvar low-speed centrifuge (MSLZL43; Neuvar Inc., Palo Alto, CA, USA). The serum was stored at –20 °C until analysis. An enzyme-linked immunosorbent assay kit (ELISA kit RD191001100; BioVendor – Laboratorni medicina a.s., Brno, Czech Republic) was used to measure serum leptin levels. The minimum detectable concentration of leptin was 0.2 ng/ml. Intra- and interassay coefficients of variation for the ELISA were <5.9% and <5.3%, respectively.
Study outcomes
The primary study outcome was a comparison of the mean leptin levels. The secondary outcome measures were the prevalence of leptin deficiency and the relationship between hyperleptinaemia and maternal weight gain at term among the study participants.
Statistical analyses
All statistical analyses were performed using IBM SPSS Statistics for Windows, Version 23.0 (IBM Corp., Armonk, NY, USA). Categorical variables were compared using χ2-test and continuous data were compared using Student's t-test. Pearson correlation coefficient was used to determine correlations between serum leptin levels and maternal weight gain. Regression analysis was used to determine the predictors of hyperleptinaemia in pregnant women at term. Values were set at a 95% confidence level. A P-value < 0.05 was considered statistically significant.
Results
This cross-sectional study enrolled total of 179 pregnant female patients at term: 90 and 89 participants in the non-obese and obese groups, respectively. However, only 85 participants from each group had complete results and were analysed (Figure 1). The mean ± SD age was 31.95 ± 3.90 years and 29.27 ± 5.03 years for the obese and non-obese groups, respectively. The highest proportion of the non-obese women (34 of 85 patients; 40.0%) belonged to the 26–30 years age group, while the highest proportion of the obese pregnant women (41 of 85 patients; 48.2%) were in the 31–35 years age group (Table 2). The highest proportion of the non-obese women (47 of 85 patients; 55.3%) and obese women (66 of 85 patients; 77.6%) had a tertiary level of education and all the participants in both groups were Christians.

Flow chart showing progress through enrolment and analysis of pregnant women who were enrolled in a study undertaken to determine the mean serum leptin levels of obese pregnant women compared with those of non-obese pregnant women at term.
Demographic characteristics of the pregnant women at term who were enrolled in a study undertaken to determine the mean serum leptin levels of obese pregnant women compared with those of non-obese pregnant women at term.

Likelihood ratio; categorical variables were compared using χ2-test; NS, no significant between-group difference (P ≥ 0.05).
Social class classification was only done for married participants according to the classification system used. 33
The mean ± SD serum leptin level of the obese pregnant women at term was 99.39 ± 50.20 ng/ml, which was significantly higher than the mean ± SD value of 48.98 ± 30.35 ng/ml for the non-obese pregnant women (P < 0.001). The mean values of other variables in the obese and non-obese pregnant women are shown in Table 3. The prevalence of hyperleptinaemia among the obese pregnant women was 95.3% (81 of 85 patients), which was significantly higher than the prevalence among the non-obese pregnant women at term (65 of 85 patients; 76.5%) (P = 0.001) (Table 4).
Comparison of the means of some variables of the pregnant women at term who were enrolled in a study undertaken to determine the mean serum leptin levels of obese pregnant women compared with those of non-obese pregnant women at term.

Continuous data were compared using Student's t-test; NS, no significant between-group difference (P ≥ 0.05).
BMI, body mass index.
Prevalence of hyperleptinaemia in the pregnant women at term who were enrolled in a study undertaken to determine the mean serum leptin levels of obese pregnant women compared with those of non-obese pregnant women at term.

Categorical variables were compared using Fisher's exact test.
The mean ± SD weight gain in the obese pregnant women was 18.47 ± 8.59 kg, which was significantly higher than that of the non-obese pregnant women at term (14.23 ± 7.02 kg) (P = 0.001) (Table 5). The mean ± SD percentage weight gain of the non-obese pregnant women was 24.13% ± 12.47%, which was significantly higher than that of the obese pregnant women (20.07% ± 9.65%) (P = 0.019).
Comparison of the weight gain of the pregnant women at term who were enrolled in a study undertaken to determine the mean serum leptin levels of obese pregnant women compared with those of non-obese pregnant women at term.

Continuous data were compared using Student's t-test.
Pearson correlation coefficient analysis between weight gain and serum leptin levels of the non-obese pregnant women at term showed a nonsignificant weak positive relationship (r = 0.139) (Figure 2). The coefficient of determination, R2 = 0.019, showed that only 1.9% of the variations in the serum leptin level were explained by variations in weight.

Pearson correlation coefficient analysis between mean serum leptin and maternal weight gain in the non-obese pregnant women (n = 85) at term who were enrolled in a study undertaken to determine the mean serum leptin levels of obese pregnant women compared with those of non-obese pregnant women at term.
Pearson correlation coefficient analysis between weight gain and serum leptin levels of the obese pregnant women at term showed a nonsignificant very weak positive relationship (r = 0.04) (Figure 3). The coefficient of determination, R2 = 0.002, showed that only 0.2% of the variations in the serum leptin level were explained by variations in weight. It could also be described as a no correlation.
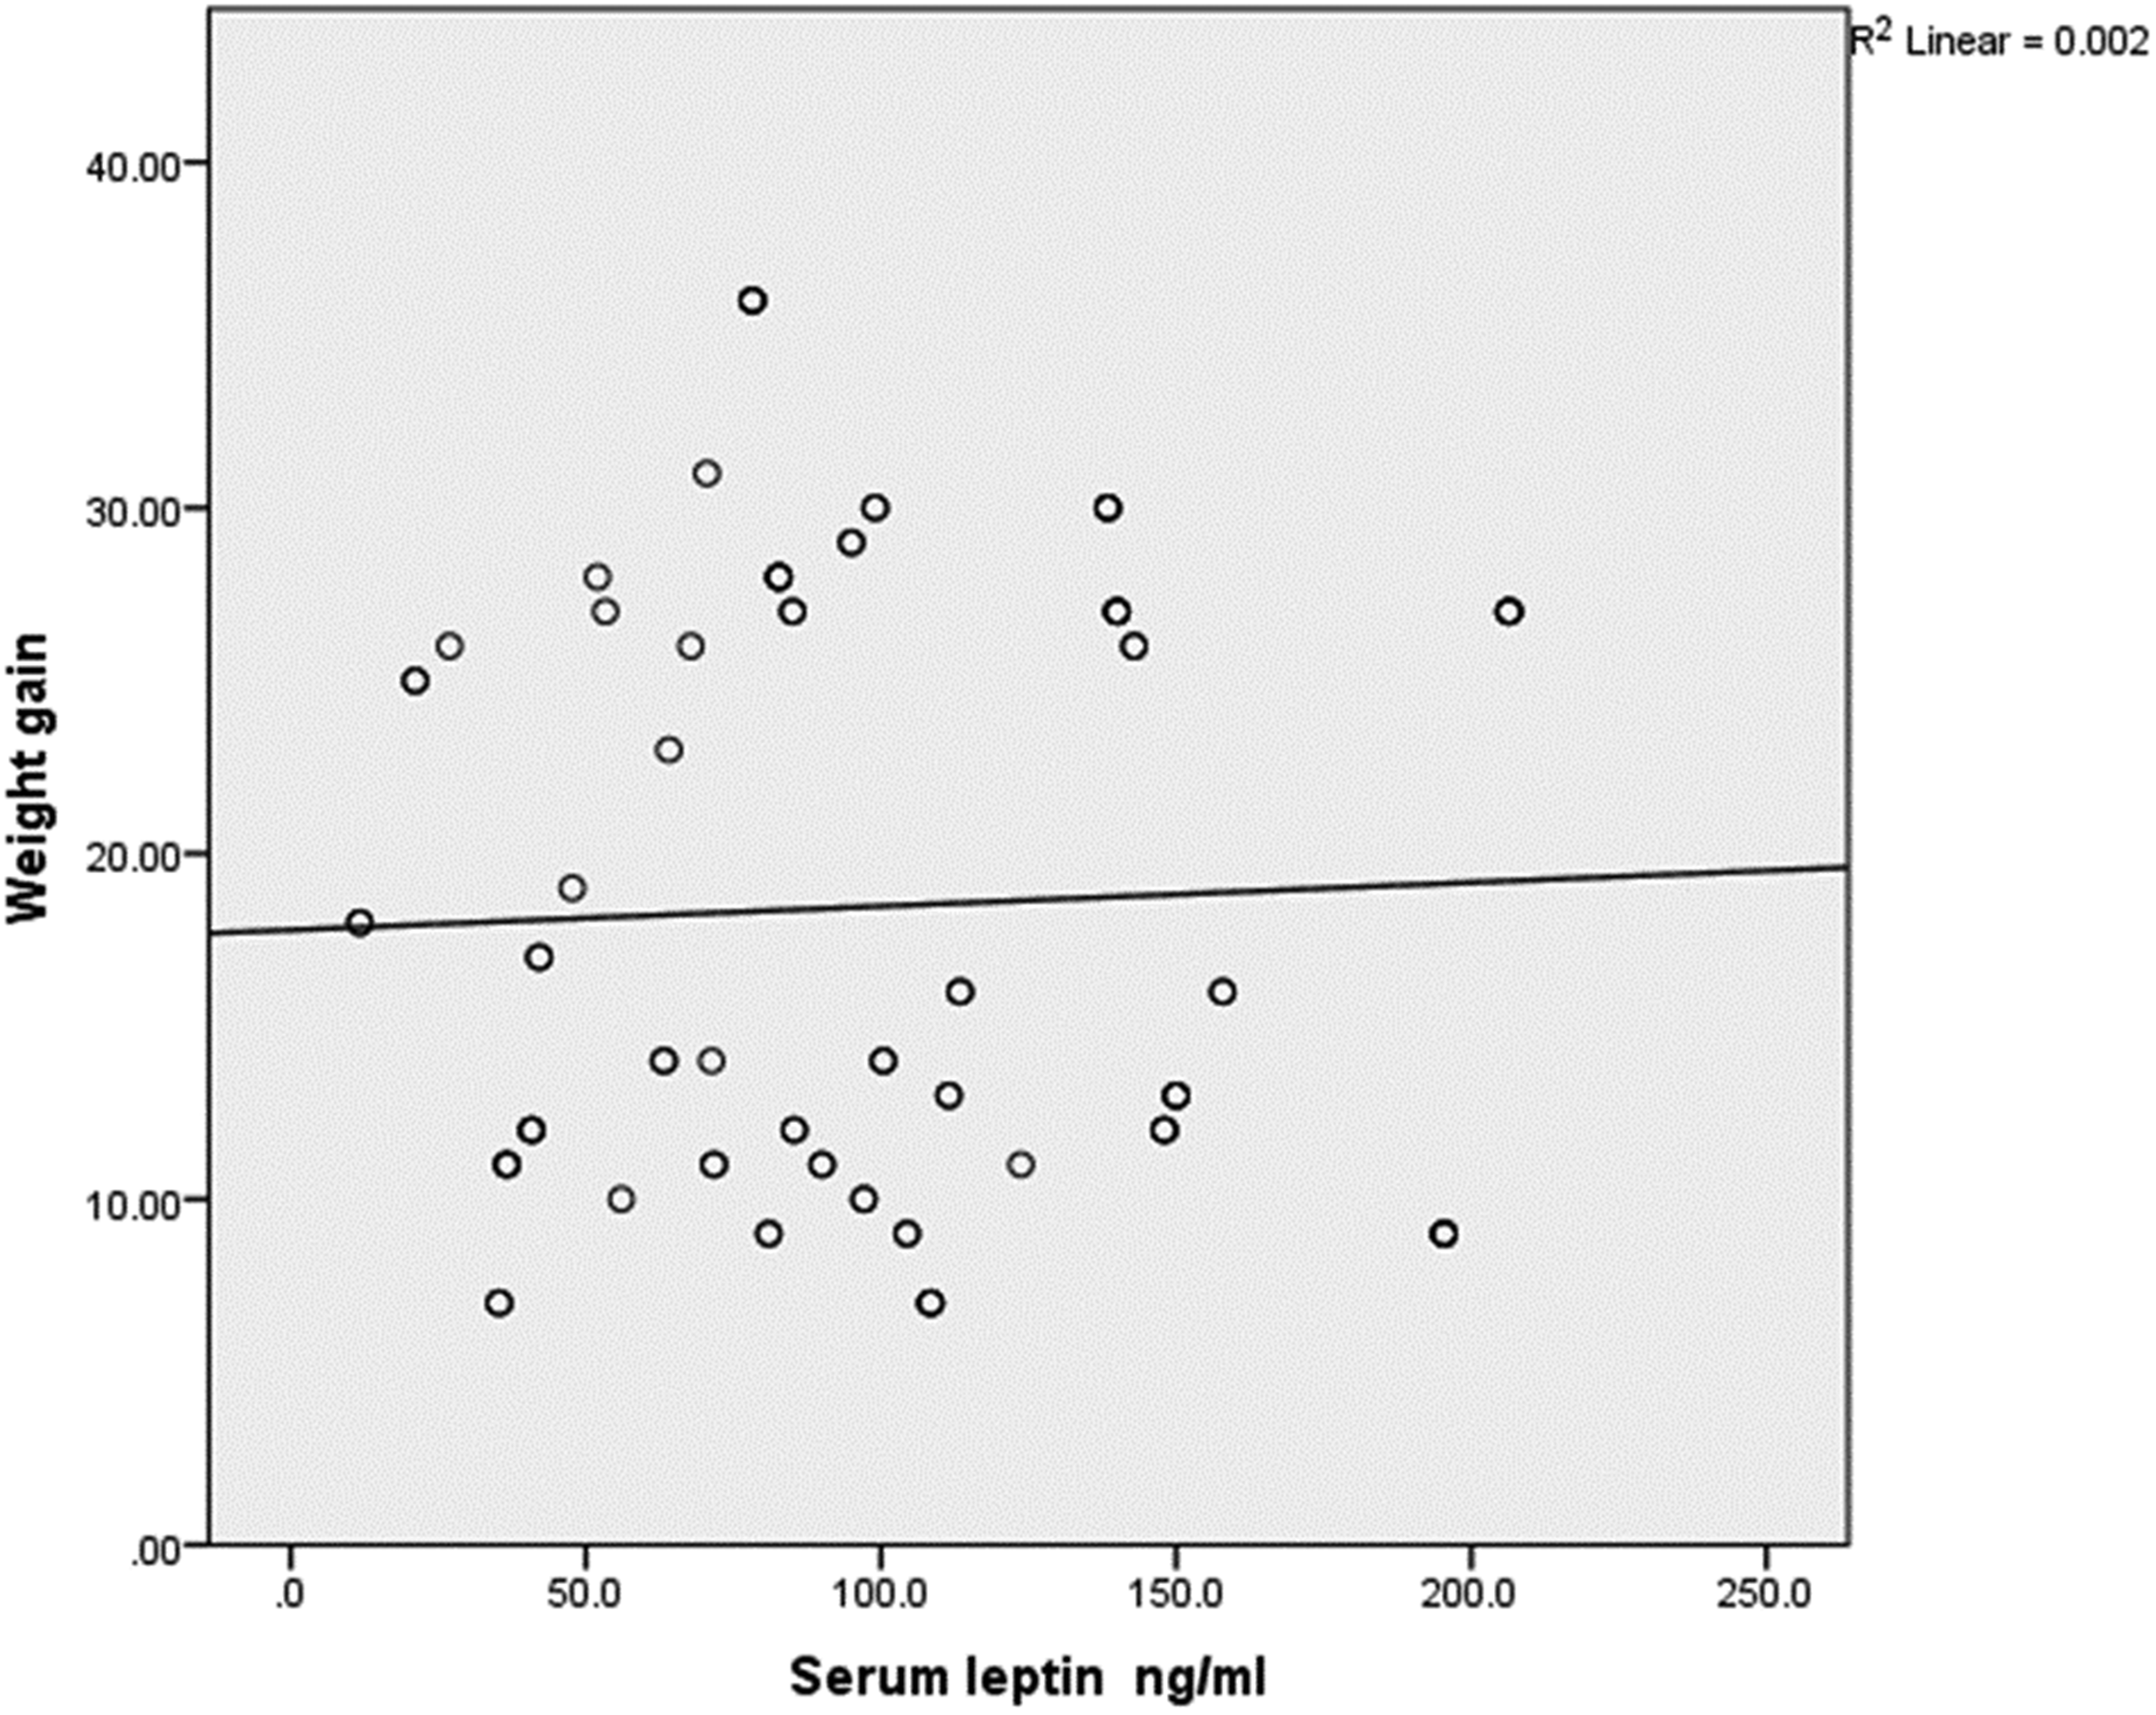
Pearson correlation coefficient analysis between mean serum leptin and maternal weight gain in the obese pregnant women (n = 85) at term who were enrolled in a study undertaken to determine the mean serum leptin levels of obese pregnant women compared with those of non-obese pregnant women at term.
The overall Pearson correlation coefficient analysis between weight gain and serum leptin levels among the entire study cohort showed a significant weak positive relationship (r = 0.196; P = 0.01) (Figure 4). The coefficient of determination, R2 = 0.038, showed that only 3.8% of the variations in the serum leptin level were explained by variations in weight. It can also be described as having no correlation.

Overall Pearson correlation coefficient analysis between mean serum leptin and maternal weight gain among all of the pregnant women (n = 170) at term who were enrolled in a study undertaken to determine the mean serum leptin levels of obese pregnant women compared with those of non-obese pregnant women at term.
Regression analysis of the maternal sociodemographic variables demonstrated that high maternal serum leptin levels were significantly associated and predicted by both employment status (P = 0.028; effect size f = 0.25) and levels of education (P = 0.016; effect size f = 0.25) among the entire study cohort (Table 6). The results show that the employed women were approximately 3.5-times more likely to become hyperleptinaemic compared with the unemployed women. Also, women who had less than tertiary education were approximately 3.3-times more likely to become hyperleptinaemic compared with women with tertiary education and other additional qualifications.
Regression analysis showing the predictors of hyperleptinaemia in pregnant women at term who were enrolled in a study undertaken to determine the mean serum leptin levels of obese pregnant women compared with those of non-obese pregnant women at term.

aOR, adjusted odds ratio.
Discussion
This cross-sectional study aimed to determine the mean serum leptin levels of obese pregnant women at term and to compare them with those of non-obese pregnant women at term, which permitted the calculation of the prevalence of hyperleptinaemia in the two groups. The current study also aimed to compare the mean maternal weight gain in obese and non-obese pregnant women at term, which permitted an analysis of the correlation between mean serum leptin levels and mean maternal weight gain in the two groups. Regression analyses aimed to identify the predictors of hyperleptinaemia among the study participants.
This current study demonstrated that the mean serum leptin level of the obese pregnant women at term was significantly higher than that of the non-obese pregnant women; and the prevalence of hyperleptinaemia among obese pregnant women (95.3%) was significantly higher than that of non-obese pregnant women (76.5%) at term. This current study also demonstrated that the mean weight gain in the obese pregnant women (18.47 kg) was significantly higher than that of the non-obese pregnant women (14.23 kg) at term; and the mean percentage weight gain of the non-obese pregnant women (24.13%) was significantly higher than that of obese pregnant women (20.07%) at term. This current study also showed a weak positive correlation between maternal weight gain and mean serum leptin levels in obese and non-obese pregnant women at term. The predictors of high maternal serum leptin at term among the participants were the employment status and levels of education of the participants.
The findings of this current study on the mean serum leptin level of the obese pregnant women compared with that of the non-obese pregnant women at term were comparable with those of a similar study undertaken in the US, which reported that the maternal serum leptin level of the overweight and obese women was significantly higher than that of the normal pregnant women at term. 20 The findings of this current study on the mean serum leptin level in the normal weight (non-obese) participants were however above a reference range established in a similar study undertaken in Warsaw, Poland. 34 This noted difference may be due to the differences in the body makeup of the two populations studied because they have different cultures and diets that could affect their body fat composition as well as serum leptin levels. A previous study obtained similar higher levels of maternal serum leptin at term in a longitudinal study in Brazil. 22 Several studies also agreed that although the maternal serum leptin at term was high, the rate of increase from early pregnancy to term was significantly greater in the non-obese pregnant women.20,35 The rate of rise in serum leptin could not be confirmed by the current study because it had a cross-sectional design. It has been suggested that other factors other than the fat mass may be responsible for this significant increase in serum leptin levels in non-obese pregnant women.20,36
The current study demonstrated that the prevalence of hyperleptinaemia among obese pregnant women was significantly higher than that of non-obese pregnant women at term. This finding was similar to that obtained in a similar study. 31 Findings from other studies noted that this level increased over the trimesters of pregnancy.21,22 Although the concentration of serum leptin was highest at term, the rate of increase was slowest at term and both the level and rate of increase of serum leptin among the participants in the study were more significantly observed in obese pregnant women.21,22 It is not surprising that none of the study participants in either group in the current study had low serum leptin levels. Leptin is not only produced in the fat cells but the placenta is also a major source of the hormone during pregnancy.37,38 Placental leptin serves as an immunomodulator during pregnancy (generation of matrix metalloproteinases, arachidonic acid products, nitric oxide production and T‐cell cytokines); 39 and leptin expression is regulated by interleukin (IL)-1α, IL-1β, IL-6 and interferon-ϒ; 40 therefore the high levels observed among the study participants helped in the support of their pregnancy up until delivery. Alternatively, low levels of leptin have been implicated in pathological conditions like polycystic ovary syndrome; with the associated anovulation, infertility and recurrent/spontaneous miscarriages in the first trimester. 41 The dysregulation of leptin has also been observed to play a role in the pathogenesis of pre-eclampsia, gestational diabetes mellitus and intrauterine growth restriction.42–45
The current study also demonstrated that the mean percentage maternal weight gain during pregnancy in the non-obese pregnant women was significantly higher than that of the obese pregnant women at term. This finding was similar to that obtained from a longitudinal study undertaken in Brazil, which reported that the percentage weight gain was significantly greater in the non-obese women at term. 22 In contrast, a longitudinal study in Enugu, Nigeria (a similar setting to this current study) reported that the weight gain of the obese women was significantly greater than that of the non-obese pregnant women, 46 which was in agreement with the current findings that showed that the mean weight gain in the obese pregnant women was significantly higher than that of the non-obese pregnant women. It is important to note that while the obese pregnant women’s mean weight gain in the current study was higher than the value recommended by the Institute of Medicine, 29 the non-obese women had a mean weight gain that was within the recommended limit. Lack of information on expected weight gain in pregnancy is prevalent among pregnant women in the same geographical area to the current study; 25 and this may have impacted on the unguided weight gain in pregnancy especially among the obese women who were meant to aim to gain less weight during their pregnancy (5–9 kg). 29 In contrast, a study undertaken in Iran demonstrated that maternal weight gain was less than that noted in the current study. 47 The study reported that there was no significant difference in the weight gain in both obese and non-obese pregnant women. 47 This difference compared with the current findings might be explained by the type of diet pregnant women in Iran consume, which is less carbohydrate-based compared with that consumed in the West African sub-region. 48
There was a weak positive correlation between mean serum leptin levels and maternal weight gain in the non-obese pregnant women at term in the current study. A similar correlation was also observed in the obese pregnant women at term. These findings might be explained by the fact that total serum leptin is not only contributed by the body fat but there is a considerable contribution from the placenta.37,38 The secretion of serum leptin may have applied differently to both the obese and non-obese pregnant mothers giving rise to a poor positive correlation that was recorded among the participants. Although the increase in maternal serum leptin has been attributed to an increase in adipose tissues by other previous studies,20,49 it is important to note that other studies have equally noted a sudden rise in maternal serum leptin in the first trimester of pregnancies that cannot be attributed to an increase in the amount of adipose tissue.31,50–52 The increase in serum leptin in the first trimester cannot be explained by small increase in adipose tissue, which suggests that this increase might have come from the placental production of leptin. Also, the sudden drop in maternal serum leptin within the first 24 hours after delivery suggests that the rise in serum leptin might be more related to the placental source and maternal metabolic adaptation to pregnancy.49,50,53 These previous reports show that there may be different regulatory pathways responsible for the regulation of serum leptin and maternal weight gain in both obese and normal-weight pregnant women.54,55 It is also important to note that in the current study the correlation was better when all the study participants were analysed together. Therefore, increasing the sample size may reveal a better correlation.
The current study demonstrated that the predictors of high maternal serum leptin levels at term among the participants were the employment status and the educational level of the participants. The relationship was expected as employed women were shown to be more likely to become hyperleptinaemic compared with unemployed women. Obesity is known to increase with increasing source of income,56,57 suggesting that serum leptin levels should also increase in line with weight gain. The relationship between educational level and by extension social status showed that obesity increase with low socio-economic status. 58 It is also expected that increasing obesity will also predict hyperleptinaemia. Studies have shown that obesity is more prevalent among women with lower educational status in medium and low-income countries.58–60
This current study had several limitations. First, the majority of the women in the study setting were recruited after the first trimester, which excluded others unnecessarily and reduced the chances of getting a truly representative sample population. Secondly, the inability to measure weight gain in the first 12 weeks of pregnancy might have limited the study in terms of getting the exact weight gain during pregnancy. However, since the majority of weight gain occurs towards the end of the second trimester and in the third trimester, the acceptable minimum gestational age at booking was, therefore, acceptable for this study and applied to all the participants. Difficulty in extracting serum despite good handling after collection made the research team take extra pains at finding such participants for recollection and sometimes outright replacement of the participant. A longitudinal study is necessary to help test all the points that were raised by this cross-sectional study in the study area. Since the study revealed that the mean weight gain of the obese pregnant women was above the Institute of Medicine’s recommended range, women, especially obese women, should receive adequate pre-pregnancy care and education where the need to reduce their weight gain in pregnancy through modifiable lifestyles should be addressed. Lastly, a study that recruits pregnant women at the pre-pregnancy level or at the first missed period will give the closest value of pre-pregnancy BMI thereby increasing the external validity of the study.
In conclusion, this current study demonstrated that the mean serum leptin level of the obese pregnant women at term was significantly higher than that of the non-obese pregnant women; and the prevalence of hyperleptinaemia among the obese pregnant women was also significantly higher than that of the non-obese pregnant women at term. Mean weight gain in the obese pregnant women was significantly higher than that of the non-obese pregnant women, although the mean percentage weight gain of the non-obese pregnant women was significantly higher than that of the obese pregnant women at term. There was a weak positive correlation between mean serum leptin levels and maternal weight again among the non-obese and obese pregnant women at term. The predictors of high maternal serum leptin at term among the participants were the employment status and levels of education of the participants. Therefore, there is a strong need to further review the overall effect of leptin throughout the duration of pregnancy in a multicentre longitudinal study to help elucidate the utilization of leptin in the modulation of weight gain in pregnancy.
Footnotes
Author contributions
J.T.E., N.O.E. and C.A.I. conceptualized, designed, collected data, analysed data and were involved in writing the final draft of the manuscript. T.U.N. and H.C.O. made major contributions to the design, data collection and analysis. I.A.M and I.A.U. were involved in the design, data collection and analysis and contributed to the writing of the final draft of the manuscript. M.E.N. was involved in the conceptualization, data collection and writing of the final draft of the manuscript. E.O.I. was involved in the conceptualization, data analysis and final draft of the manuscript. J.O.E. and N.I.O. were involved in the design, analysis and writing of the final draft of the manuscript. All authors read and approved the final manuscript.
Acknowledgements
We remain highly indebted to the Directors at the Institute of Maternal and Child Health of the University of Nigeria Teaching Hospital Enugu, Nigeria, for allowing this research to be conducted in the department. We also appreciate contributions from the lecturers in the institute: Professors C.C. Dim, E.C. Ezugwu and C. Chigbu for their continued support and materials for this study.
Declaration of conflicting interests
The authors declare that there are no conflicts of interest.
Funding
The study was funded by the researchers.