
Abstract
Objectives
Chronic total occlusion (CTO) is a form of coronary artery disease (CAD) requiring percutaneous coronary intervention. There has been minimal research regarding CTO-specific risk factors and predictive models. We developed machine learning predictive models based on clinical characteristics to identify patients with CTO before coronary angiography.
Methods
Data from 1473 patients with CAD, including 317 patients with and 1156 patients without CTO, were retrospectively analyzed. Partial least squares discriminant analysis (PLS-DA), random forest (RF), and support vector machine (SVM) models were used to identify CTO-specific risk factors and predict CTO development. Receiver operating characteristic (ROC) curve analysis was performed for model validation.
Results
For CTO prediction, the PLS-DA model included 10 variables; the ROC value was 0.706. The RF model included 42 variables; the ROC value was 0.702. The SVM model included 20 variables; the ROC value was 0.696. DeLong’s test showed no difference among the three models. Four variables were present in all models: sex, neutrophil percentage, creatinine, and brain natriuretic peptide (BNP).
Conclusions
Validation of machine learning prediction models for CTO revealed that the PLS-DA model had the best prediction performance. Sex, neutrophil percentage, creatinine, and BNP may be important risk factors for CTO development.
Keywords
Introduction
Chronic total occlusion (CTO) occurs when a coronary artery is completely blocked, resulting in complete cessation of blood flow to the affected area. 1 The condition is characterized by thrombolysis in myocardial infarction flow grade 0, with a minimum duration of 3 months. It has been estimated that CTO affects 16% to 20% of patients who undergo coronary angiography (CAG) for the diagnosis of coronary artery disease (CAD). 2 Despite its high prevalence, CTO recanalization is limited because of low success rates, high complications, long procedure times, and substantial costs. 3 Considering the challenges associated with CTO recanalization, early detection of risk factors can facilitate earlier intervention. This detection might be achieved by identifying easily measurable predictors that can be used to recognize patients with CTO risk. This information could help healthcare providers to prevent or mitigate the impact of CTO, thereby improving patient outcomes.
In recent years, some studies have analyzed risk factors associated with CAD incidence, such as demographic information, biochemistry, and echocardiography. However, none of these studies have specifically focused on clinical characteristics associated with CTO; such characteristics could generate more accurate and personalized risk assessments. 4 Given the technical difficulties associated with CTO recanalization, as well as its high cost and limited success, there is a clear need for more effective risk stratification and prediction tools. 5 Through analyses of CTO data embedded in clinical characteristics, along with the use of machine learning algorithms, early and accurate identification of CTO may lead to more effective treatment and better patient outcomes. 6
Here, we conducted a risk factor analysis and constructed three models to predict CTO risk based on clinical and demographic characteristics, as well as biochemical parameters and echocardiography findings. Computational analysis revealed that these models can provide clinically relevant predictions of CTO risk, highlighting the emerging opportunity to meet an important need in this field.
Methods
Study cohort
This retrospective study included consecutive patients with unstable angina pectoris who underwent CAG at Beijing Anzhen Hospital, Capital Medical University, between January 2019 and December 2020. Exclusion criteria were previous myocardial infarction, previous percutaneous coronary intervention, and/or previous coronary artery bypass grafting. Patients were divided into two groups according to procedural outcome: CTO and non-CTO. CTO was defined as a coronary lesion without thrombolysis in myocardial infarction flow grade 0 and a minimum duration of 3 months 7 ; non-CTO was defined as stenosis involving ≥50% of the luminal diameter in one branch of the main coronary artery.
The study protocol was approved by the Human Research Ethics Committee of Beijing Anzhen Hospital, Capital Medical University (approval no. 2022177X); it adhered to the principles of the Declaration of Helsinki (as revised in 2013). Considering the retrospective study design, the Human Research Ethics Committee waived the requirement for informed consent. All patient information was anonymized prior to analysis. This article adhered to the TRIPOD reporting checklist. 8
Data collection
Data were extracted by YS and WJ independently, and any disagreements were resolved through discussion with a third investigator (JL). Baseline patient clinical and demographic characteristics, biochemical parameters, and echocardiography findings were recorded for each patient. Current tobacco use was defined as smoking >1 cigarette per day for at least 6 months. Fasting blood samples were collected for laboratory tests to measure a wide range of blood parameters (listed in Table 1). The atherogenic index of plasma was calculated as log10 (triglycerides/high-density lipoprotein cholesterol [HDL-C]). The triglyceride-glucose (TyG) index was calculated as ln [fasting triglycerides (mg/dL) × fasting glucose (mg/dL)/2]. The MONO/LYM ratio was calculated as monocytes/lymphocytes. The left ventricular end diastolic diameter (LVEDD) and ejection fraction (EF) were determined by echocardiography. If more than 30% of data were missing for a single patient, that patient was excluded from the analysis. Missing data were imputed using the missForest package in R4.2.0 software (R Foundation for Statistical Computing, Vienna, Austria), which performs nonparametric missing value imputation using a random forest approach.
Baseline clinical characteristics of patients in this study*
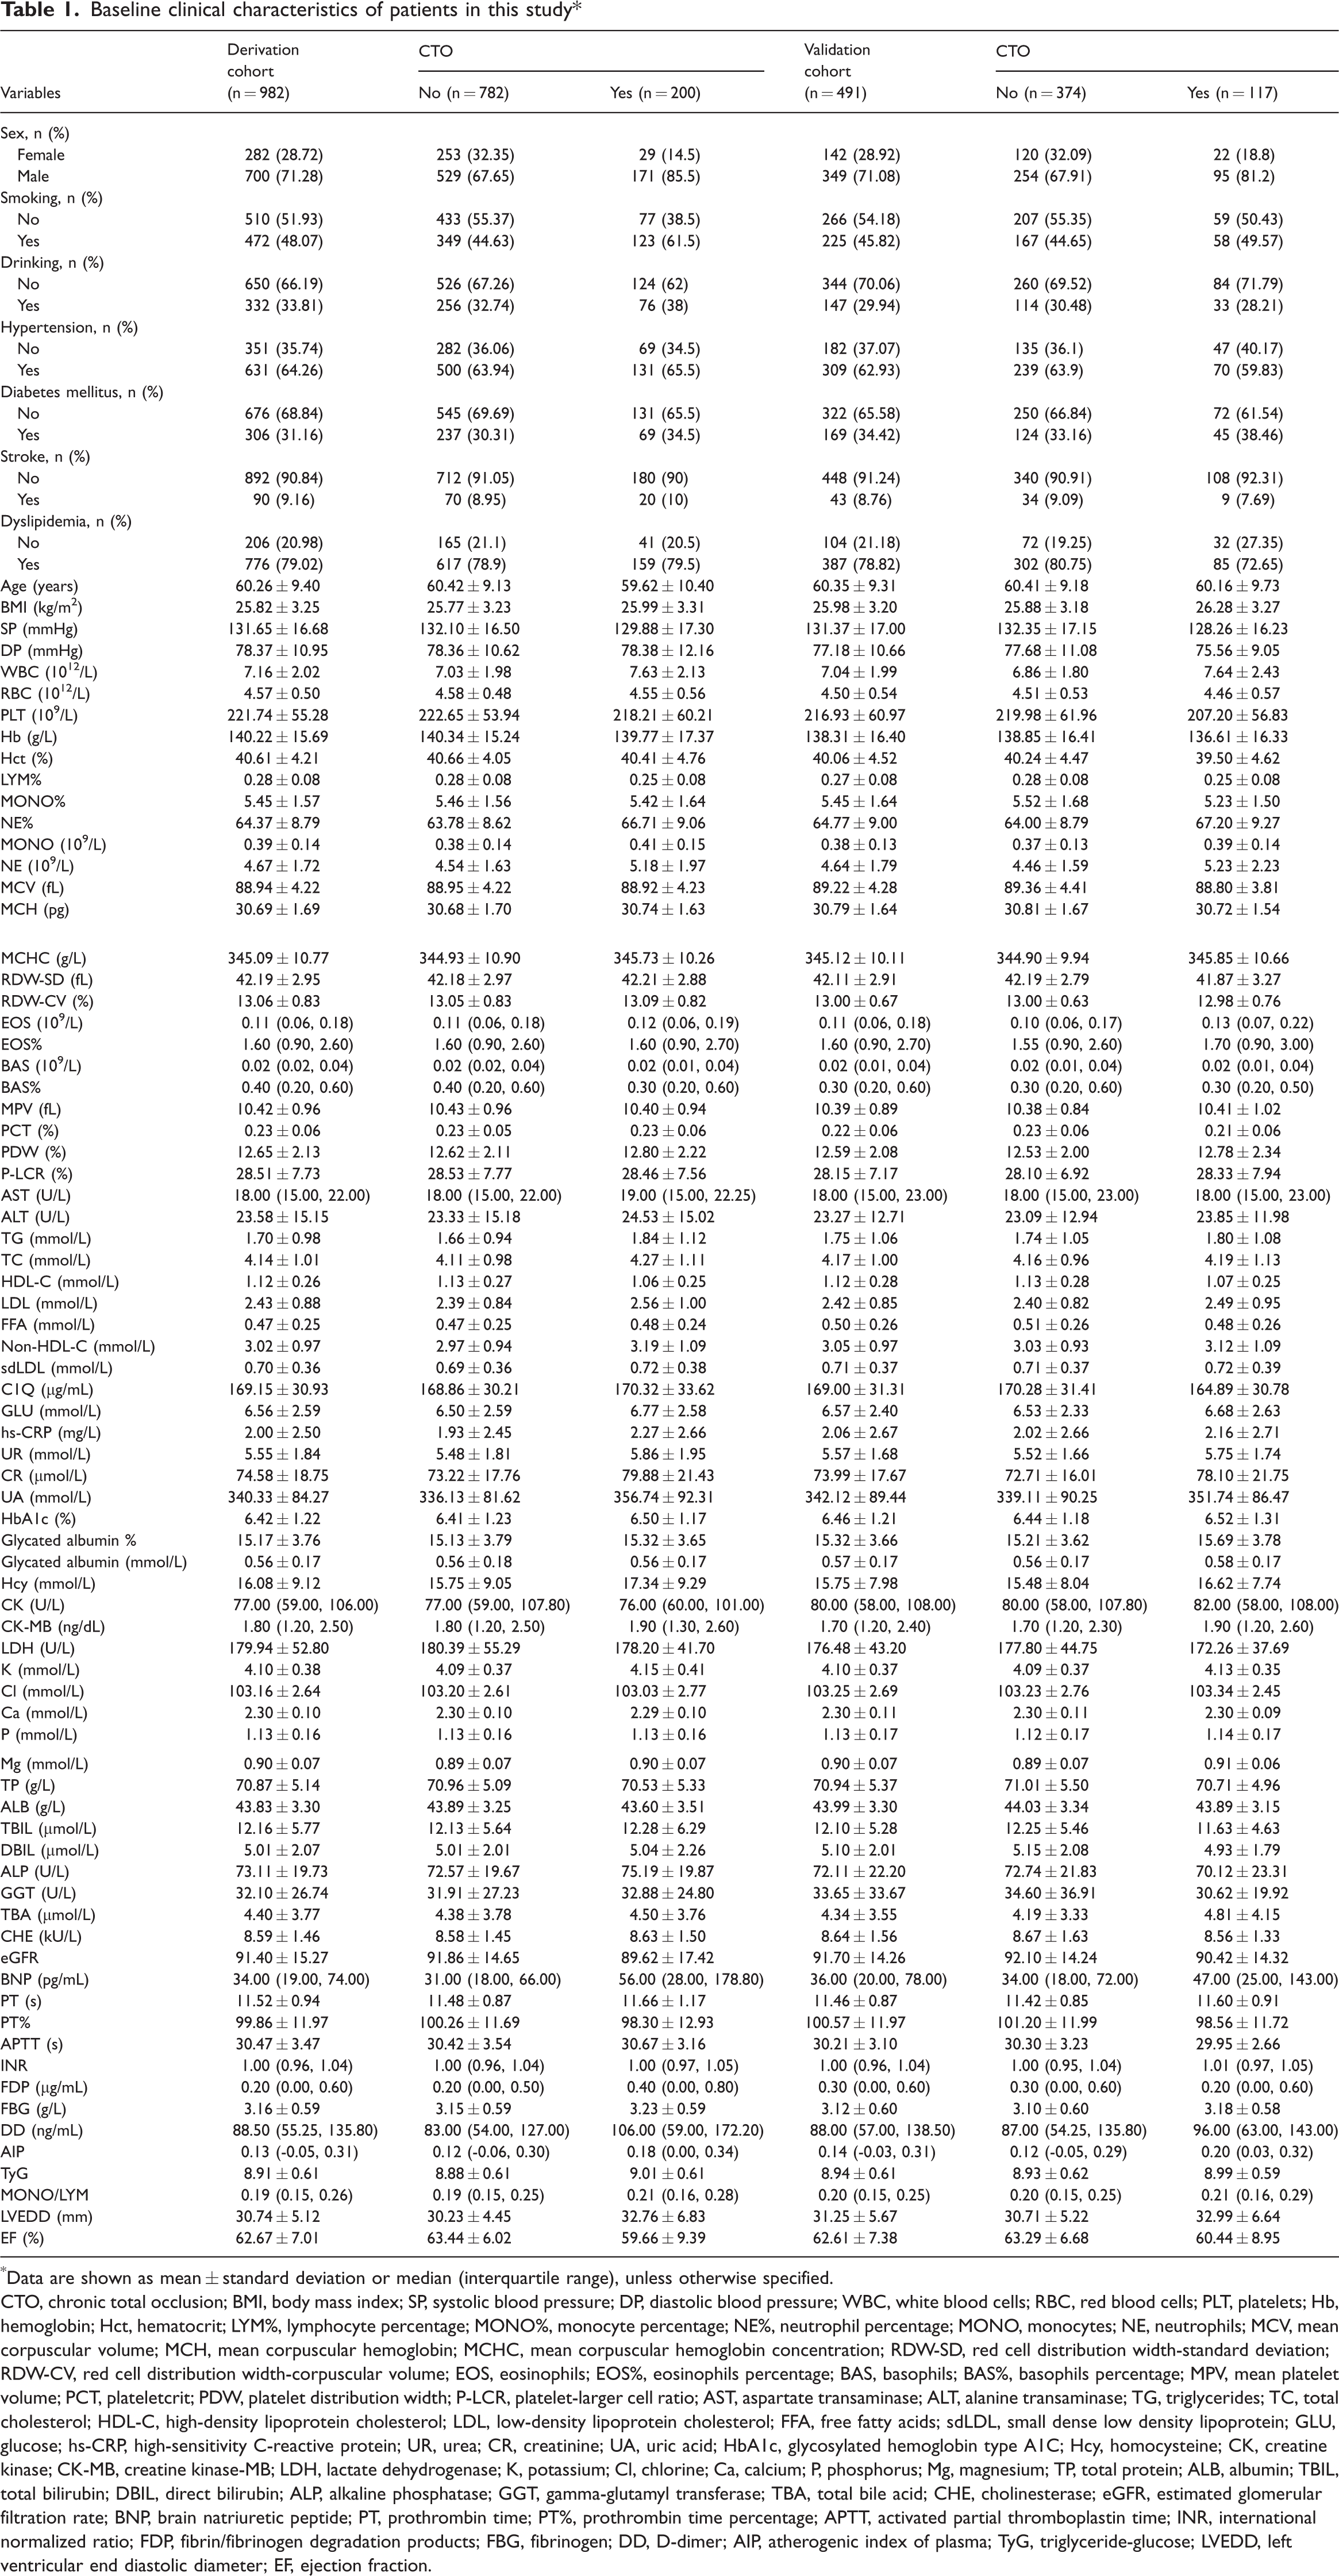
Data are shown as mean ± standard deviation or median (interquartile range), unless otherwise specified.
CTO, chronic total occlusion; BMI, body mass index; SP, systolic blood pressure; DP, diastolic blood pressure; WBC, white blood cells; RBC, red blood cells; PLT, platelets; Hb, hemoglobin; Hct, hematocrit; LYM%, lymphocyte percentage; MONO%, monocyte percentage; NE%, neutrophil percentage; MONO, monocytes; NE, neutrophils; MCV, mean corpuscular volume; MCH, mean corpuscular hemoglobin; MCHC, mean corpuscular hemoglobin concentration; RDW-SD, red cell distribution width-standard deviation; RDW-CV, red cell distribution width-corpuscular volume; EOS, eosinophils; EOS%, eosinophils percentage; BAS, basophils; BAS%, basophils percentage; MPV, mean platelet volume; PCT, plateletcrit; PDW, platelet distribution width; P-LCR, platelet-larger cell ratio; AST, aspartate transaminase; ALT, alanine transaminase; TG, triglycerides; TC, total cholesterol; HDL-C, high-density lipoprotein cholesterol; LDL, low-density lipoprotein cholesterol; FFA, free fatty acids; sdLDL, small dense low density lipoprotein; GLU, glucose; hs-CRP, high-sensitivity C-reactive protein; UR, urea; CR, creatinine; UA, uric acid; HbA1c, glycosylated hemoglobin type A1C; Hcy, homocysteine; CK, creatine kinase; CK-MB, creatine kinase-MB; LDH, lactate dehydrogenase; K, potassium; Cl, chlorine; Ca, calcium; P, phosphorus; Mg, magnesium; TP, total protein; ALB, albumin; TBIL, total bilirubin; DBIL, direct bilirubin; ALP, alkaline phosphatase; GGT, gamma-glutamyl transferase; TBA, total bile acid; CHE, cholinesterase; eGFR, estimated glomerular filtration rate; BNP, brain natriuretic peptide; PT, prothrombin time; PT%, prothrombin time percentage; APTT, activated partial thromboplastin time; INR, international normalized ratio; FDP, fibrin/fibrinogen degradation products; FBG, fibrinogen; DD, D-dimer; AIP, atherogenic index of plasma; TyG, triglyceride-glucose; LVEDD, left ventricular end diastolic diameter; EF, ejection fraction.
Machine learning algorithms
Data were pre-processed by variable normalization, transformed using log10 and autoscaling functions, and then subjected to analysis by machine learning algorithms (i.e., models). The following three models were used to identify CTO risk factors and predict CTO presence: partial least squares discriminant analysis (PLS-DA), random forest (RF), and support vector machine (SVM).
The performance of each model was evaluated by Monte-Carlo cross-validation via balanced sub-sampling to generate receiver operating characteristic (ROC) curves. In each run of Monte-Carlo cross-validation, the models were trained using data for two-thirds of the patients (i.e., the derivation cohort), then validated using data for the remaining one-third of the patients (i.e., the validation cohort); the top 3, 5, 10, 20, half-maximum, and most important characteristics were identified. This process was repeated multiple times to determine the performance (with 95% confidence interval [CI]) of each model. Variable importance in each model was assessed using the Gini criterion. Results were visualized using Venn graphs and UpSet plots generated by the Venn and UpSetR packages in R4.2.0 software, respectively.
Statistical analysis
Continuous variables were presented as means ± standard deviations; differences between groups were analyzed by Student's t-test. Categorical variables were presented as frequencies and percentages; differences between groups were evaluated by the chi-square test or Fisher's exact test. DeLong’s test was used to compare prediction model performances. Statistical analysis was performed using SPSS version 23.0 software (IBM Corp., Armonk, NY, USA).
Results
Patient characteristics
This study included 1473 patients (1049 [71.22%] men). Of these patients, 317 (21.5%) were diagnosed with CTO. Table 1 summarizes the patients’ clinical characteristics. For each patient, 83 variables were collected, including demographic characteristics, clinical findings, laboratory test results, and echocardiography results. Compared with the non-CTO group, the CTO group had higher percentages of men and current smokers. Additionally, the CTO group had comparatively higher values for white blood cells, neutrophil percentage (NE%), monocytes, eosinophils, aspartate transaminase, triglycerides, low-density lipoprotein cholesterol, non-HDL-C, urea, creatinine, uric acid, homocysteine, creatine kinase-MB, potassium, brain natriuretic peptide (BNP), prothrombin time, international normalized ratio, fibrin/fibrinogen degradation products, fibrinogen, D-dimer, atherogenic index of plasma, TyG, MONO/LYM, and LVEDD. Conversely, the CTO group had comparatively lower values for systolic blood pressure, platelets, lymphocyte percentage, plateletcrit, HDL-C, estimated glomerular filtration rate, and EF.
Variable selection
For identification of the most important characteristics, three machine learning models were used to select variables. The results are presented in Figure 1, which shows the relationship between ROC value and variable number. The PLS-DA model had the highest ROC value with 10 variables (Figure 1a), the RF model had the highest ROC value with 42 variables (Figure 1b), and the SVM model had the highest ROC value with 20 variables (Figure 1c). As the number of variables increased to 83, the ROC values remained stable.

Relationships between receiver operating characteristic curve value and number of variables in (a) partial least squares discriminant analysis (PLS-DA), (b) random forest (RF), and (c) support vector machine (SVM) models for chronic total occlusion (CTO) prediction. AUC, area under the curve; CI, confidence interval.
Key variables
Key predictors in the three models were identified according to Gini impurity (Figure 2). In the PLS-DA model, the top five predictors were BNP (pg/mL), LVEDD (mm), EF (%), neutrophils (109/L), and lymphocyte percentage with relative importance scores of 2.59, 2.31, 2.29, 2.19, and 2.07, respectively (Figure 2a). In the RF model, the top five predictors were BNP (pg/mL), LVEDD (mm), EF (%), neutrophils (109/L), and sex with relative importance scores of 7.14, 6.90, 4.62, 4.46, and 4.25, respectively (Figure 2b). In the SVM model, the top five predictors were prothrombin time percentage, sex, TyG, plateletcrit (%), and BNP (pg/mL) with relative importance scores of 0.50, 0.44, 0.37, 0.35, and 0.29, respectively (Figure 2c).

Variable importances for chronic total occlusion (CTO) prediction in (a) partial least squares discriminant analysis (PLS-DA), (b) random forest (RF), and (c) support vector machine (SVM) models
Risk factor analysis
The Venn diagram (Figure 3a) shows that the predictor dataset comprised 83 variables: 21 were unique to the RF model, five were unique to the SVM model, 11 were present in both the SVM and RF models, and six were present in both the PLS-DA and RF models. Importantly, four variables were present in all three models: sex, NE%, creatinine, and BNP (Figure 3b).

Potential risk factors for chronic total occlusion (CTO) in three machine learning models. The Venn diagram (a) and UpSet plot (b) identified four potential risk factors for CTO that were shared among all models.
Model performance and validation
As illustrated in Figure 4, the number of variables was chosen according to the highest ROC value for each model. For the PLS-DA model, the selection of 10 variables resulted in an internally validated ROC (95% CI) value of 0.706 (0.659–0.749) (Figure 4a). For the RF model, the selection of 42 variables resulted in an internally validated ROC (95% CI) value of 0.702 (0.653–0.749) (Figure 4b). For the SVM model, the selection of 20 variables resulted in an internally validated ROC (95% CI) value of 0.696 (0.655–0.741) (Figure 4c).

Receiver operating characteristic curves of (a) partial least squares discriminant analysis (PLS-DA), (b) random forest (RF), and (c) support vector machine (SVM) models for chronic total occlusion (CTO) prediction in the internal validation set AUC, area under the curve; CI, confidence interval.
Comparison of ROC curves among models
Model performance was further characterized using DeLong’s test to assess the area under the ROC in the internal validation cohort (Figure 5). This assessment revealed no differences among the three models (P = 0.97 for PLS-DA vs. RF; P = 0.80 for PLS-DA vs. SVM; P = 0.82 for RF vs. SVM).

Comparison of area under the receiver operating characteristic curve values among partial least squares discriminant analysis (PLS-DA), random forest (RF), and support vector machine (SVM) models.
Discussion
In this study, we used three machine learning models to predict CTO development on the basis of patients’ clinical and demographic characteristics, as well as their biochemical parameters and echocardiography findings. The results showed that the PLS-DA model had the highest accuracy in predicting CTO development, with an ROC value of 0.706. Furthermore, four variables (sex, NE%, creatinine, and BNP) were present in all three models; they may comprise major risk factors for CTO development. These variables can easily be measured, and they may help clinicians to identify patients with higher CTO risk, thereby facilitating earlier intervention and improving management.
The emergence of computational methods based on machine learning algorithms has enabled the development of predictive models that use large datasets with multiple variables. 9 Each machine learning algorithm has unique strengths and limitations. 10 PLS-DA, RF, and SVM are the most commonly used machine learning algorithms. 11 In the present study, we compared the CTO prediction performances of these algorithms.
PLS-DA is an algorithm commonly used for supervised classification tasks. 12 In PLS-DA, categorical variables are regarded as dependent variables to explore linear relationships with the independent variables. This method is particularly useful for datasets with high-dimensional variables and limited sample sizes because it can extract meaningful information from a large number of variables and identify the most important variables for classification. 13
RF, a classification algorithm based on decision trees, 14 functions by generating multiple decision trees that use randomly selected subsets of characteristics and observations. This method is suitable for tabular data containing both continuous and categorical variables; it can rapidly create an optimal prediction or classification model. 15 A key advantage of RF is its ability to reduce overfitting by extracting a subset of data via sampling, then generating decision trees that are independent of each other and based on small numbers of variables. 16 This approach reduces the cost function; it improves prediction results by majority voting and evaluating the importance of independent variables. In an RF model, each decision tree represents a class prediction; the class choice made by the greatest proportion of trees reflects the model’s prediction. 17
SVM, a common supervised classification algorithm, can be linear or non-linear. 18 It is designed to identify optimal decision boundaries between classes by transforming input variables into a high-dimensional space, where the optimal boundary can be obtained via maximum margin criteria. 19 When classes cannot be separated in a linear manner, the algorithm uses a kernel function to map the variables into a higher dimensional space. The hyperplane in this high-dimensional space becomes the decision boundary in the original variable space. 20
We trained the above machine learning models based on input variables including clinical and demographic characteristics, biochemical parameters, and echocardiography findings. Generally, model error decreases as the number of included variables increases, but excessive inclusion of variables does not provide any practical benefit in clinical practice. 21 To optimize model efficiency, we compared the number of variables with the highest ROC value for each algorithm. As shown in Figure 1, use of the top 10, 42, and 20 important variables in the PLS-DA, RF, and SVM models, respectively, led to better performance compared with the use of all variables in the corresponding models. Among the three models, PLS-DA had the best CTO prediction ability and required the fewest number of variables, leading to greater convenience in clinical settings. 22
This study was performed to identify key risk factors associated with coronary artery lesion progression to a CTO, a phenomenon that remains poorly understood despite the known associations of traditional CAD risk factors with disease occurrence. 23 Previous research has mainly focused on stable CAD or acute coronary syndrome 24 ; there has been limited information regarding CTO. To determine variable importances, the Gini criterion was used to consider all possible variable combinations in each machine learning model 25 ; this approach identified sex, NE%, creatinine, and BNP as potential critical risk factors for CTO development. Considering that the recanalization of a completely occluded vessel requires substantial time and resources, 26 there is a need to prevent CTO development in patients with CAD.
Overall, this study explored novel risk factors for progression from CAD to CTO; it also developed prediction models based on machine learning algorithms. Analyses of clinical and demographic characteristics, biochemical parameters, and echocardiography findings showed that sex, NE%, creatinine, and BNP, were critical risk factors for CTO development. The best prediction model was PLS-DA, which demonstrated high accuracy in the internal validation set. These findings highlight potential applications of machine learning models in understanding CTO risk factors; such models offer a practical tool for diagnostic prediction before CAG.
This study had a few limitations. First, it was conducted at a single center and lacked an external validation cohort, which might reduce the generalizability of the machine learning models. Second, no physiological or coronary computed tomography angiography assessments were conducted prior to CAG. Finally, the study only included patients with unstable angina pectoris, which may have led to information bias because it permitted higher risk of outcome misclassification.
Conclusions
In this study, we developed and validated three machine learning prediction models for CTO in patients with unstable angina pectoris using demographic characteristics, biochemical parameters, and echocardiography findings. The results showed that the PLS-DA model had the best prediction performance and required the smallest number of variables. Furthermore, sex, NE%, creatinine, and BNP were identified as potential risk factors for progression from CAD to CTO. Despite the limitations of the study, our findings provide useful insights for future research. Further studies with larger patient samples and other relevant variables are needed to improve the accuracies of our prediction models, thereby facilitating early diagnosis of CTO in patients with unstable angina pectoris.
Footnotes
Acknowledgement
We thank Jesse Luo for assistance with manuscript preparation.
Author contributions
YS and JL conceived the study and designed the protocol. YS, YL, and ZC analyzed the data and wrote the manuscript. YS and WJ were responsible for study selection, data extraction, and evaluation of study quality. JL critically reviewed the manuscript. All authors read and approved the final manuscript.
Availability of data and materials
The datasets used during the study are available from the corresponding author on reasonable request.
Declaration of conflicting interests
The authors declare that there is no conflict of interest.
Funding
This work was supported by the National Natural Science Fund of China (Nos. 82200441, 81970291, and 82170344), the Beijing Hospitals Authority Youth Programme (No. QML20230607), the Young Elite Scientists Sponsorship Program by BAST (No. BYESS2023238), and the Major State Basic Research Development Program of China (973 Program, No. 2015CB554404).