
Abstract
Objective
To differentiate gastric leiomyomas (GLs) and gastric stromal tumors (GSTs) based on preoperative enhanced computed tomography characteristics.
Methods
Twenty-six pathologically confirmed GLs were propensity score-matched to 26 GSTs in a 1:1 ratio based on sex, age, tumor site, and tumor size. Tumor shape and contour, mucosal ulceration, growth pattern, enhancement pattern and degree, longest diameter, and longest diameter/vertical diameter ratio were compared between the groups. Hemorrhage, calcification, peripheral invasion, and distant metastasis were also included in the regression analysis for differentiation of the two tumors.
Results
Mucosal ulceration was significantly more frequent in GSTs than GLs. The enhancement degree of GSTs was significantly higher than that of GLs in the arterial and portal venous phases. Using enhancement degrees of 18 HU and 23 HU in the arterial phase and venous phase as cutoff values, respectively, we found that an enhancement degree of <18 HU in the arterial phase was an independent influential factor for diagnosis of GLs. No significant differences were found in other morphological characteristics. GLs did not metastasize or invade adjacent tissues.
Conclusion
A low enhancement degree in GLs is the most valuable quantitative feature for differentiating these two similar tumors.
Keywords
Introduction
Because gastric stromal tumors (GSTs) have been differentiated from gastric leiomyomas (GLs) through immunohistochemical techniques, GLs are considered rare benign submucosal neoplasms. 1 GLs mostly occur in the cardia or fundus of the stomach and are lobulated, hypoattenuating, and nonenhancing mass-like lesions.2,3 Leiomyomas are pathologically defined as paucicellular spindle cell tumors with low or moderate cellularity that are typically strongly positive for smooth muscle actin and negative for CD34 and CD117. 1 Although GLs are rare, their morphology is similar to that of GSTs on pathology and imaging, which can easily cause misdiagnosis. Unlike GLs, GSTs are the most common submucosal tumors of the gastrointestinal tract, and approximately 60% to 70% of GSTs occur in the stomach. 4 Approximately 90% of submucosal tumors in the stomach are GSTs. GSTs are different from other submucosal tumors of the stomach in that they are potentially malignant. They may invade surrounding tissues or metastasize to the abdominal cavity and liver. 5 Common surgical treatments for gastric submucosal tumors include endoscopic and laparoscopic resection.6,7 Although endoscopic biopsy plays a key role in diagnosing gastric submucosal tumors, multiphase contrast-enhanced computed tomography (CT) has advantages in evaluating the tumor location, tumor characteristics, invasion to surrounding tissues, and distant metastasis. 8 Applying CT in addition to endoscopic biopsy before the initiation of treatment for submucosal tumors will provide great clinical value.
Although previous studies have summarized the CT findings of GLs, 9 the effects of confounders such as tumor size and location have rarely been considered in the differential diagnosis of GSTs.10,11 In this study, 1:1 case matching was used to eliminate the influence of confounders such as tumor location, tumor size, and patient sex, and the imaging features of GLs and GSTs were compared to evaluate the ability of multiphase contrast-enhanced CT to distinguish the two tumors.
Methods
Study population
This retrospective study was approved by the Medical Ethics Committee of the Fourth Hospital of Hebei Medical University (ethics approval number 2023ks011), and the requirement for informed consent was waived. We have de-identified all patient details. The article complies with the STROBE specifications and follows the relevant EQUATOR guidelines. 12
We identified 36 patients with GLs and 216 patients with GSTs from January 2015 to January 2021 as confirmed by surgical pathology and immunohistochemical examinations. The inclusion criteria were (1) complete pathological records confirming the diagnosis of GL or GST, (2) high-quality preoperative multiphase contrast-enhanced CT images of the upper abdomen with 1.0 to 1.5 mm slices for imaging reconstruction, and (3) clearly displayed tumors larger than 1 cm on CT images. Figure 1 shows the sample selection procedure, which identified 213 GSTs and 35 GLs. To diminish the influence of biasing factors, we performed 1:1 propensity score matching to pair the two groups of patients based on four characteristics: sex, age (±3 years), tumor location, and the tumor’s longest diameter (LD) (±30%). Ultimately, 26 cases in each group were included in the study.

Flowchart showing the recruitment of patients and the overall design of this retrospective study
CT image acquisition
Abdominal contrast-enhanced CT examinations were performed using multidetector-row CT (MDCT) systems, including the Brilliance iCT (Philips, Best, the Netherlands), SOMATOM Definition Flash (Siemens Healthcare, Erlangen, Germany), and LightSpeed 32 (GE Healthcare, Chicago, IL, USA). Patients were instructed to fast for at least 4 to 6 hours before the CT examination. At 10 to 30 minutes before scanning, the patients received an intramuscular injection of 10 mg of anisodamine to reduce peristalsis of the gastrointestinal tract and then immediately drank 500 to 1000 mL of water to fully expand the stomach. The MDCT scanning parameters were as follows: detector configuration, 0.625 to 1 mm; pitch, 0.891 to 1.35; rotation time, 0.5 to 0.75 seconds; 120 kVp; and 150 to 250 mAs. MDCT images were reconstructed with a slice thickness and reconstruction interval of 3 mm. For three-dimensional reconstruction, MDCT images were reconstructed with a slice thickness and reconstruction interval of 1.0 to 1.5 mm. In addition to axial MDCT images, coronal and sagittal multiplanar reformatted images were captured.
Image analysis
Qualitative analysis
One of the authors did not interpret the images and was responsible only for recording the patients’ baseline characteristics, clinical data, and pathological results. Two senior radiologists jointly interpreted the CT images without knowledge of the patients’ clinical data and performed a qualitative analysis of each lesion (Table 1). To compare the imaging characteristics of the two tumors, we analyzed the following CT features: (a) tumor location, (b) tumor shape, (c) lesion edge, (d) growth pattern, (e) presence of mucosal ulcerations, (f) calcification, (g) hemorrhage, (h) peripheral lymph node enlargement, (i) invasion to adjacent tissues, and (g) distant metastasis. The tumor site was divided into three categories: the cardia and fundus of the stomach, the body of the stomach (the gastric angle was considered part of the body of the stomach), and the antrum of the stomach. We divided the tumor shape into two types: round-like and irregular. Dumbbell-shaped and lobulated shapes were considered irregular. The tumor edge was divided into two categories: well-defined and poorly defined. According to the description provided by Kim et al., 11 the growth pattern was classified as endoluminal, exoluminal, or mixed. Because no ring-enhancing lesions were found in any patients, we categorized the enhancement pattern as homogeneous or heterogeneous in the portal venous phase. Based on the presence of mucosal ulceration on one side of the gastric lumen, the tumors were divided into those with a regular surface and those with mucosal ulceration. Tumor hemorrhage was identified by the presence of fresh bleeding on CT images or gastroscopy. Invasion to adjacent tissues, tumor-draining lymph nodes larger than 5 mm, and distant metastasis were also recorded.
Baseline clinical characteristics and tumor-specific computed tomography characteristics of GLs and GSTs before and after 1:1 propensity score matching.

Data are presented as median (range), n (%), or mean ± standard deviation.
GLs, gastric leiomyomas; GSTs, gastric stromal tumors; LD, longest diameter; VD, vertical diameter; AE, enhancement in arterial phase; PE, enhancement in portal venous phase.
Quantitative assessment
The items assessed are defined in Table 1. Multiplanar reconstruction of the tumor was completed by three-dimensional reconstruction technology using the thin-layer, portal venous phase images of the tumors. The LD and vertical diameter (VD) of the largest cross section on the reconstructed images were measured, and the LD/VD ratio was calculated and recorded. In heterogeneously enhancing lesions, the degree of enhancement was determined by the most strongly enhanced area in the portal venous phase. In homogeneously enhancing lesions, the area of interest was chosen from the plane in which the largest lesion area was found, and the largest possible area was delineated while excluding the edge of the tumor. CT values in the arterial and portal venous phases were obtained by calculating the difference in the degrees of enhancement between the arterial/portal venous phases and plain scans.
Statistical analysis
Statistical analysis was performed with SPSS Version 23 (IBM Corp., Armonk, NY, USA). The propensity score-matching program in SPSS was used to perform 1:1 matching based on the four variables of patient age, patient sex, tumor location, and tumor size, thereby eliminating the influence of the above confounders on the differential diagnosis of the two tumors. The Mann–Whitney U test, Pearson’s chi-square test, and Fisher’s exact test were used to evaluate differences in age, sex, and tumor-specific features between the two submucosal tumors. A receiver operating characteristic curve was used to calculate the sensitivity and specificity across different combinations of the two tumors’ enhancement degrees in the arterial and portal venous phases to determine the best cutoff value for distinguishing GLs and GSTs. According to the cutoff value, the continuous variable of the tumor enhancement degree was converted into a binary variable and incorporated into the regression model. Variables with a P value of <0.1 in the bivariate analysis were included in the multivariate regression models. Conditional logistic regression analysis was used to determine independent CT features that distinguish GLs from GSTs. In all tests, a P value of <0.05 was considered indicative of a significant difference. A statistical diagram was depicted by GraphPad Prism 8.0 (GraphPad Software, San Diego, CA, USA).
Results
Characteristics of study population
Before matching, the age and sex of the patients in the two groups were significantly different. The GL group had more women (25/35, 71.4%), whereas the numbers of men and women were similar in the GST group (114 and 99, respectively). Although the median age of the patients in both groups was >50 years, the age at onset ranged from ≥20 to ≥80 years in both groups. Finally, 26 patients with GLs (mean age, 49.88 ± 9.59 years; range, 29–72 years) and 26 patients with GSTs (mean age, 51.15 ± 11.2 years; range, 23–71 years) were included in our study (Table 1).
Comparison of CT features between GLs and GSTs
The CT features of GLs and GSTs are summarized in Table 1. GSTs were generally much larger than GLs (5.47 ± 3.69 vs. 3.02 ± 1.23 cm, respectively; P < 0.001). Among all cases, the maximum LD of GLs and GSTs was 7.21 and 20.8 cm, respectively. No significant difference in the post-matching tumor size was observed. Before matching, most GLs were located in the cardia and fundus of the stomach (29/35, 82.9%), with only one case occurring in the antrum; in comparison, 53.5% of GSTs were located in the fundus and cardia (114/213). The chi-square test indicated significant differences between the two groups in the categorical variables of arterial-phase enhancement (χ2 = 12.410, P < 0.001) and venous-phase enhancement (χ2 = 9.433, P = 0.002) (Table 2). Variables that were statistically significant in the difference analysis, namely the surface (Figure 2), arterial-phase enhancement, and portal-phase enhancement (Figure 3), were included in the binary logistic regression for influential factor selection. Arterial-phase enhancement was selected by the binary logistic regression model as an independent predictor of the diagnosis of GLs (Table 3 and Figure 4). When the degree of enhancement in the arterial phase was <18 HU, the possibility of GLs increased significantly (odds ratio, 12.776; 95% confidence interval, 1.270–128.535).
Analysis of differences in the four groups of variables between GSTs and GLs.

Data are presented as n (%).
GSTs, gastric stromal tumors; GLs, gastric leiomyomas; AE, enhancement in arterial phase; PE, enhancement in portal venous phase.

(a) Images of a 60-year-old woman with a GST. Coronal multiplanar reformation of contrast-enhanced computed tomography shows a submucosal endophytic tumor of the cardia (black arrow) with an ulcerated surface (white arrow). (b) Hematoxylin–eosin staining (10× objective magnification) showed a GST mainly composed of spindle-shaped cells. (c) Images of a 38-year-old man with a GL. Coronal multiplanar reformation of contrast-enhanced computed tomography showed an oval-like submucosal endophytic tumor of the cardia (black arrow) with an ulcerated surface (white arrow), and calcification points (black arrowhead) can be seen in the lesion and (d) Hematoxylin–eosin staining (10×) showed eosinophilic spindle cells with blunt nuclei at both ends, and the cells were arranged in a braided shape.

ROC curves for enhancement in the arterial and portal venous phases in predicting the optimal stage value were (a) 18 HU and (b) 23 HU, respectively.
Binary logistic regression screening for influential factors.
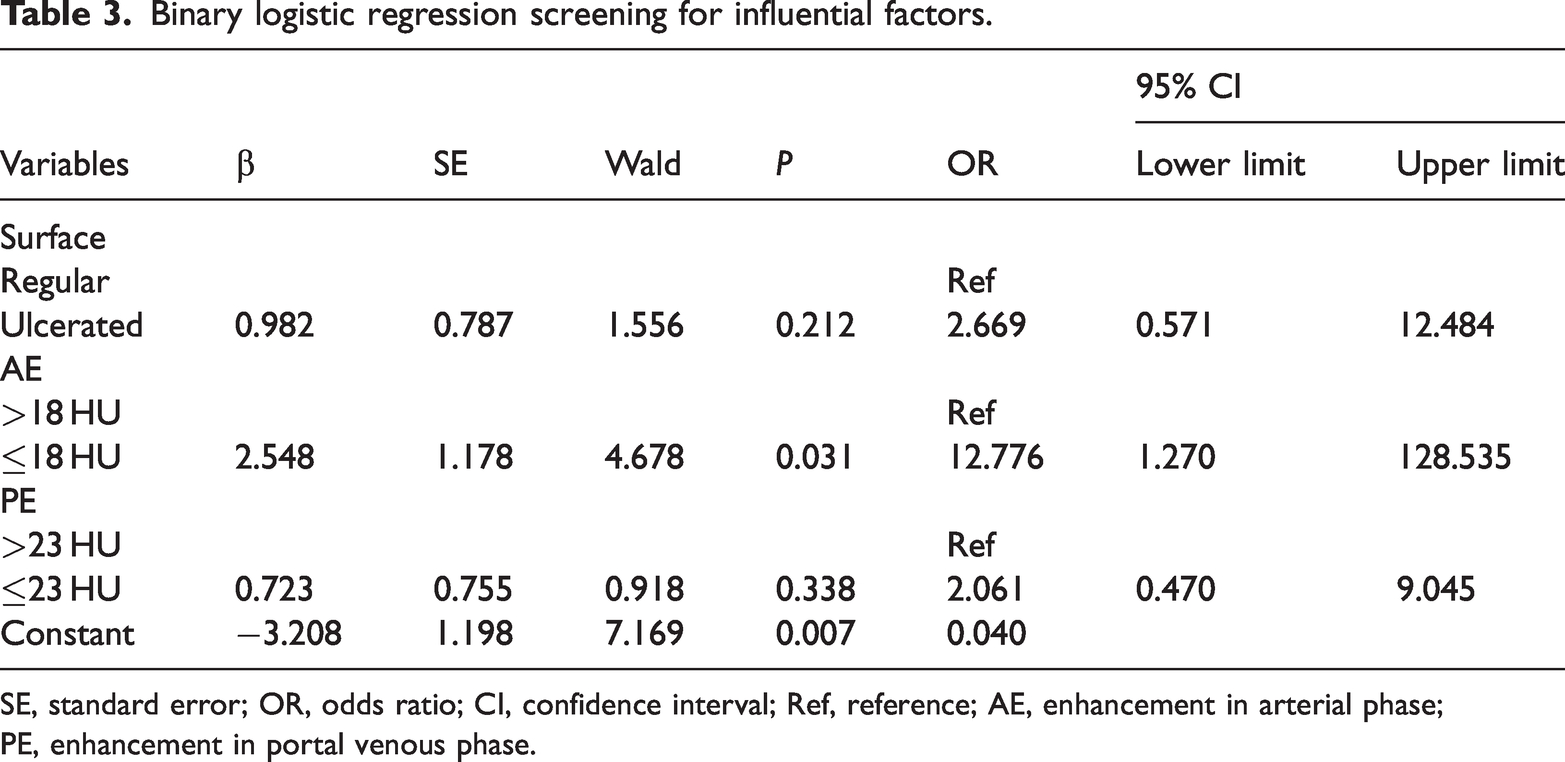
SE, standard error; OR, odds ratio; CI, confidence interval; Ref, reference; AE, enhancement in arterial phase; PE, enhancement in portal venous phase.

Stacked chart of the distribution between the case group (gastric leiomyomas) and control group (gastric stromal tumors) of (a) surface indicators, (b) enhancement in the arterial phase, and (c) enhancement in the portal venous phase. The surface indicators (P = 0.032), enhancement in the arterial phase (P < 0.001), and enhancement in the portal phase (P = 0.002) were significantly different between the case and control groups.
No significant difference was found in the post-matching tumor morphology, tumor edge, enhancement heterogeneity, or growth pattern between the two groups. The LD/VD ratio was still not significantly different between GLs and GSTs after matching (1.41 ± 0.42 vs. 1.34 ± 0.30 cm, respectively). In addition, no significant difference was noted in hemorrhage, calcification, or metastasis. The GST group had 10 cases of metastasis and 9 cases of invasion to surrounding organs before matching, while only 1 case of metastasis was identified after matching. The GL group had no cases of invasion or metastasis.
Discussion
It is sometimes difficult to obtain definitive results regarding the origin of gastric submucosal tumors on endoscopic ultrasound. Our study showed that CT could not clearly distinguish the structure of gastric parietal tissue or the origin of gastric submucosal tumors. Although a small number of gastric submucosal tumors, such as gastric glomus tumors, have typical features with respect to the enhancement pattern, 13 most gastric submucosal tumors show progressive enhancement on contrast-enhanced CT scans. Therefore, distinguishing the two tumors by the enhancement pattern is difficult. The most important conclusion drawn in this study is that the enhancement degree of GSTs is significantly higher than that of GLs in both the arterial and portal venous phases. In particular, the enhancement degree in the arterial phase can be used as an independent factor to differentiate the two tumors. A higher tumor enhancement degree in the arterial phase corresponds to a greater possibility of a GST. An enhancement degree of >18 HU is very helpful to exclude a diagnosis of GL. Similar results were obtained with contrast-enhanced ultrasonography in a study by Kamata et al. 14 and with biphasic contrast-enhanced CT. 10 The cutoff value obtained through our receiver operating characteristic curve analysis had some specificity and sensitivity in differentiating the two tumors; however, the value inevitably varies across different studies. 10 Although simply using the cutoff values of enhancement degrees in the arterial and venous phases is not advisable in practical work, the different enhancement patterns of the two tumors can be referenced to distinguish the two tumor types. In addition, although our statistical analysis ruled out the enhancement degree in the portal venous phase as an independent influential factor, the CT attenuation value in the portal venous phase was increased by only 33 HU in the most strongly enhancing GL. Therefore, GLs show mild to moderate degrees (enhancement of <40 HU) of progressive enhancement that is lower than that of GSTs.
GSTs are large, heterogeneous, and potentially invasive. 5 These characteristics were significantly different from those of GLs in the present study (Table 1). However, these differences disappeared after matching. We believe that the heterogeneity of GSTs is related to tumor size. After matching, larger GSTs were excluded from the analysis; thus, heterogeneous enhancement was no longer obvious in the GST group. Similar results were reported by Wei et al. 15 Their study showed that larger and irregular tumors had higher malignancy grades. In a study by Wang et al., 10 GSTs measuring <5 cm still showed higher heterogeneity than GLs; however, our study showed that these two tumors of similar sizes are difficult to distinguish by the presence of a homogeneous enhancement pattern. The difference in the results may be due to the 1:1 propensity score-matching analysis performed in our study, which eliminated interference from confounders to a certain extent.
GLs are more likely to occur in the cardia and fundus of the stomach, which is consistent in the cases that we collected. In our study, 82.9% of GLs occurred in the cardia and fundus of the stomach; however, we do not believe that this feature is helpful for differentiating gastric submucosal tumors in the cardia and body of the stomach. We found that the overall incidence of GSTs was much higher than that of GLs, which has also been confirmed by numerous postoperative pathological reports.6,7 Although a tumor may have a predisposition for a specific site in some cases, the tumor site was considered a confounder in our study and thus excluded from the analysis. Therefore, we classified lesions in the cardia or fundus of the stomach into the same group. Kim et al. 11 used an LD/VD ratio of 1.4 as an important basis to distinguish ectopic pancreas from GLs and GSTs. However, the average LD/VD ratio of GLs in our study was 1.4, possibly because some of the lesions were located in the cardia or had irregular shapes. Therefore, the morphological characteristics of the two tumors are very similar and cannot be used as a basis for the differential diagnosis. Xu et al. 16 proposed a very interesting scoring system to distinguish these two tumors, thus providing a valuable solution. Their research showed that the tumor site, necrosis, and LD/VD ratio with a diameter of <5 cm were statistically significant; however, the influence of other confounding factors was not controlled. Whether a scoring system that does not strictly eliminate confounders is reliable remains to be further investigated. In addition, the establishment of scoring systems and radiomics studies should be based on a large amount of imaging data and multicenter research. Additionally, the number of radiomics studies of gastric submucosal tumors is limited,17–19 most of these studies lack sufficient data, and the reliability of the results requires further verification. This study did not use radiomics methods to differentiate rare tumors.
Our study has three main limitations. First, because this was a single-center study of differential diagnosis based on imaging findings of relatively rare gastric submucosal tumors, the number of cases was small. However, as a regional cancer center, the number of cases that our hospital can collect is still higher than that at most other research centers.20–22 Second, because this was a retrospective study, the CT values obtained from the different models of CT equipment inevitably varied. However, because our department has always used the same enhancement plan in upper abdominal CT scans, we do not believe that the difference in equipment models had a significant impact on our final results. Third, because GLs are rare (with an incidence of only about 10% of cases in our study), variability was objectively present in this retrospective case–control study of the two tumors. We excluded the influence of some factors by using the statistical method of 1:1 propensity score matching and used morphologic and enhancement features as much as possible as the main basis for distinguishing the two tumors.
To summarize, GL is a rare gastric submucosal tumor that often occurs in the fundus or cardia of the stomach. The differential diagnosis between GLs and GSTs with similar sizes at this site is difficult. If a tumor is <5 cm in diameter and the enhancement degree in the arterial and venous phases is <20 HU, then the lesion is more likely to be a GL than a GST.
Footnotes
Author contributions
Lijia Wang and Qi Wang carried out the study, participated in the data collection, and drafted the manuscript. Qi Wang, Xiaohui Qi, and Gaofeng Shi performed the statistical analysis and participated in its design. Xiang Liu, Qiao Xie and Yifeng Wang participated in the data acquisition, analysis, or interpretation and drafted the manuscript. All authors read and approved the final manuscript.
Data availability statement
All data generated or analyzed during this study are included in this published article.
Declaration of conflicting interests
The authors declare that there is no conflict of interest.
Funding
This research received no specific grant from any funding agency in the public, commercial, or not-for-profit sectors.