
Abstract
Objective
To identify susceptibility modules and genes for colorectal cancer (CRC) using weighted gene co-expression network analysis (WGCNA).
Methods
Four microarray datasets were downloaded from the Gene Expression Omnibus database. We divided the tumor samples into three subgroups based on consensus clustering of gene expression, and analyzed the correlations between the subgroups and clinical features. The genetic features of the subgroups were investigated by gene set enrichment analysis (GSEA). A gene expression network was constructed using WGCNA, and a protein–protein interaction (PPI) network was used to identify the key genes. Gene modules were annotated by Gene Ontology and Kyoto Encyclopedia of Genes and Genomes enrichment analyses.
Results
We divided the cancer cases into three subgroups based on consensus clustering (subgroups I, II, III). The green module identified by WGCNA was correlated with clinical characteristics. Ten key genes were identified according to their degree of connectivity in the protein–protein interaction network: FYN, SEMA3A, AP2M1, L1CAM, NRP1, TLN1, VWF, ITGB3, ILK, and ACTN1.
Conclusion
We identified 10 hub genes as candidate biomarkers for CRC. These key genes may provide a theoretical basis for targeted therapy against CRC.
Keywords
Introduction
Colorectal cancer (CRC) is one of the most prevalent malignant tumors worldwide. It is the third leading cause of cancer-related death in the United States 1 and the second leading cause worldwide, leading to an estimated more than 1.9 million cases and 935,000 deaths in 2020. 2 Despite combined surgery, chemotherapy, and radiotherapy, 3 CRC is still responsible for major mortality every year. 4 Most cancer-related deaths result from late distant metastases, underlining the importance of diagnosing tumors at an early stage. 5 At present, the diagnosis of CRC mainly relies on colonoscopy, while other tests designed to discover early lesions, such as occult blood tests, fecal immunochemical tests, and more recent fecal DNA testing (Multitarget stool DNA, Cologuard®) 6 still have difficulties. There is thus a need to identify both effective biomarkers to distinguish cancer patients and hub genes to predict patient progress and prognosis.
Bioinformatics has played an increasingly significant role in numerous fields, and along with the fast development of high-throughput sequencing technology,7,8 has frequently been used to identify biomarkers.9,10 However, several studies have focused on differences in gene expression between samples, rather than exploring the underlying connections among genes.11,12
Weighted gene co-expression network analysis (WGCNA) is used to study gene expression patterns and incorporate genes with similar expression patterns into the same modules. In this study, assuming that the gene expression network followed a scale-free distribution, we constructed a gene co-expression network using the WGCNA algorithm 13 and then created a hierarchical clustering tree according to the dissimilarity coefficients of different nodes. Furthermore, we sorted high-similarity genes into the same modules and low-similarity genes into different modules and visualized these modules. This study supports the classification of patients with CRC into subgroups to aid individualized therapy, and identifies a key gene module correlated with clinical factors for diagnosis and treatment.
Materials and methods
Raw data
The flowchart for this study is shown in Figure 1. Transcriptome RNA-seq data for four CRC arrays (GSE106582, GSE41258, GSE44076, GSE87211) (Table 1) and the corresponding clinical information were downloaded from the Gene Expression Omnibus database (GEO, http://www.ncbi.nlm.nih.gov/geo/). The selection criteria were as follows: 1) gene expression data for CRC and normal mucosa samples (normal tissue samples from polyps were excluded); 2) arrays containing a minimum of 50 tumor and normal mucosa samples; and 3) inclusion of >5,000 genes in the GEO platform.

Flow chart of data preparation and analysis.
Characteristics of the microarray datasets.

The GEO is a public database and patients included in the database have provided ethical approval for use of their data for research and publication. This study was based on open-source data and there was therefore no need for ethics approval or informed consent.
Consensus clustering
The four samples from the GEO database were normalized by principal component analysis (PCA) using the R package “PCA”, 14 and the tumor patients in the four samples were divided into three clusters using the “ConsensusClusterPlus” package 15 according to the gene expression mode.
Comparison of clinical traits among consensus clusters
The clinicopathological data for the patients in the four samples were downloaded from the GEO database and the clinical traits were compared among the three clusters by consensus clustering using the “ggpubr” R package. P < 0.05 was considered statistically significant.
WGCNA
The R package “WGCNA” was applied to the four samples from the GEO database to construct a gene co-expression network. 13 An adjacency matrix was transformed into a topological overlap matrix (TOM) and genes were divided into several modules according to the TOM-based dissimilarity measure. We set a soft-thresholding power of 12 (scale free R2 = 0.9), cut height of 0.3, and minimal module size of 10 to select eight important modules.
Protein–protein interaction (PPI) analysis
The PPI network of genes in the green module was produced by the STRING website (https://string-db.org/) and reconstructed using Cytoscape version 3.6.1. The top 10 ranked protein-coding genes were also selected according to the degree of connectivity according to STRING.
Gene Ontology (GO) and Kyoto Encyclopedia of Genes and Genomes (KEGG) enrichment analyses
GO and KEGG enrichment analyses of 1108 genes from the green module were performed using “clusterProfiler”, 16 “enrichplot”, and “ggplot2” packages. Only terms with both P- and q-values <0.05 were considered to be significantly enriched and then visualized using the “GOplot” 17 package.
Gene set enrichment analysis (GSEA)
The gene sets “h.all.v2022.1.Hs.symbols.gmt”, “c2.cp.kegg.v2022.1.Hs.symbols.gmt”, and “c5.go.v2022.1.Hs.symbols.gmt” were downloaded from the Molecular Signatures Database (MSigDB, http://software.broadinstitute.org/gsea/msigdb/index.jsp) as the reference gene set. The transcriptomic data of the three consensus clusters from the GEO database were subjected to GSEA analysis using the “clusterprofiler” package, and only gene sets with nominal P < 0.05 and false discovery rate q < 0.06 were considered significant. 18
Statistical analysis
The data were analyzed by Wilcoxon’s rank sum and Kruskal–Wallis rank sum tests using R version 4.0.2 (https://www.r-project.org/). Correlations between gene modules and clinical factors were determined by Pearson’s correlation analysis.
Results
Data normalization and consensus clustering of CRC samples
The four microarray datasets (Table 1) and the corresponding clinical information (Table 2) were downloaded from the GEO database and normalized by PCA (Figure 2). Consensus clustering was applied to the cancer transcriptomic data of the datasets, and we chose a value of k = 3 (Figure 3) according to the item consensus scores (Figure 3d) to divide the tumor patients into three subgroups (subgroups I, II, and III). The clear boundaries of the three subtypes indicated that the clustering was reliable (Figure 4a).
Clinical information.
IQR, interquartile range.

Principal component analysis for gene expression distribution. (a) Four gene arrays (GSE106582, GSE41258, GSE44076, GSE87211) from the Gene Expression omnibus database and (b) Four gene groups in (a) were normalized by principal component analysis.

Consensus clustering for gene expression. (a) Genes in the above four samples were divided into three subgroups by consensus clustering (consensus matrix k = 3). (b) Cumulative distribution function (CDF) for k = 2–10. (c) Relative change in area under CDF curve for k = 2–10 and (d) Cluster-consensus plot. Item consensus (IC) is the average consensus value between the subgroup and members of a consensus cluster. Colored bars represent subgroups of certain cluster, with height corresponding to IC values.

Correlation of subgroups with clinical characteristics. (a–f) Correlation of tumor location (cecum, right colon, transverse colon, left colon, sigmoid, rectum) with subgroup and (g–k) Correlation of cancer stage with subgroup. *P < 0.05; **P < 0.01; ***P < 0.001; ns, not significant.
Correlation of consensus clusters with clinical traits
We examined the correlations between the three subgroups identified by consensus clustering and various clinical traits. There were higher proportions of patients with cecum carcinoma in subgroup III, rectal cancer in subgroup I, and sigmoid tumor in subgroup II. Subgroups I and III included more late-stage (stage III, IV) samples (Figure 4).
Identification of key modules based on WGCNA
We identified the key modules of CRC by WGCNA using the four datasets and divided all the genes into eight modules (Figure 5). The heatmap of module–trait correlations indicated that the green module was closely correlated with clinical traits (Figure 5e), especially T stage (Pearson’s correlation coefficient = 0.3, P = 5 × 10⁻²⁶). The green module included 406 genes. Genes in the green module were upregulated in subgroup I (Figure 5f), which included more late-stage patients as noted above.

Identification of important modules correlated with clinical characteristics in samples from the Gene Expression Omnibus (GEO) database based on weighted gene co-expression network analysis. (a) Clustering dendrograms of genes based on RNA-seq data for four arrays (GSE106582, GSE41258, GSE44076, GSE87211) from the GEO database. (b) Analysis of the scale-free fit index (left) and mean connectivity (right) for various soft-thresholding powers. (c) Clustering of module eigengenes. Red line represents cut height (0.25). (d) Dendrogram of all clusters based on dissimilarity measures (1-TOMO). (e) Heatmap of correlation between module eigengenes and clinical characteristics of colorectal cancer. Each cell contains the correlation coefficient and P value and (f) Heatmap of relationship between modules and clusters.
PPI analysis of green module
The PPI network of the proteins encoded by 406 genes in the green module is shown in Figure 6a. The top 10 core genes of the network selected according to the degree of connectivity are presented in Figure 6b and Table 3, including FYN, SEMA3A, AP2M1, L1CAM, NRP1, TLN1, VWF, ITGB3, ILK, ACTN1.

Protein–protein interaction network of genes in green module. (a) Red boxes represent up-regulated genes (darker color indicates higher expression) ; blue boxes represent down-regulated genes and (b) Hub gene cluster of green module.
Top 10 genes in protein–protein interaction network of green module.

GO and KEGG enrichment of modules from WGCNA
GO and KEGG enrichment analyses were used to annotate the modules from WGCNA (Figure 7). GO analysis showed that the green module was enriched in genes associated with biological processes, including extracellular structure organization, extracellular matrix (ECM) organization, cell−substrate adhesion, axonogenesis, cell junction organization, and cell junction assembly. KEGG pathway enrichment analysis showed that this module was significantly enriched in cell adhesion molecules, phosphoinositide 3-kinase/Akt signaling, mitogen-activated protein kinase signaling, ECM−receptor interaction, and focal adhesion. These enriched genes and pathways were considered to be related to modification of cellular interactions.
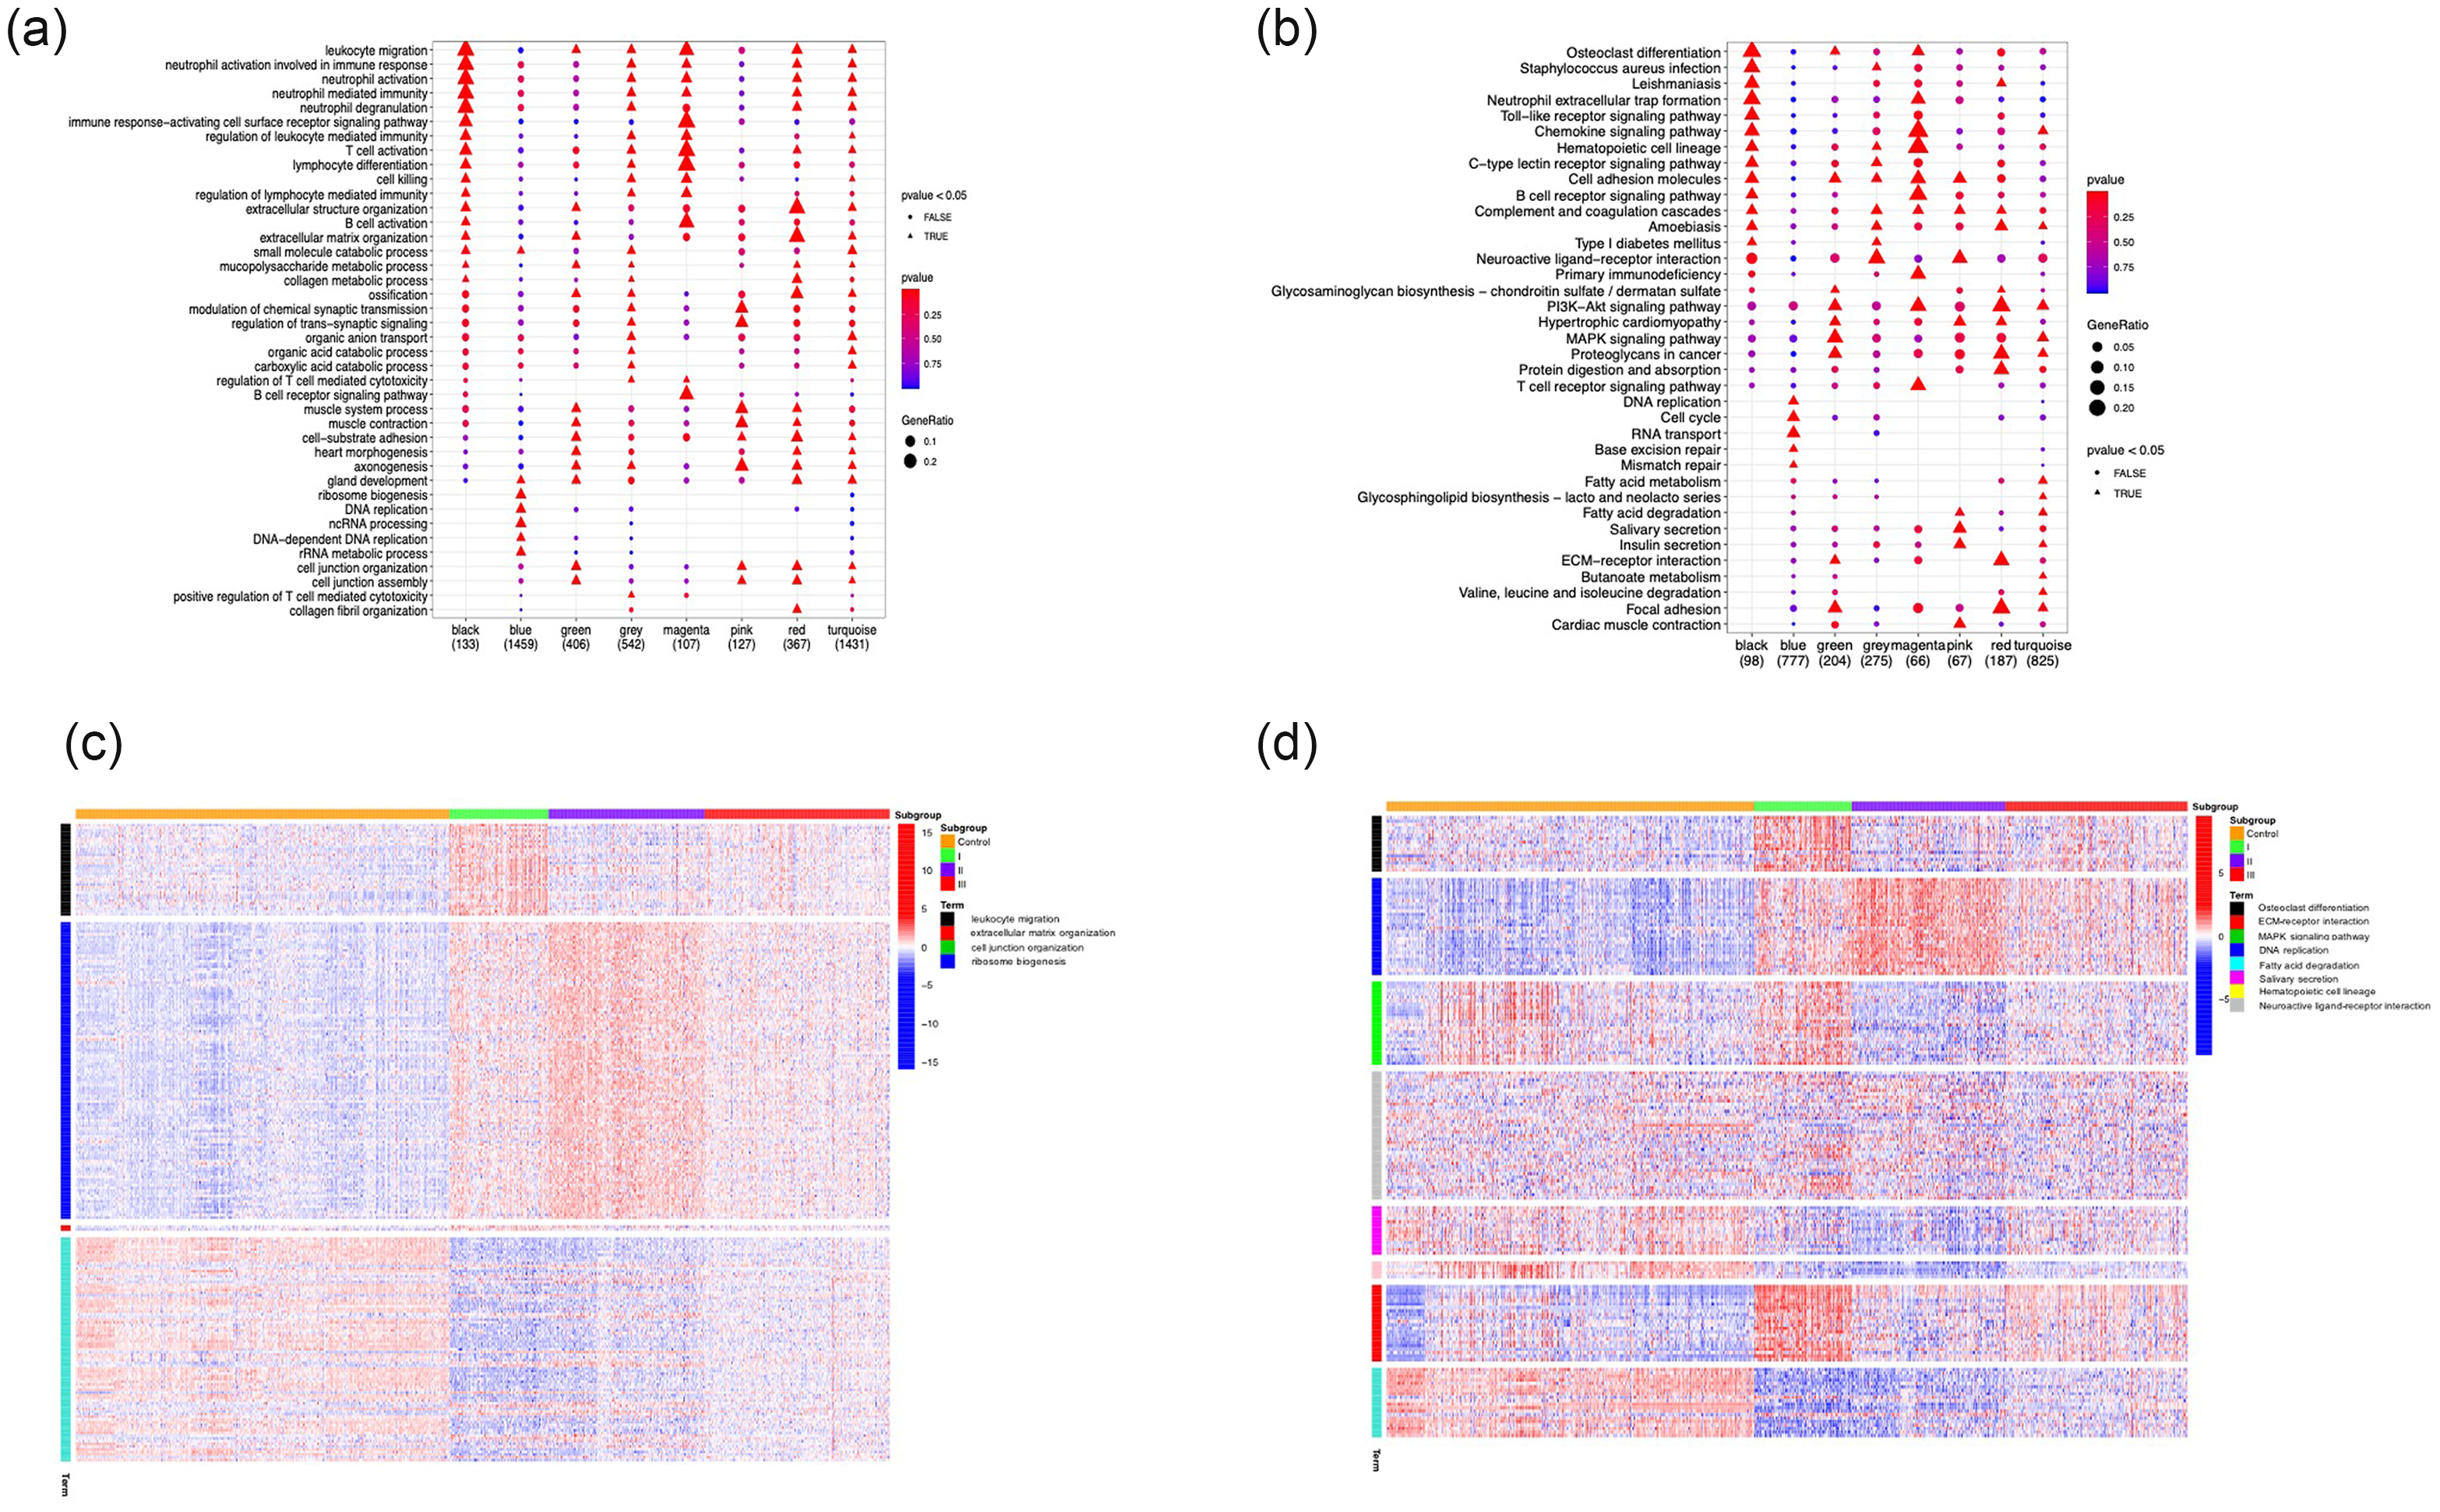
Gene Ontology (GO) and Kyoto Encyclopedia of Genes and Genomes (KEGG) enrichment analyses. (a) GO enrichment and (b) KEGG analysis of genes in modules from weighted gene co-expression network analysis. (c) Heatmap of correlation between enriched pathways in GO enrichment and consensus clusters and (d) Heatmap of correlation between enriched KEGG signaling pathways and consensus clusters.
GSEA for annotation of genes in clusters
GSEA enrichment was applied to investigate the functions of genes in the consensus clusters (Figure 8). Gene sets of calcium-independent cell–cell adhesion via plasma membrane cell adhesion molecules, collagen catabolic process, collagen fibril organization, ECM structural constituent tensile strength, acyl-COA binding, and oxidoreductase activity acting on NADPH oxygen as acceptor were upregulated in subgroup I, while gene sets of mismatch repair were upregulated in subgroup II and positive regulation of mesenchymal cell proliferation, Th1 cell differentiation, and abnormal iron homeostasis were upregulated in subgroup III.

Gene set enrichment analysis was used to annotate the characteristics of genes from clusters. Hallmark genes upregulated in (a) subgroup I, (b) subgroup II, and (c) subgroup III.
Discussion
CRC has long been a major disease burden worldwide, responsible for huge losses in terms of both lives and money; however, the molecular pathogenesis of CRC remains unclear. Tumor heterogeneity means that CRCs respond inconsistently to specific treatments, leading to various detailed classifications of the disease and stratified therapeutic strageties. 19 Consensus molecular subtypes (CMS) is one of the most well-known gene expression-based CRC classifications, which sorts tumors into four clusters: CMS1, microsatellite unstable and strong immune activation; CMS2, marked Wnt and Myc signaling activation; CMS3, evident metabolic dysregulation; and CMS4, prominent transforming growth factor-β activation. 20 However, this clustering mainly focuses on the genetic features of the tumors rather than the clinical characteristics of the patients. In this study, we divided CRCs into three subgroups by consensus clustering and annotated them with clinical factors. The results showed that subgroups I and III contained more late-stage cases and may thus have a higher tendency for local advancement, requiring strict removal of the primary site, e.g., by surgery. There were some differences in the distribution of cancer locations among the subgroups, suggesting a possible correlation between gene expression patterns and tumor location. However, the mechanism of this phenomenon needs further investigation.
GSEA was applied to the subgroups and showed that materials and pathways involved in altering the extracellular microenvironment were upregulated in subgroup I. Overexpression of epithelial cell adhesion molecules, decomposition of collagen, and modification of matrix indicated that tumors in subgroup I may be more likely to metastasize, with decreased intercellular adhesion.21–23 Oxidoreductase and binding of acyl-COA were also enhanced in subgroup I, indicating the possible release of reactive oxygen species, contributing to tumor progression and chemotherapy resistance.24,25 These results suggest that interference with the redox reaction may be a possible therapeutic strategy for patients in subgroup I. 26 The Keynote 177 (NCT02563002) trial found that pembrolizumab could be introduced to first-line therapy for microsatellite instability-high patients, 27 while programmed cell death 1 (PD1) inhibitors are not effective in patients with microsatellite-stable tumors. Mismatch repair-related genes were upregulated in subgroup II, suggesting a possible lack of response to PD-1 inhibitors in this population. Subgroup III showed upregulation of epithelial–mesenchymal transition (EMT), which is an essential factor in cancer progression, associated with aggressive behavior and drug resistance. 28 This group also demonstrated increased genes associated with Th1 cell differentiation, indicating great potential for immune therapy, 29 while abnormal iron homeostasis may provide a breakthrough for novel CRC treatment strategies in these patients. 29
WGCNA was used to construct a gene network and eight modules were then established. The green module was significantly correlated with clinicopathological factors such as T, N, M classification and tumor stage. In addition, genes in the green module were upregulated in subgroup I following consensus clustering, which was considered to include more late-stage patients. In conclusion, overexpression of the green module might indicate a more severe cancer stage and a poor prognosis. GO and KEGG analyses were used to profile the functions of the modules, and the green module was shown to be enriched in pathways involved in tumor matrix modification and intercellular adhesion transformation.
The green module included 406 genes, of which the top 10 ranked genes were FYN, SEMA3A, AP2M1, L1CAM, NRP1, TLN1, VWF, ITGB3, ILK, ACTN1. FYN encodes a non-receptor tyrosine kinase (Fyn), which plays an important part in the genesis and progression of malignancies by adjusting morphogenic transformation, cellular motility, cell growth, and cell death.30–32 FYN is regarded as a vital oncogene in CRC and is involved in various pathways, such as AMP-activated protein kinase signaling, 33 Rho guanine nucleotide exchange factor 16 pathways, 34 and the signal transducer and activator of transcription 5/Notch2 axis. 35 In addition, Fyn is thought to be a driver of EMT, as well as promoting the metastasis of CRC.36–38 ITGB3 encodes integrin subunit beta 3 and has been reported to influence various processes of tumor development, including reprogramming tumor metabolism, maintaining tumor stemness, promoting angiogenesis, enhancing drug resistance, modifying the tumor microenvironment, and prompting EMT. 39 In CRC, reactive oxygen species-mediated upregulation of ITGB3 promoted the migration and invasion capacities of tumor cells, while its inhibition significantly relieved metastasis and improved survival in an animal model.40,41 Talin-1 (TLN1) is associated with cell adhesion and motility, making it a potential predictive biomarker for tumor metastasis and prognosis.42,43 Semaphorin-3A (SEMA3A) is a member of the semaphorin family of membrane-bound glycoproteins, 44 and has been shown to exert an important influence on the direction of axonal growth. However, its roles in immune suppression, tumorigenesis, and angiogenesis have also been identified in recent years.45–47 AP2M1 encodes adaptor-related protein complex 2 subunit mu 1, which is involved in chemotherapy resistance and senescence escape through the CDK4–EZH2–AP2M1 pathway.48,49 L1CAM, encoding L1 cell adhesion molecule, is not expressed in the normal intestinal epithelium but is expressed in the regenerated epithelium after colitis and in CRC organoids. L1CAM has been shown to be required for orthotopic carcinoma propagation, liver metastatic colonization, and chemoresistance. 50 After extravasating from the primary location, metastatic clones use L1CAM to adhere and spread on the surface of capillaries and activate the mechanotransduction-sensitive transcription factors yes-associated protein 1 and myocardin-related transcription factor, which are indispensable for metastatic outgrowth in perivascular sites.51–53 NRP1 (neuropilin-1) is a vital gene in cancer invasion, metastasis, and EMT and is upregulated in CRC,54–56 offering a novel target for treatment.57,58 VWF (von Willebrand factor) and ACTN1 (alpha-actinin-1) are associated with cancer angiogenesis and metastasis, which are risk factors for prognosis.59,60 Upregulated expression of ILK (encoding integrin-linked kinase) is found in CRC and has been reported to be related to EMT, tumor progression, and drug resistance. 61 These 10 core genes are thus mainly related to EMT and tumor metastasis, which may describe the traits of the green module.
In addition, most previous classifications of CRC have only considered the genetic status, whereas CRC comprises a group of complicated disorders requiring comprehensive analysis. We divided the tumor samples into three subgroups to consider possible individualized treatments, and combined the patients’ clinical characteristics with their genetic features. The 10 identified hub genes may serve as prognostic markers and potentially effective indicators for clinical and targeted therapy of CRC.
Our research also had several limitations. First, we only used data from public databases, and more real-world data are needed to confirm the results. Second, more specific models are needed to identify the different pathological and molecular subtypes of CRC, which will be addressed in our further studies. Finally, more studies are needed to validate the functions of the 10 genes identified in the current study.
Conclusion
We identified 10 hub genes (FYN, SEMA3A, AP2M1, L1CAM, NRP1, TLN1, VWF, ITGB3, ILK, ACTN1) as prognostic CRC markers and potentially effective indicators for the clinical and targeted therapy of CRC.
Footnotes
Acknowledgements
The author would like to thank the associate editor and reviewers for their useful feedback, which has improved this paper.
Data availability statement
Declaration of conflicting interests
The author declares that they have no conflicts of interest related to this work.
Funding
The author received no financial support for the research, authorship, and/or publication of this article.